Friday October 24th
.
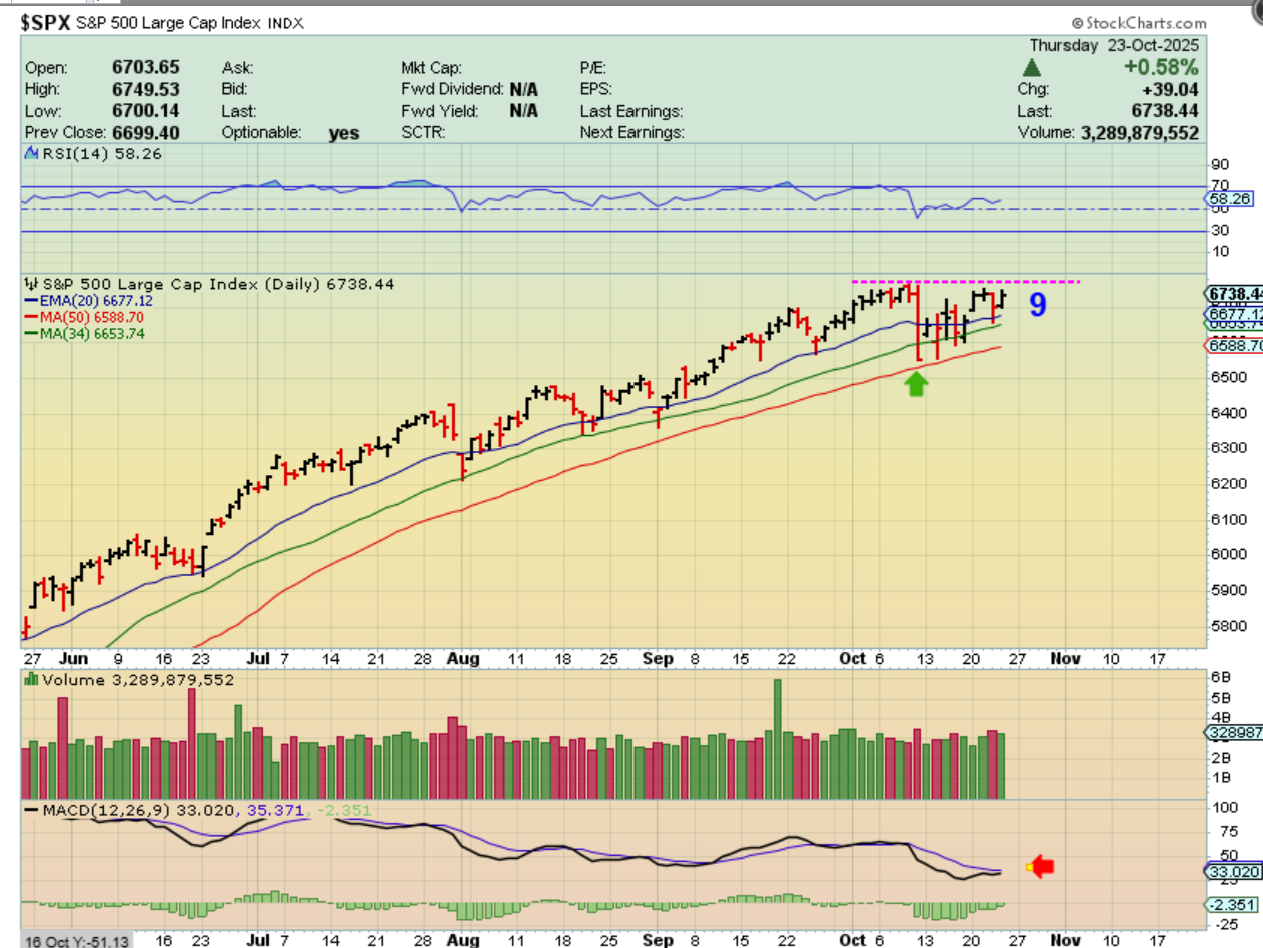
SPX – Day 9 saw the markets run back toward the all-time highs. The MACD has divergence, but that alone is not a sell signal, since it can correct itself with chop over time. We have to see how this plays out going into the Fed Wednesday next week, and I have discussed the possible scenarios. I will cover it again in the weekend report and next week.
.
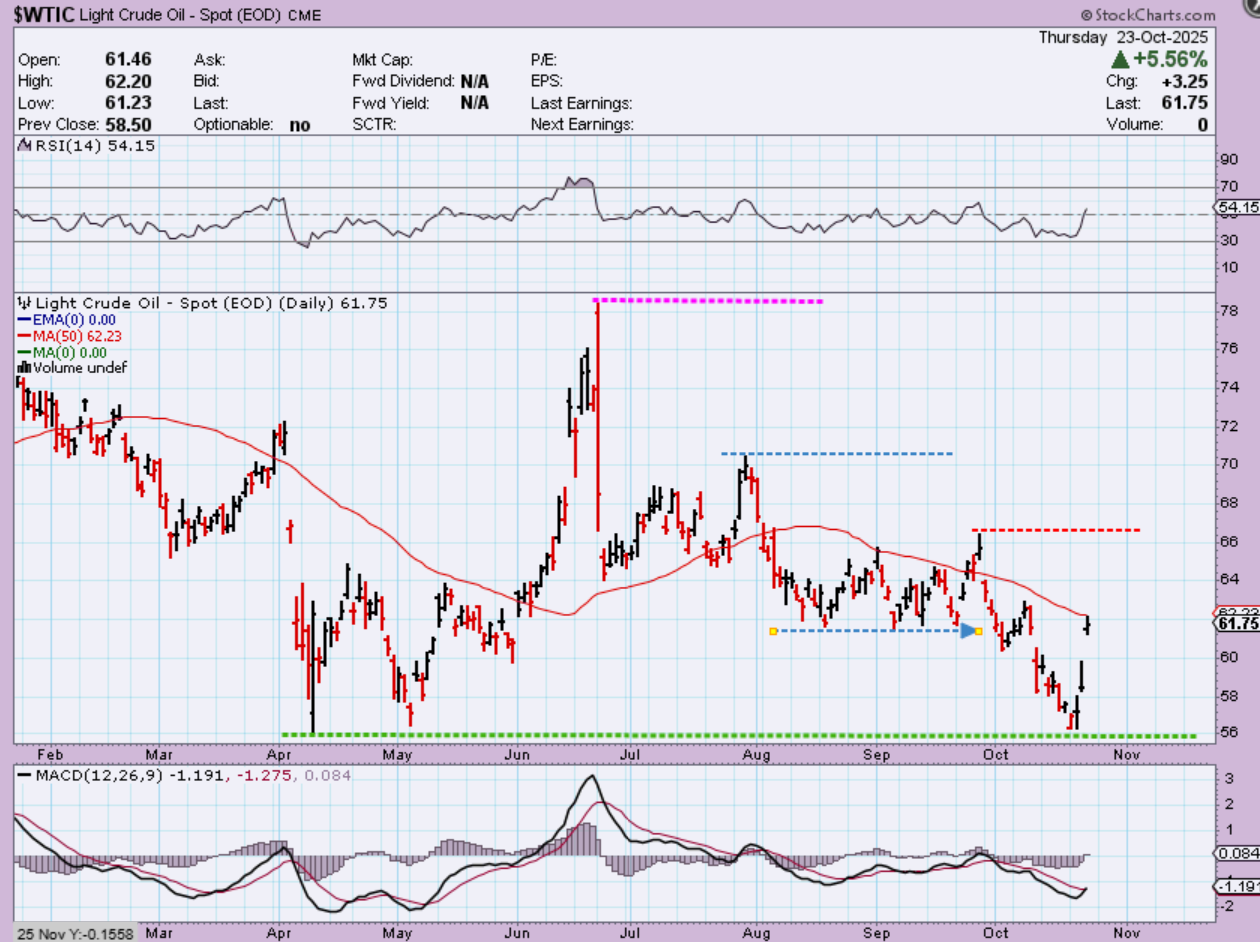
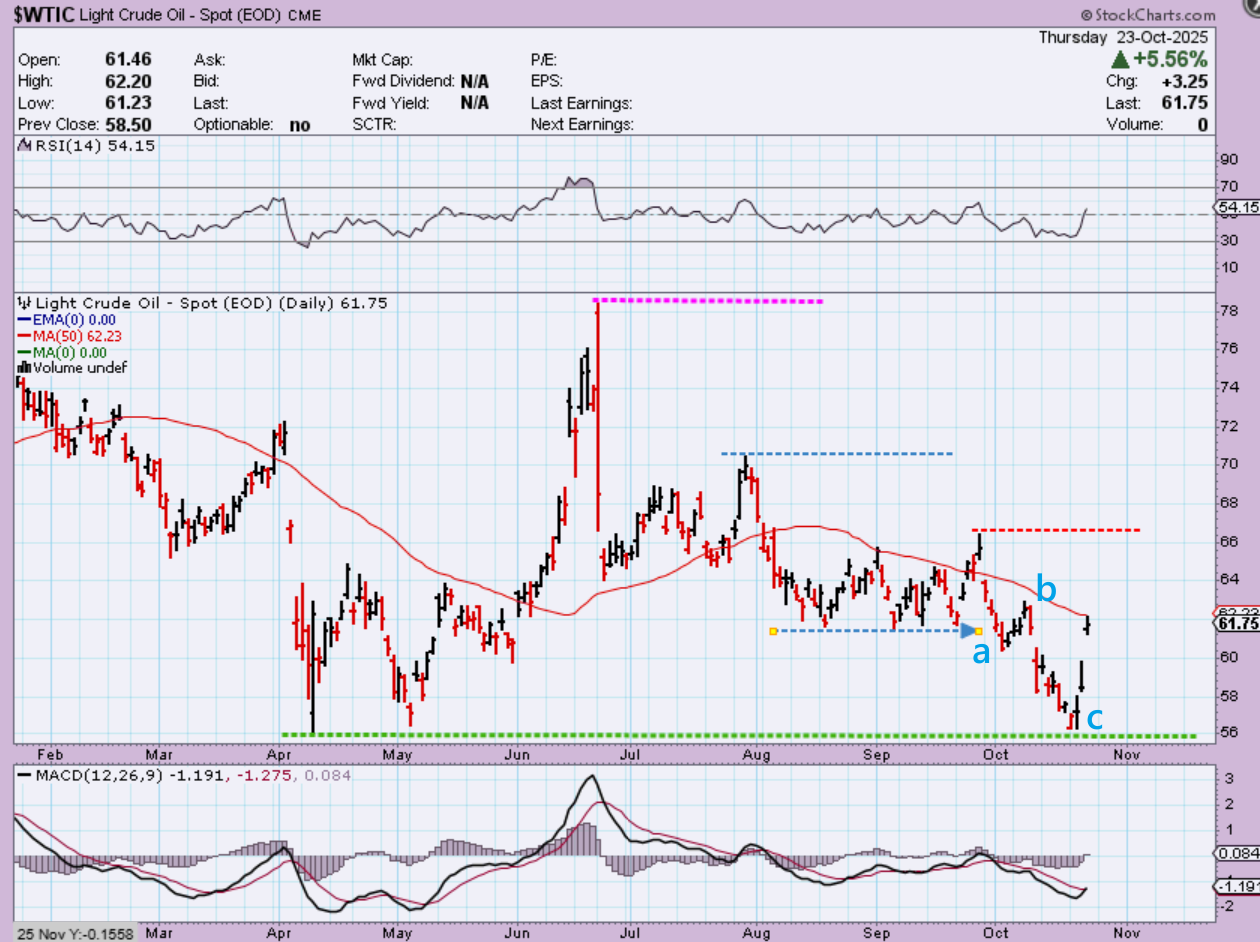
WTIC is suddenly running strong out of a low, so we definitely have a dcl, but
.
As mentioned in past reports- it could be an a-b-c down into an ICL. We have resistance right here and over time we’ll watch to see if this can make a higher high.
.
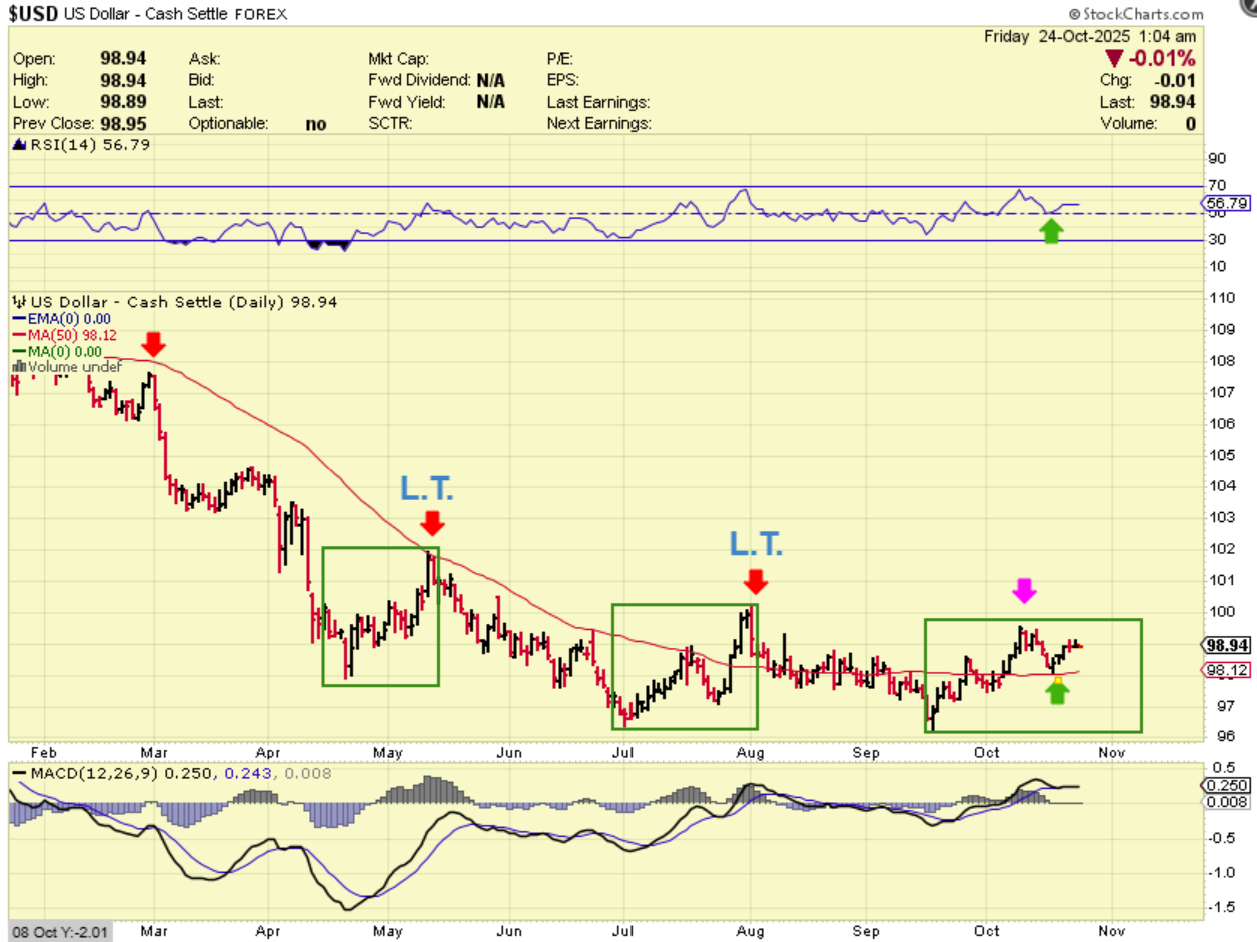
USD – So far, the USD is playing out as expected with this bounce, and I’m still waiting to see if our ‘peak’ is L.T. and a lower high or not. The ‘peak’ is possibly already in place too. Note: If this rolls over and breaks the lows, it would seem that Gold could continue the blow off top rally, but a rate cut MIGHT help the USD to strengthen next week.
.
I ALWAYS THINK OF THIS CHART FIRST:
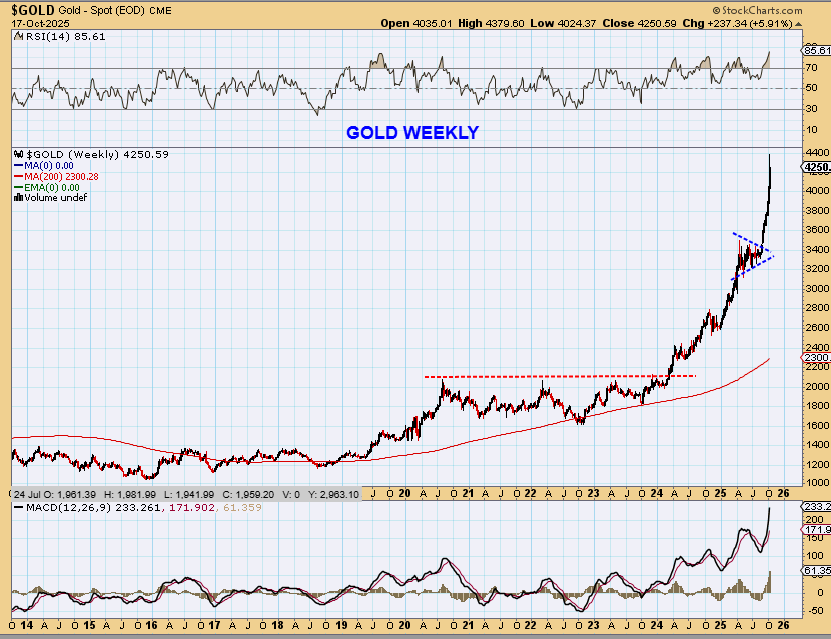
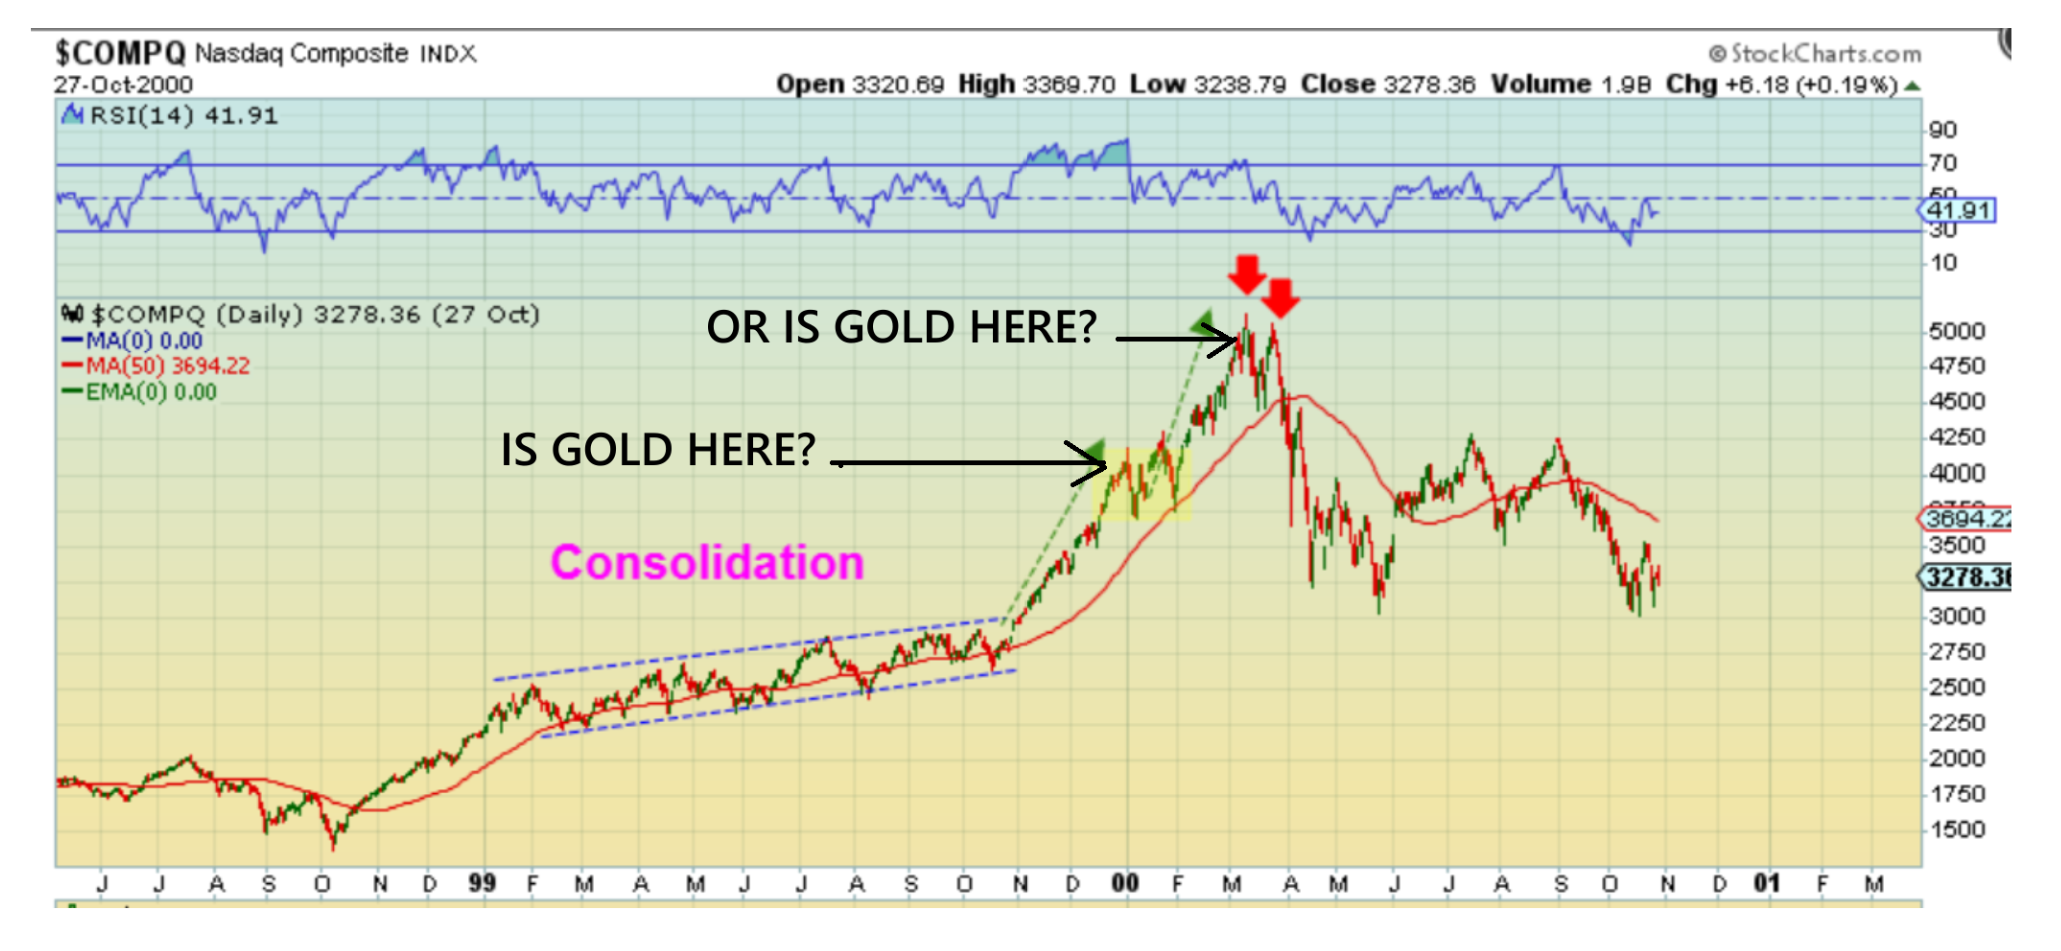
Please keep in mind that as I go over this sector, the think that the daily charts look fine. Currently we are seeing a pullback, HOWEVER the Big Picture really looks like this. I HAVE to keep that in mind, because it is parabolic. Are we at a top yet? Right now it is hard to just call a top, so let’s just discuss what we have.
.
GOLD : You see what I mean? The daily charts look fine, but they did with the Nasdaq 2000 top too. So…
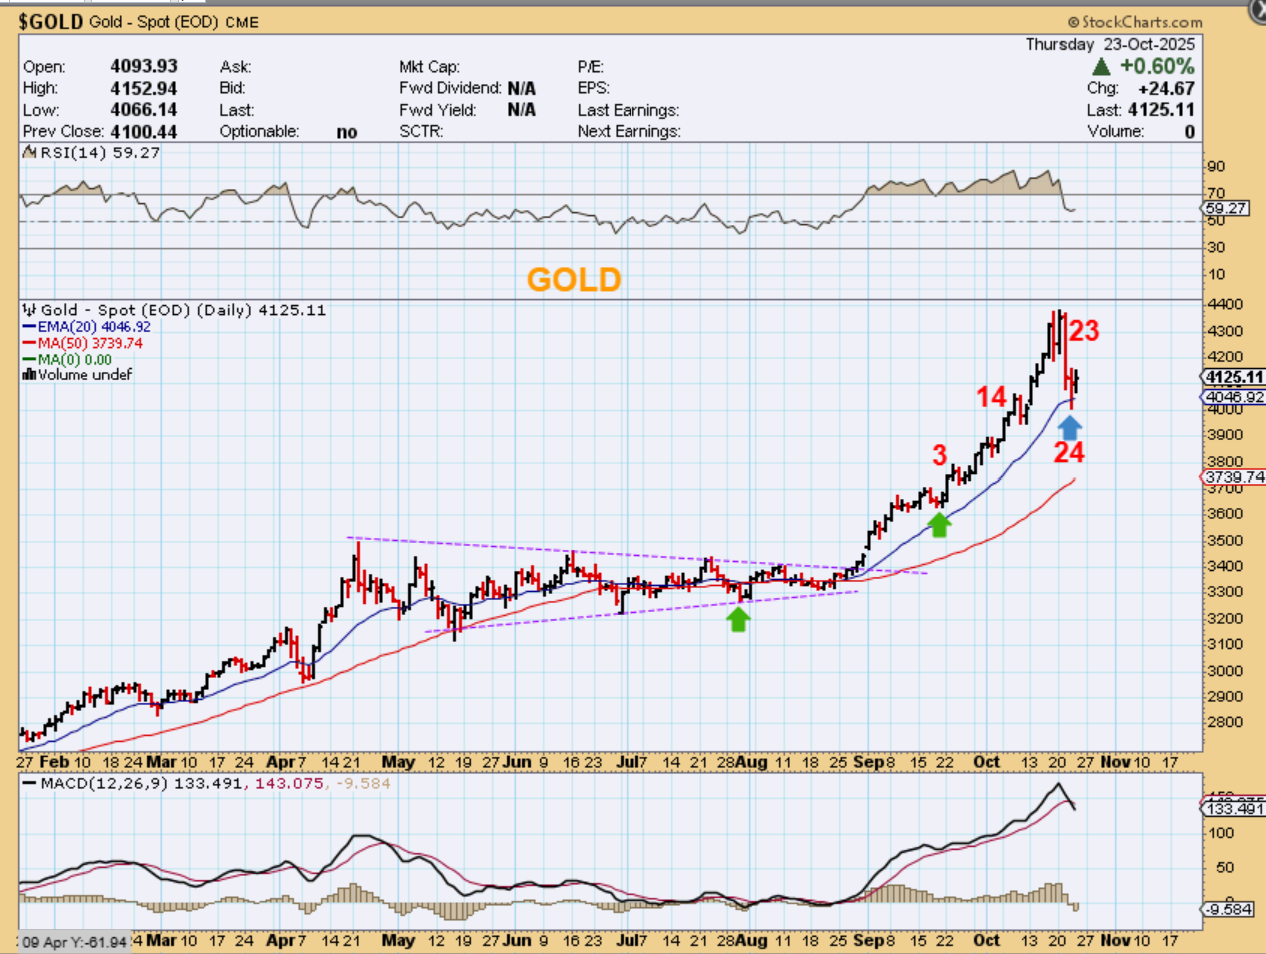
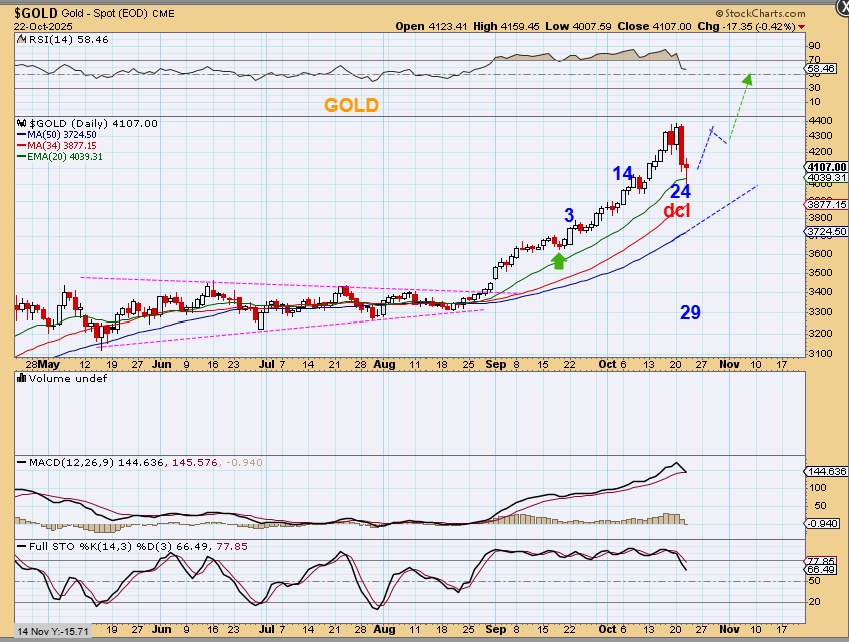
Gold was due for a dcl, and it dropped sharply, didn’t it? We have a day 24 low at this point, and in some of these daily cycles, we have seen short 25 day daily cycles (rather than our normal 32ish day daily cycles). We have now bounced at the 20 ema. IS THIS A DAY 24 DCL?. It may be…
.
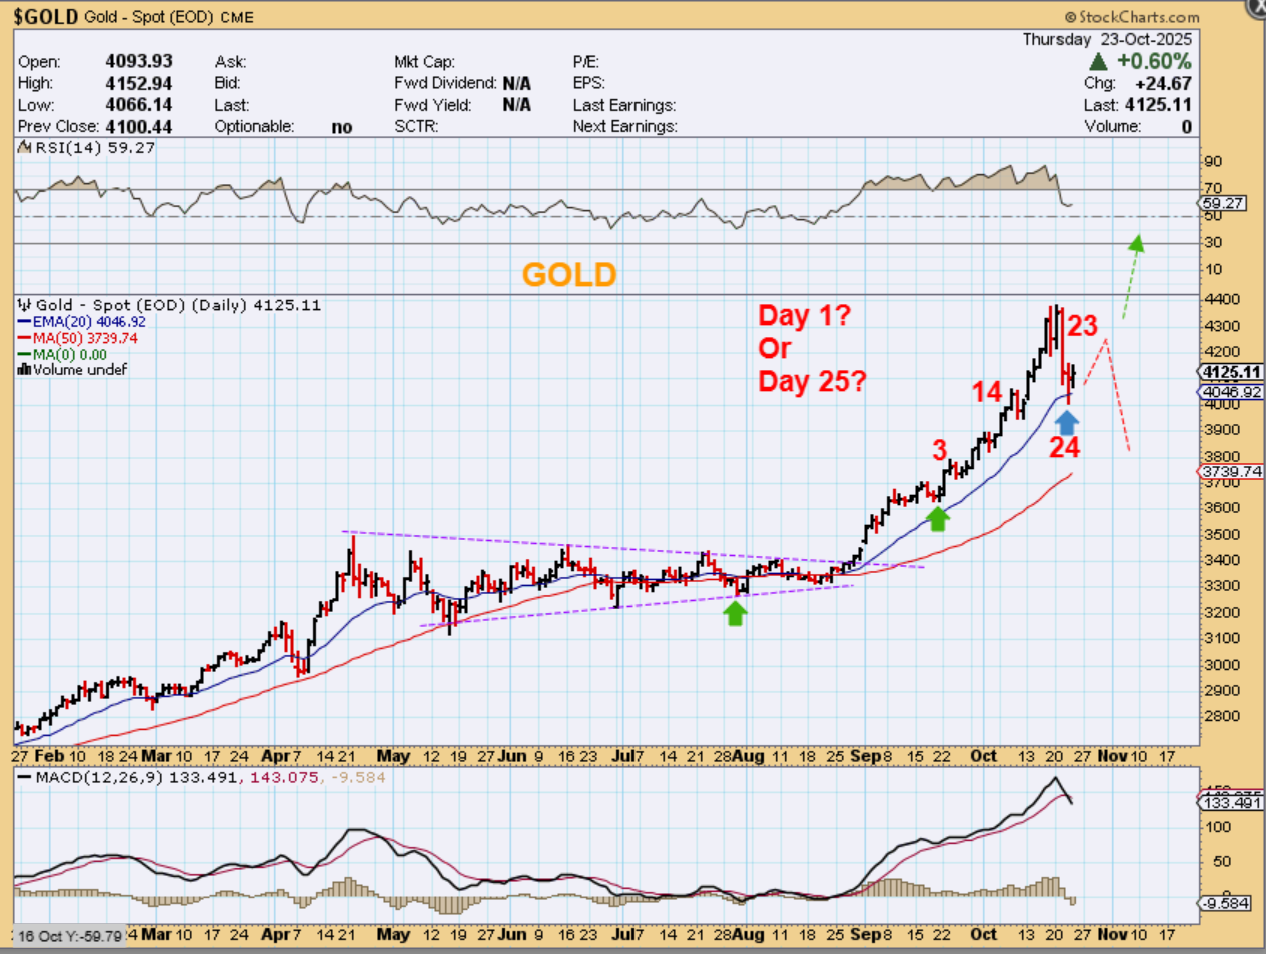
GOLD – IS THIS A DCL? That cannot be confirmed yet, but I have mentioned that You could buy it with a stop, as long as you know that we have a Fed Mtg next week and this COULD still drop into the Fed next week. I have drawn
1. A red path to a lower low from here, since we do have a MACD cross, or
2. Up, Up, and Away from here, maybe with a little choppiness until that the fed mtg.
3. Is this day 1 after a dcl? Or is this day 25 bounce and then down into an ICL?
.
YESTERDAY I DREW THIS:
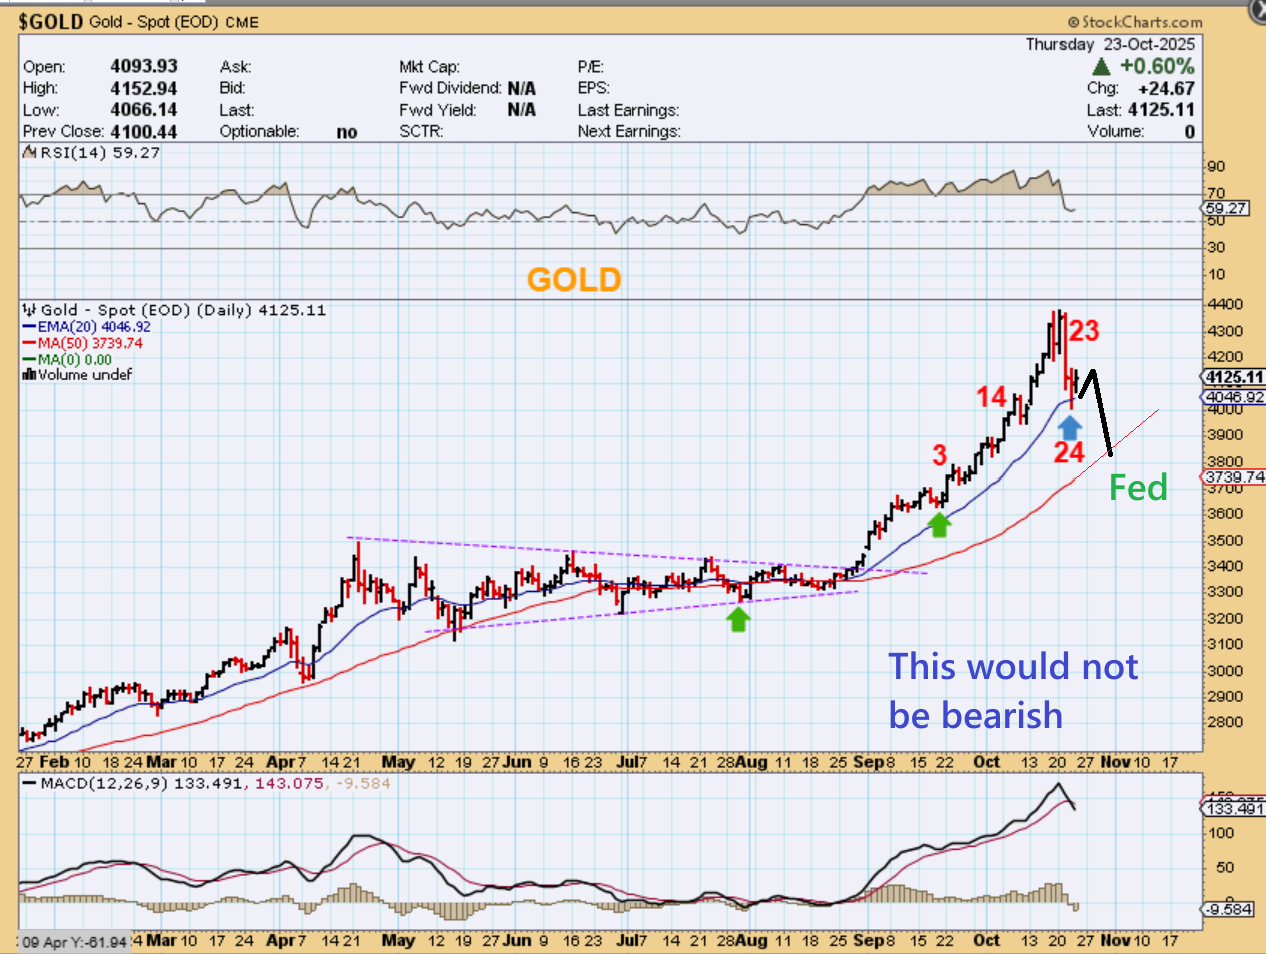
GOLD – If Gold is at that midpoint area, then we could see Gold put in a dcl here and rally higher to $5000 plus. It is really hard to buy before the next fed mtg, due to volatility, but I know that many are ‘Buy and Hold’, so maybe the worst is over for your positions.
.
To Be Clear:
A drop into the Fed Mtg for GOLD would not be bearish. We would likely get a dcl at day 30 or so
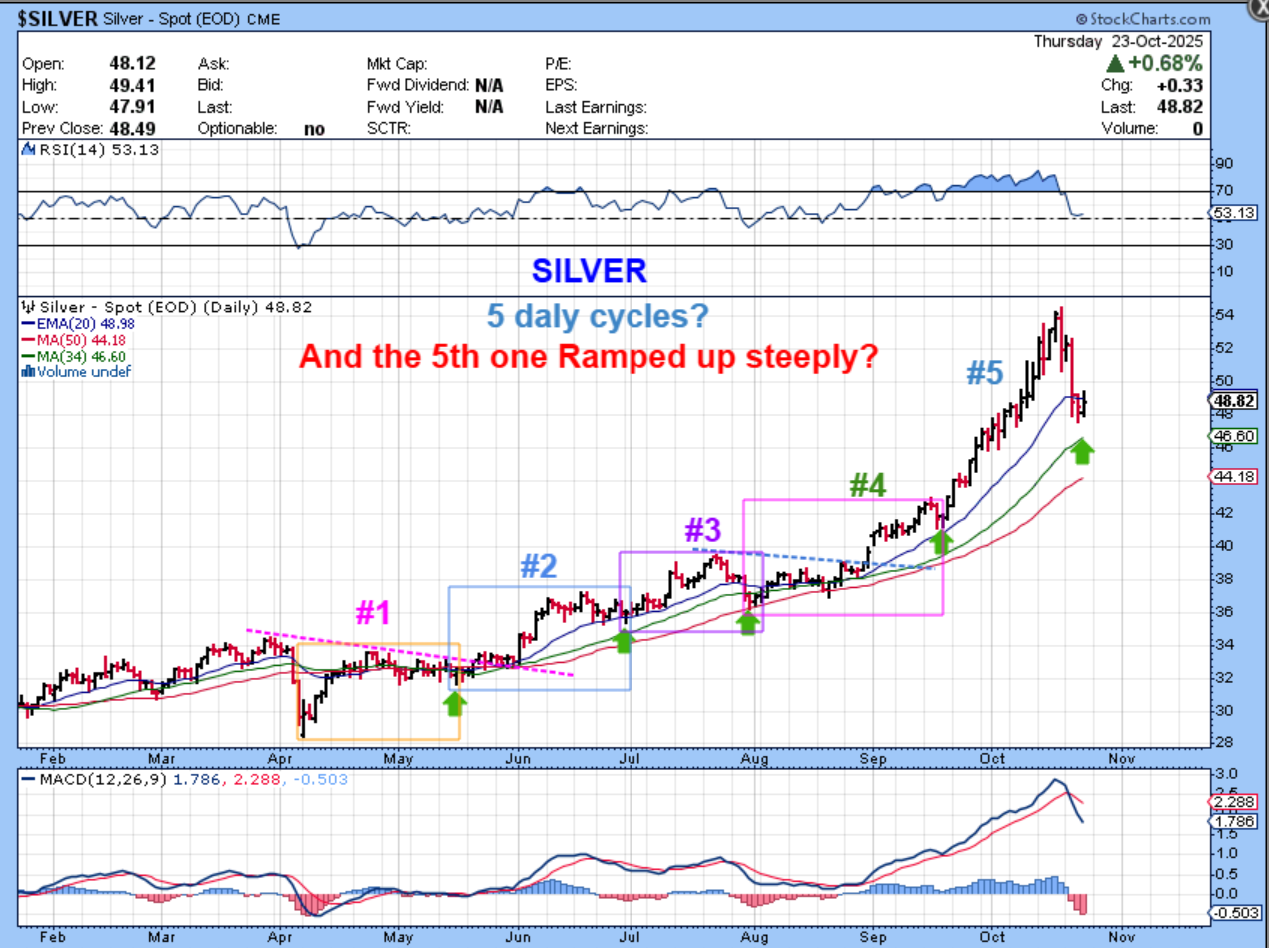
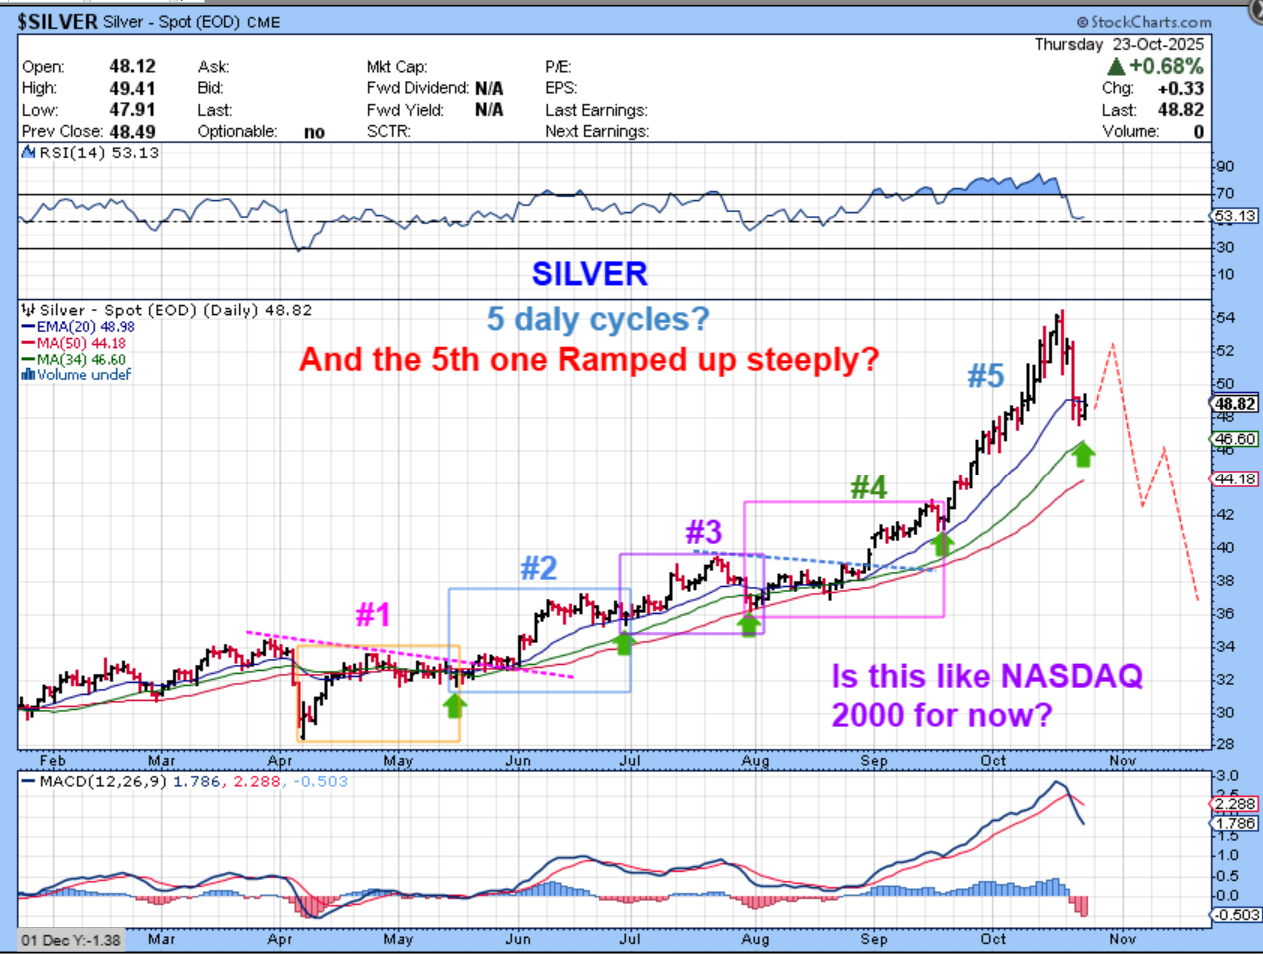
.SILVER – It has been interesting to watch Silvers daily cycles get stronger and stronger overtime, but if this is a parabolic ramp up, that’s what happens when buyers overwhelm sellers. The question now is: Do we still have strong buyers to keep overwhelming the sellers? I feel like we could have more buying left here.
.
I hate to show this chart right here again, but it is helpful to keep it in mind.
Are we at the midpoint peak? Or at the peak and a double top developed? The NASDAQ did NOT look parabolic close up. We don’t want to let it scare us from a trade, but we need stops. I honestly think that Silver looks similar to the first peak-the midpoint peak. NOTICE THAT NASDAQ had a choppy upward slant and then a steeper run to the midpoint.
.
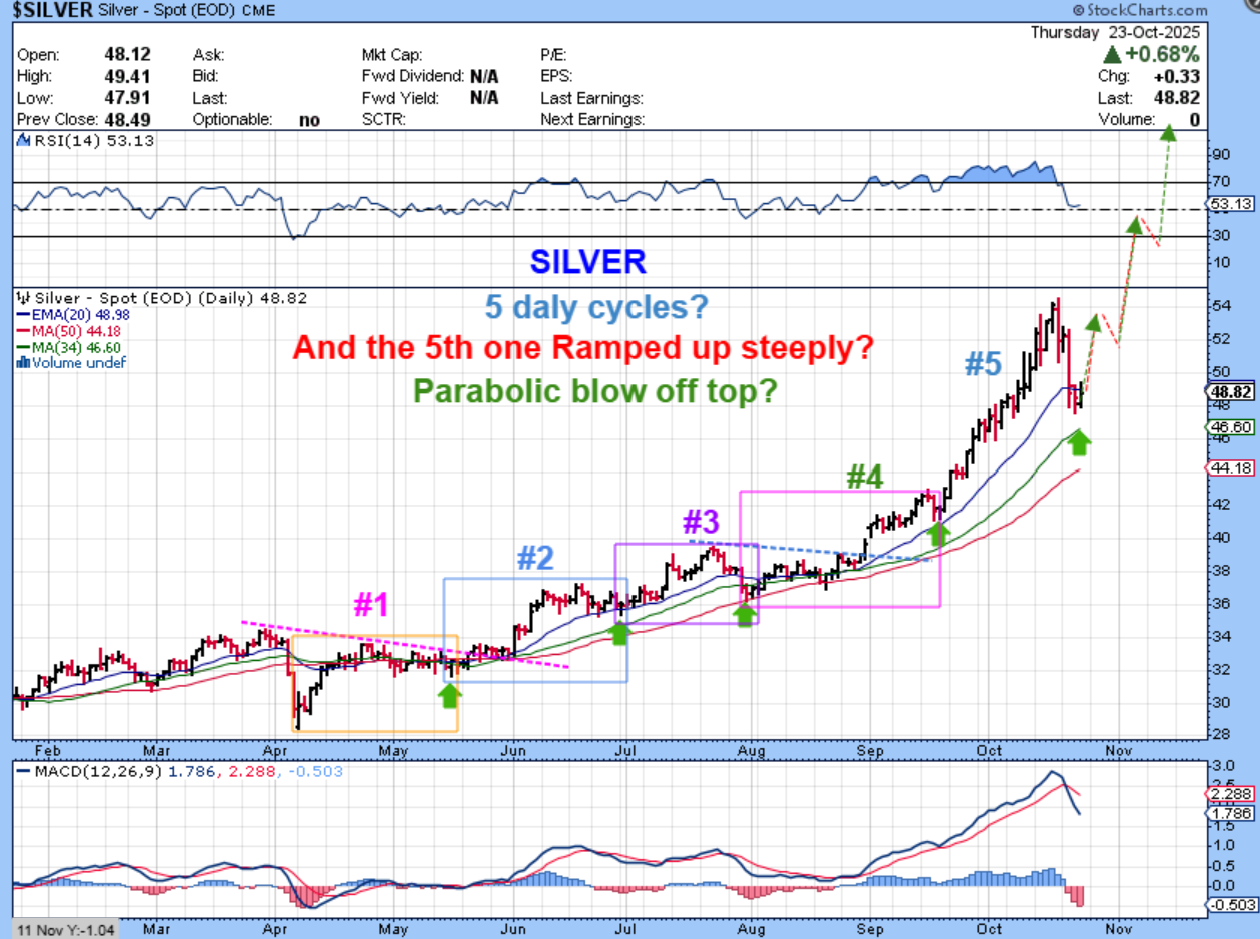
SILVER has a choppy upward slant and then a steeper run to the midpoint. I have drawn in a drop here just to show what that could look like, since the MACD has crossed lower, but…
.
SILVER could chop around into the fed mtg and then take off higher similar to the NASDAQ 2000 ramp up.
.
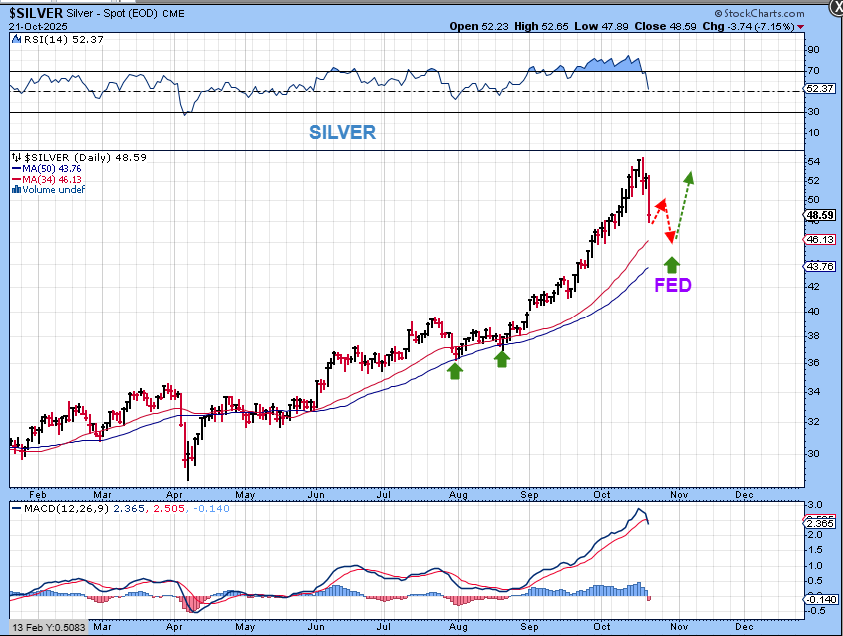
Yesterday I drew this chart from Oct 21:Silver dropped for 1 more day at day 25 Wednesday.
If Silver bounces and drops into the Fed next week, it could bottom around day 30. This could be a perfect set up, with the read dcl at day 30 / Fed Day, if it happens.
.
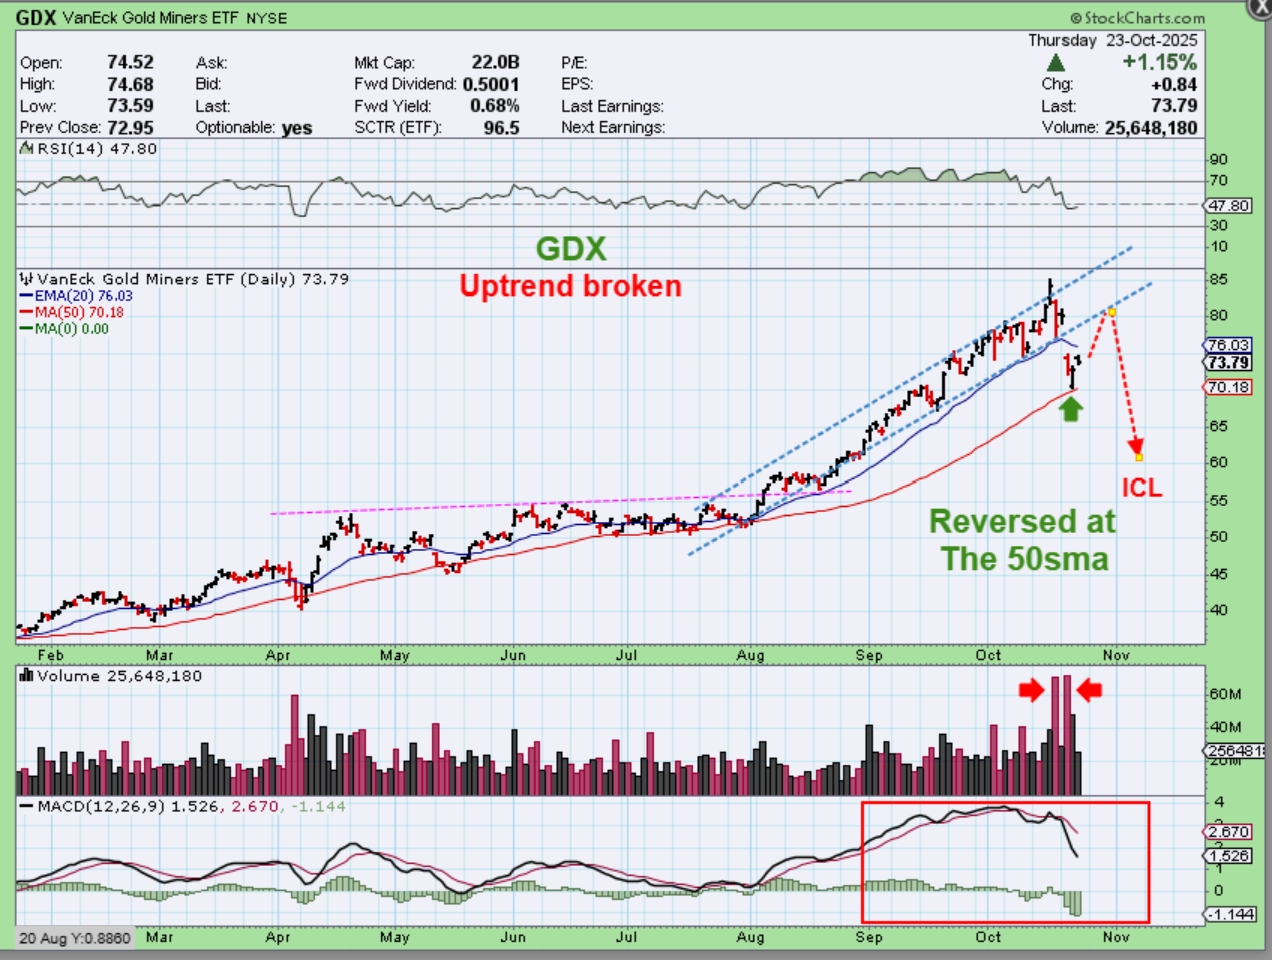
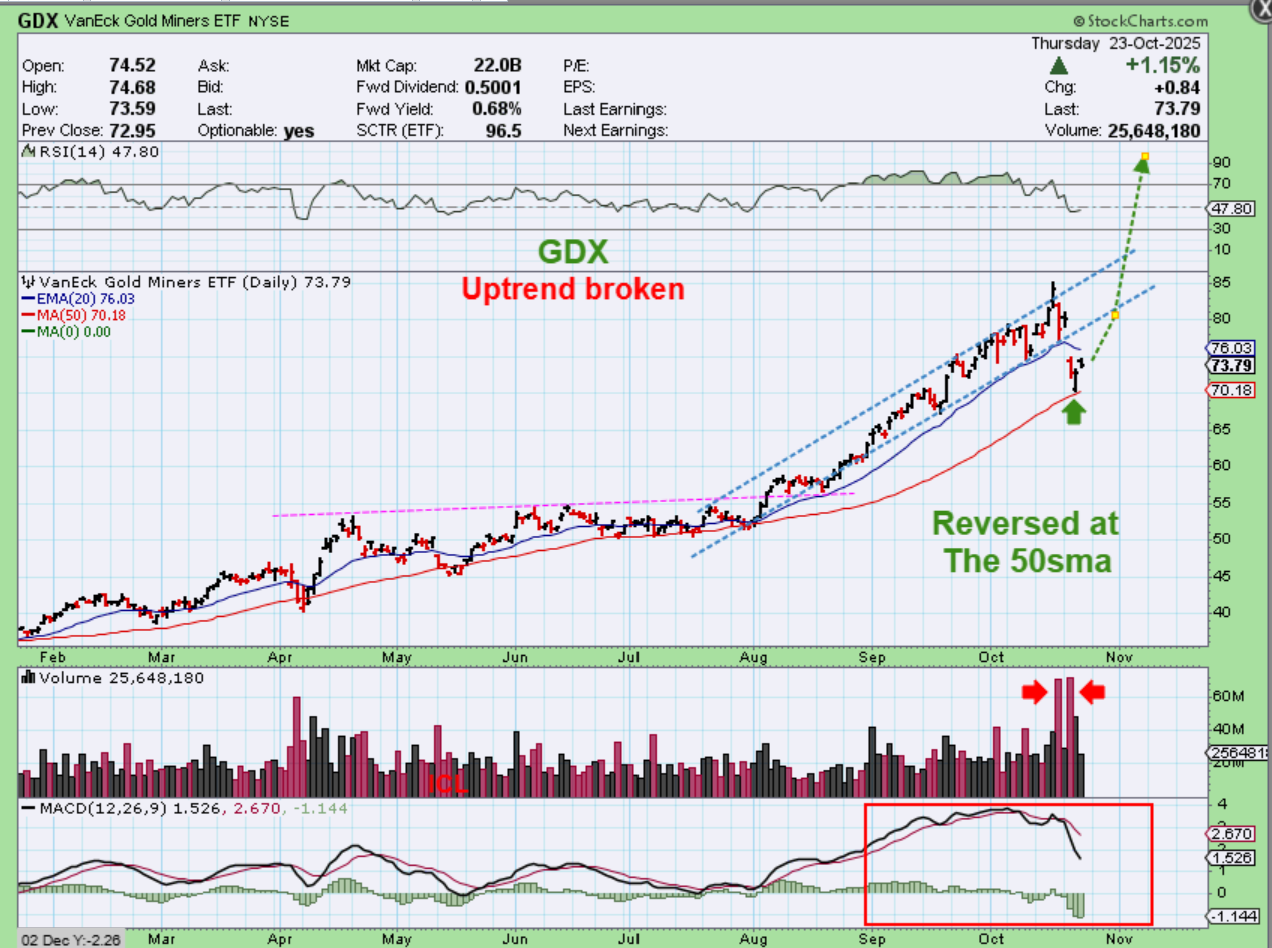
GDX – I want to start by saying that I don’t see a reason for Miners to become suddenly weak, but if this can’t get back into the upward channel, price usually has to ‘consolidate’ before trying again, so I drew it like that.
.
GDX – This would be a continuation of the parabola.
.
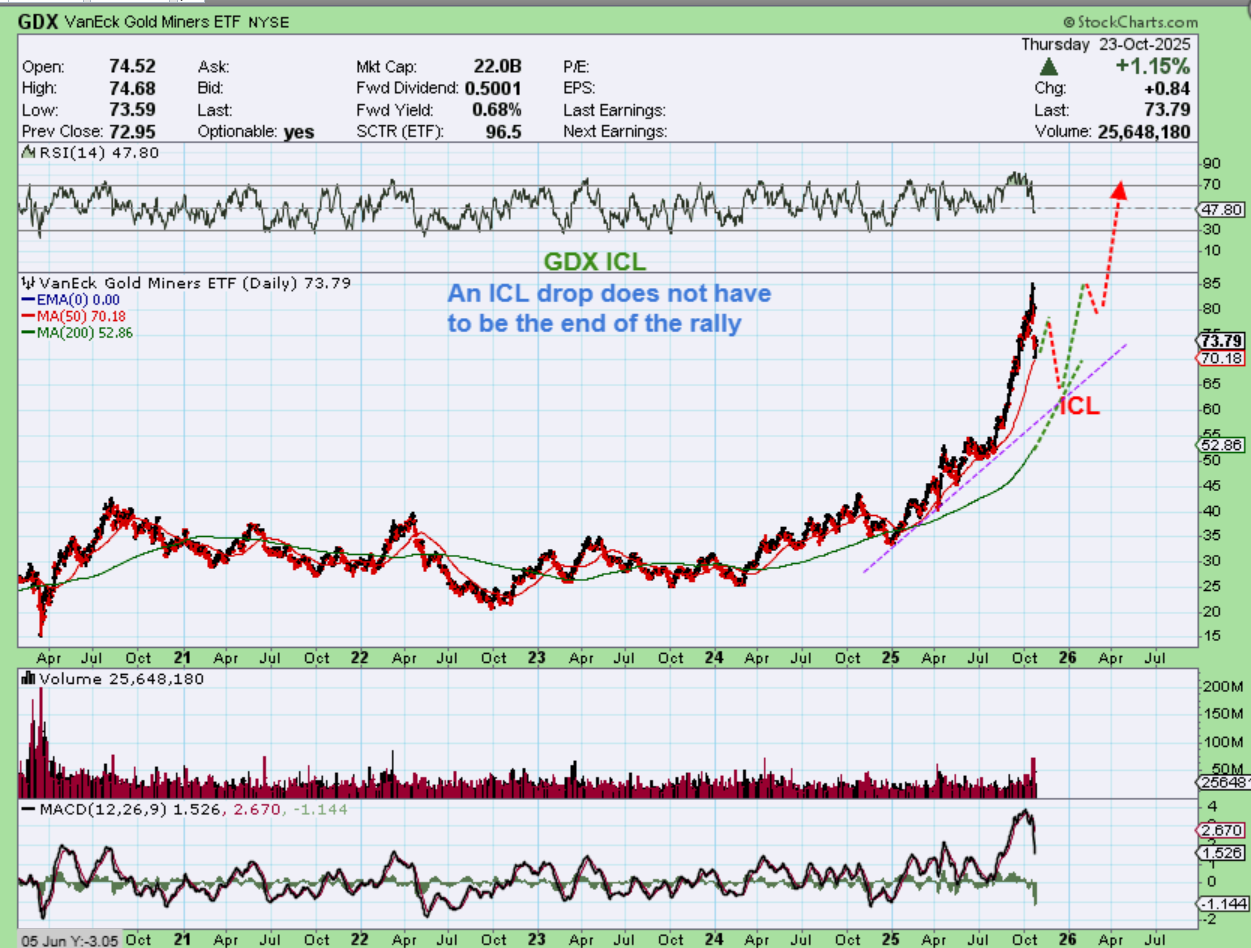
GDX – Even if Gold, Silver, and the Miners drop into a deeper ICL, that does not have to be the end of the run. The Nasdaq had that midpoint ‘pause’ where it got choppy, and we could see that here and then a continuation higher. Here I have drawn an ICL drop and then a continuation.
.
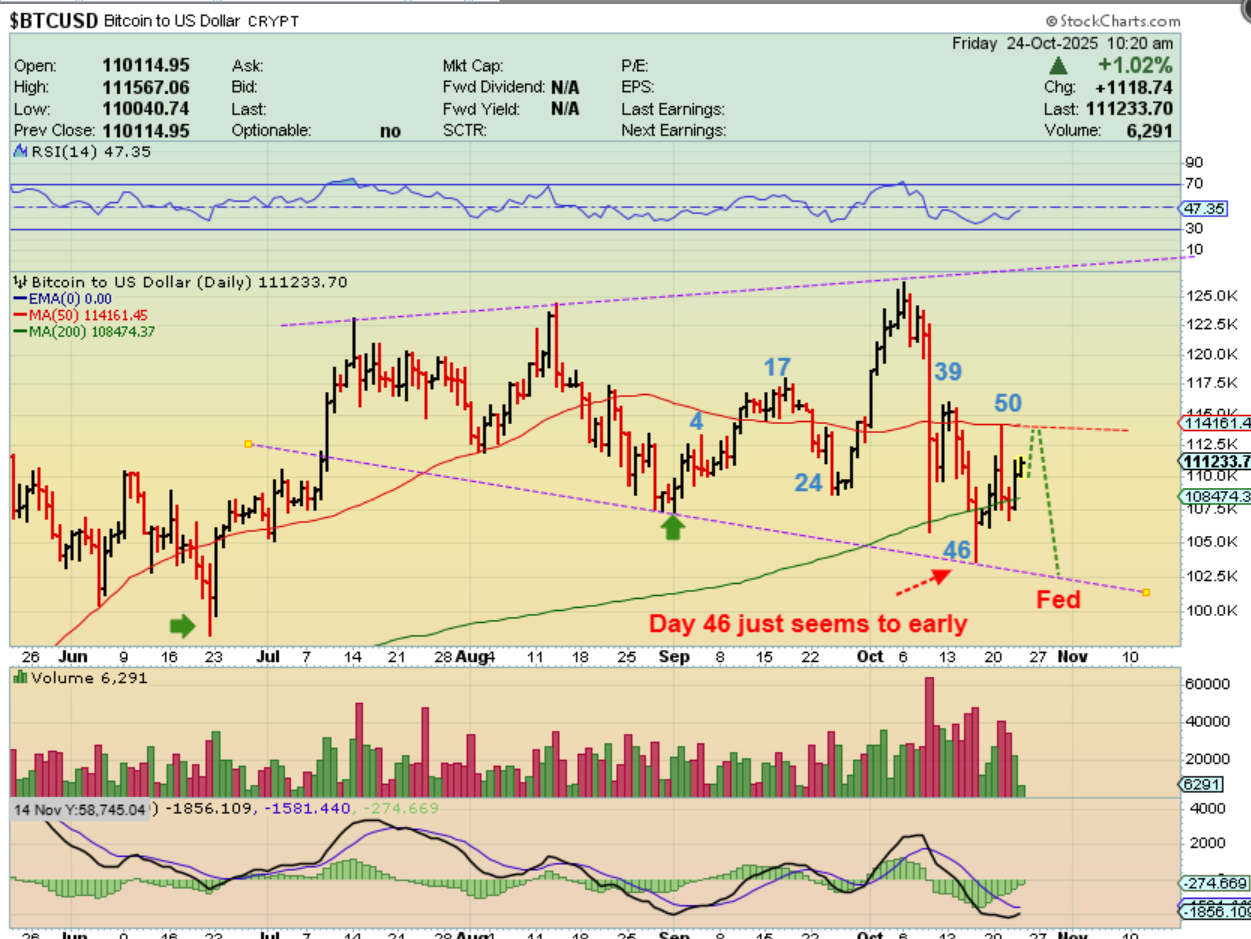
Today is Friday and we are seeing a bounce or an early move out of a dcl with the General Markets and possibly Precious Metals. I still think that the bounce with Bitcoin is too early to be a dcl though, so I’ll cover that below again. Enjoy your Friday trading!
.
~ALEX
.
Bitcoin – The current low at Day 46 seems too early for a low, so I have to expect a drop next week heading into the Fed Mtg. I thought that we would bounce to the 50sma and then drop again. This would actually be a great set up if you ask me. The bullhorn would take price up past the all-time highs. Crypto stocks did shoot up higher overnight (IREN, CIFR, BITF, etc), but I’m hoping for another dip next week to enter before the Fed Mtg. 🙂