Wednesday October 15th – Still Floating Higher
.
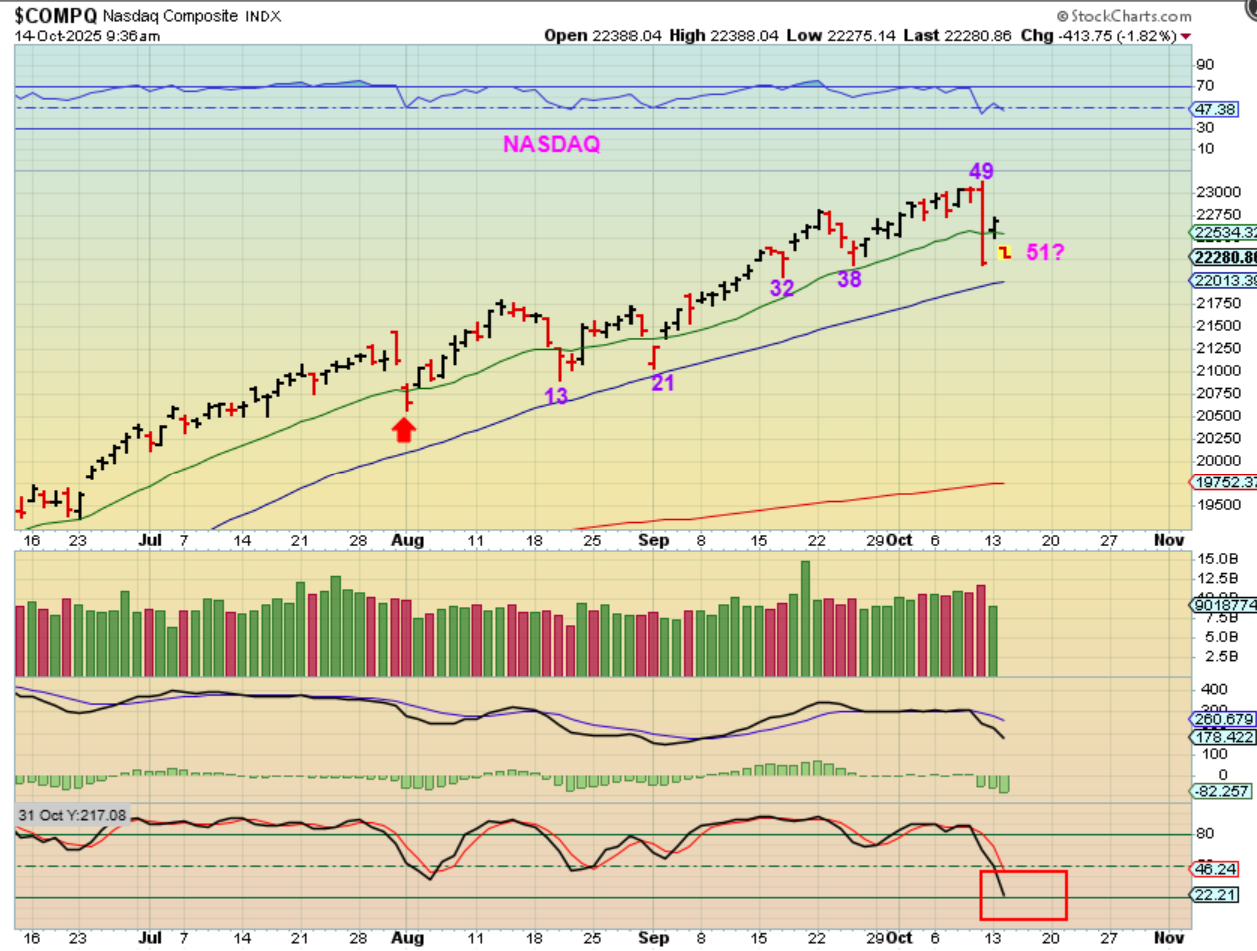
NASDAQ 9:36 a.m. – Friday was the slam down. Monday gapped higher and looked like maybe we had a day 49 low, but a dcl would take time to reveal itself. Tuesday saw a big gap down lower and more selling after that threatened the day 49 lows. This looked like maybe we were at day 51, and it would be if day 49 lows were taken out.
.
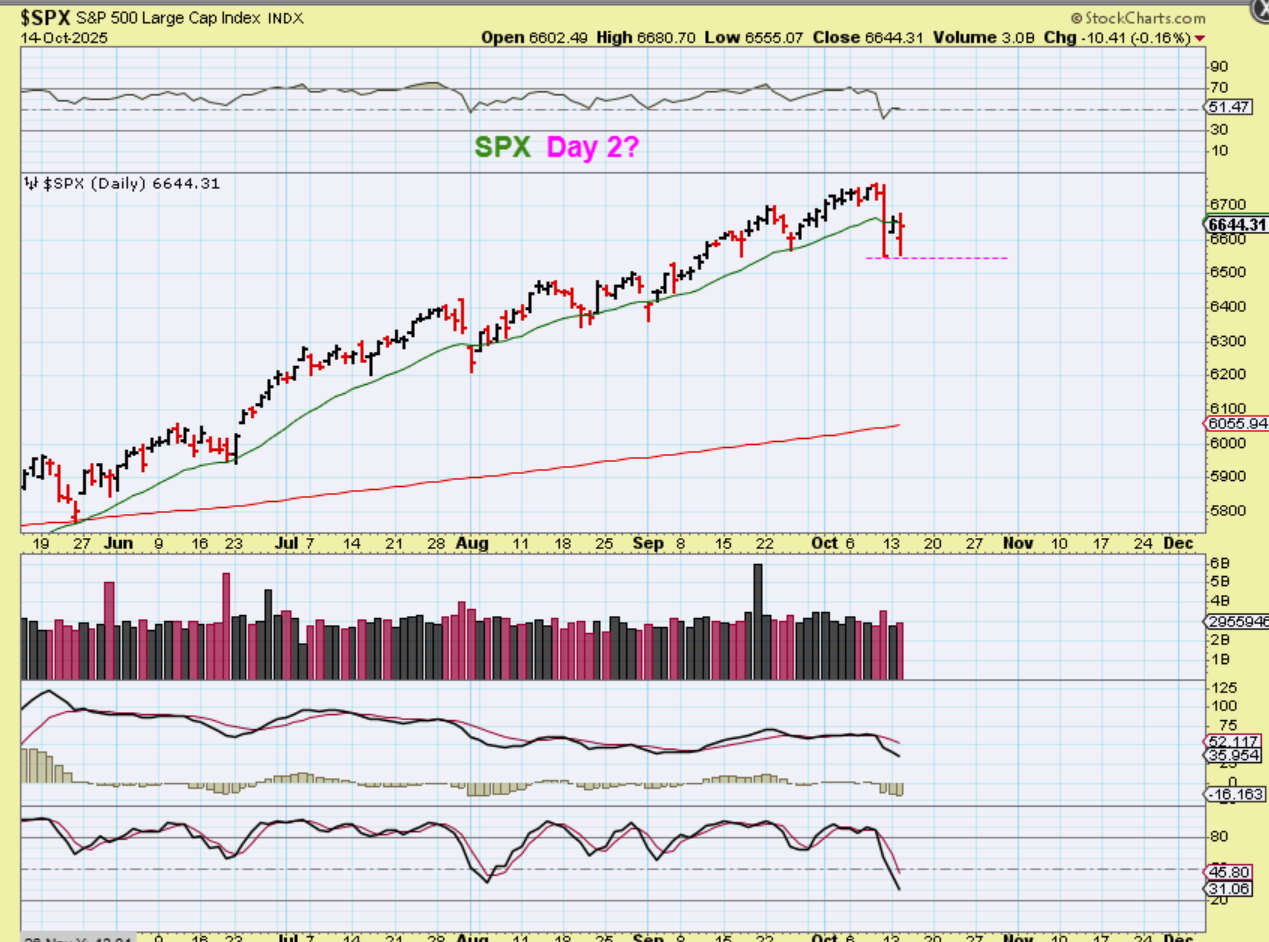
SPX – Suddenly buyers started to step in, and maybe some short covering and we saw the markets rally higher without breaking that day 49 low. THAT means that this may be day 2 of a new daily cycle. After the opening drop, many stocks gapped down and many once again made gains of 10-20%.
.
I’m looking back again at intermediate cycles. They are most often 6 months long, but can be 5 or 7, and they can be very rarely 4 or 8 months. That is very rare though.
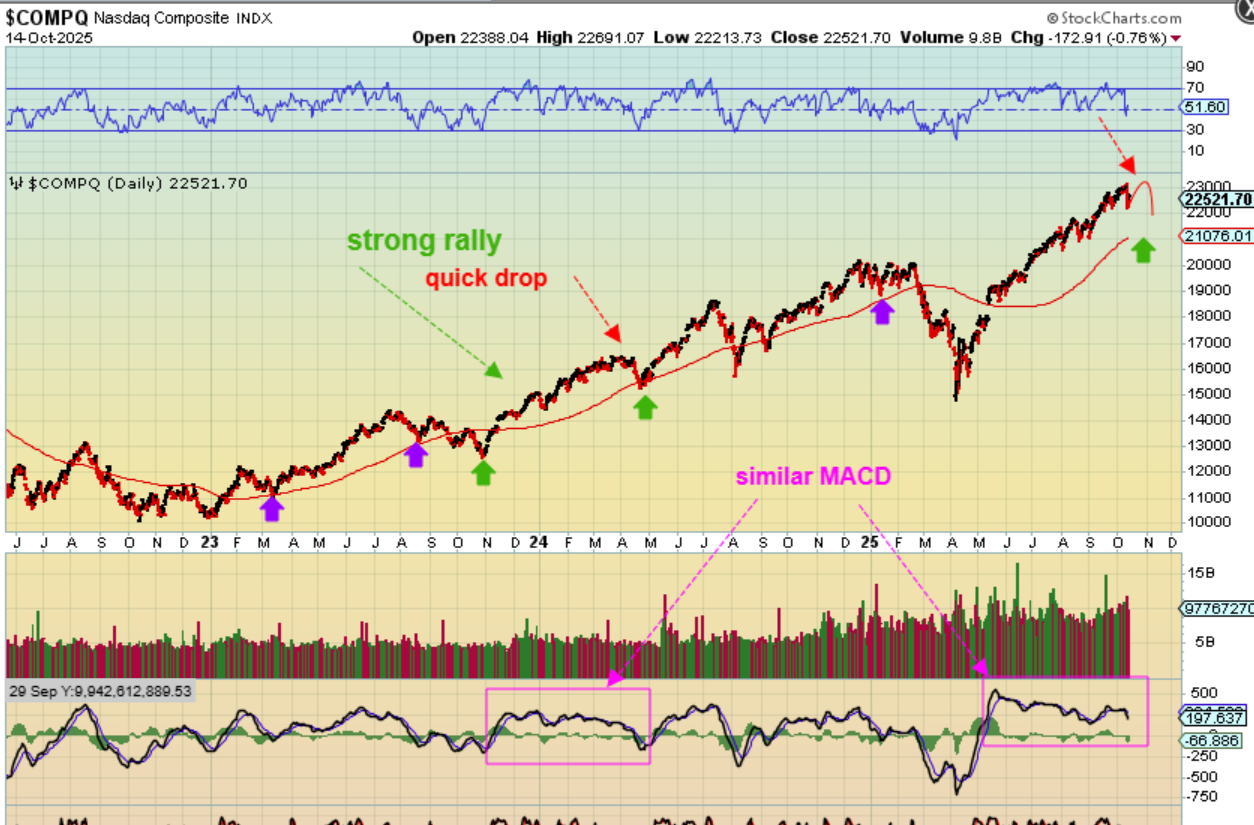
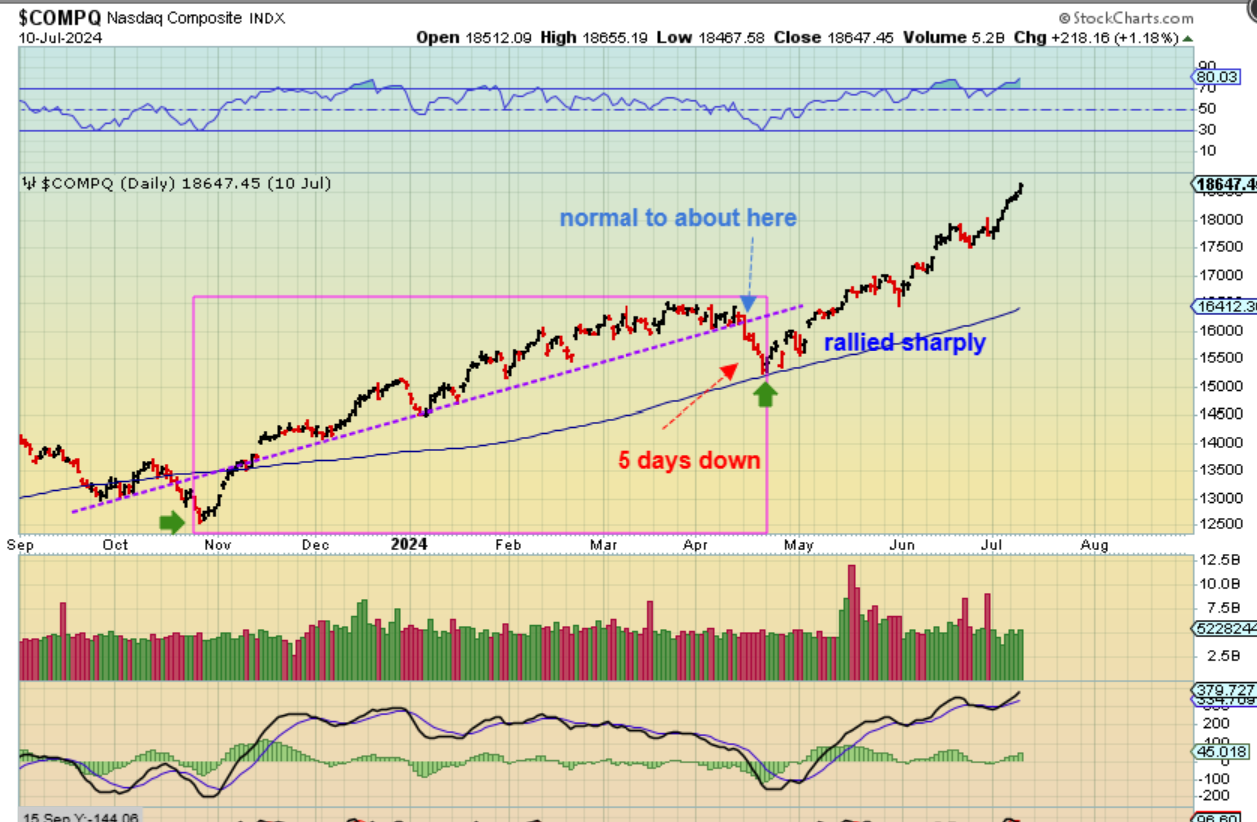
THE NASDAQ rally out of late october 2023 was pretty strong, just like our current rally. It ran from late October 2023 to late April 2024, and that is 6 months, but what I noticed was the ICL drop in April 2024. That was just a sharp nosedive, and this makes me wonder again, WILL WE JUST START A SELL OFF INTO THE FED MEETING and then be at our ICL? LET’s ZOOM IN ON THIS…
.
LET’s ZOOM IN ON THAT OCT 2023 – APRIL 2024. It was a 6 month rally and then a 5 day drop into the low. We are 12 days away from the Fed, so could we just chop and then drop sharply for 5 days into the fed and then rally out of that as an ICL. Well, its just another idea showing that anything could happen when you get to 6 or 7 months of an Intermediate cycle.
.
AND THEN I FOUND THIS!
.
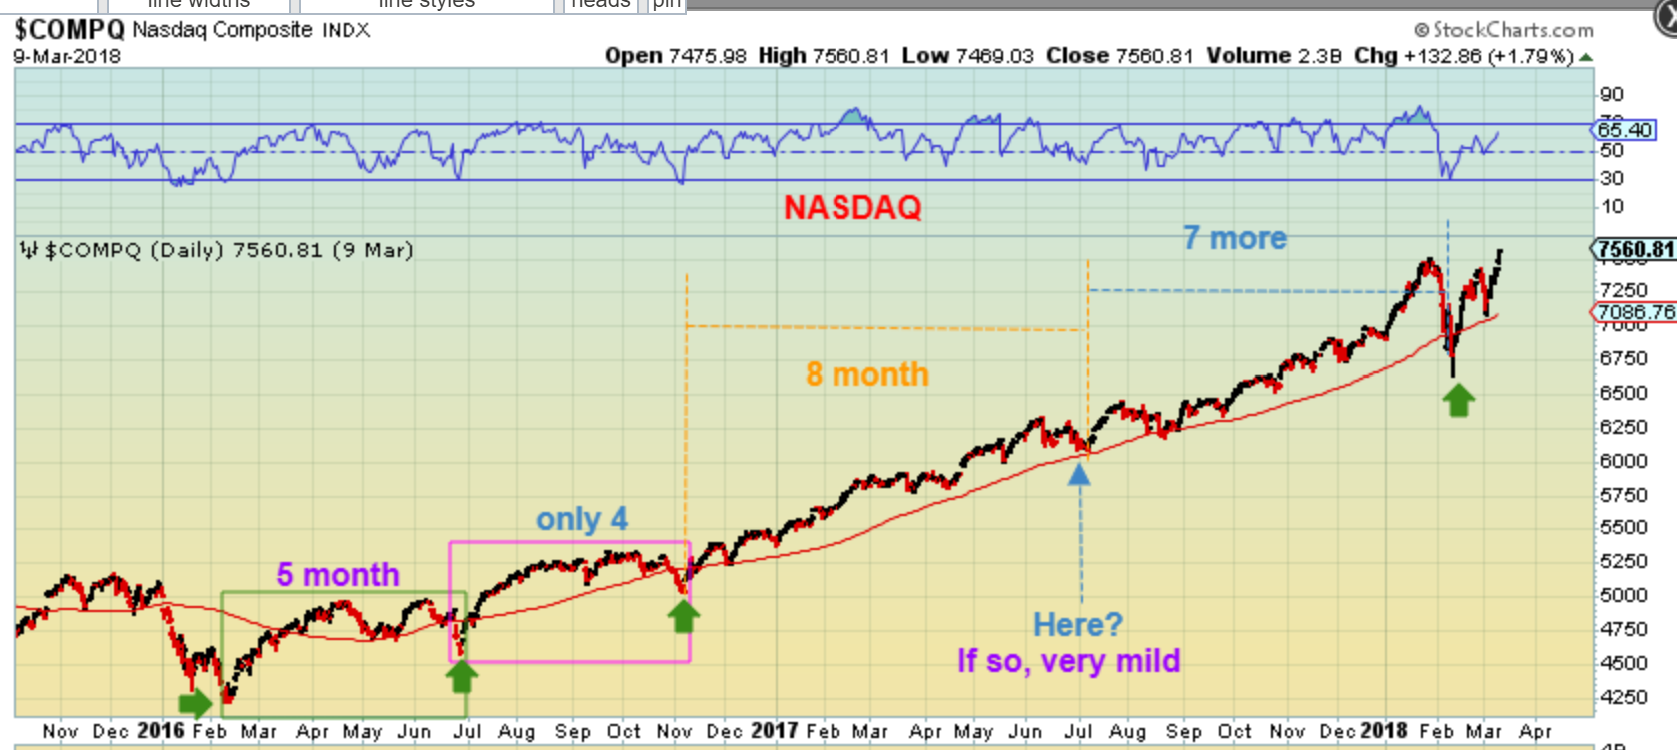
NASDAQ – At first glance, I didn’t really think that the 8 month box was an ICL at July 2017, so it looked like a 15-month rally from Nov 2016 to Feb 2018 without an ICL.
.
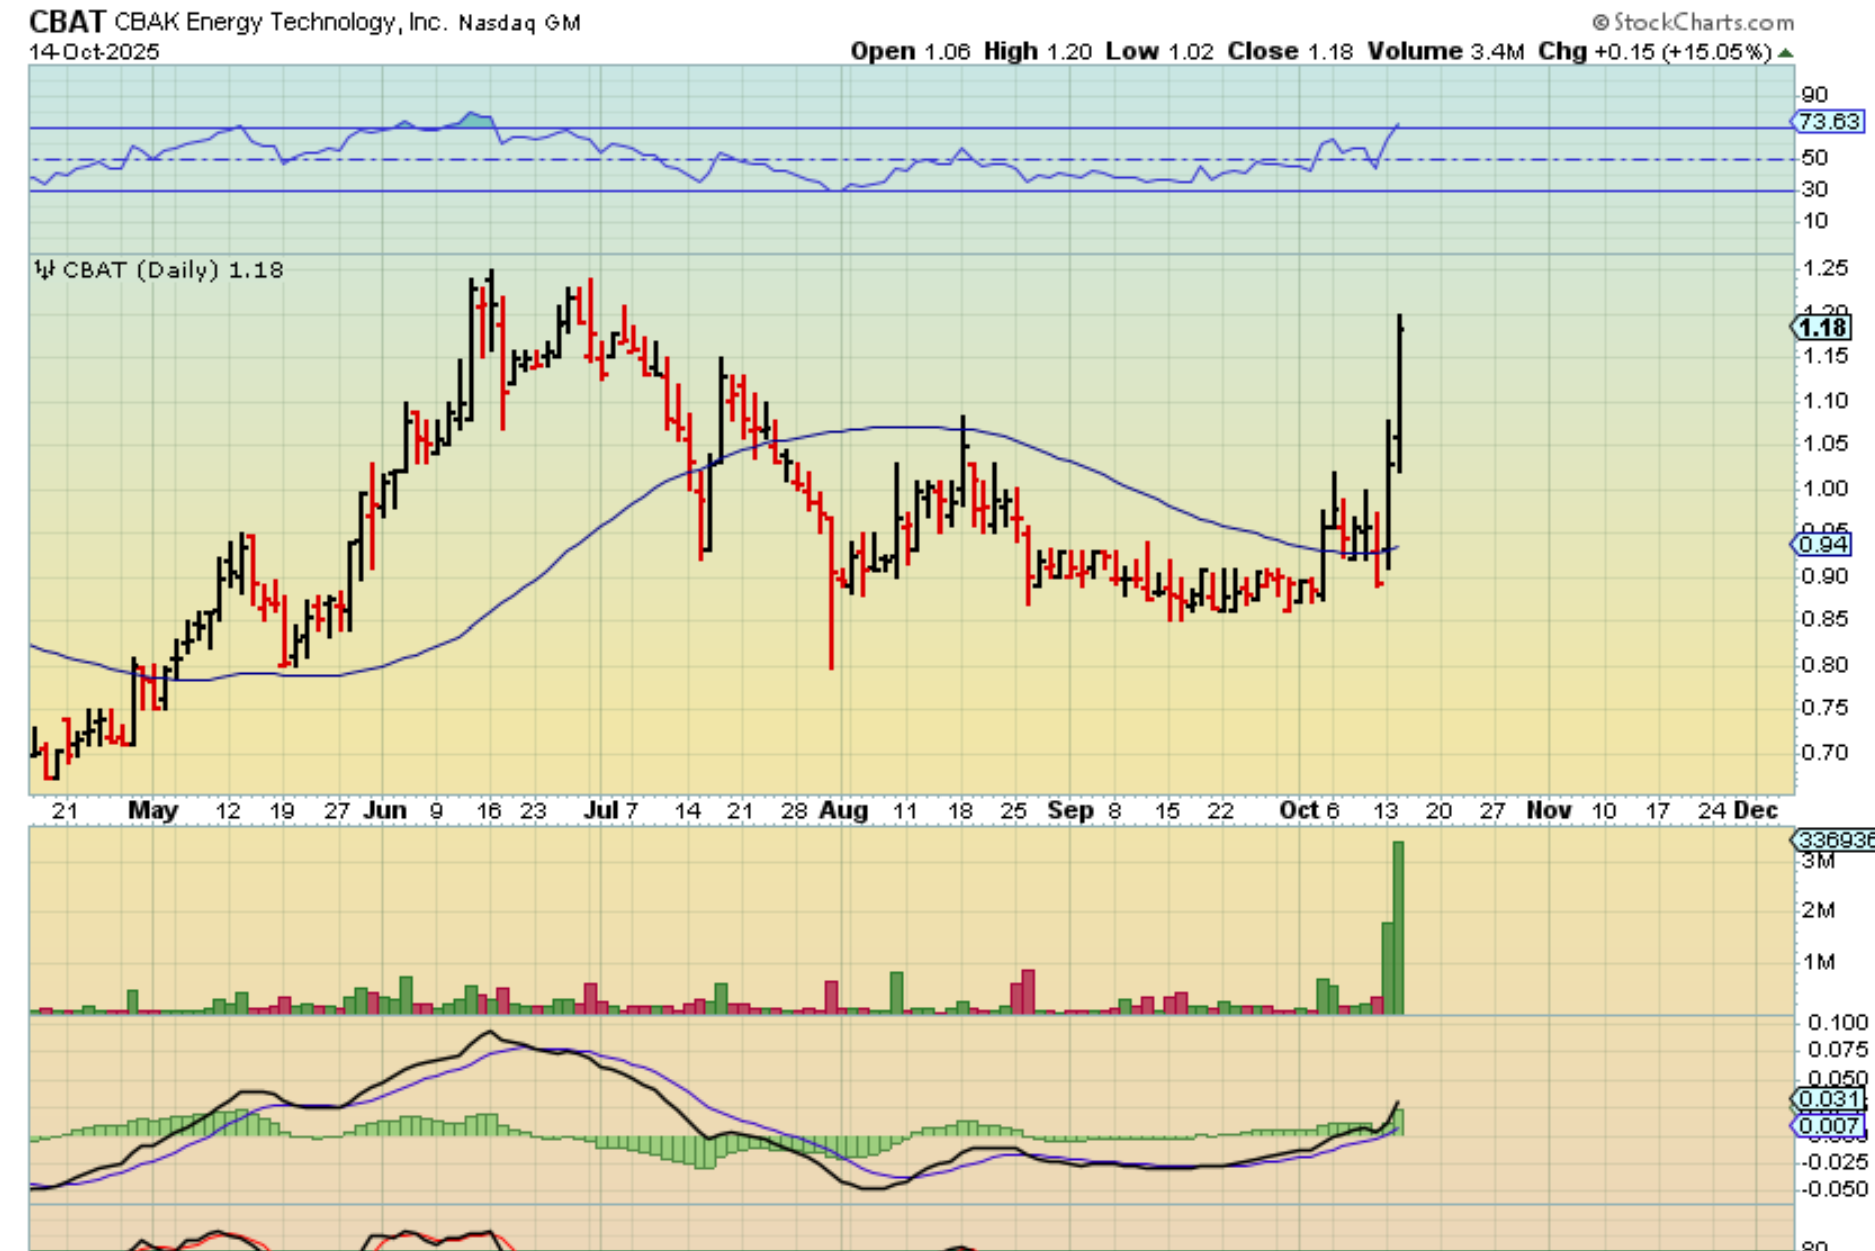
CBAT started to pop on Monday, and this was a buy because all of the other energy stocks have exploded higher. We’ve traded the ones mentioned on this chart for great gains and they are still running…
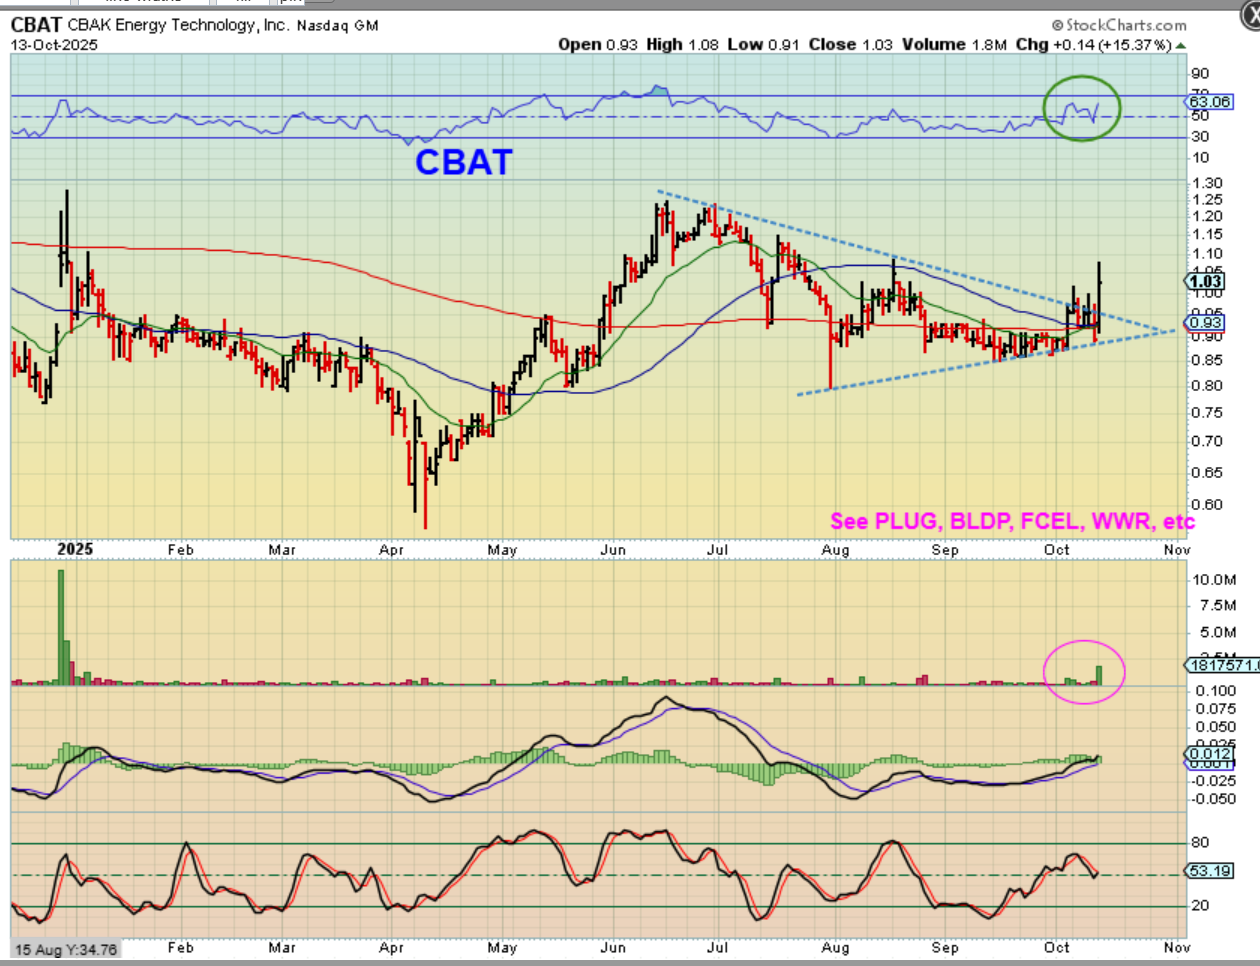
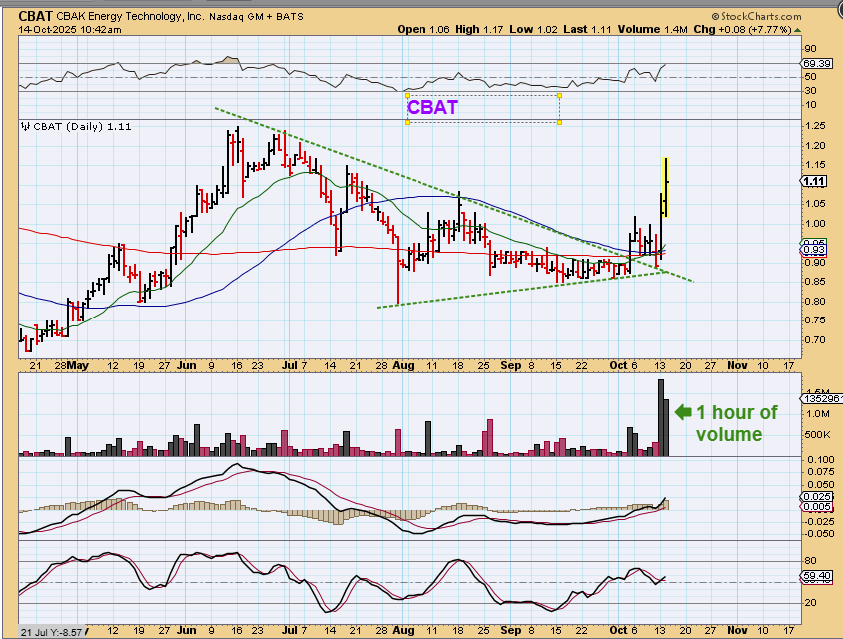
Tuesday morning I pointed out the volume. It was 1 hr into trading and volume was almost as much as Mondays explosive volume. The price dropped from the morning high, but this volume can push it back to the highs.
.
CBAT closed up 15% on Monday and another 15% on Tuesday.
.
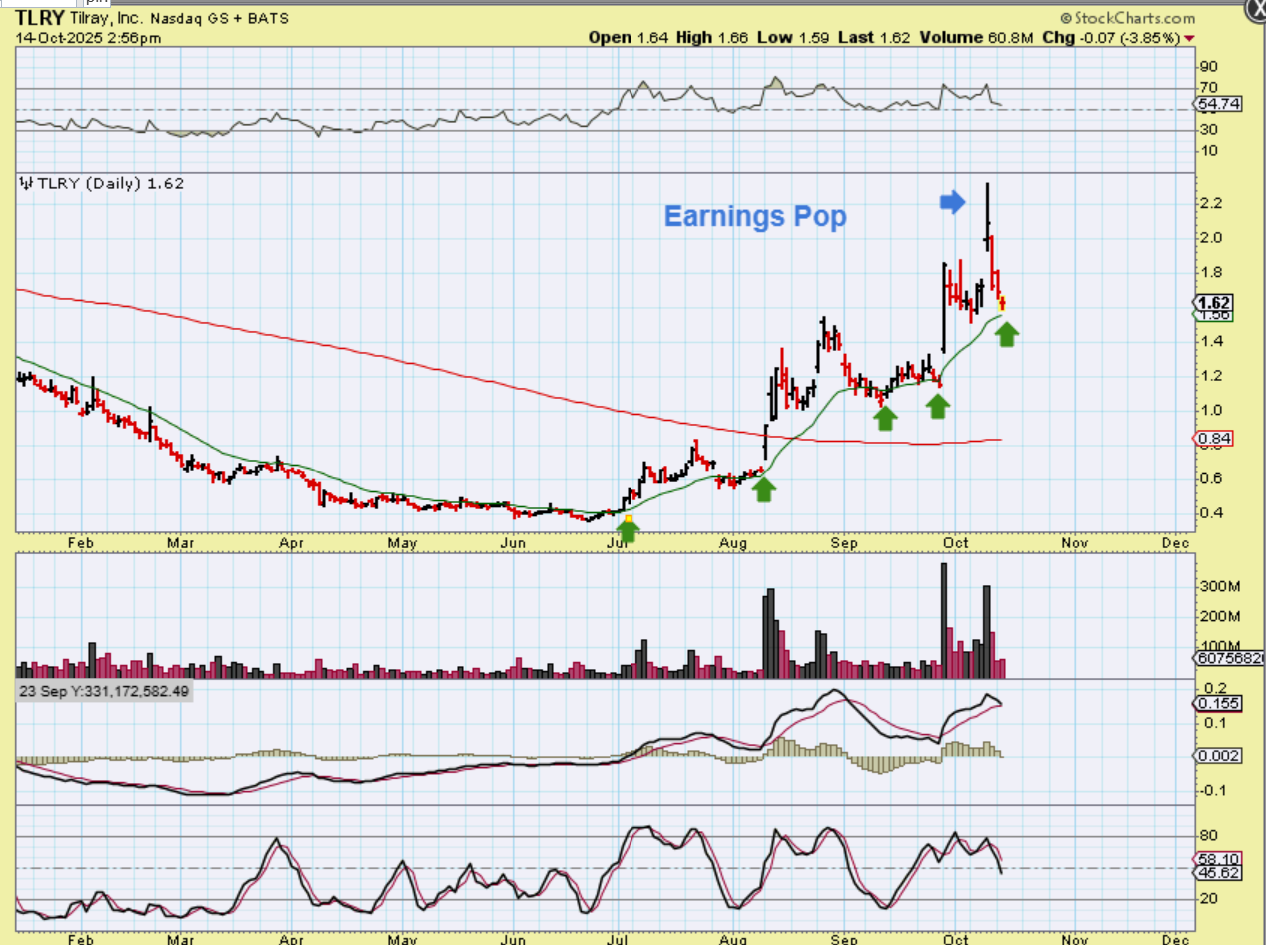
TLRY – Whenever the MJ Stocks POP, they really POP! That POP in September was 60%, when trump was looking into MJ and CBD as beneficial for health. The OCT pop was 22%. Each time TLRY pops, I say, “I am not going to chase it, but I am going to buy that at the next dip to support.” I grabbed this chart 1 hr before the close and it dropped right to support. Did I buy it? Nope 🙂 But I may regret that again, OR, maybe I’ll buy it on Wednesday, depending on how it trades.
..
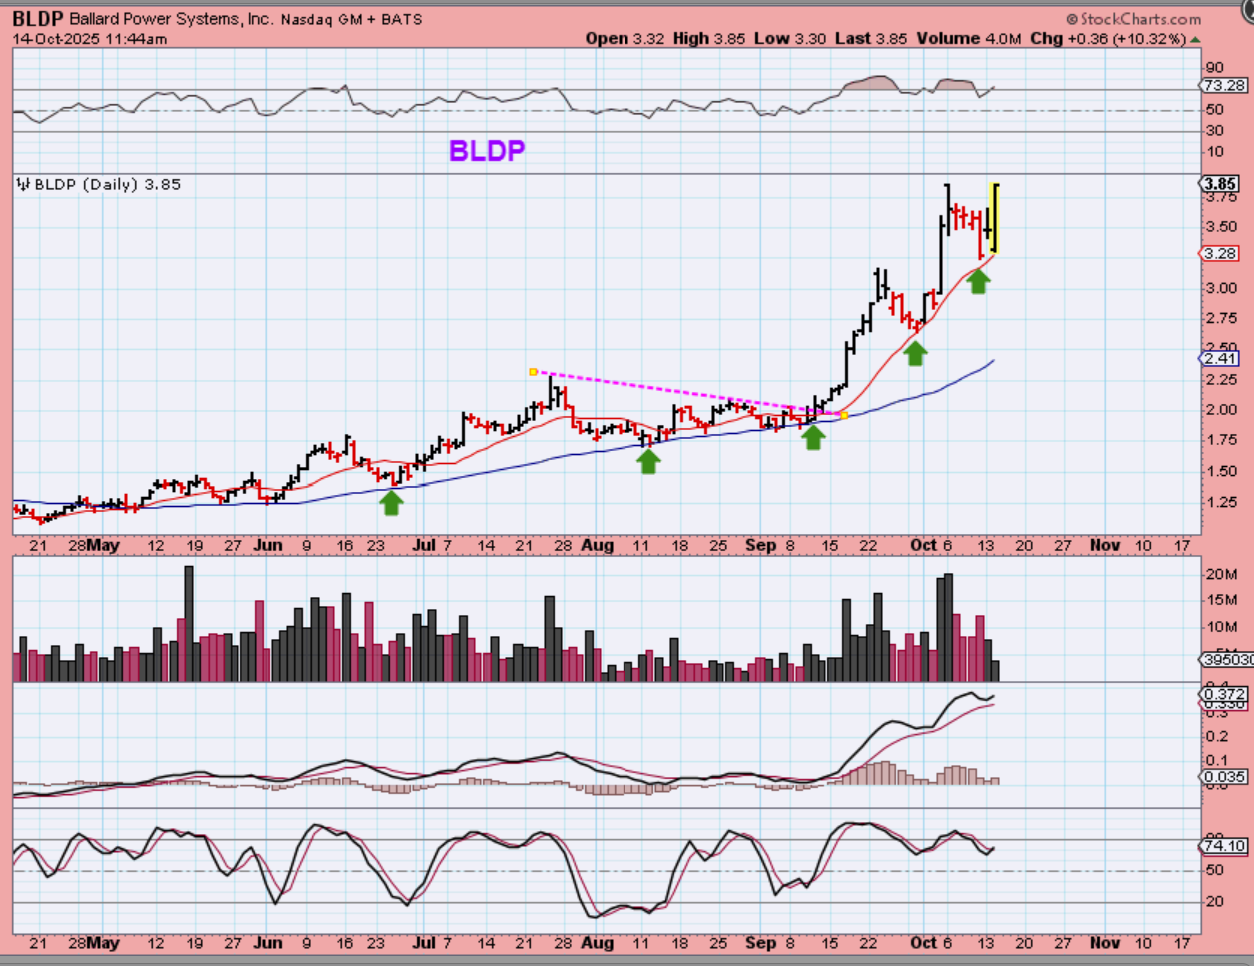
BLDP was one of out trades down at the triangle. It has rallied strongly, and this clean energy sector has done very well for us. That is why I posted CBAT. That is also why I posted WWR a while ago…
..
WWR was breaking out after reversing right on support. BUY…
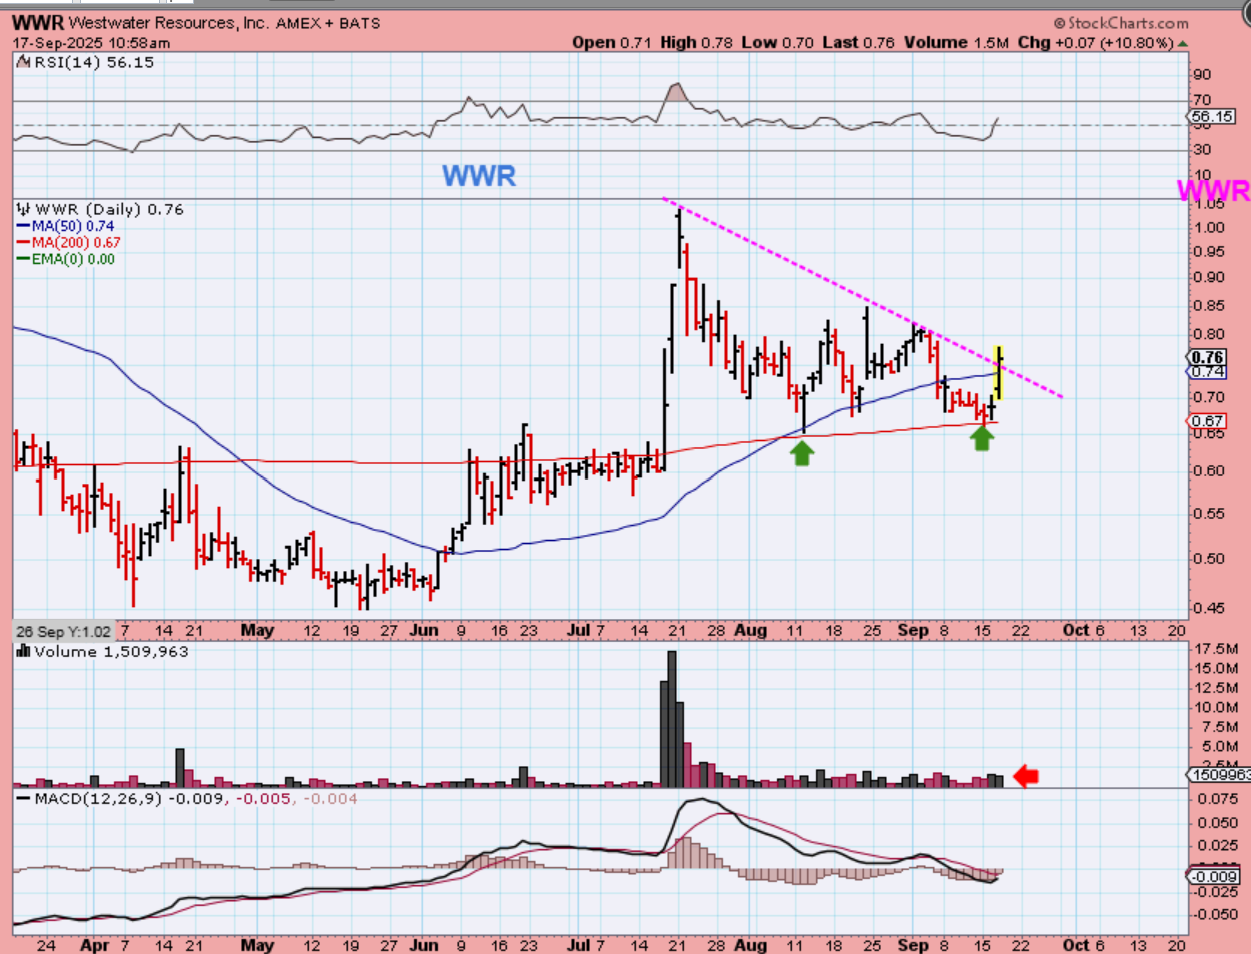
WWR broke from the wedge and was starting to run…
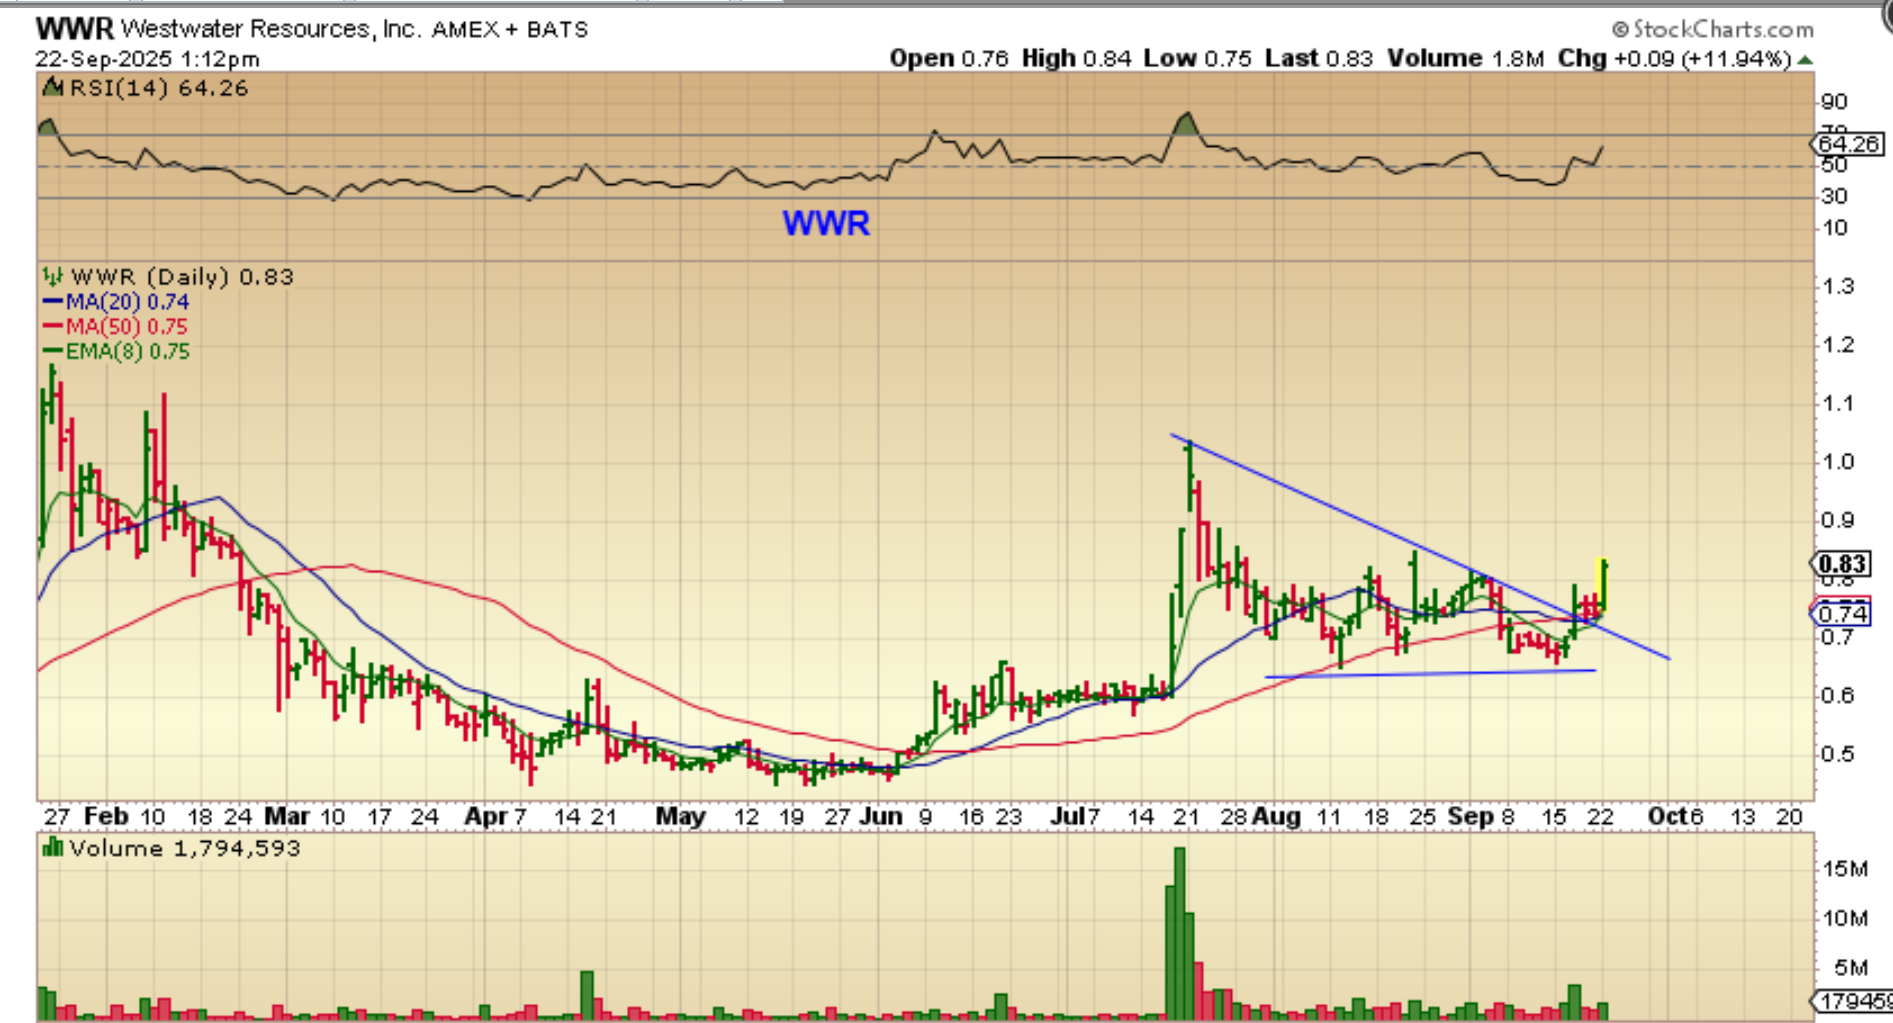
WWR follow through was looking great last week, right? Almost $2 now, that was over a 100% move, very quickly. Guess what??
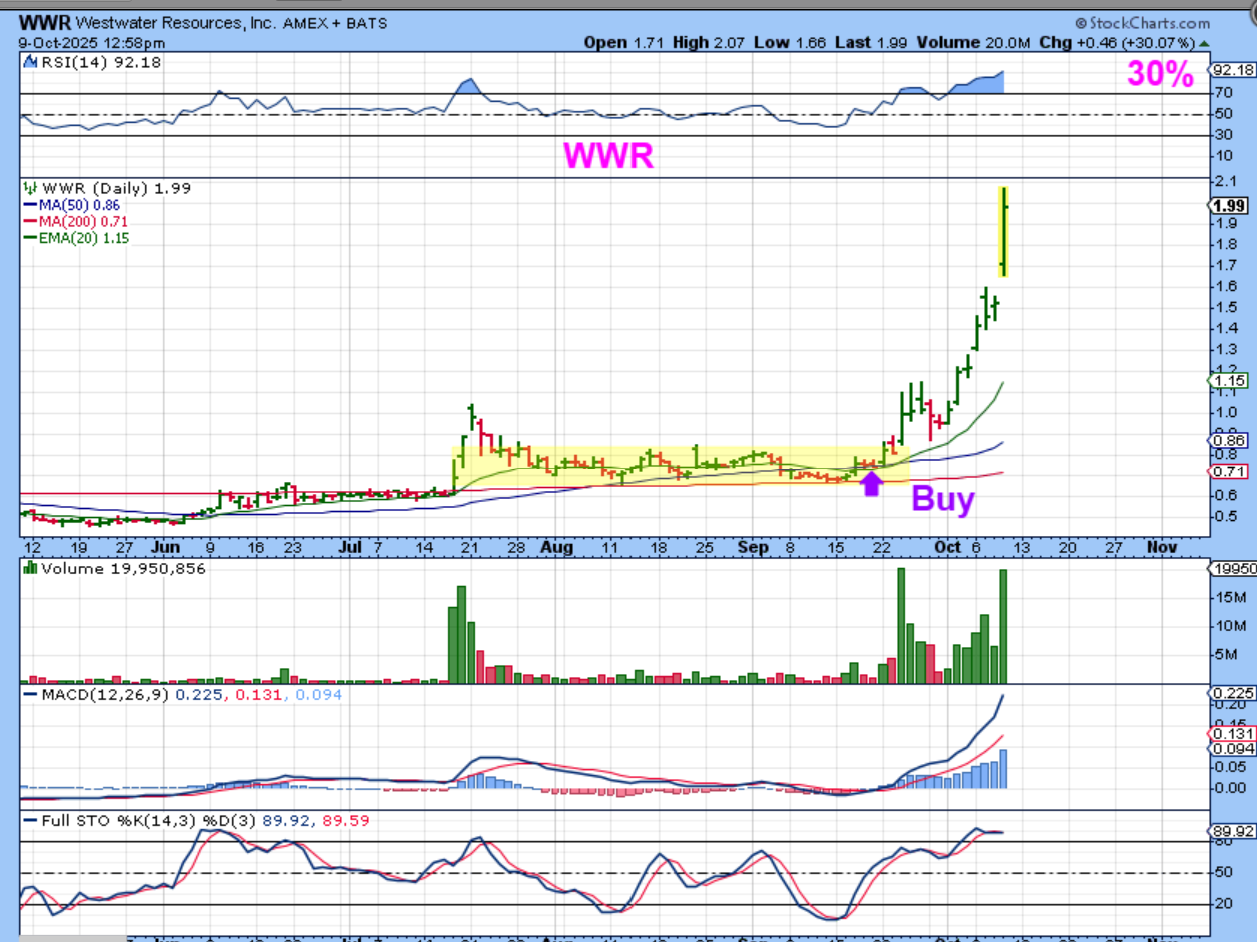
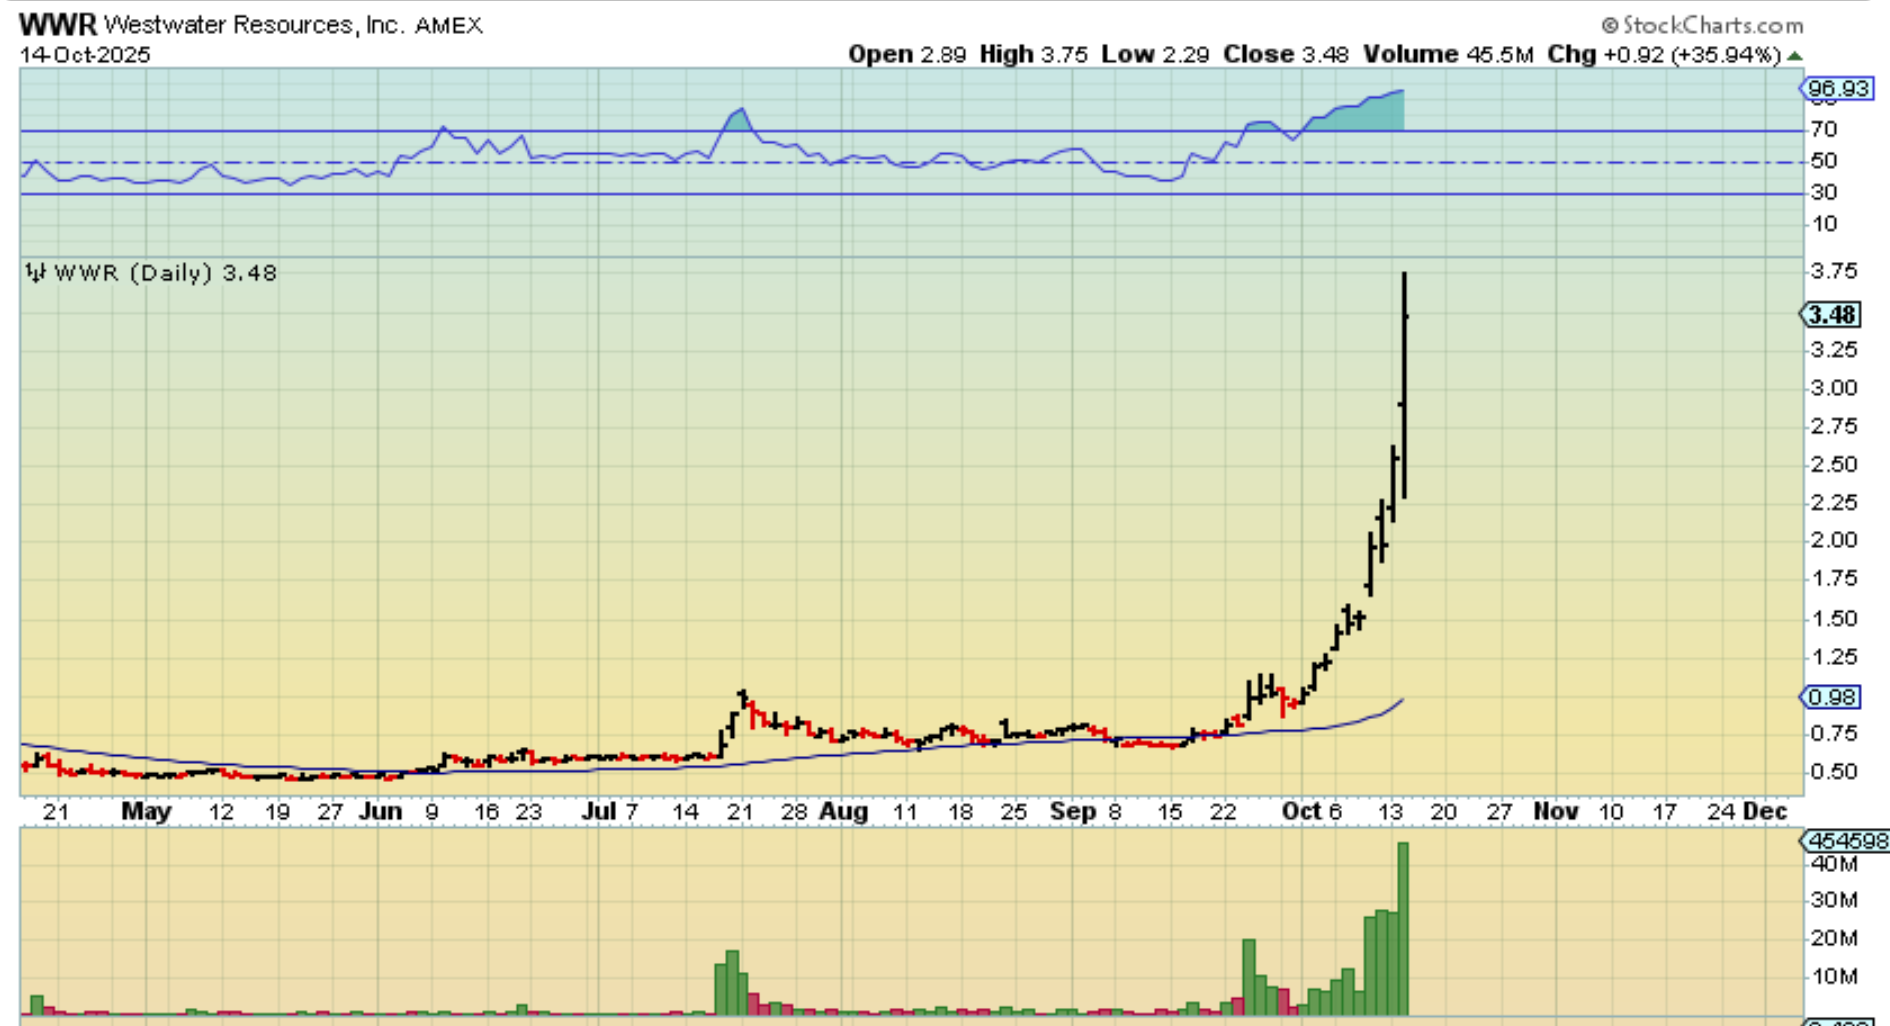
WWR is AWESOME, now at $3.50. I sold all of mine way too early, but if you are still holding? You might want to sell some, because this is a huge move. If CBAT does this, I’ll be very happy. by the way, LAC, FCEL, and BLDP were all up 15% again on Tuesday.
.
.
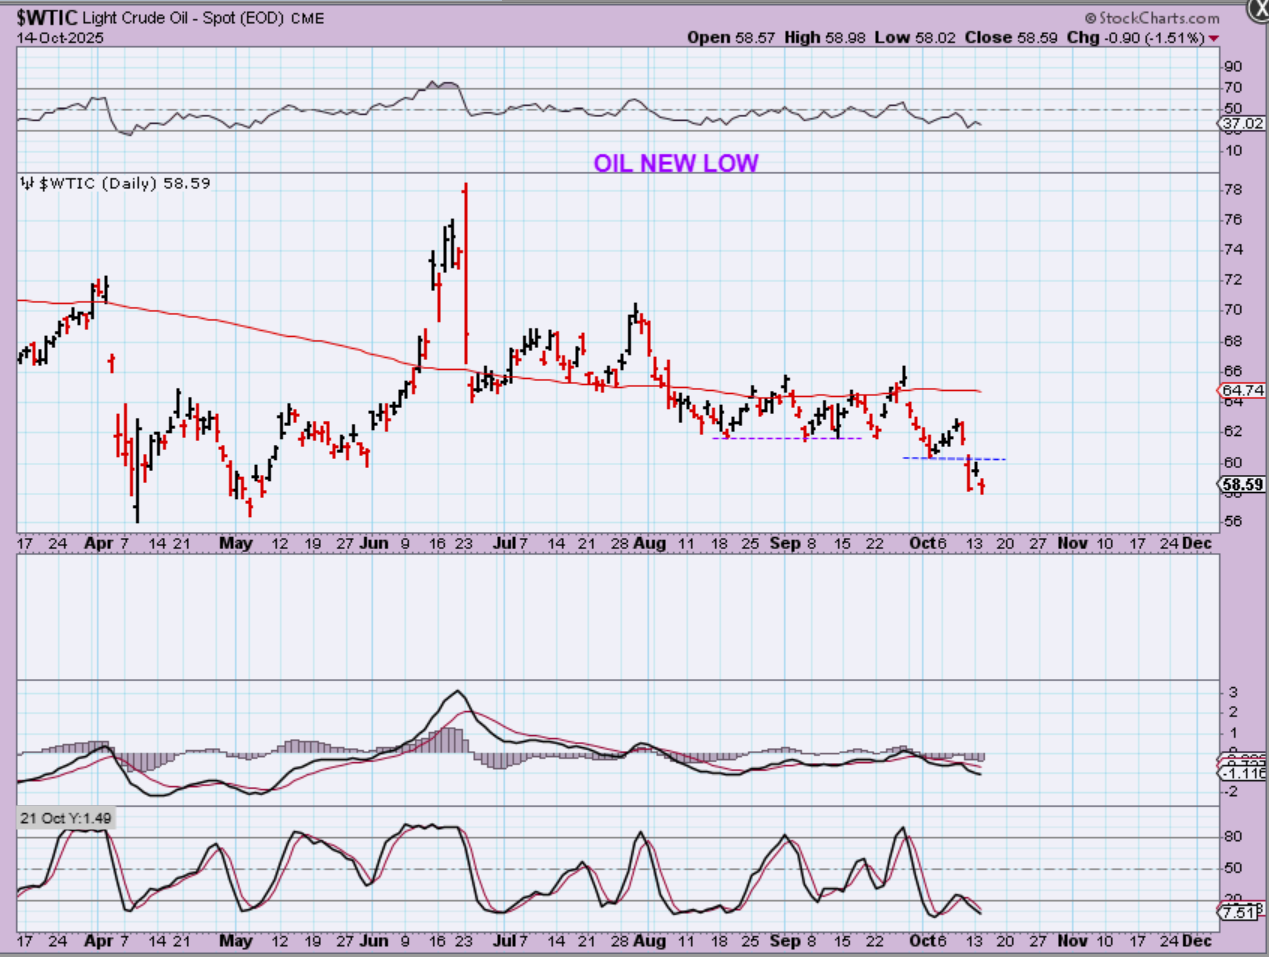
WTIC – Oil dropped to new lows and with the proposed peace deal in place in the middle east, we may just have low Oil prices for some time going forward.
.
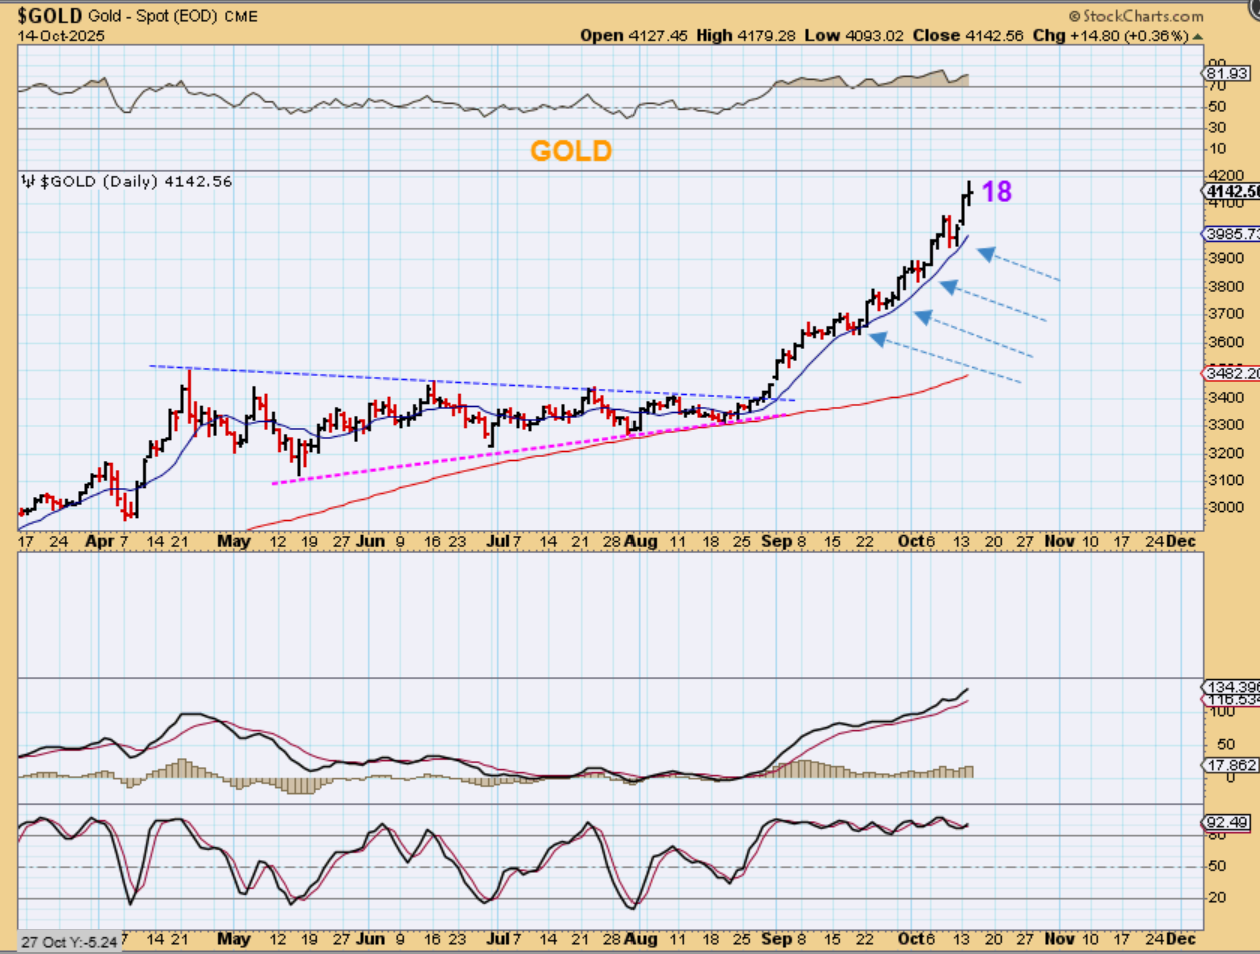
GOLD rallied and sold off a bit, so we have a doji or candle of indecision. At day 18, we could expect a pullback to start at any time, but Gold just does NOT want to stop climbing. Silver took a bit more of a hit, but in a bull market, surprises are to the upside. Please take note of the RSI & MACD – They remain strong.
.
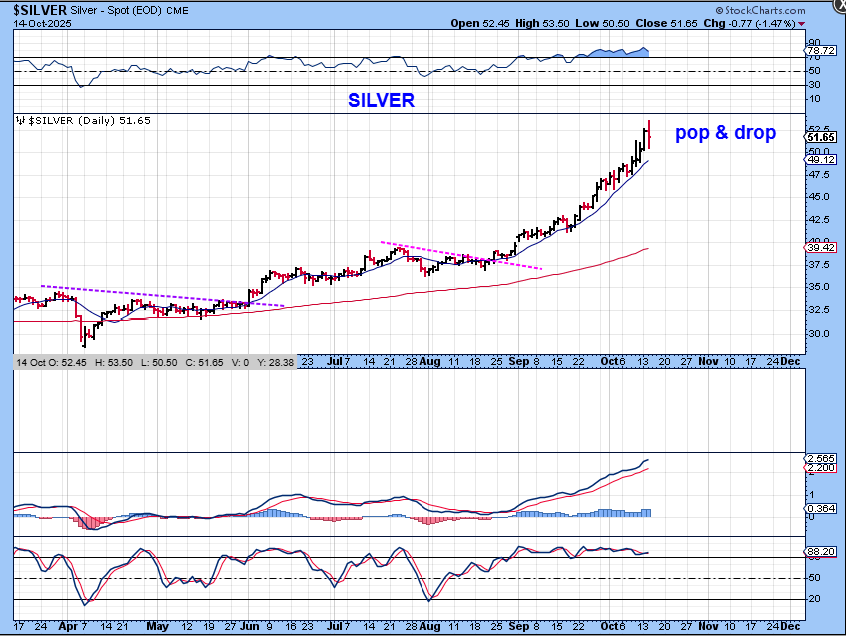
SILVER – This chart of Silver is a bit of a pop and drop. It doesn’t signal a top, but it was day 18 and it may be ready to chop and then drop. Please take note of the RSI & MACD – They remain strong.
..
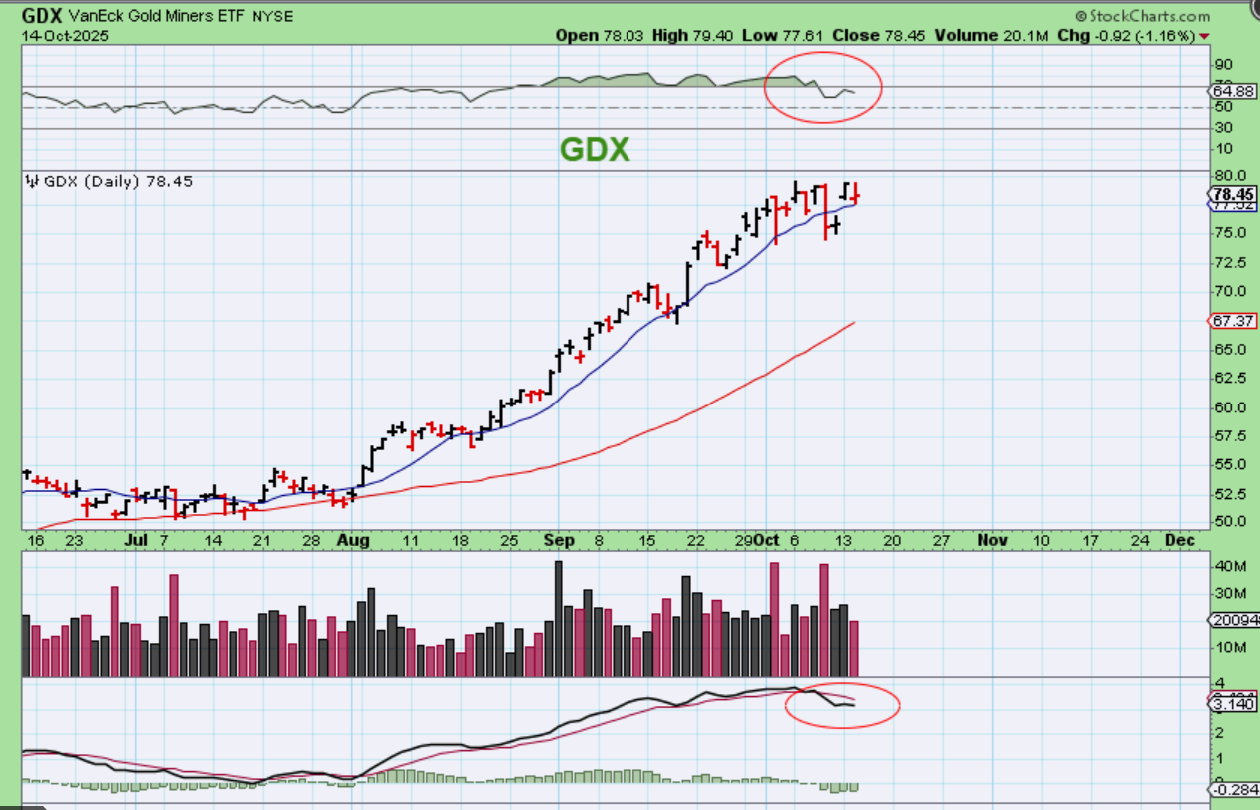
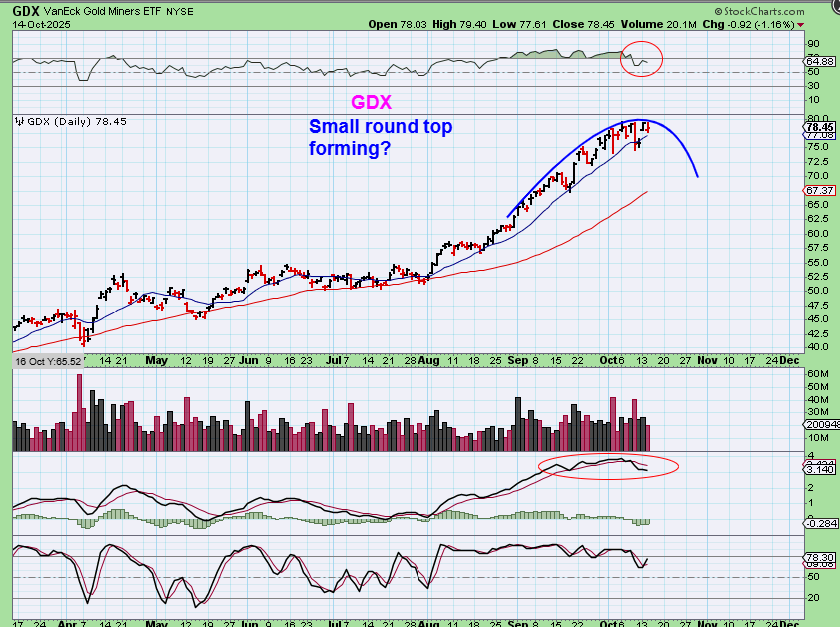
GDX – Notice the RSI & MACD? Miners often lead the way, and the Miners seem to be cooling off a bit. Look at Gold and Silver and they still look vertical or straight up, while GDX is choppy, sideways, and the RSI & MACD show signs of weakness. The sideways chop may continue, or…
.
GDX could be topping earlier than the metals and could lead the way lower, but we’ll see what happens if the metals are higher again over the next 3 days of this week. I don’t know for sure, but a little weakness is what I am starting to see when I look at the Miners charts.
.
It seems that every day (except for last Friday) the markets and stocks are still running higher. It makes me wonder if everything just wants to bullishly continue to run higher into the Fed meeting 10 or 11 days from now and then pull back hard after that. Not long ago I was thinking that maybe things would die down and sell off into the Fed meeting, and then rally out of those lows in November, but so far sectors remain strong. We’ll just have to wait and see. Many stocks are simply popping and running 10-20% and the Fed meeting is 2 weeks from today. For now, the gains have been excellent. Enjoy your Wednesday trading!
.
~ALEX
.
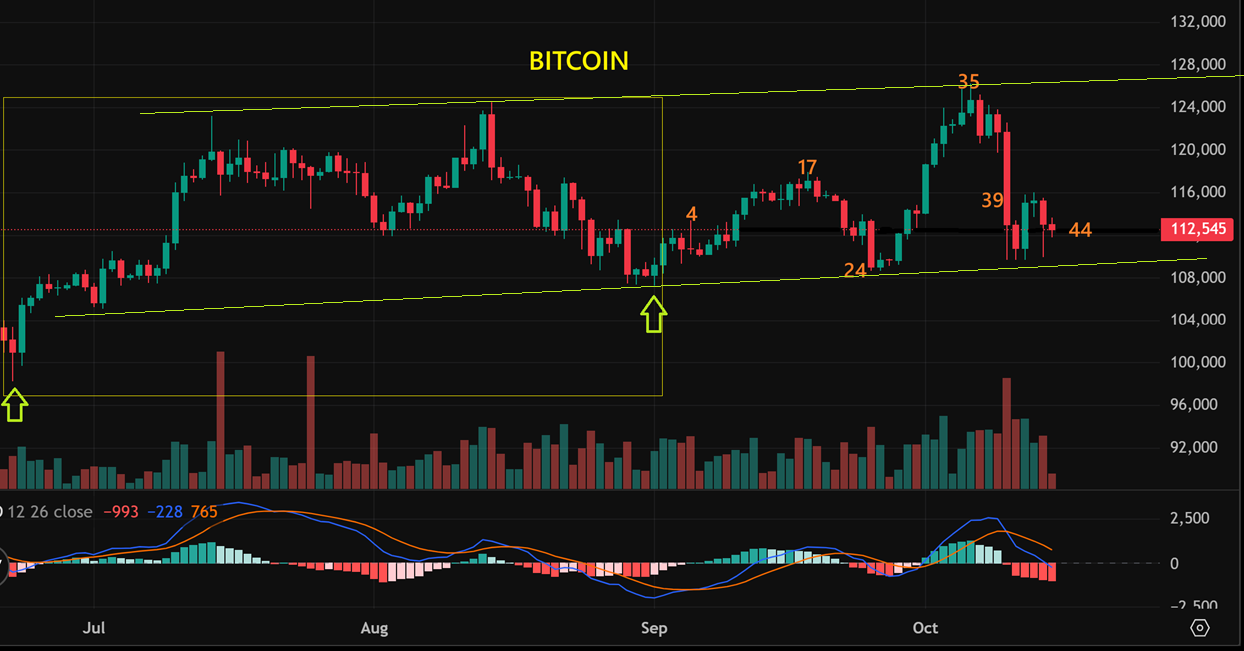
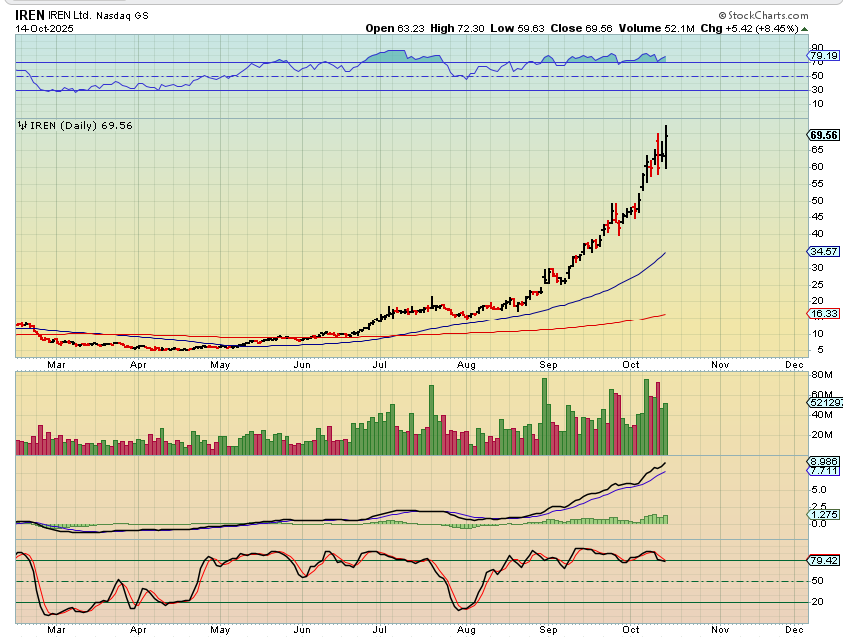
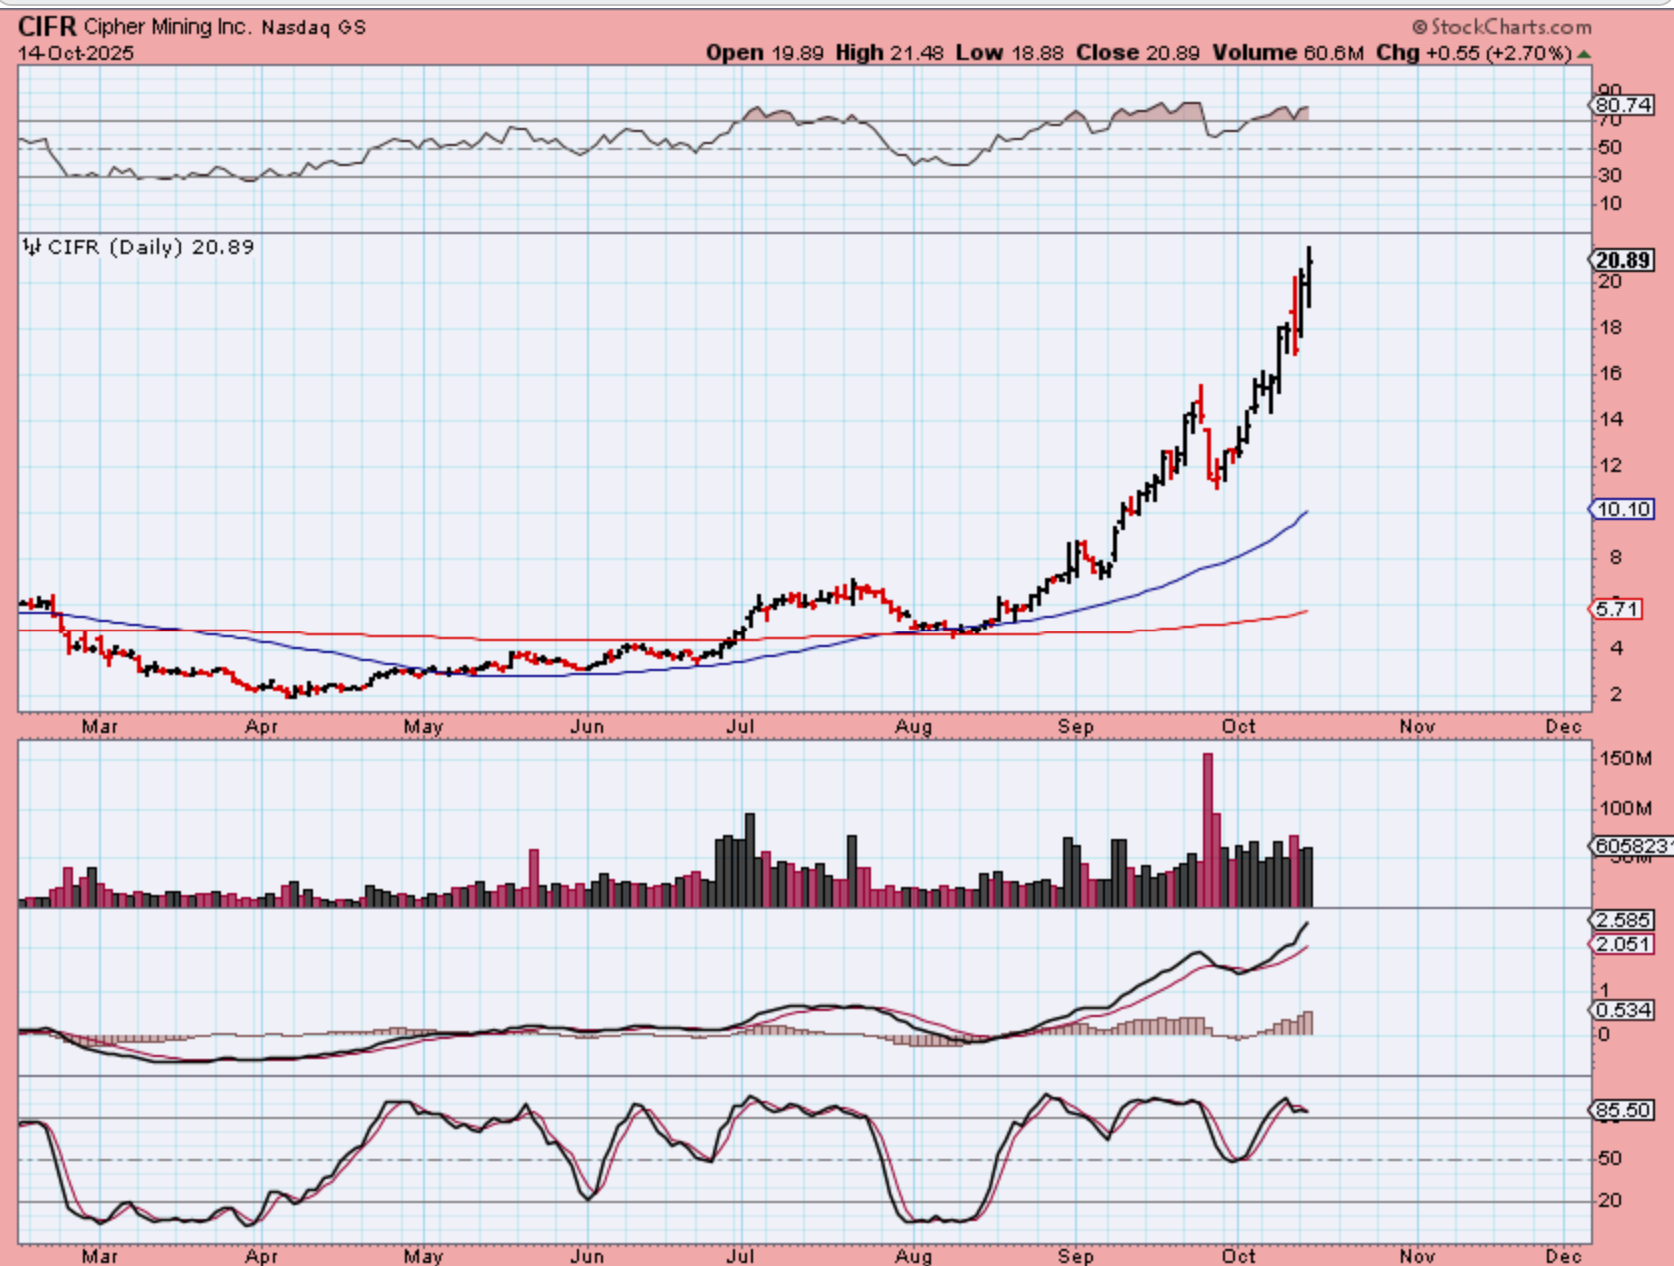
BITCOIN is on day 44 of a possible 60 today, so that is roughly 15 days from today to the next low. We’re running out of time for a strong run to new all-time highs that keeps on running, but we could do another run to the upper trend line. What I want to point out is that over the last 2 days (Monday and Tuesday) We saw Bitcoin sell off at the lows, but CIFR, IREN, BKKT, CAN, HUT, WULF, HIVE, etc have been green on both days…
.
We saw Bitcoin sell off at the lows, but CIFR, IREN, BKKT, CAN, HUT, WULF, HIVE, etc have been green on both days. I had CAN in the reports as a lagger down at the green arrows and it certainly isn’t lagging anymore. Again, the last few days have been while Bitcoin was at the lows.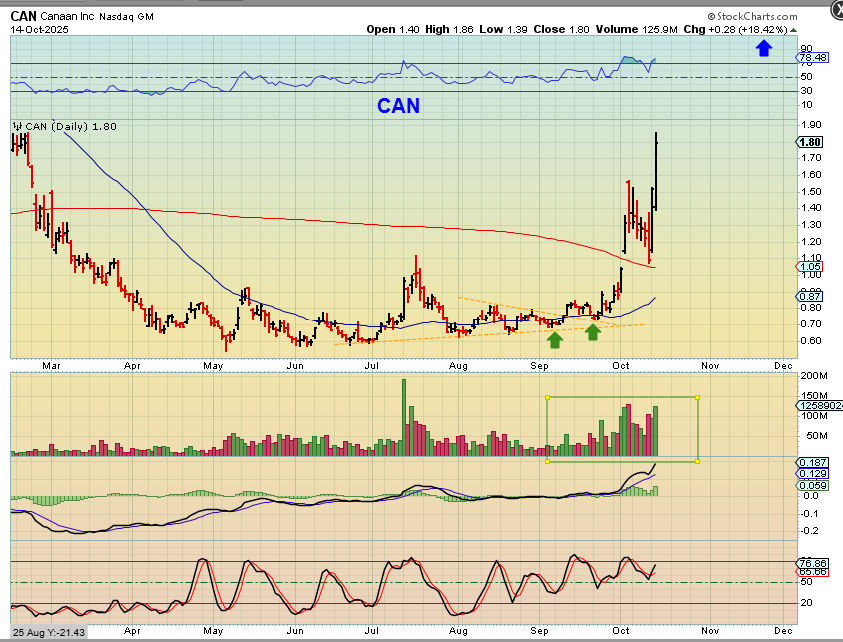
.
And then you have CIFR & IREN looking like this, so Crypto stocks are still running despite Bitcoin lagging at the lows. If Bitcoin runs higher for day 44 through 56 or so, I imagine this would only help the sector, but then many of these could be parabolic.
.
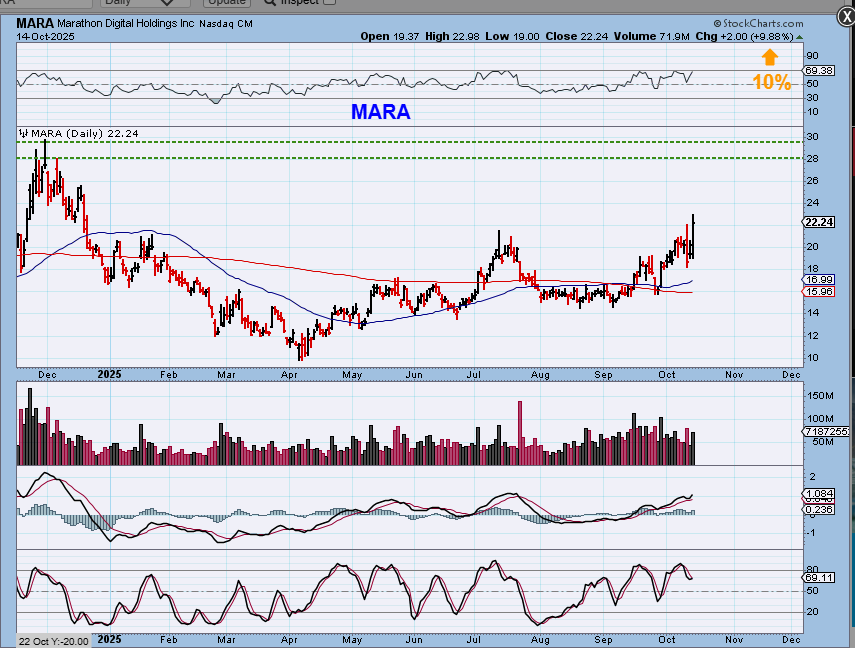
If Bitcoin runs higher for day 44 through 56 or so, I imagine this would only help the sector, and you may want to find a lagger that is starting to run now. Those could play catch up and you can see that MARA is closer to the lows than the highs like CIFR & IREN. It was up 10% with Bitcoin down yesterday and may be ready to go to the former recent highs.
.
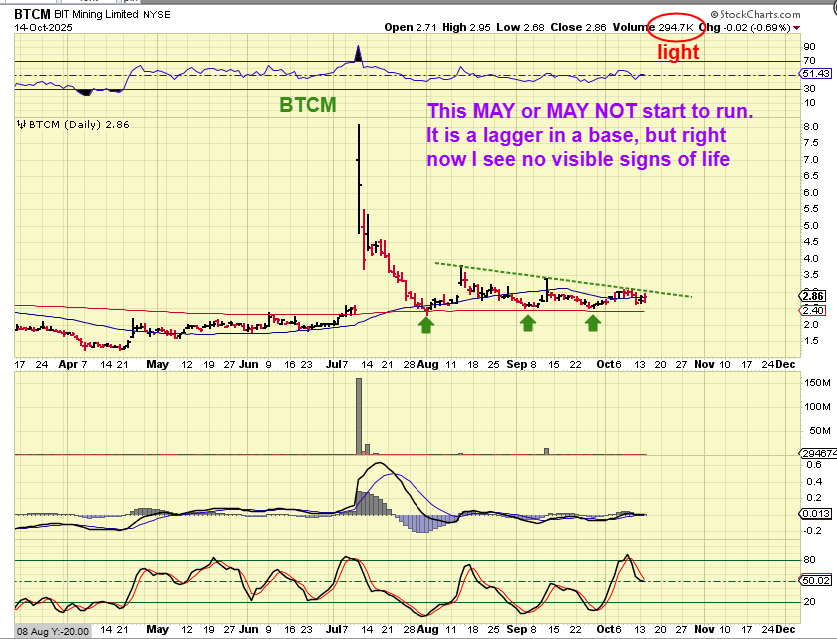
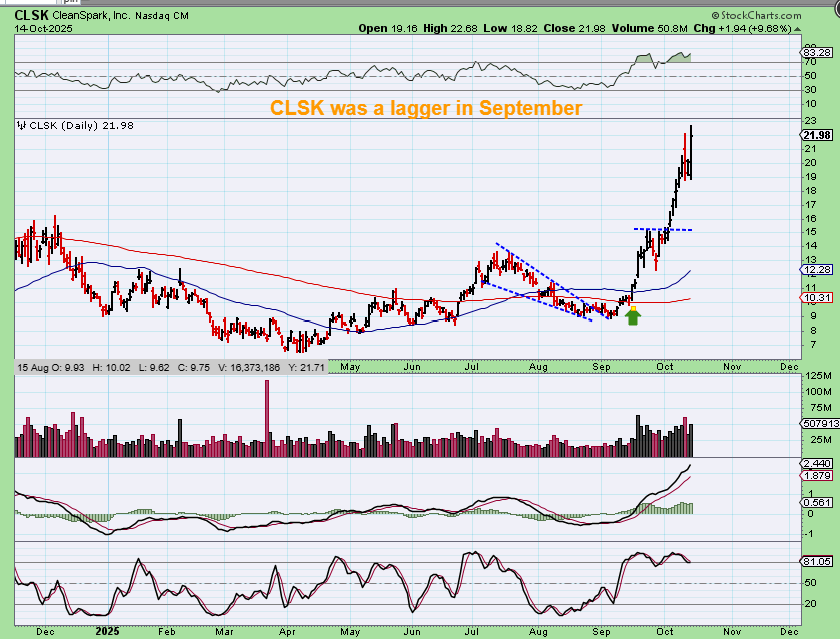
So I had pointed out CAN, CLSK, and others as laggers and look what they have done since mid-September. I would say this however…
.
NOTE: I will say this, however.
When I pointed those laggers out, we were closer to day 1 than to day 60, so it may be best to look for ones that have already started to move (like we saw with MARA) when choosing a lagger now, rather than one in a base with no signs of like.
BTCM has volume of 295,000 (kind of light) and hasn’t really broken out or popped yet. If it does pop it might be a buy and volume may flood in, but if you buy this right now without a sign of life just because it is a lagger? It may just continue to do what it has been doing from August until now.