Saturday October 11th Weekend Report – What Was That?
2 REMINDERs:
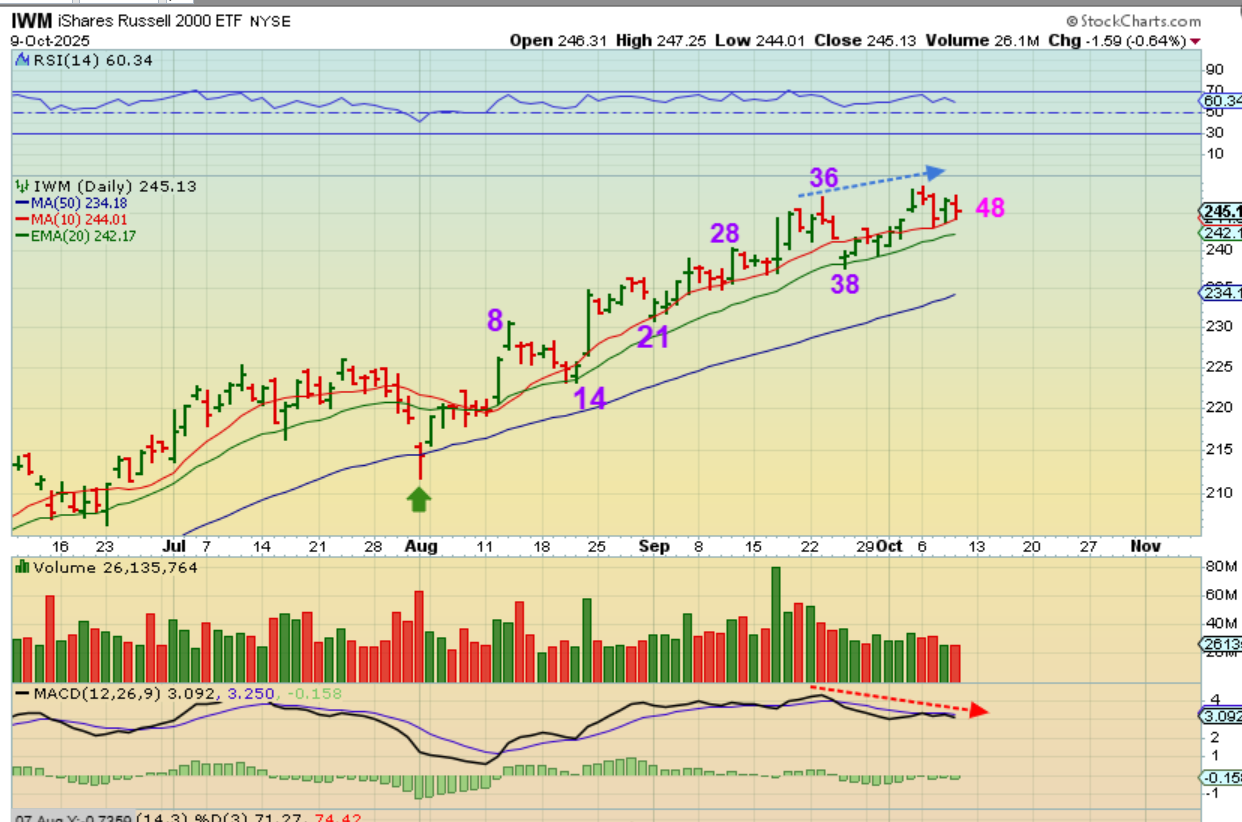
1. FRIDAY I DISCUSSED CYCLE TIMING: Using the August 1st low as a dcl, we would be on day 48 and due for a dip into a dcl in the next week or so, unless somehow day 38 was a very mild dcl. The divergence that I pointed out also remains in place.
.
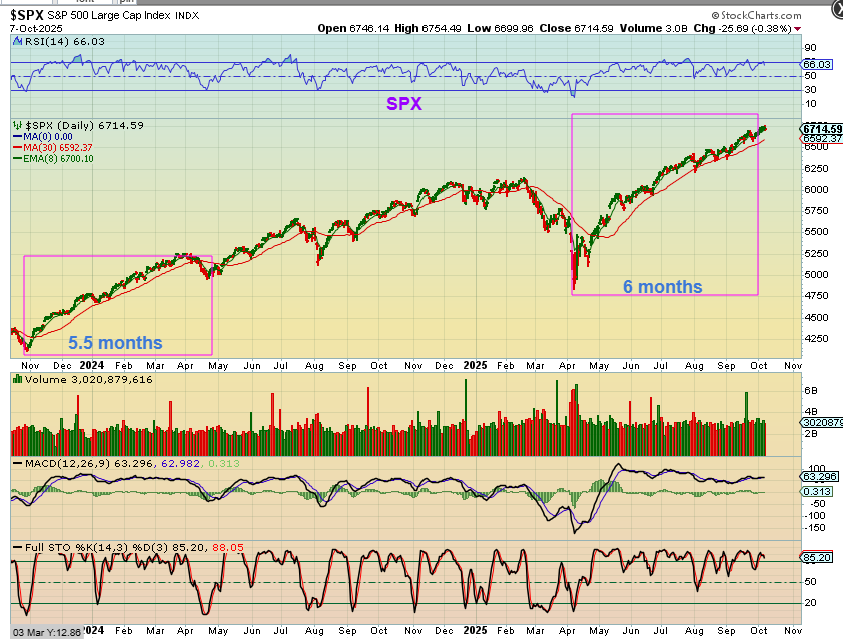
2. IN RECENT REPORTS, LIKE HERE ON OCT 7, I ALSO DISCUSSED THAT WE ARE DUE FOR AN ICL: ICLs usually come very 5,6, maybe 7 months. We were now extending time-wise beyond the 6th month. I have also discussed a possible drop in October as we head into the Fed Mtg.
.
With those 2 reminders, I will now review the current chart set ups.
.
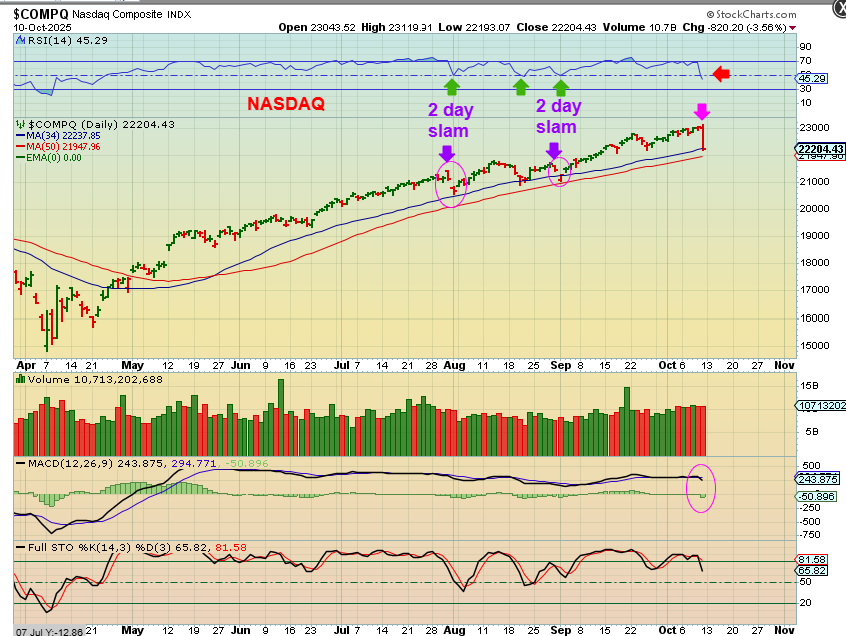
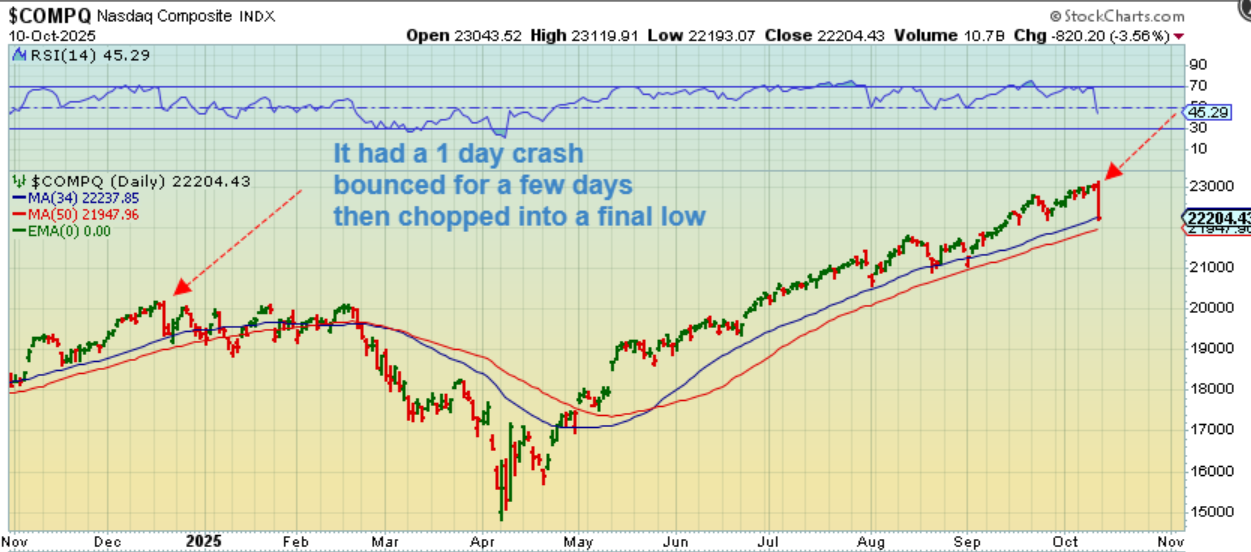
THE NASDAQ (and SPX, IWM, SOXX) all took a sharp dive on Friday, so sharp that it was deeper than prior 2 day drops to the 34 sma. I had just mentioned in the Friday report that we were running late, on day 49, and we need to think about a drop into a dcl, and then possibly an ICL. At the end of Fridays report I discussed that further. Are we just going to crash down now?
.
Are we just going to crash down now? Maybe, maybe not. In the past I have seen sharp 1 day drops that paused and even bounced for a week before falling further. You can see that here in Dec 2024. Anyone that shorted that 1 day drop was probably worried as it bounced back, but it did eventually drop to a low in January 2025.
.
NASDAQ – I just want to point to ICL dips. The regular dips (dcls for example) tagged the green line 20 ema and were relatively mild. ICLs dropped much further and took some time as they chopped lower, so we may be in for a choppy drop down into the Fed-Day or maybe more. I will detail that idea next…

.
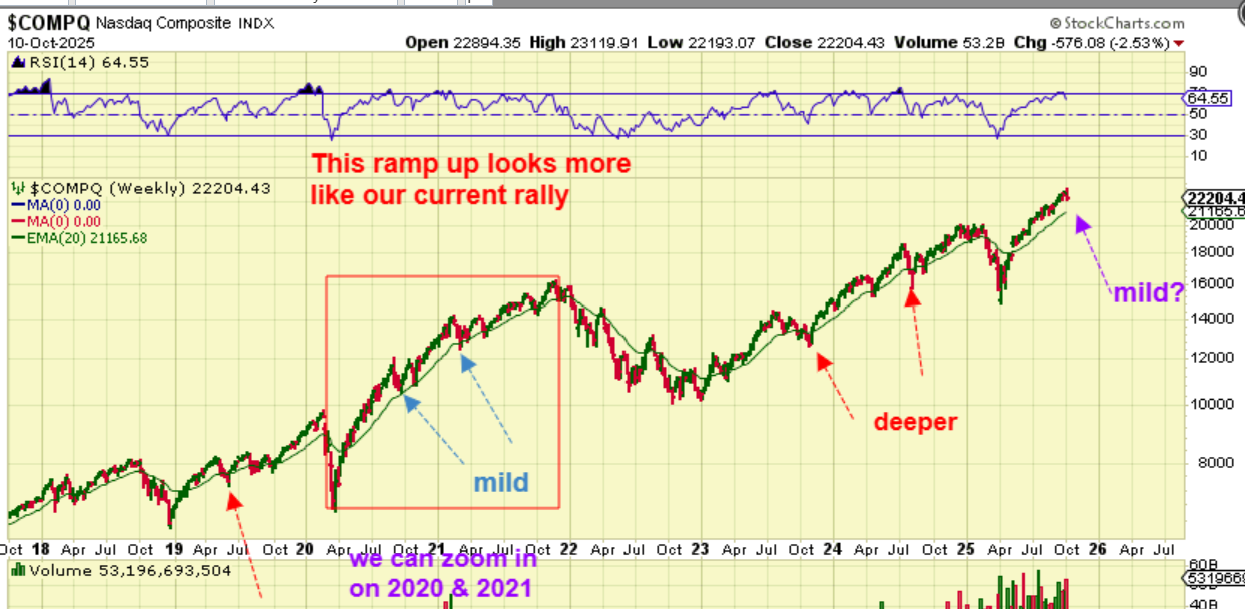
The 2020 Bull Rally out of a sharp sell off for The NASDAQ does resemble our current one, so I have compared them with you often. If this repeats, the next ICL drop will be fairly mild in the big picture. It is very interesting to me that…
.
It is very interesting to me that
1. In 2020 the ICL was on the last week of March, in 2025, the ICL was April 7.
2. The dip into the ICL in 2020 started and ended in September. So it ‘peaked’ in September and then bottomed in September.
3. So that means that it is possible to peak here in October and bottom after the fed mtg. I’ll zoom in on 2020 for you…
.
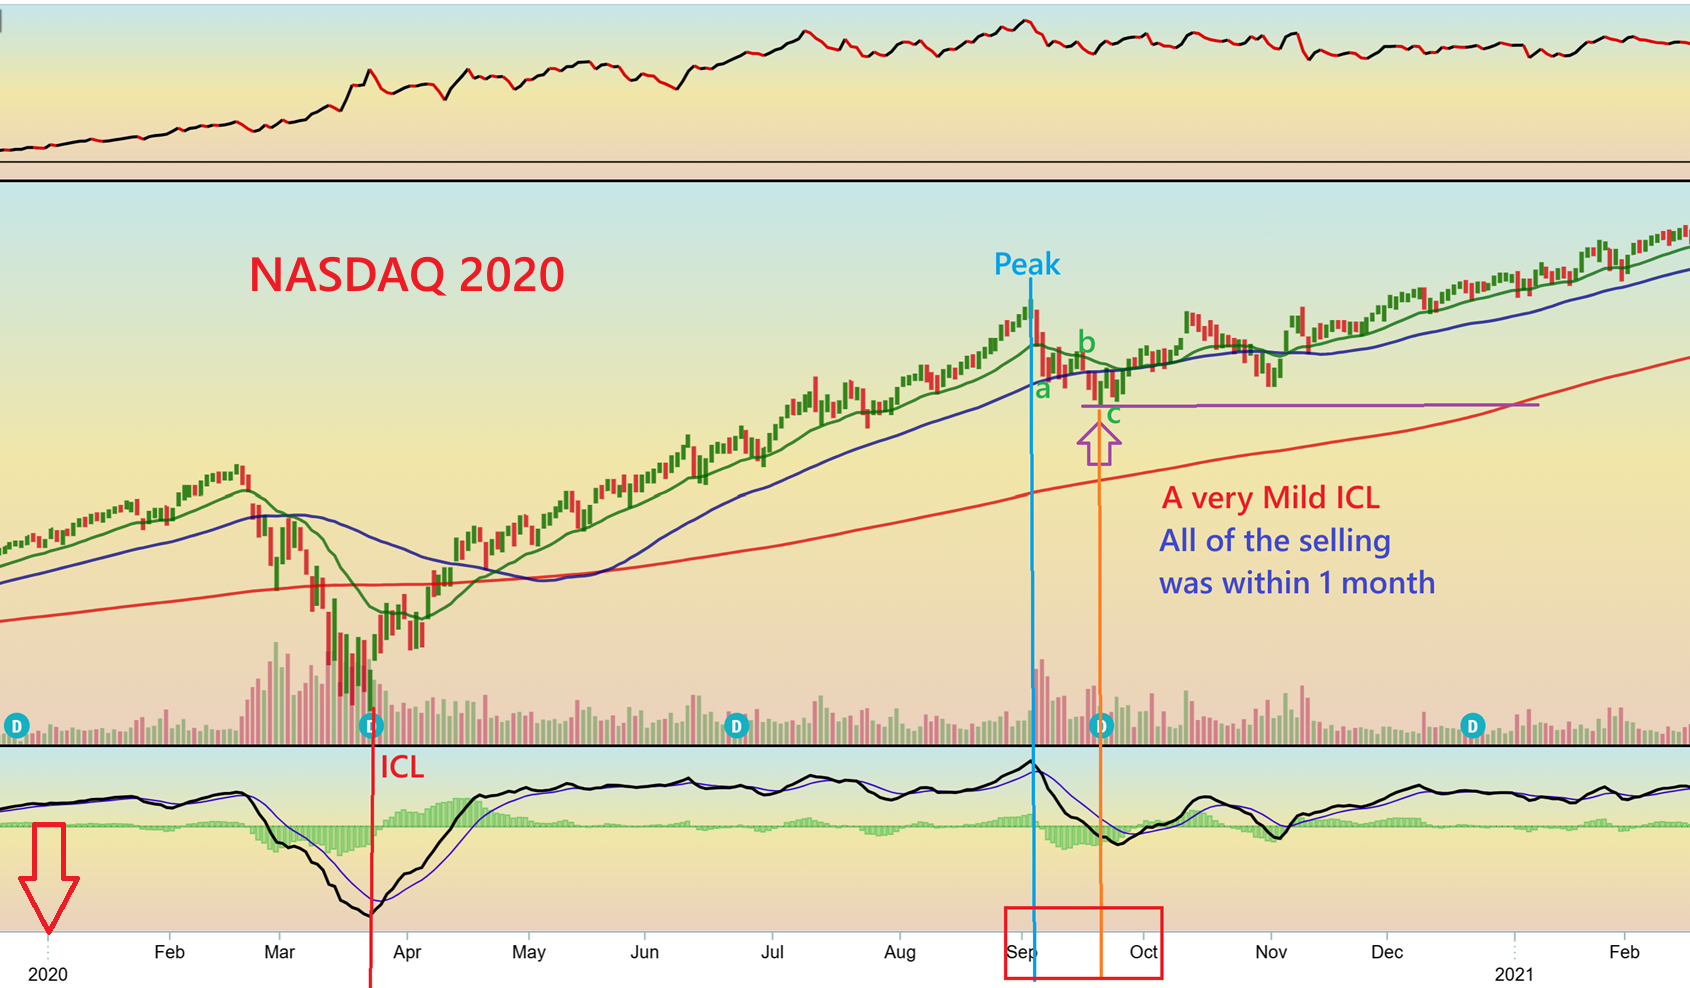
I’ll zoom in on 2020 for you.
This is still very similar to right now.
1. It bottomed in March and peaked in September at new all-time highs, and bottomed in September too.
2. We bottomed in April 2025, and likely just peaked in October.
3. Now look at that very mild drop into an ICL that took place in 2020. It was a choppy mess, but I do see an a-b-c down. The rally then continued and all of those bullish charts became great buying opportunities, so there is hope that we get something similar to this after the Fed Mtg.
.
.
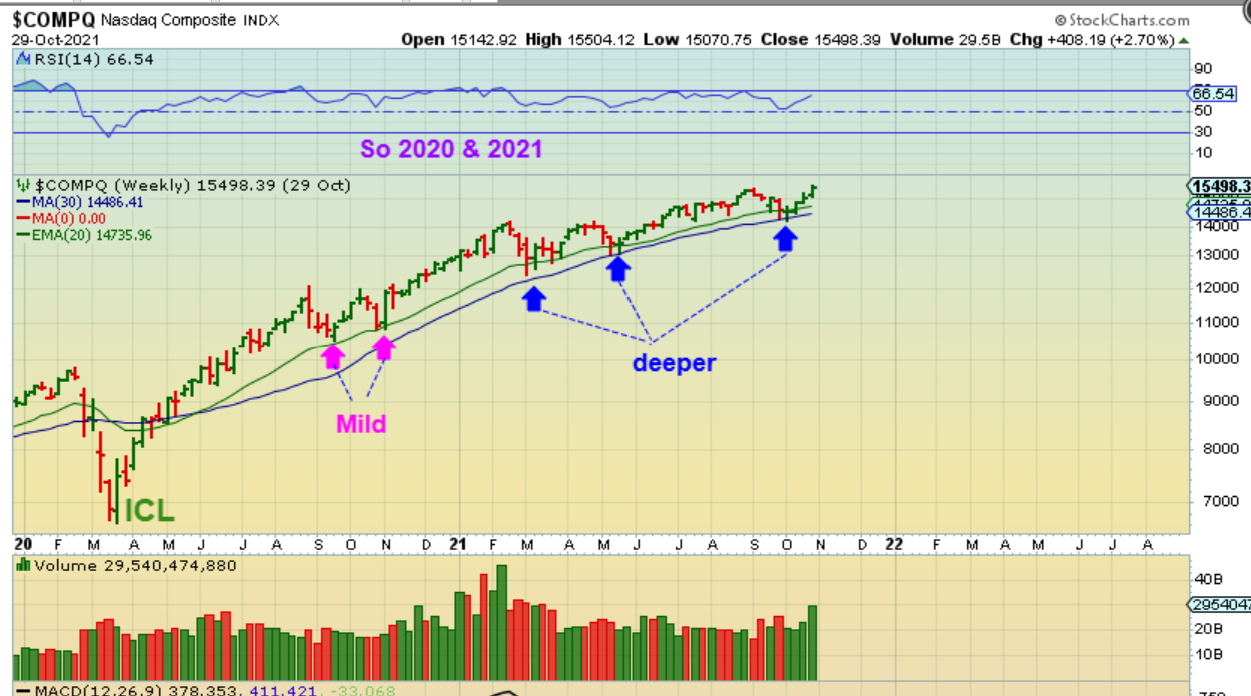
THE WEEKLY NASDAQ in 2020 – 2021: The MILD ICL dropped to the green 20 week ma. After that the other ICLs dropped to the 30 week ma. That is what bull markets do, so I will be looking for that as some selling takes place.
.
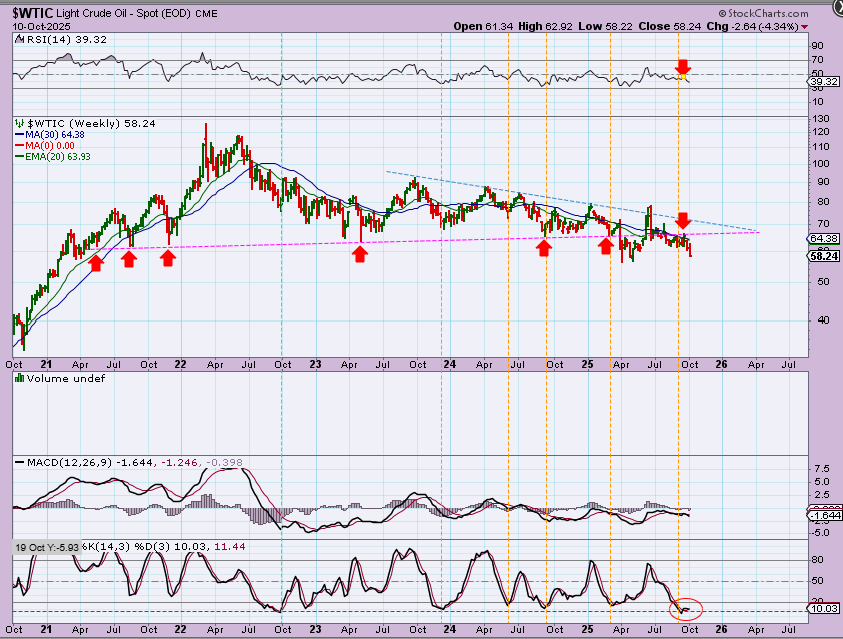
WTIC tagged the lower trendline again this week and then sold off. 2-3 weeks ago we were seeing Oil stocks setting up bullishly and up near their recent highs, with Oil near the lows, but now Oil failed to retake that break down area again. It is possible that the ‘peace talks’ and geopolitical situation is weakening Oil, but honestly, it has just been weak and choppy for almost all of 2025.
.
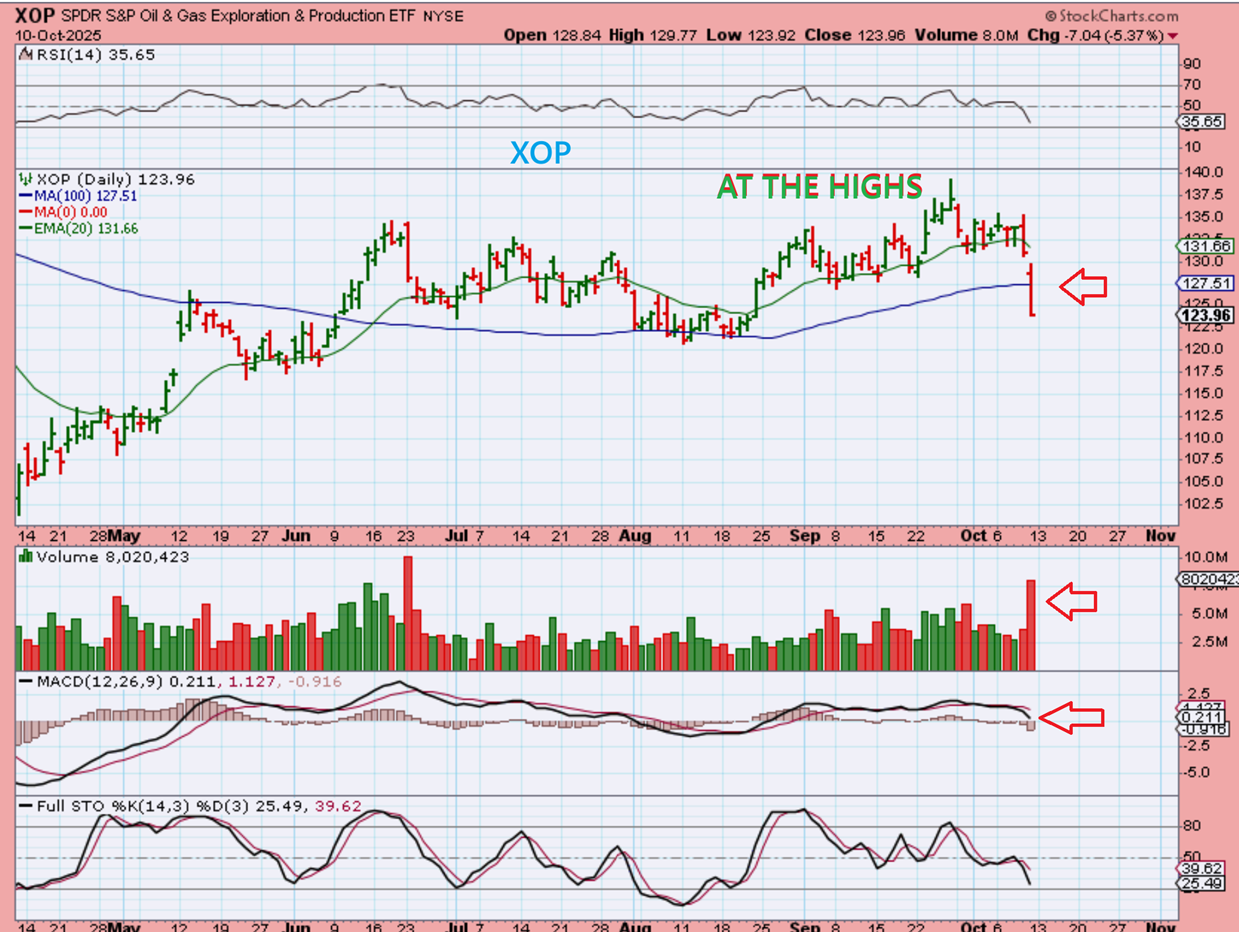
So the XOP was up at the highs 2-3 weeks ago, and we were seeing Oil stocks setting up bullishly with Oil near the lows. The XOP even broke out to new recent highs, but with Oil breaking down AND the general market taking a dive, this is now failing fast. THIS should have stopped out many buyers of the XOP and the volume shows that it may have triggered selling.
.
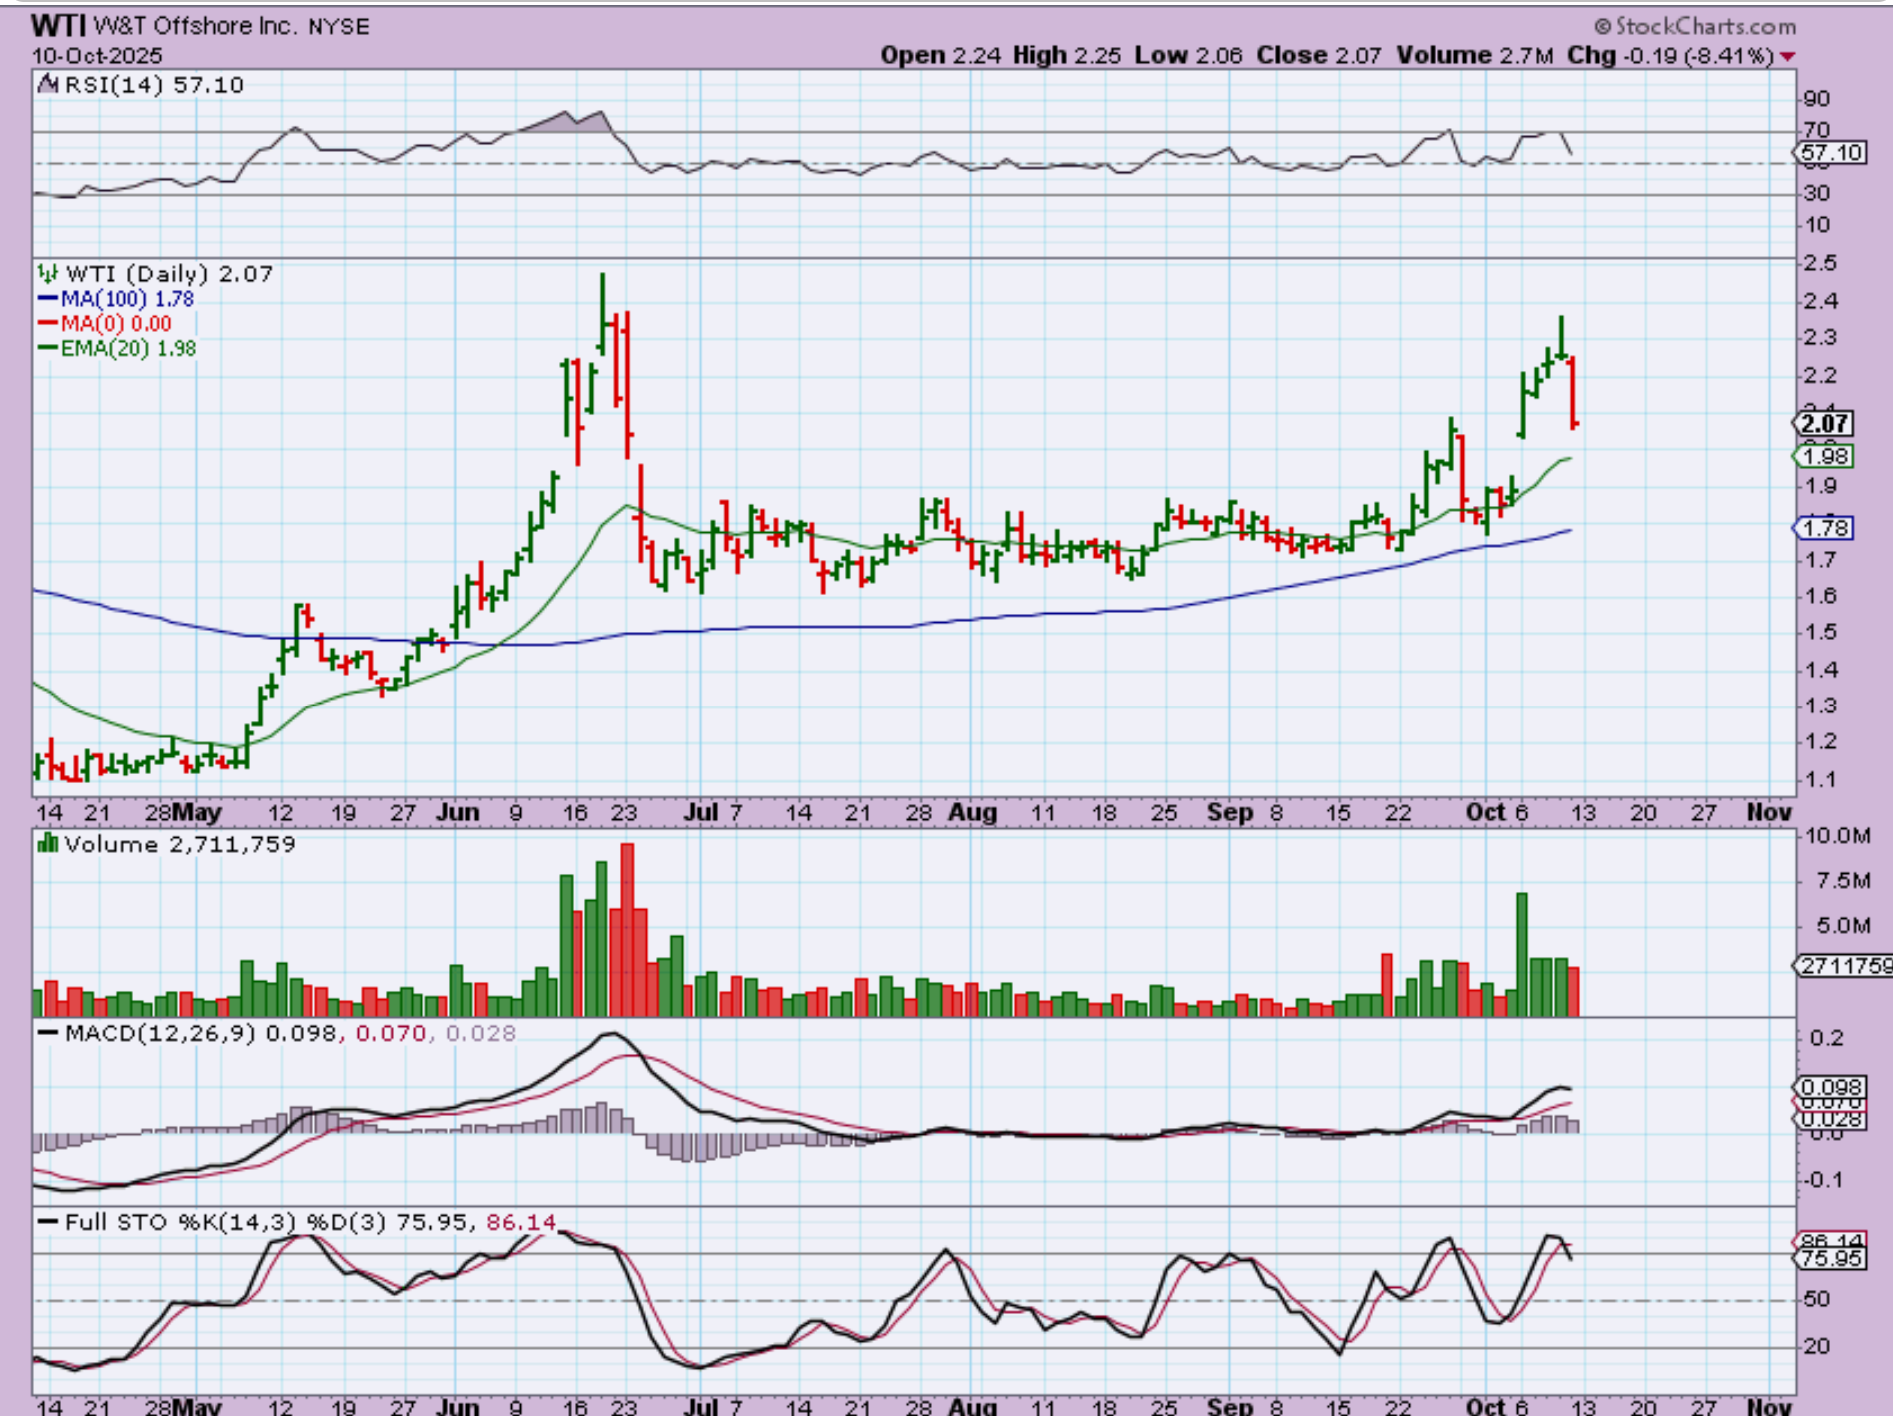
WTI : If Oil is breaking down and the general markets are going to sell off, I would be selling the once bullish looking Oil stocks.
.
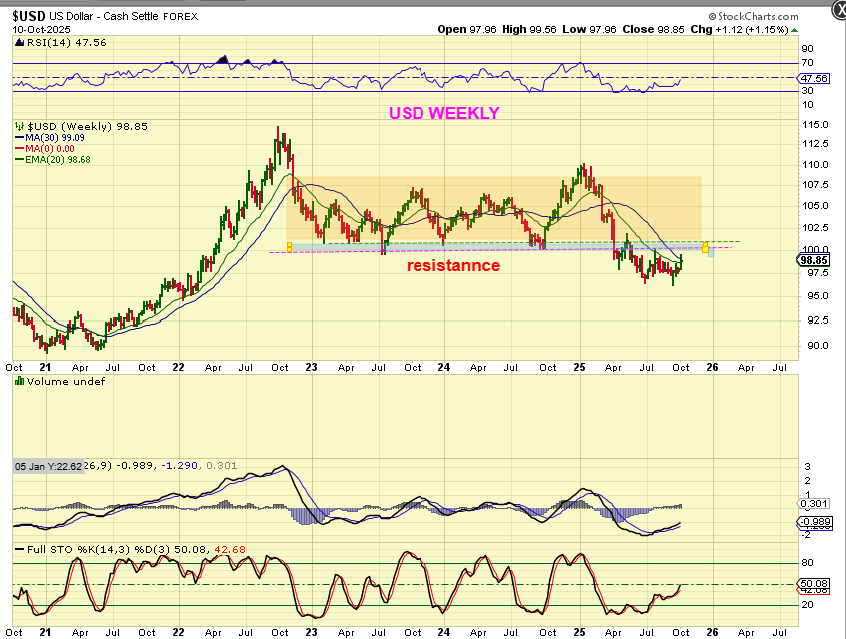
THE USD was Up this week, but it is still trending lower with lower highs and lower lows in all of that choppiness. It is at resistance, and in the daily charts I have been saying that I am watching to see if the USD can make a new higher high…or not. It is close.
.
GOLD was up another 3% this week and broke above $4000 ($4059). The break from that bullish triangle has sent prices higher week after week. So far this looks like it could continue higher, then drop and re-set, and then continue higher, but…
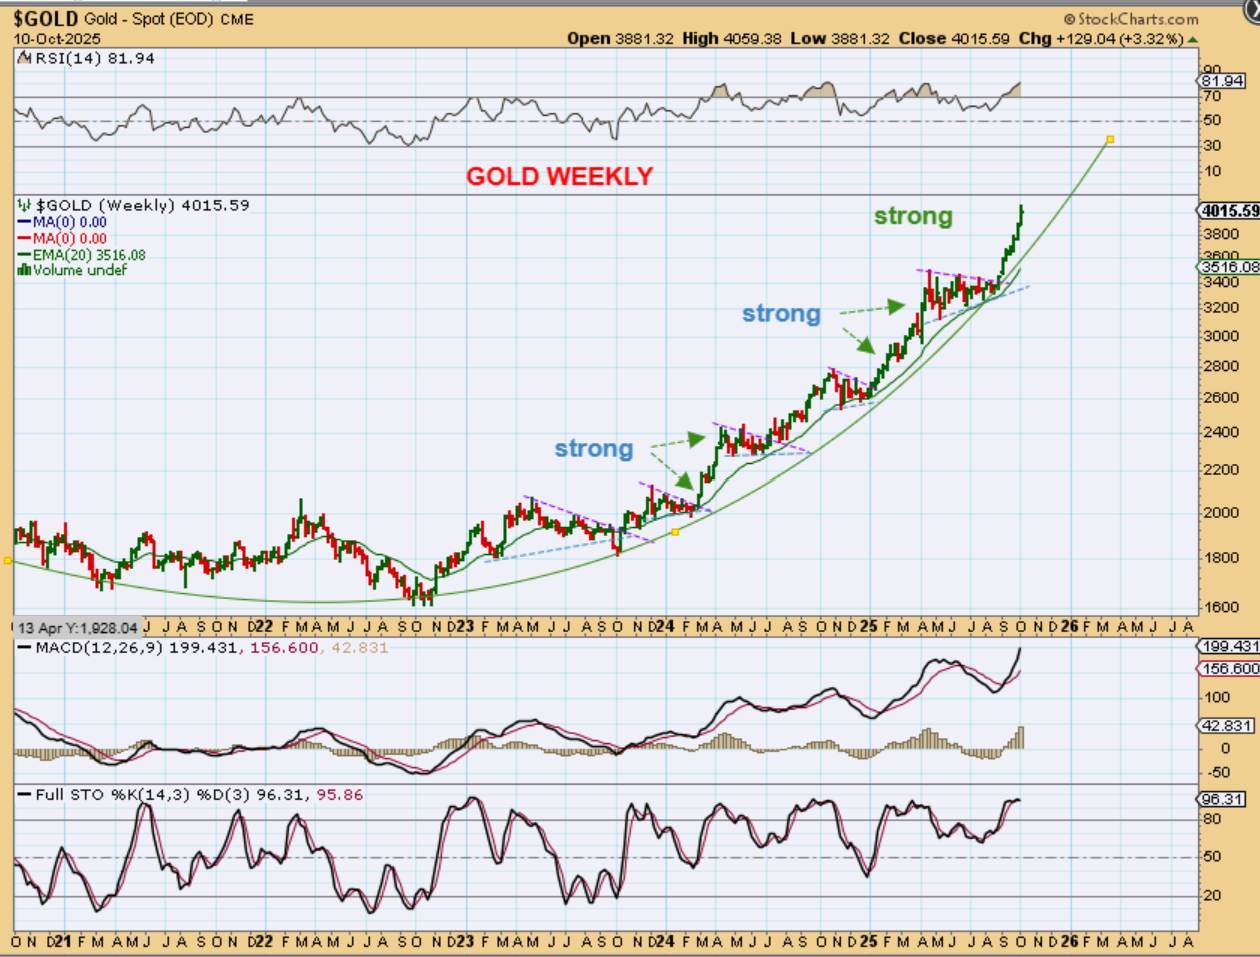
.
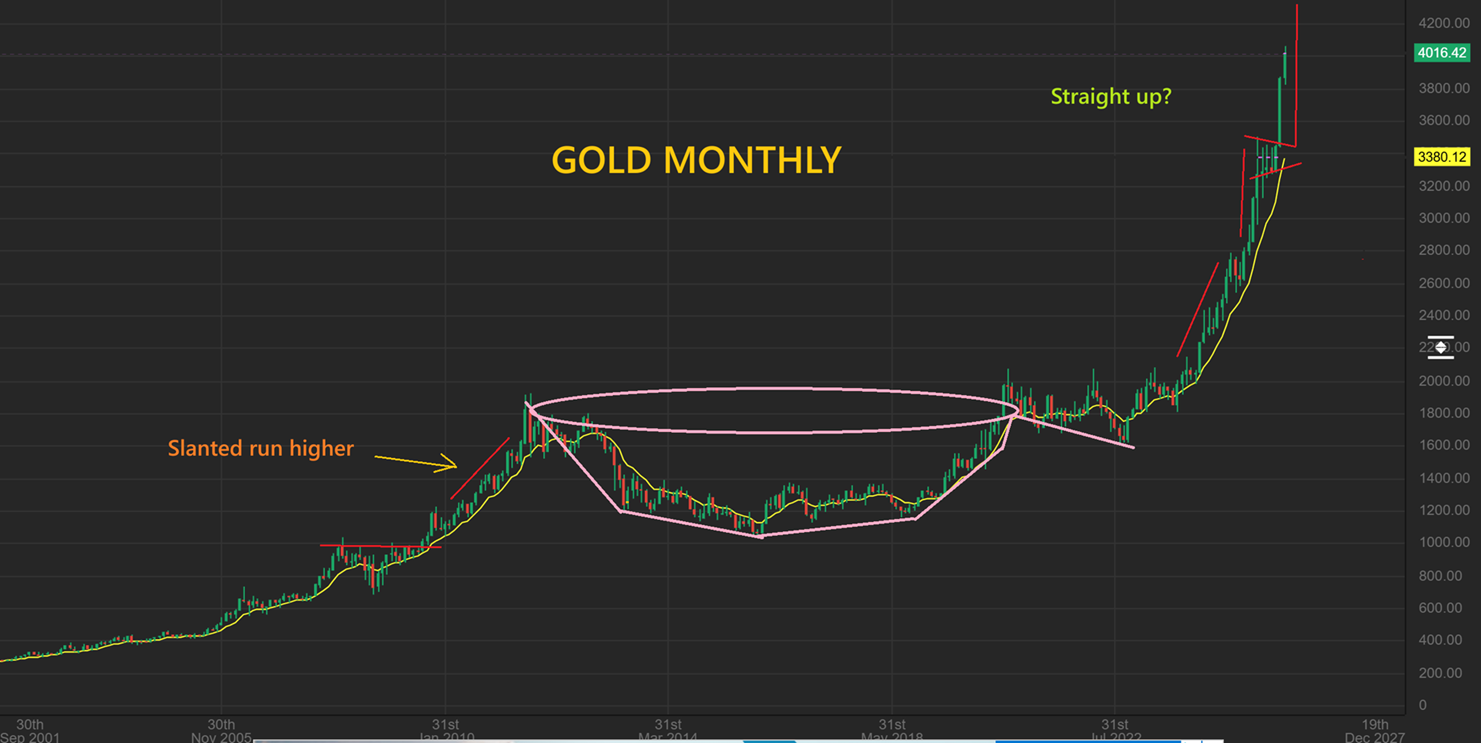
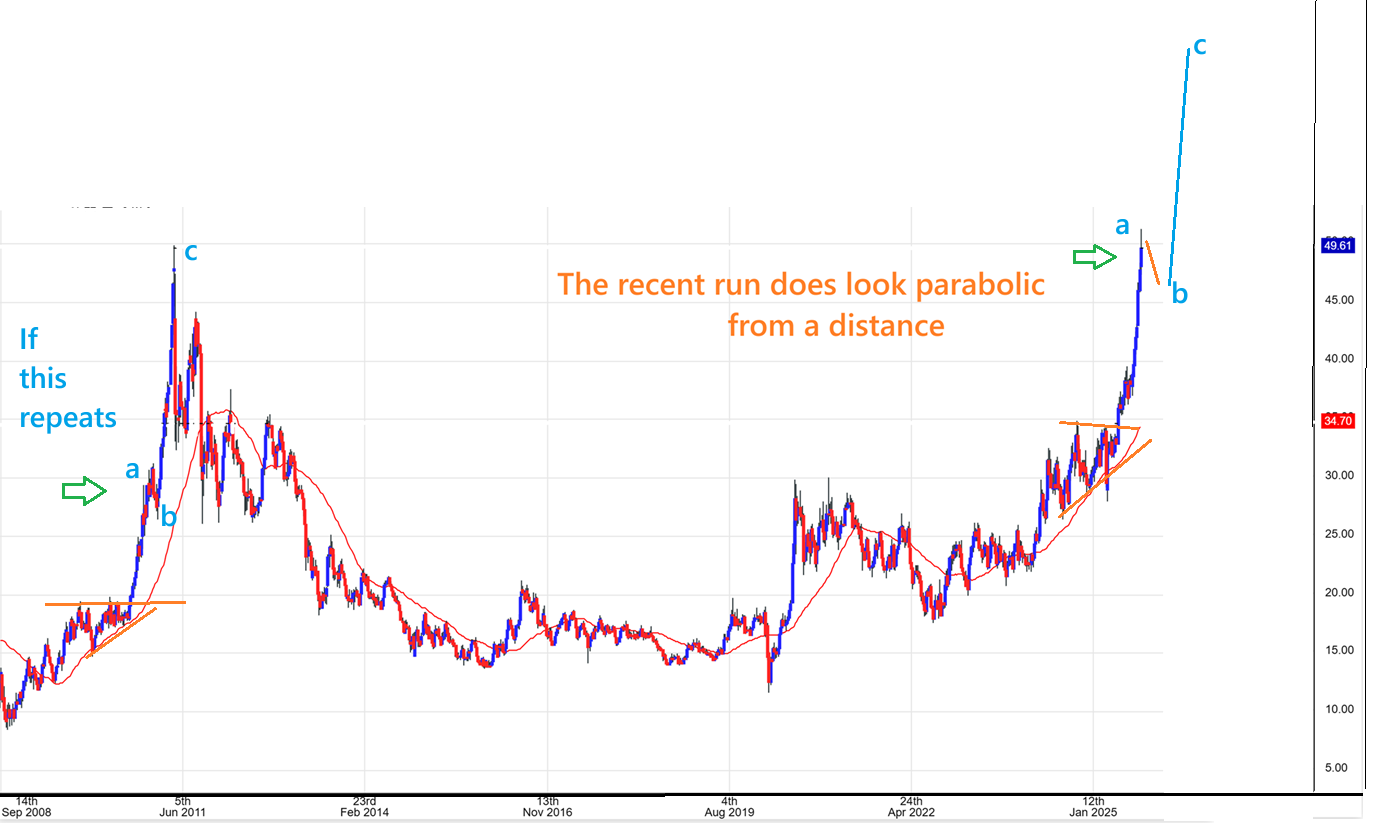
GOLD MONTHLY:
So far this looks like it could continue higher, then drop and re-set, and then continue higher. If it just keeps running to, let’s say, $5000 though, it may be in a parabolic blow off top. This is definitely looking parabolic compared to the run up to the peak in 20210-2011. I just noticed that Gold has basically doubled the measured move of a cup & handle price projection.
.
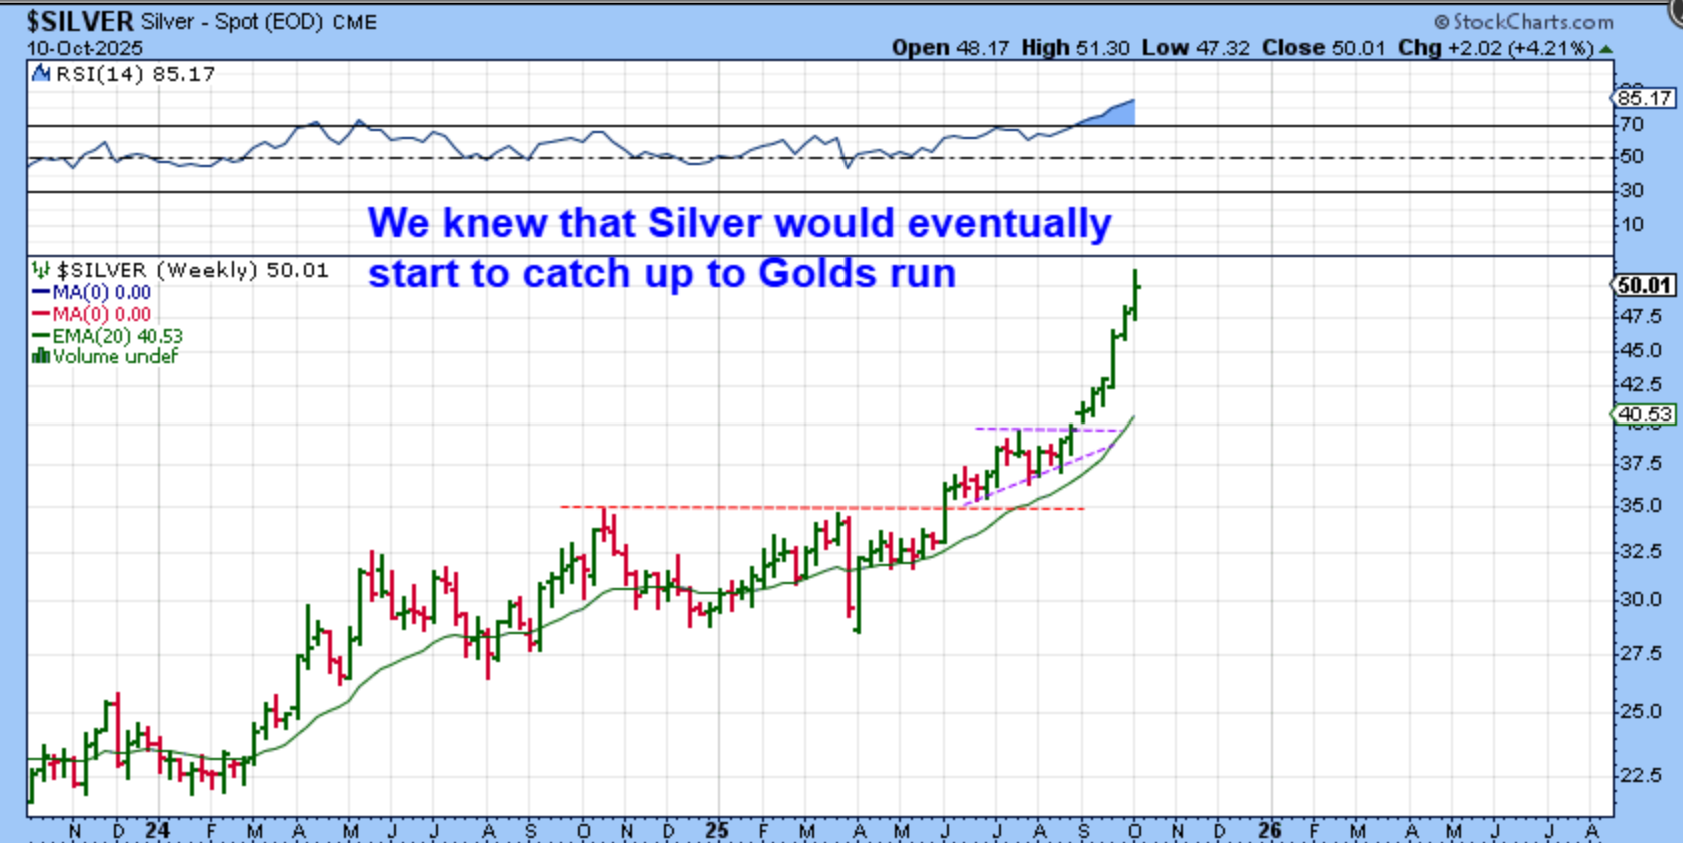
WHAT ABOUT SILVER? -We knew that Silver would start to kick it into gear with Gold running so strong, and it has done that. We saw Silver run up to that former high around $50 over the past 8 weeks, remaining green for 8 weeks in a row. This doesn’t quite look parabolic yet, right? I thought that it was starting to look parabolic, but then…
.
SILVER –
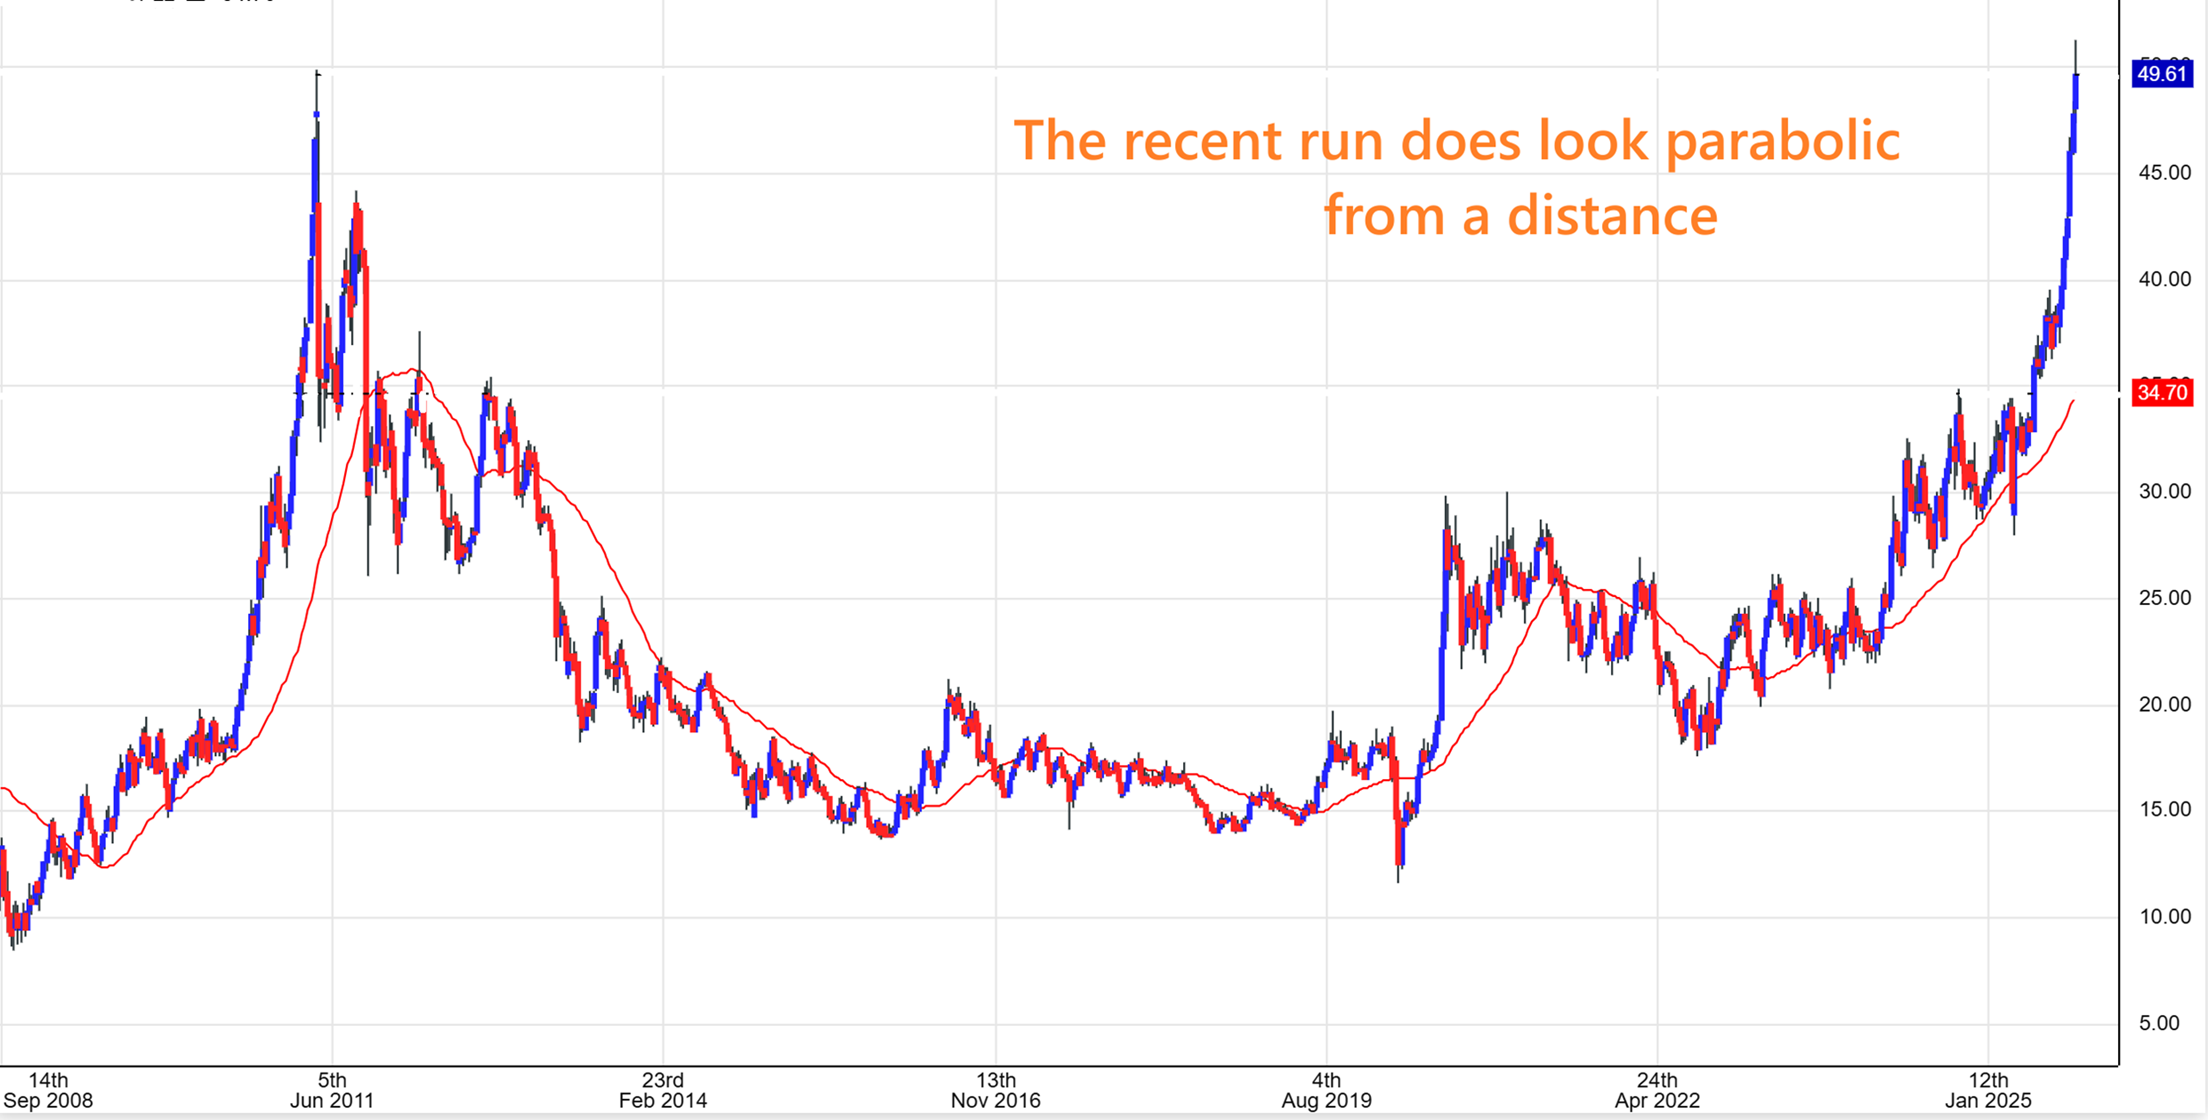
I thought that it was starting to look parabolic, but then I took a step back and it looks a bit different. This does look like a parabolic run to the former highs around $50. Can it go higher though? I do think that it can, after a pullback, and I’ll show you why…
.
SILVER – I took that last parabolic run up and added the extension after the pullback. I know that an a-b-c is usually a drop, so I should have drawn this as a A-B = C-D, but you get the point. I’m trying to show a valid possibility where this parabolic looking move to $50 could extend one more time. In the chart ABOVE, that move to $50 does look parabolic, but view below, we saw a longer looking 2 wave move in 2010.
.
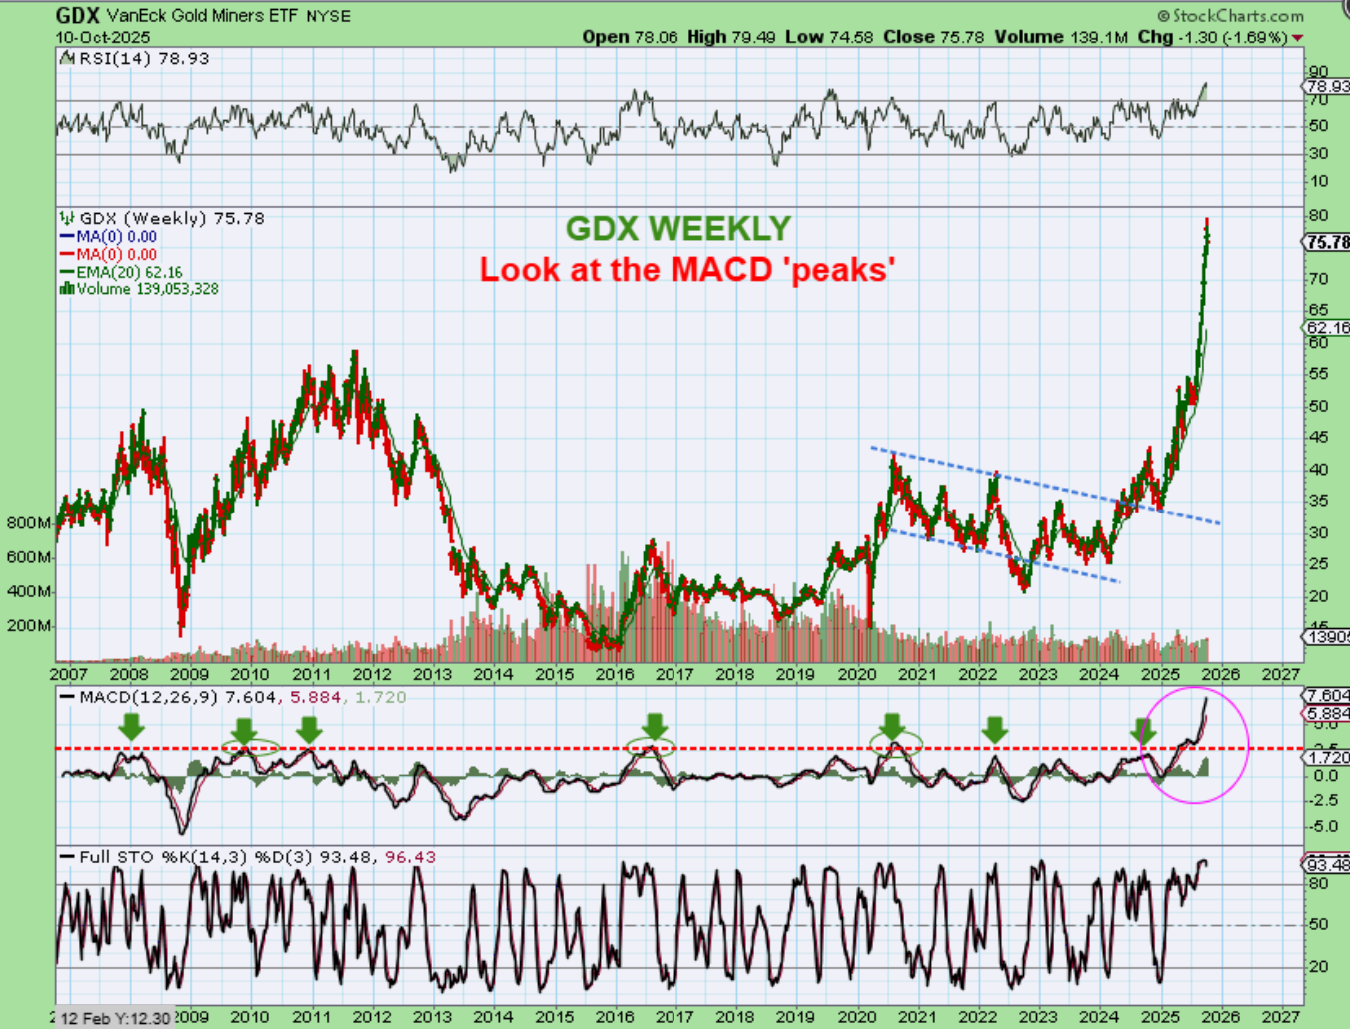
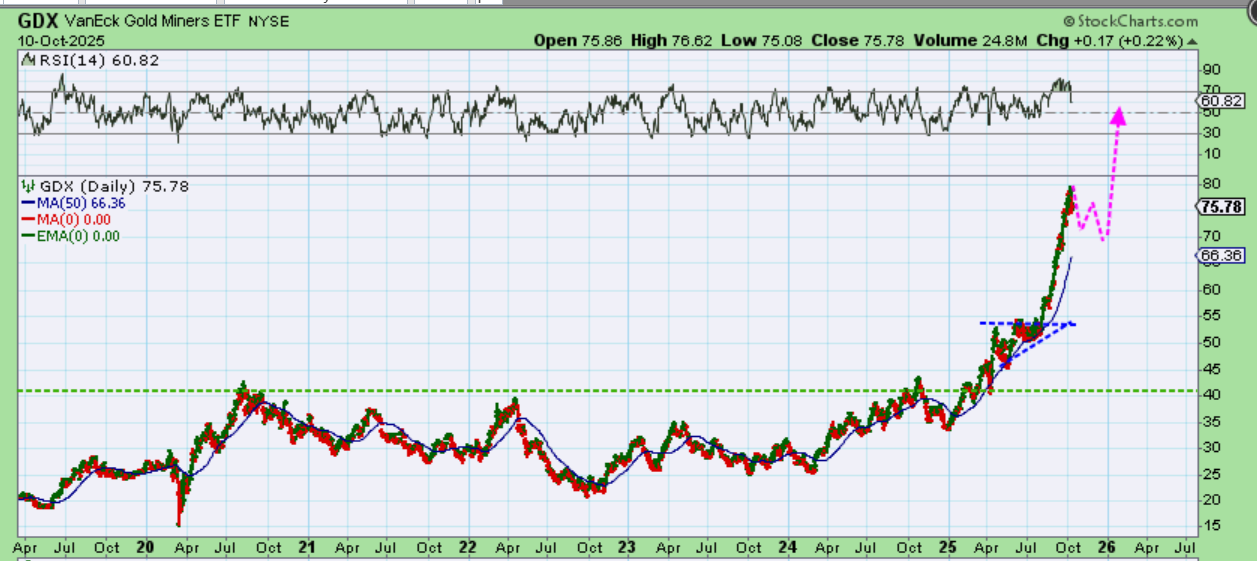
GDX WEEKLY – What can I say about this?
It looked parabolic when it ran from $50 to $65, but I said that I thought that it ‘could’ continue higher. It almost tagged $80 and it really looks parabolic in a big way now. Could it pull back or do a bull flag and then make another run? MAYBE. I can’t rule anything out, and I have seen Bitcoin run like that, but this is when things really start to look frothy. Look at those MACD ‘peaks’ compared to now. Let me show you something…
.
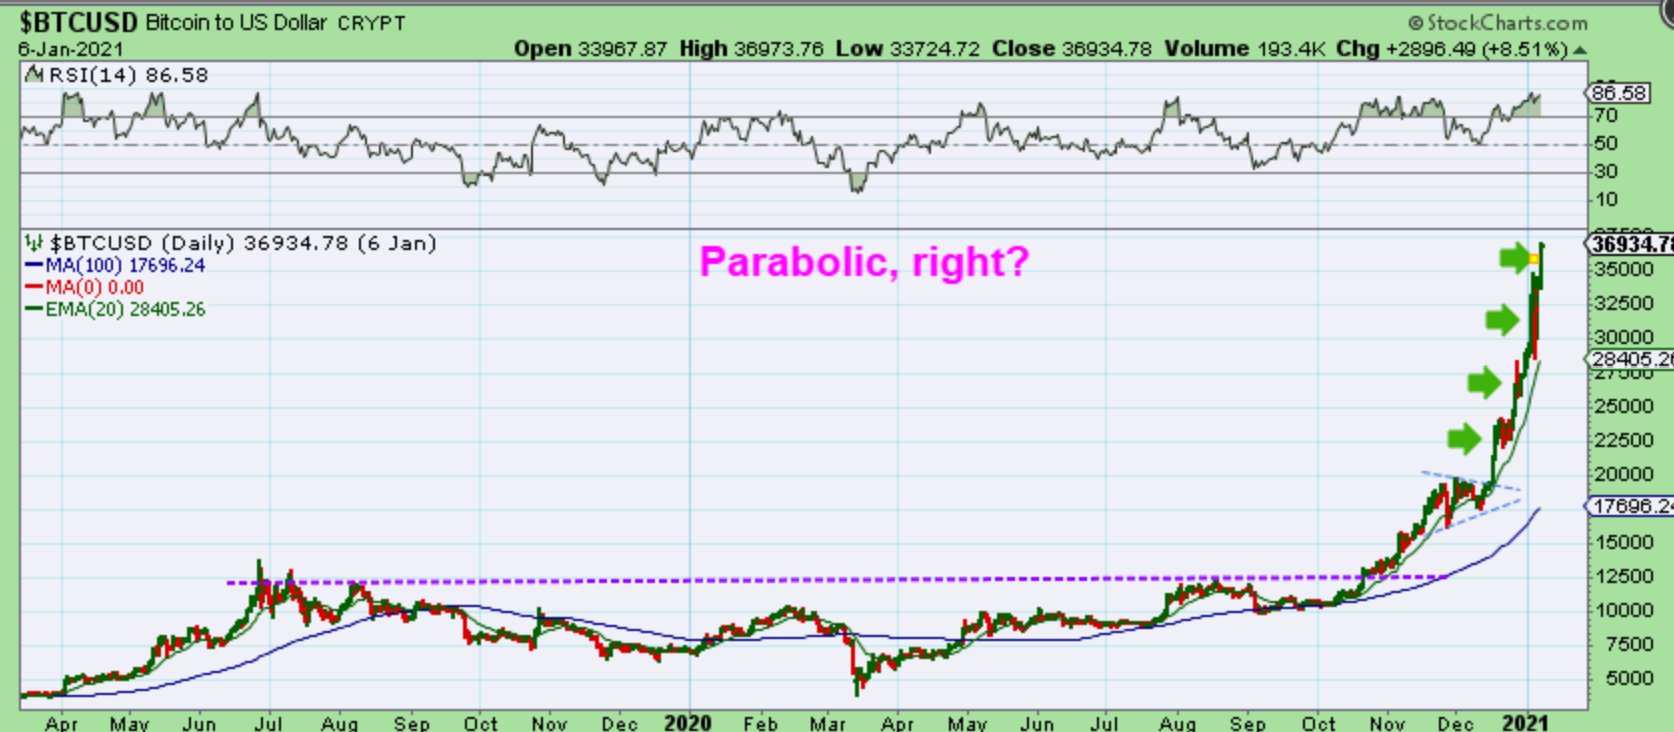
Let me show you something…
This is when Bitcoin started to go parabolic. This could be viewed as similar to precious metals now, so ‘Could this go higher’ if it paused , bull flagged, or reset sentiment?
.
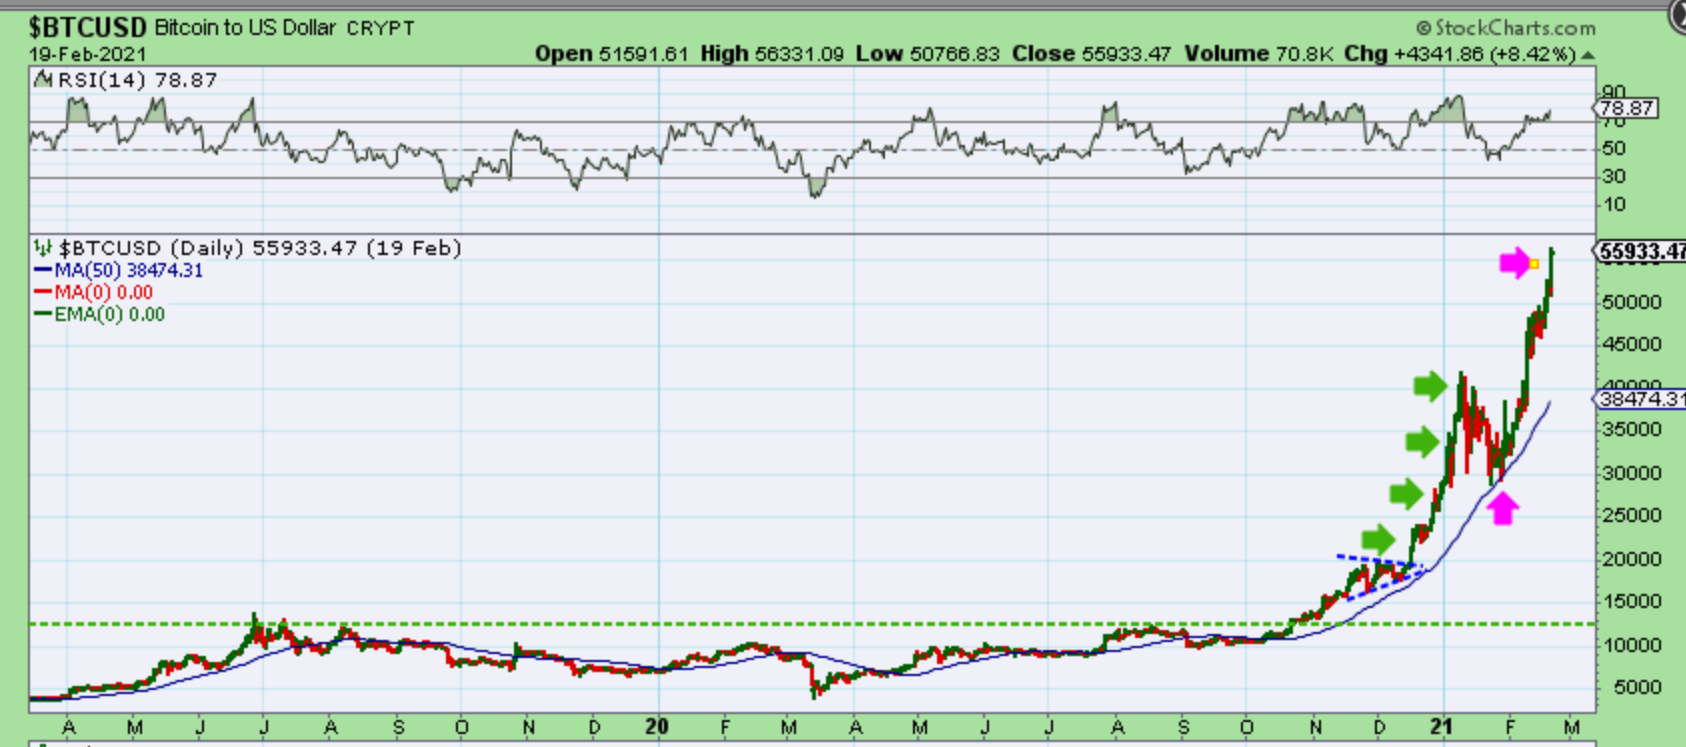
That is exactly what it did, and it did it within 1 months time.
.
So based on what I have seen in the past, especially on the above Bitcoin charts, I’m not going to say that it cannot continue to run after a dcl, but this is a parabolic looking run already. If it continues to run into the Fed Mtg at the end of October, I will probably be more inclined to call that a top. If it does what I have drawn here, then it could do 1 more post fed run to a parabolic blow off.
.
Yes, The bulls have been firmly in control, but I’m sure that you remember what I said at the end of my Friday morning report (Right before that crash down on Friday). I’m going to repeat the basic idea of what I said again here. I will highlight important parts and may add a thought too.
I said, “Here is where it becomes a balancing act. At this point of my report, I usually look at the charts and I say, ‘The Bulls remain fully in control’.”
.
Well, they still do, and I see many charts bullishly set up in the general markets, but at this time I am also starting to take note of the ‘timing’ and small signs of change that may be showing up in both the general markets and precious metals. The Charts are still very bullish, but using the IWM chart for cycle timing, I showed in todays report above that we hit day 48 out of the dcl. That means that a dip into a dcl is coming due. Maybe in the day 55ish area. That being said…
The general markets should also be coming due for a dip into another ICL soon too. Why? Well, ICLs usually come in 5-7 months after the last ICL, and we had an ICL in April 7th. We are on Month 6.
And now here is my point: Do you want to ride positions lower and hope that it is just a mild dip into an ICL, like 2020? Do you want to sell some and ride some? Maybe sell 50%, ride 50%? Maybe sell 70%, ride 30%, looking to re-enter after the fed Mtg? Maybe sell it all, lock in the gains and know that you will not make any money or lose any money until the Fed mtg or lows appear? That is a set of personal decisions that I leave with you, and you can use Fridays report and this report to help you to see what may be ahead and decide how you want to play it. I often go to cash, knowing that I can get back in when the time come. Also, we know that parabolic tops can crash quickly too, so keep that in mind.
Enjoy your weekend everyone! 🙂
.
~ALEX
.
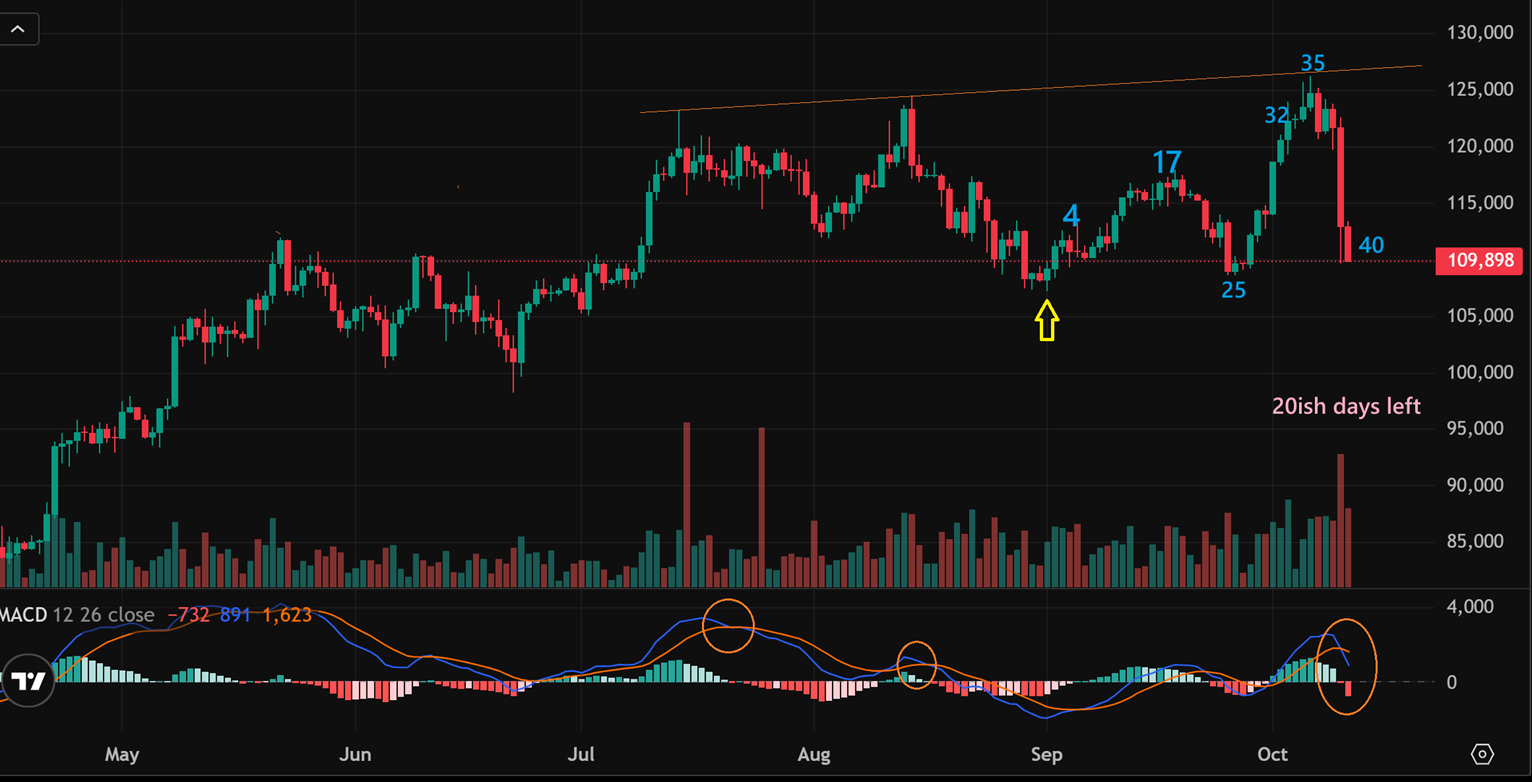
BITCOIN rolled over with the general markets and it is only on day 40, so we have plenty of time to either break the lows and fail, or recover from this drop. The MACD crossed lower, so we might be heading down to a new low with the general markets. It was doing very well, rallied out of day 25 back to new highs, but in the last 2 days of trading (Friday and now Saturday), it looks ugly. Do you see any other candle on here that looks as foreboding as Fridays? THAT day stands out.
.
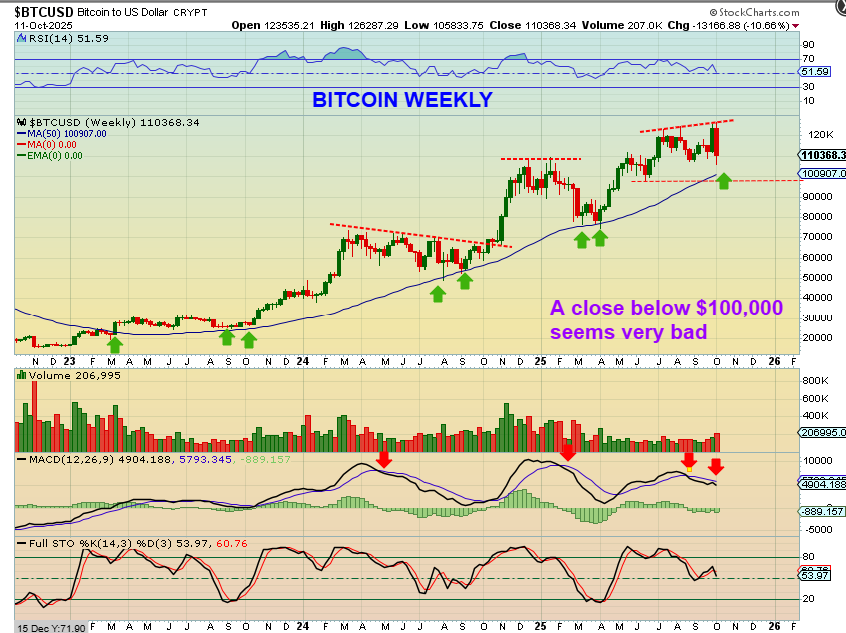
BITCOIN WEEKLY – That drop off of the highs curled the weekly MACD lower as a ‘rejection kiss’ instead of a ‘cross higher’. We have ‘time’ to sell off since we are on day 40 and the stochastics has room to drop too. The 50week ma has acted as support in our last 2 drops, so we’ll see what happens there. A drop to an ICL and then 1 more run for year 3 of this 4 year cycle? If so, Crypto stocks will fly. Or is this the top and the price will now drop—below that 50 week ma? If so, crypto stocks may get crushed, since they trade rapidly in whatever direction Bitcoin or Ethereum is heading. As a guide, a weekly close below $100,000 seems bad, to me.
.
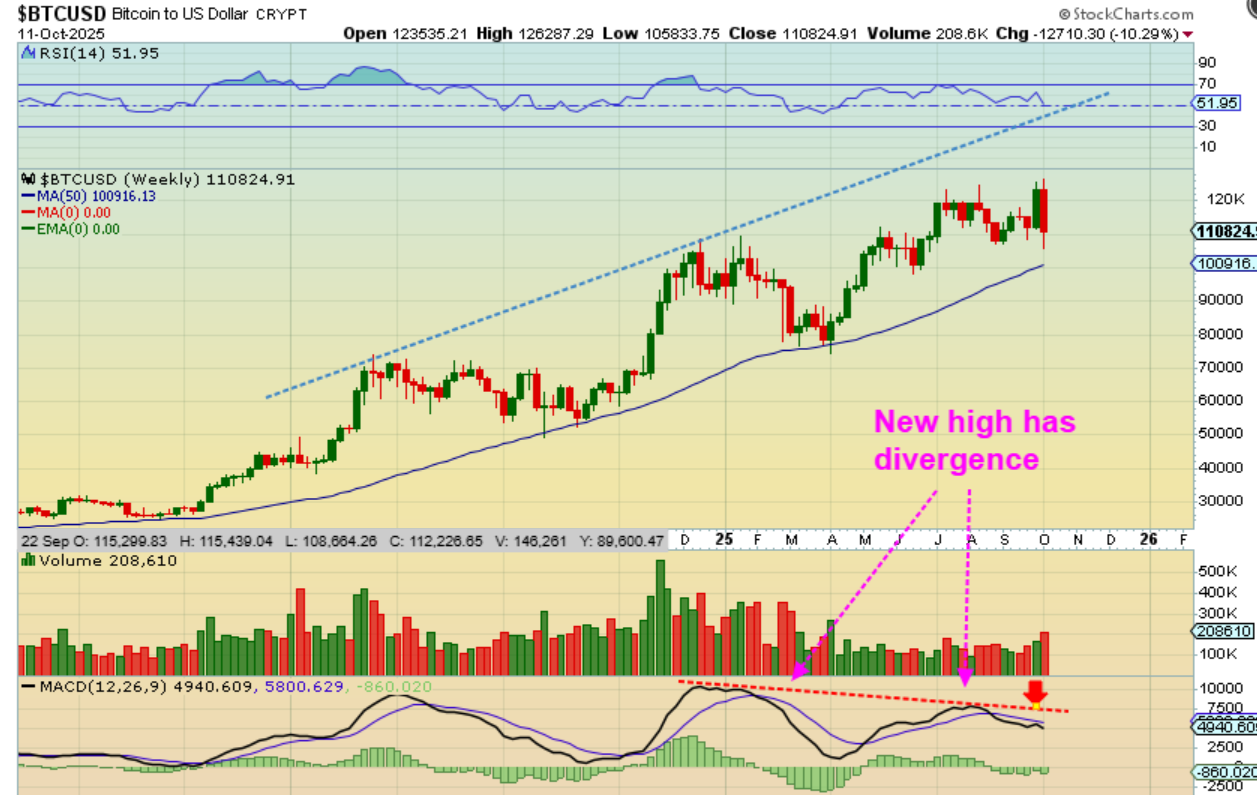
In the recent past, I have pointed out the divergence at new all-time highs as slightly concerning too, and that hasn’t changed at this point. It’s just something to watch, but I don’t expect it to change. If Bitcoin puts in an ICL and rallies to new all-time highs for a final 2025 3rd year rally, I expect divergence and then it will peak. If it peaks right here and now and the highs are in, then we have divergence and it makes sense there too. I’d like to see one more run personally.
.
IMPORTANT REVIEW!
This is very similar to what we are seeing in the markets right now. The ICL in 2020 bottomed in March and peaked in September, and this year we bottomed in April, and likely just peaked in October. Now look at that very mild drop into an ICL. It was a choppy mess, and I do see an a-b-c down. The rally then continued and all of those bullish charts became great buying opportunities, so there is hope that we get that after the Fed Mtg.

