September 20 Weekend Review – What Is Parabolic?
.
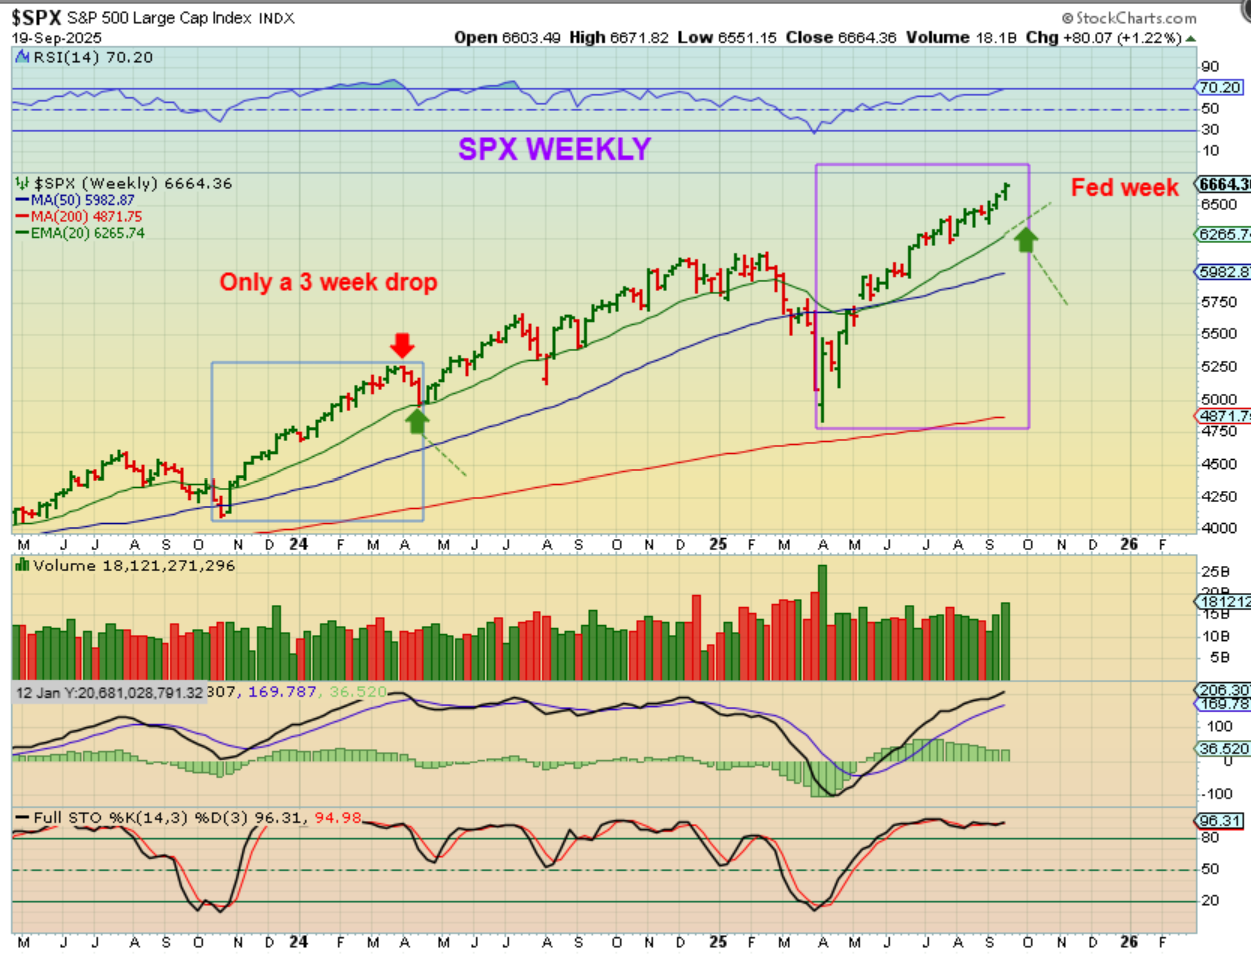
SPX – As I have been pointing out, this run is very long and looks a lot like the run out of the Oct 2023 ICL. After a deep or prolonged sell off, the sellers are ‘out’ and the buyers just keep flooding in. That said, we really are due for a peak and a drop soon timewise. That 2023 drop only lasted 3 weeks. We are in a very bullish environment so maybe this will run longer than 20243, but I am just saying that this is already one of the longer intermediate cycles in recent times.
.
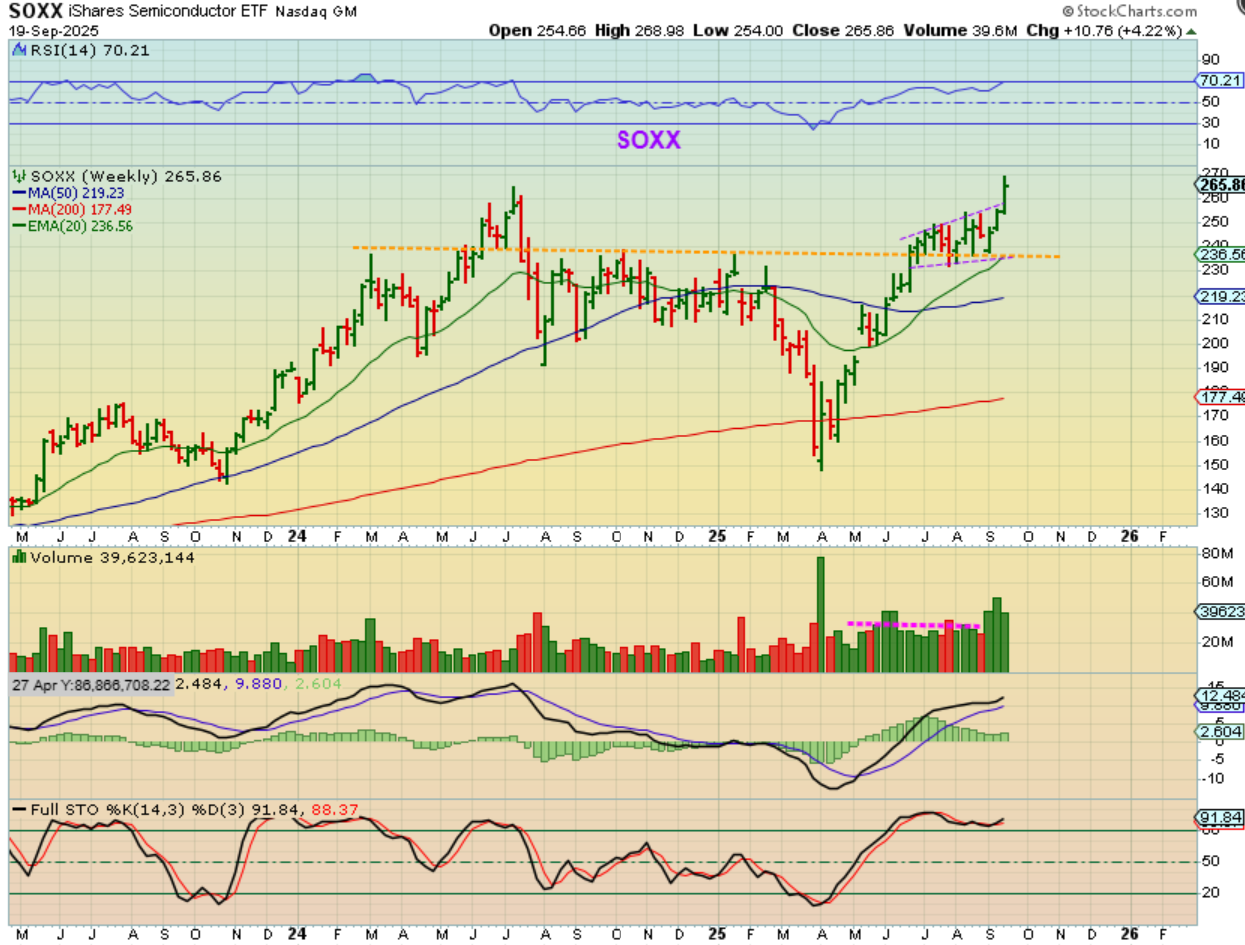
SOXX WEEKLY – A few weeks ago I mentioned that I saw heavy volume coming in for the Semiconductors, so we might want to expect a good push higher. WHY? Well, the SOXX was lagging the markets then, and it was not above prior highs like the SPX & NASDAQ. They were at new all-time highs. So, I did point out that the SOXX looked like it wanted to catch up and break to new highs too. It has done that.
Conclusion for the General Markets: These markets have been very bullish and strong, and set-up after set-up has played out nicely. That being said, I feel that ‘timewise’ we need to keep in the back of our minds that a pull back is coming due. I feel that we should drop into an ICL into October, but for now surprises have been to the upside so we just raise stops and remain alert to any changes.
.
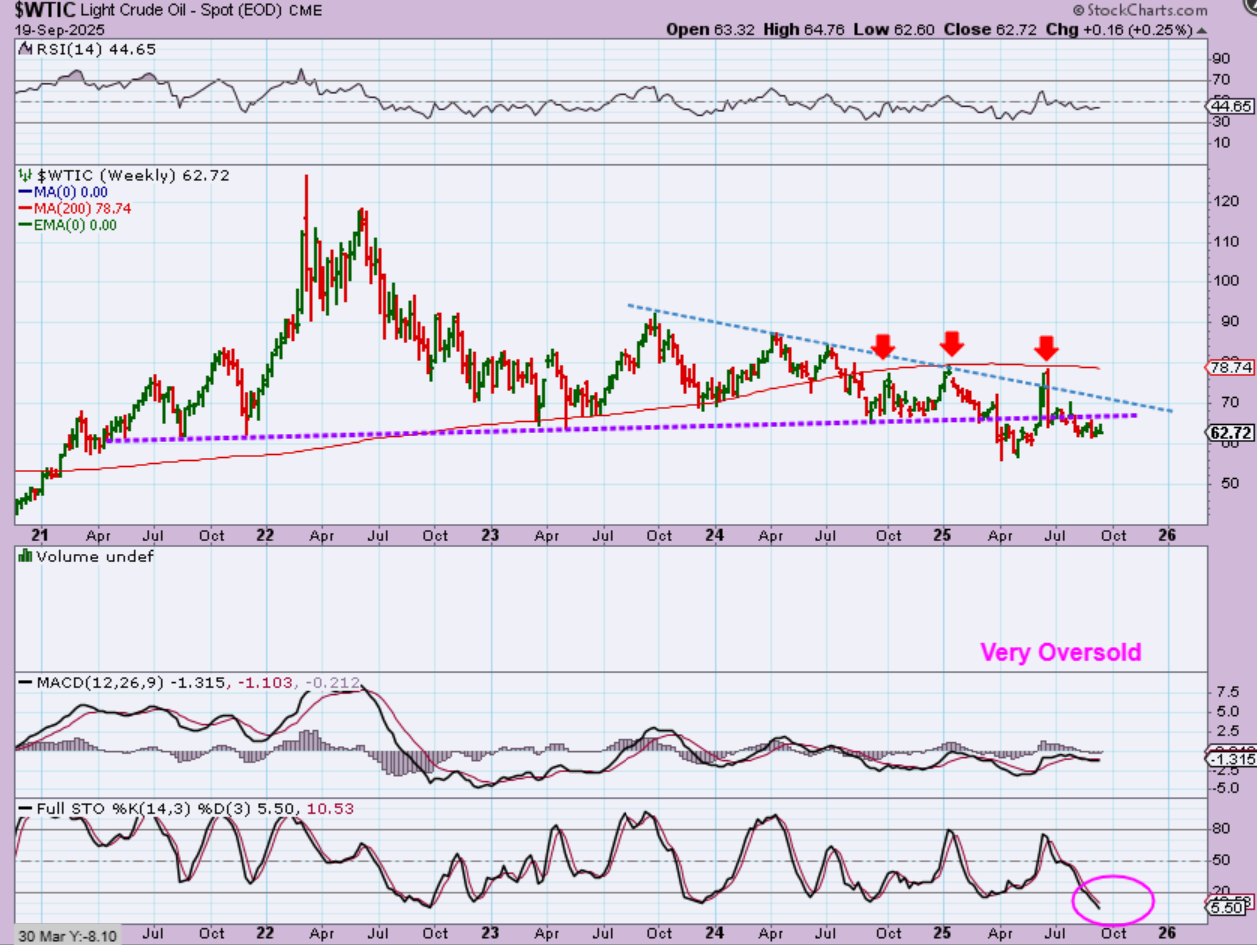
WTIC – Oil still has not recovered that break of long-term support. It is extremely oversold though and this higher low has bullish features, so Oil may start to try to regain that resistance area again.
.
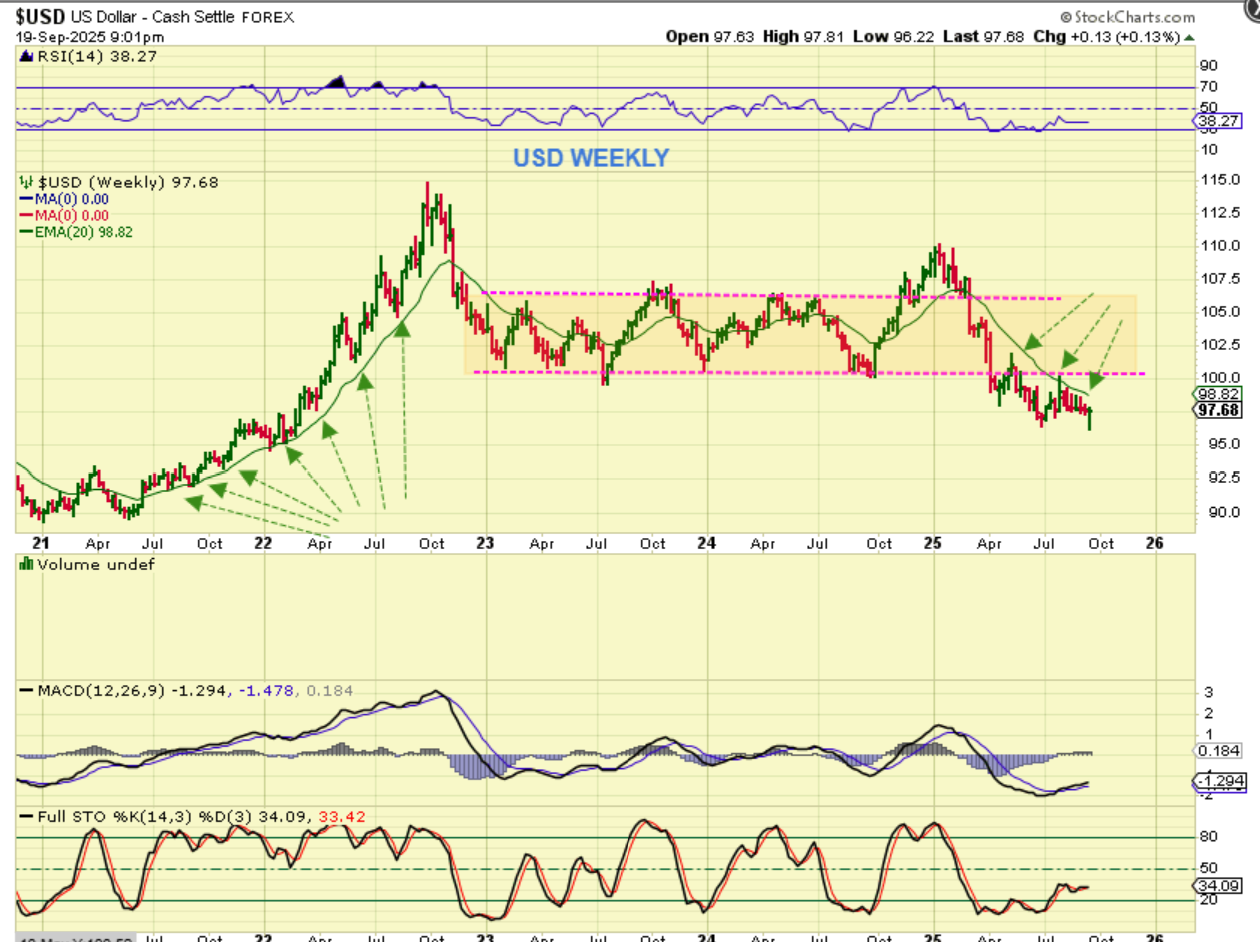
THE USD also broke below long-term support and we have watched it try to recover twice, but it has failed at the green 20 week ma. We got a reversal candle with the Fed rate cut, so we’ll watch the USD try to push higher once again. IN THE PAST ATTEMPTS…
.
USD WEEKLY:
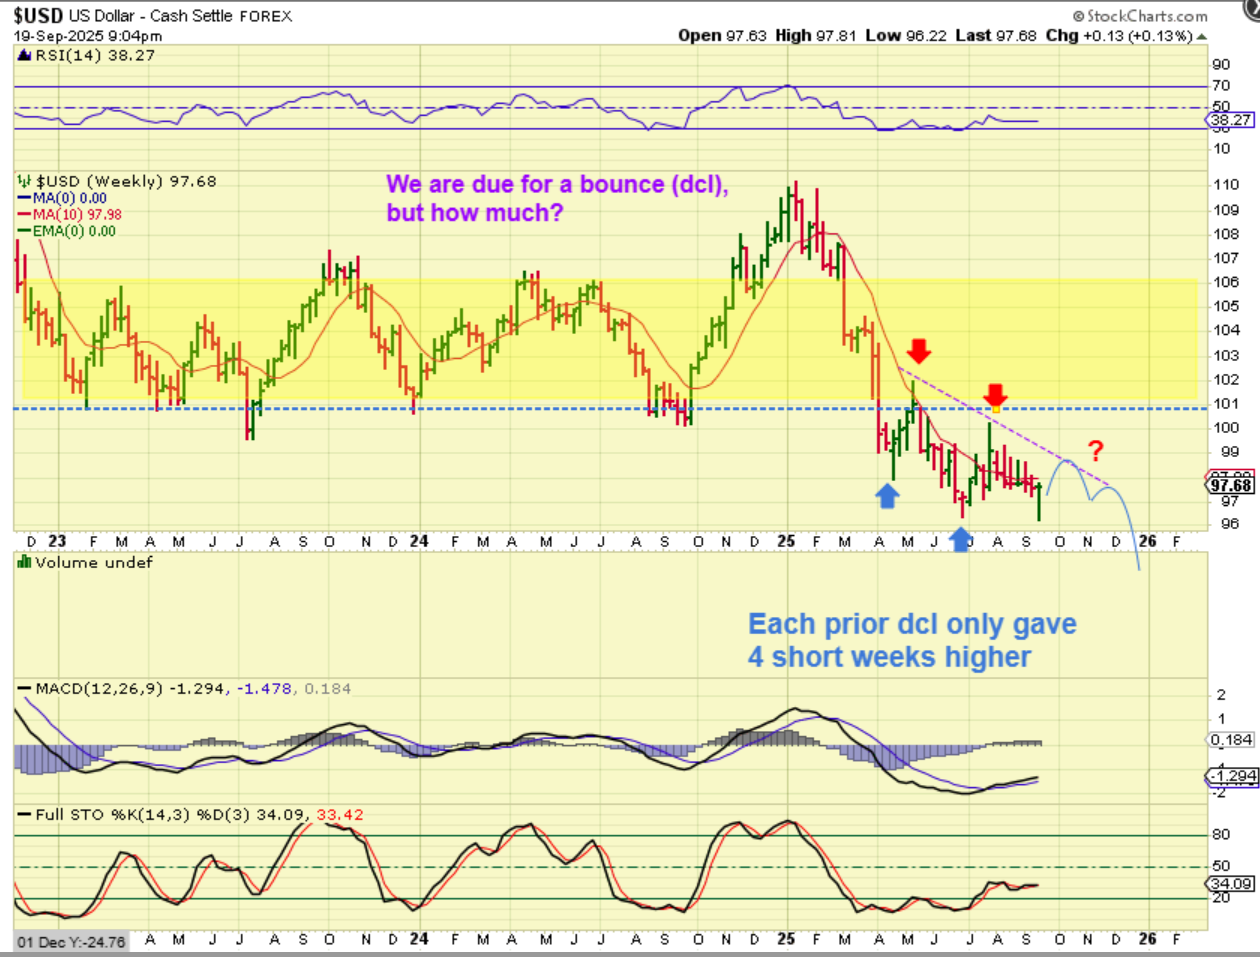
We have a reversal candle and IN THE PAST ATTEMPTS, you can see that it only had 4 week moves higher and then it rolled over again. This has been helping Gold to continue higher too.
.
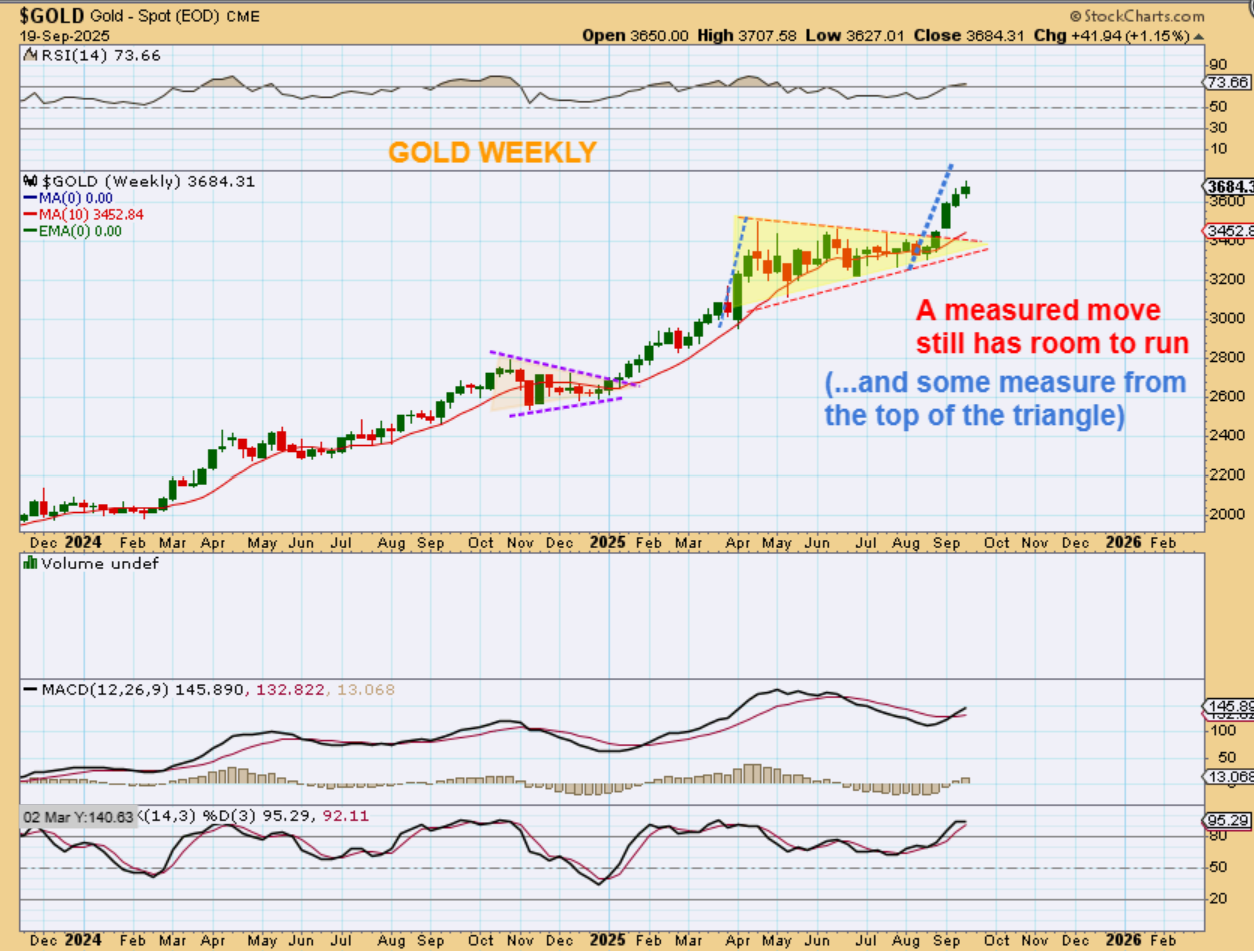
GOLD WEEKLY – The USD looks ready to bounce, but Golds measure ed move can run higher and we didn’t get a reversal lower when the USD gave us a reversal higher, right? This break from the triangle could be a stealth ICL and if this just continues higher, we could see a parabolic move. I also do have a bit of a concern about the miners going parabolic. I’ll discuss that shortly.
.
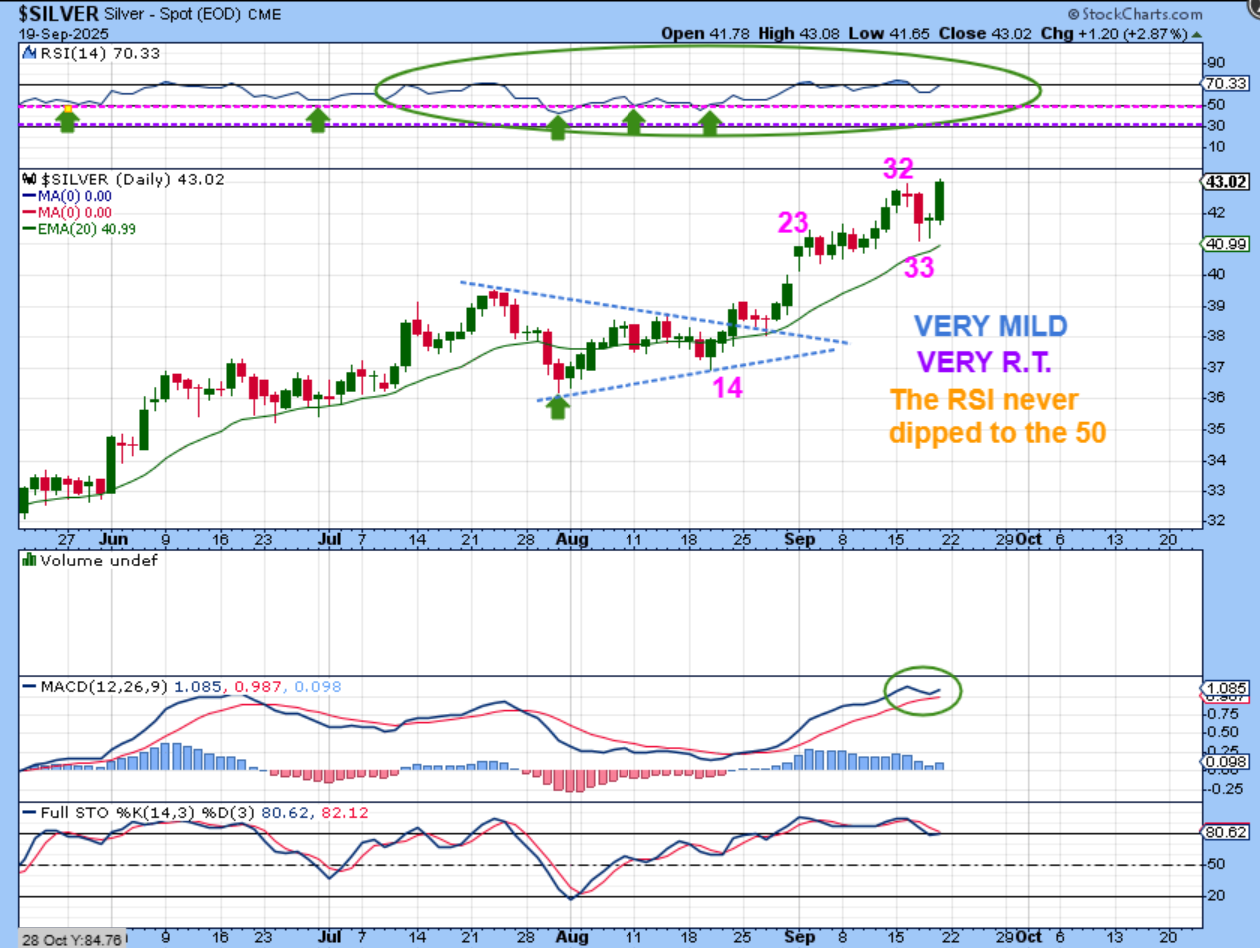
I took a look at The SILVER DAILY CHART again and I couldn’t help but take note of that RSI. We just had a day 33 dip followed by a reversal and the RSI never even came close to the 50% line. That is a very shallow/mild dip for a dcl. We all know how Silver can go Straight Up when it runs, right? Well, if this is a dcl and Gold is ready to continue higher, than it just might be time for Silver to ramp almost straight up too. We’ll see, but this is very strong for 5 months out of an ICL.
.
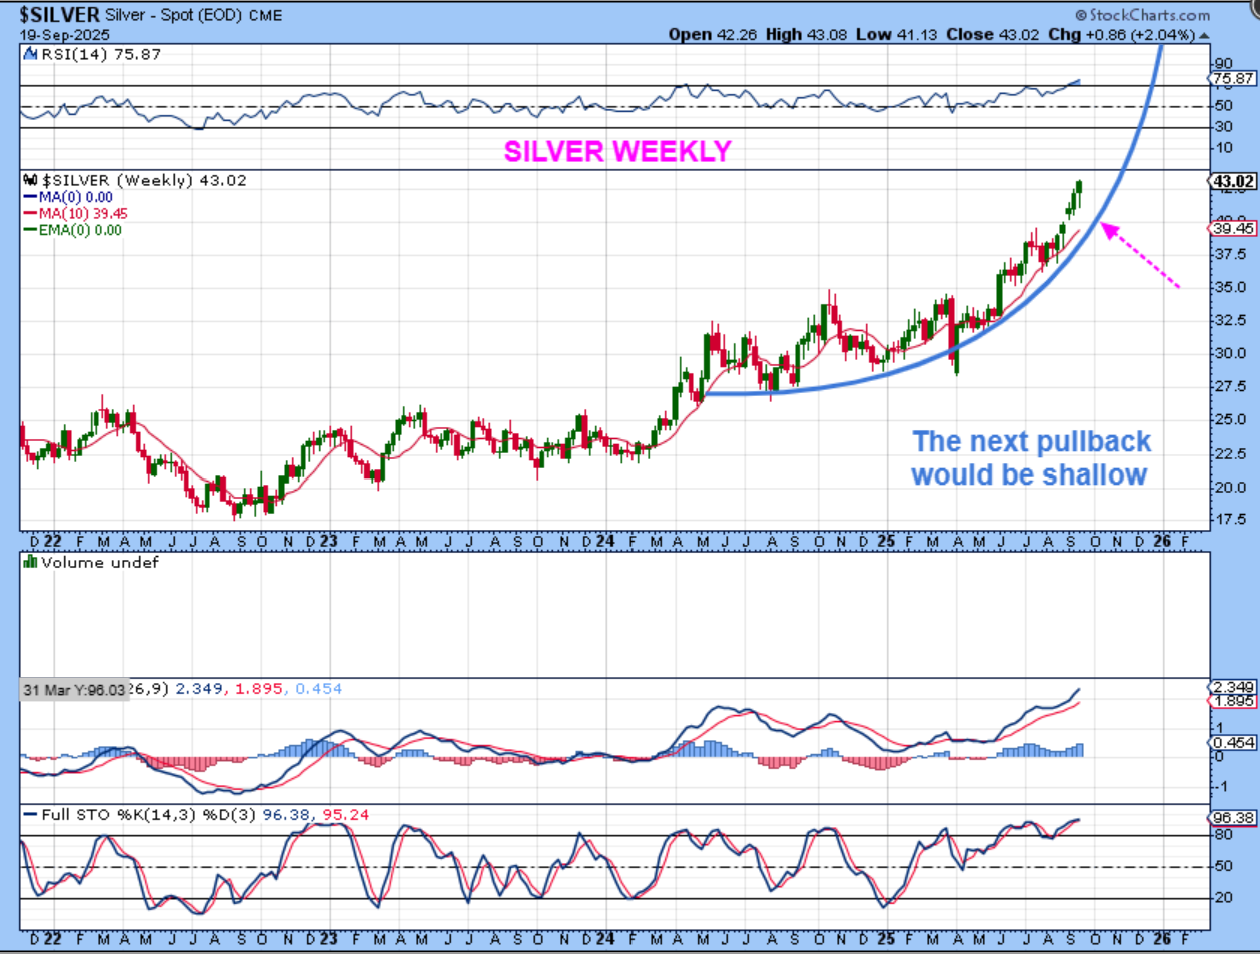
SILVER WEEKLY– So is there any hint of a possible parabolic straight up run coming out of Silver in the weekly chart? Yes, we already have 5 straight green weeks. Silver might just run straight up from here (If not, and we don’t go parabolic, the next dip would likely be shallow too).
.
If GOLD goes parabolic, and Silver ramps up to parabolic, my next logical question would be: ‘Do the Miners show any signs of that too?’.
.
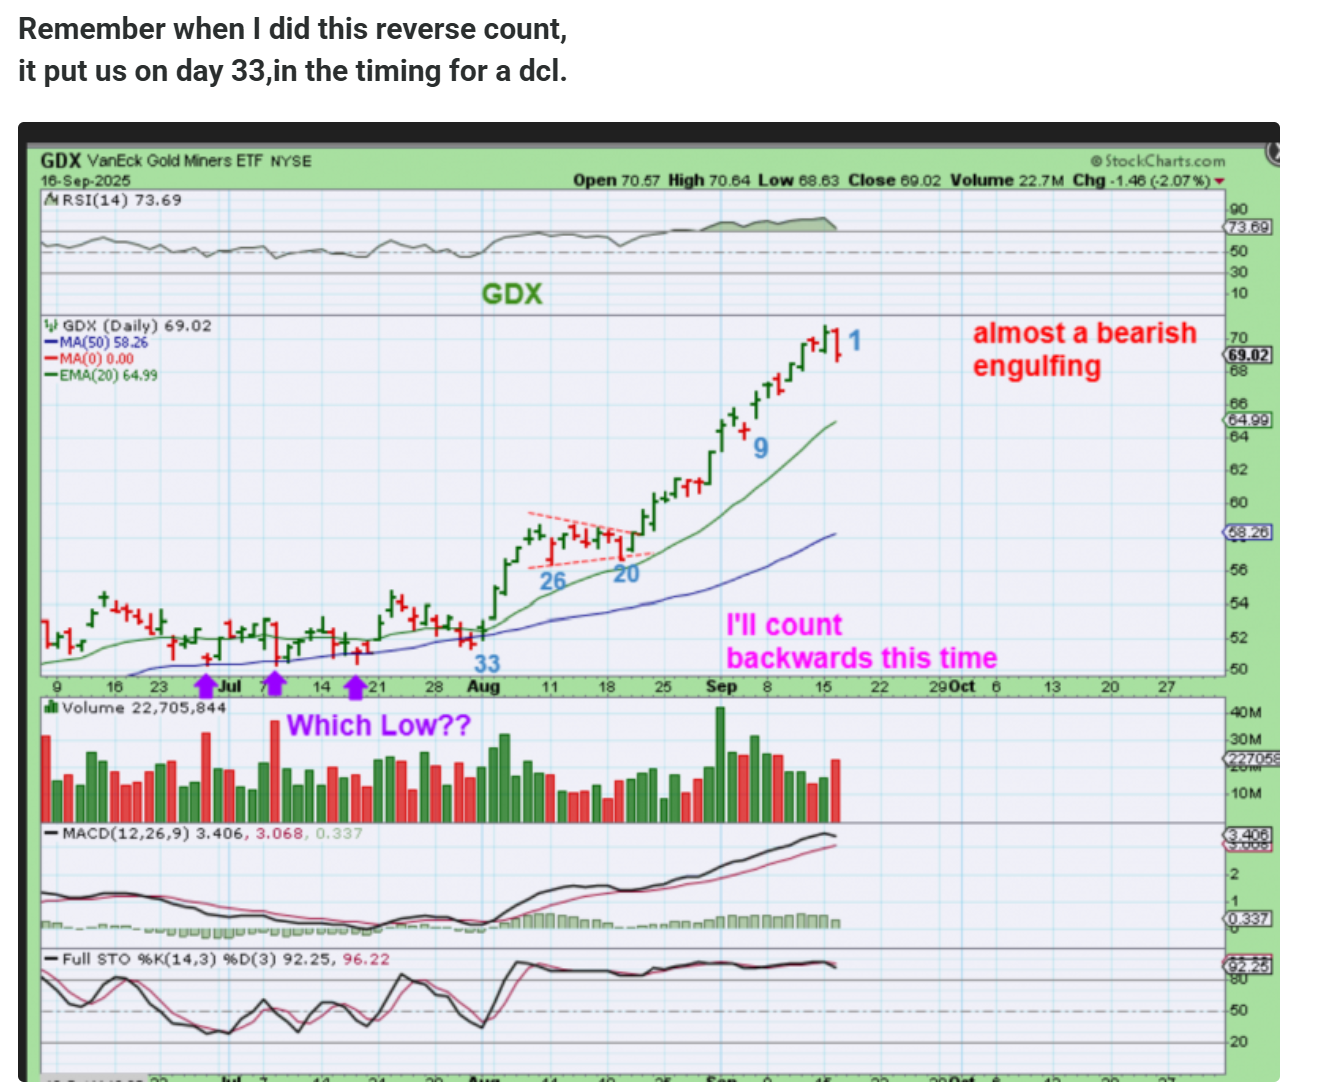
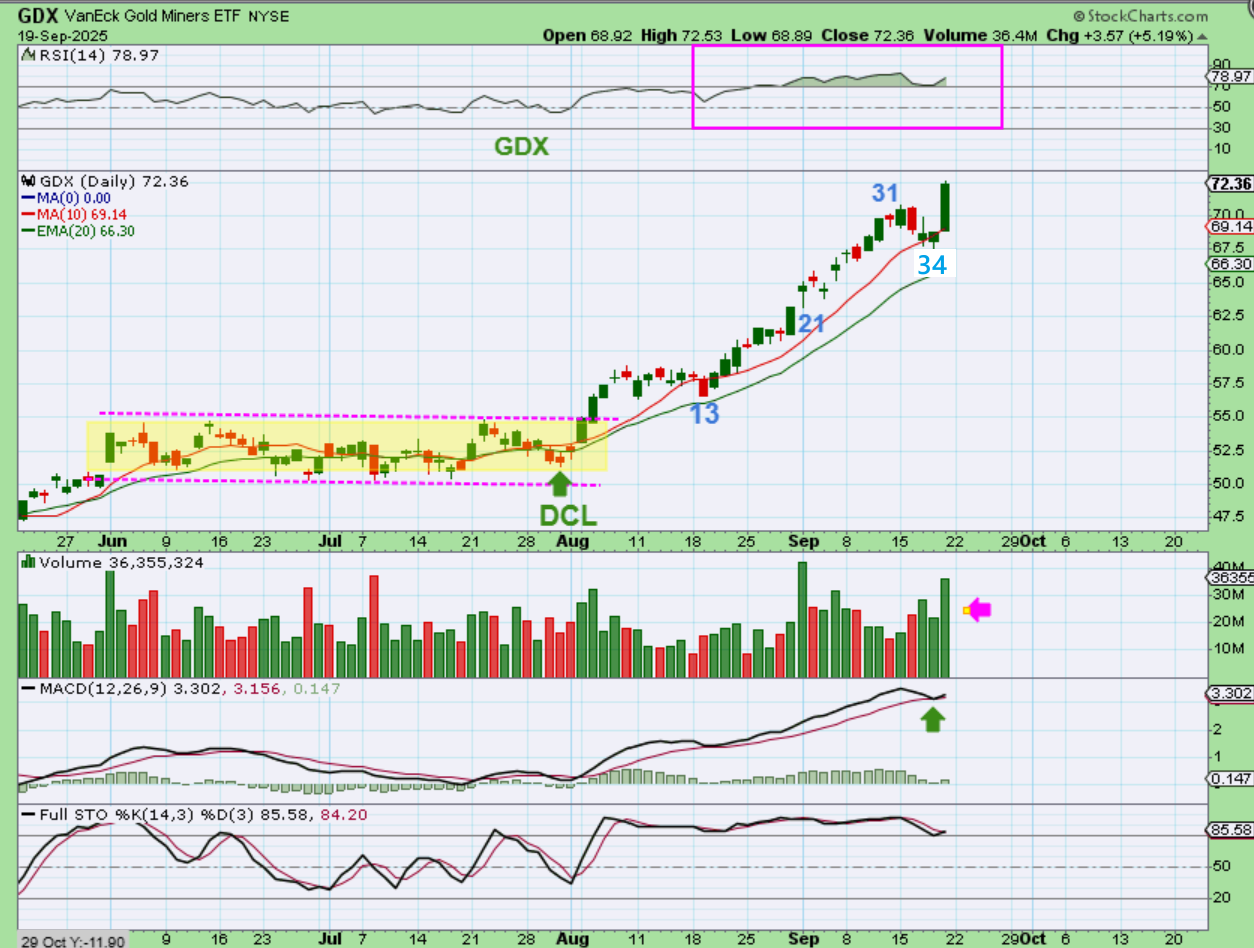
In a recent report, I tried to get a count for GDX by doing it in reverse, since the lows were Very Choppy and difficult to spot THE low or DCL. See the chart: I found day 33 at a low, so we would be very close to dcl timing. I would not use that day 33 low as THE low counting forward…
.
GDX – Using that low to count forward, we just had a day 34 low and a large 5% candle rising out of that low. We have a dcl. The RSI on the GDX is stronger than the RSI on Silver. That dip into a dcl did not even pull it below 70! So my next question would logically be…
.
So are there any signs of a possible parabolic move in Miners taking place?
.
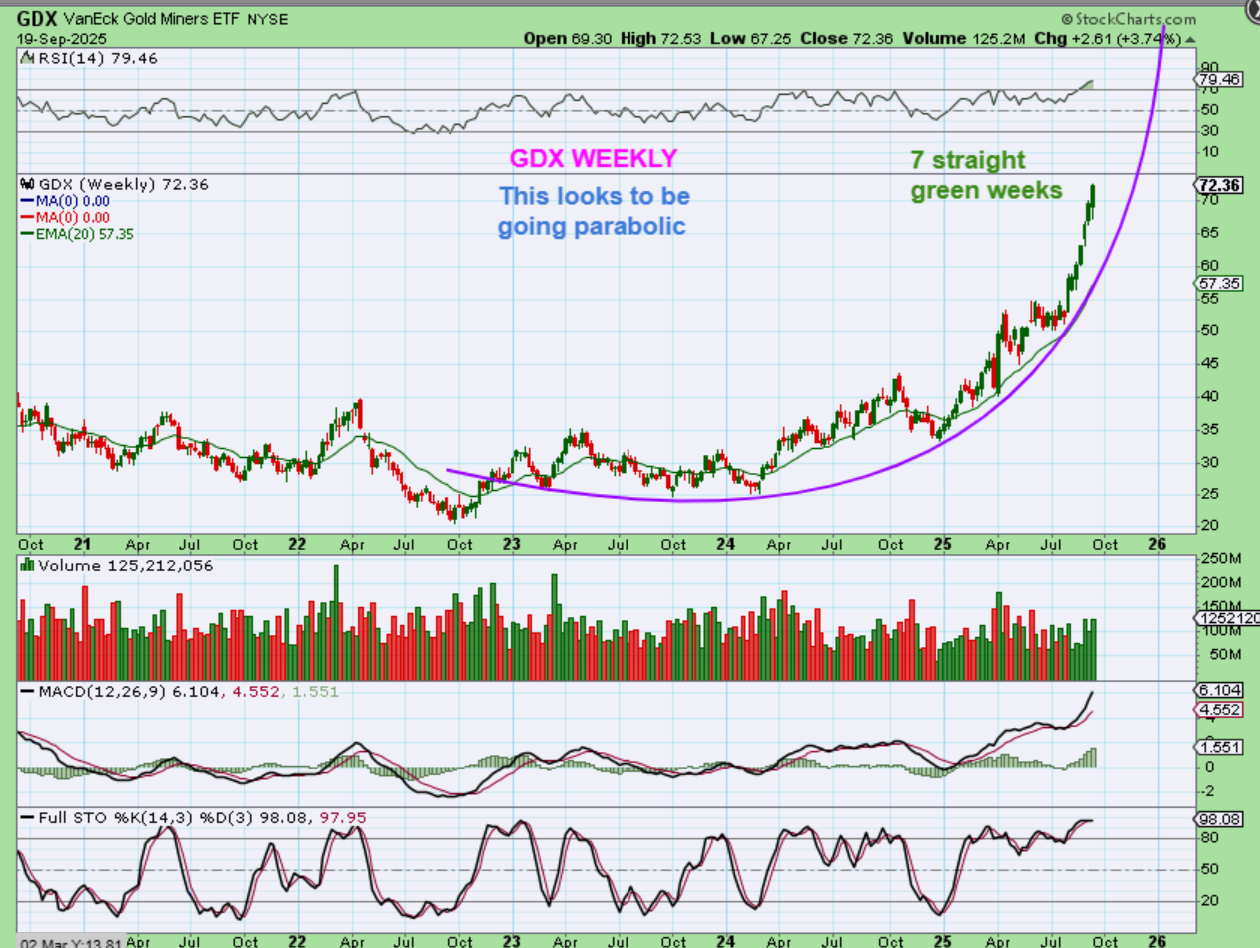
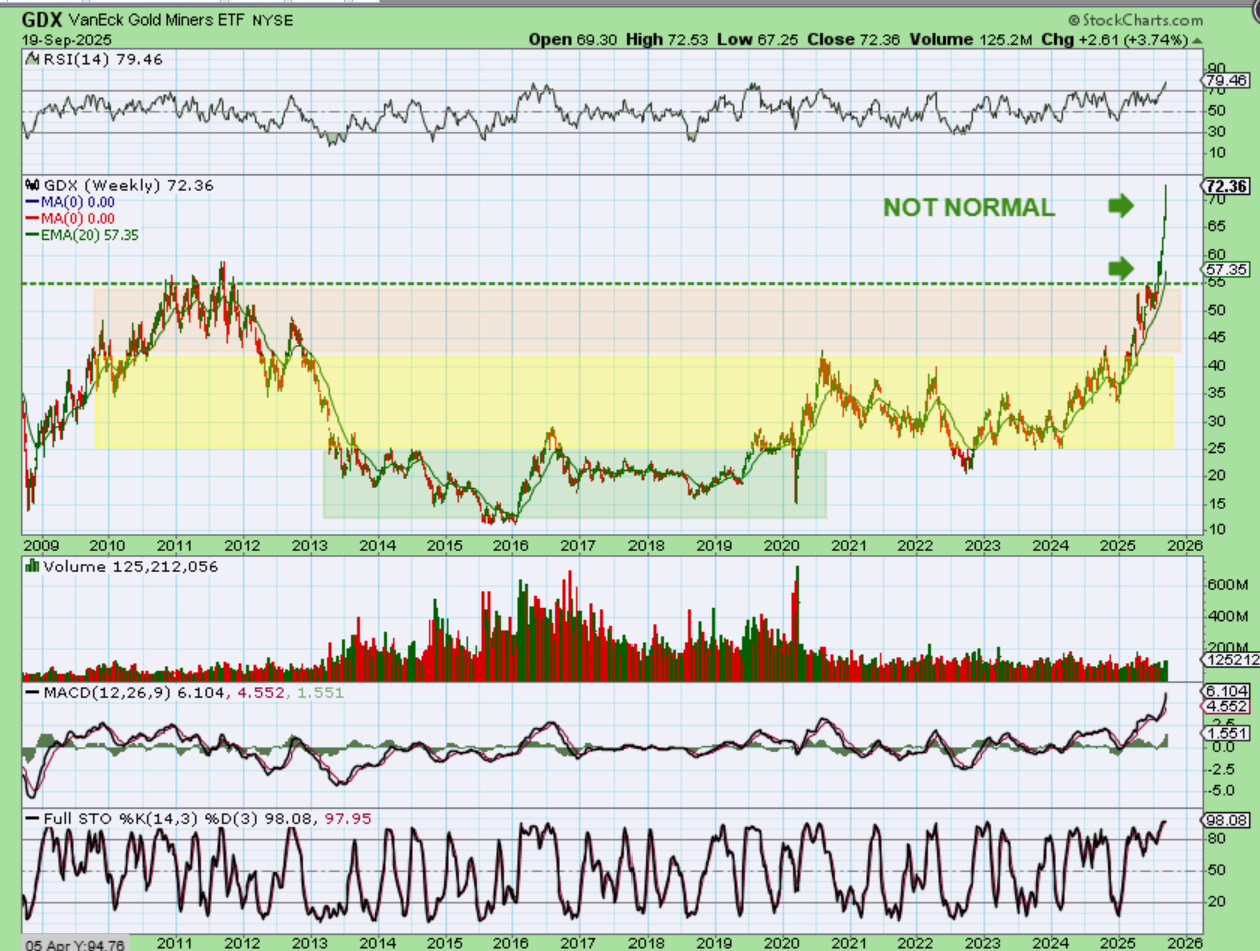
Oh My! Yes, there definitely is. GDX has made 7 straight weeks of gains and the gains aren’t exactly small. A couple of weeks ago I warned that we could see a parabolic move start to unfold (I preferred a dip into an ICL first, but I have to just report what I am seeing). August and September has been straight up Green every week.
.
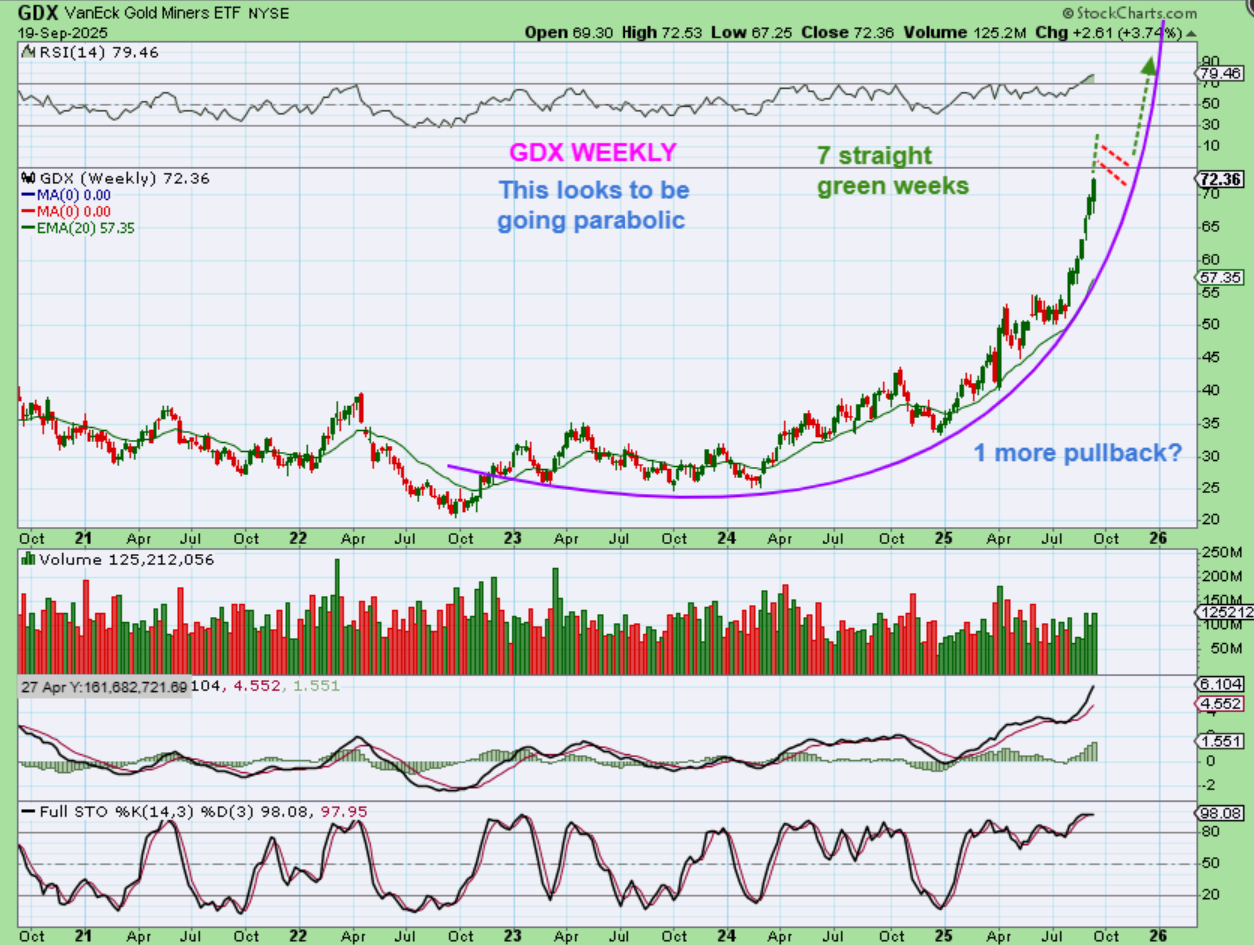
A parabolic move can have a pause or dip and then a second leg up, so I’ll just draw that idea here, but remember that Silver has a dcl and could put 3 weeks higher (15 days) of blow off top kind of buying frenzy. GDX also just put in a dcl, right?
.
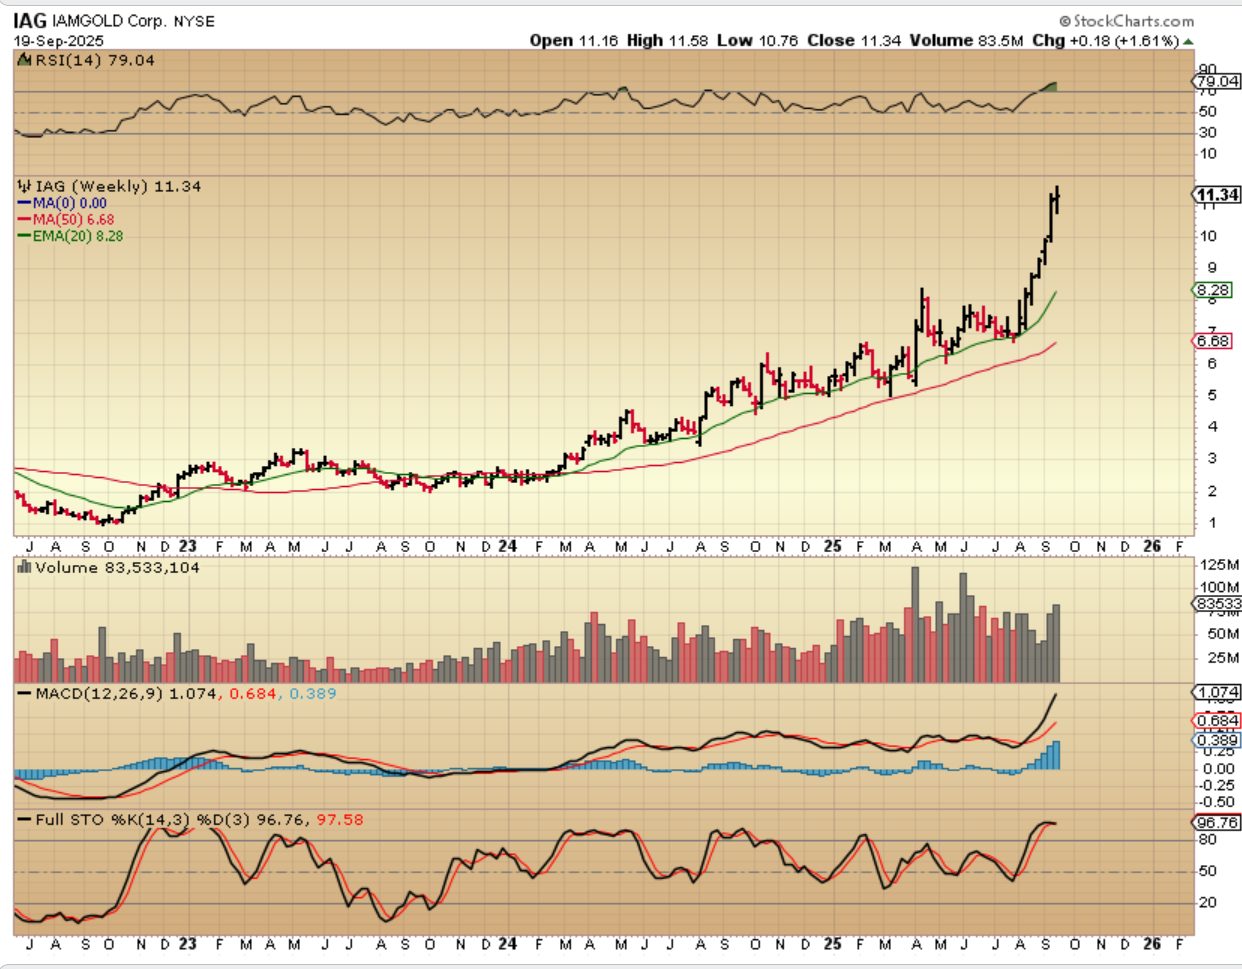
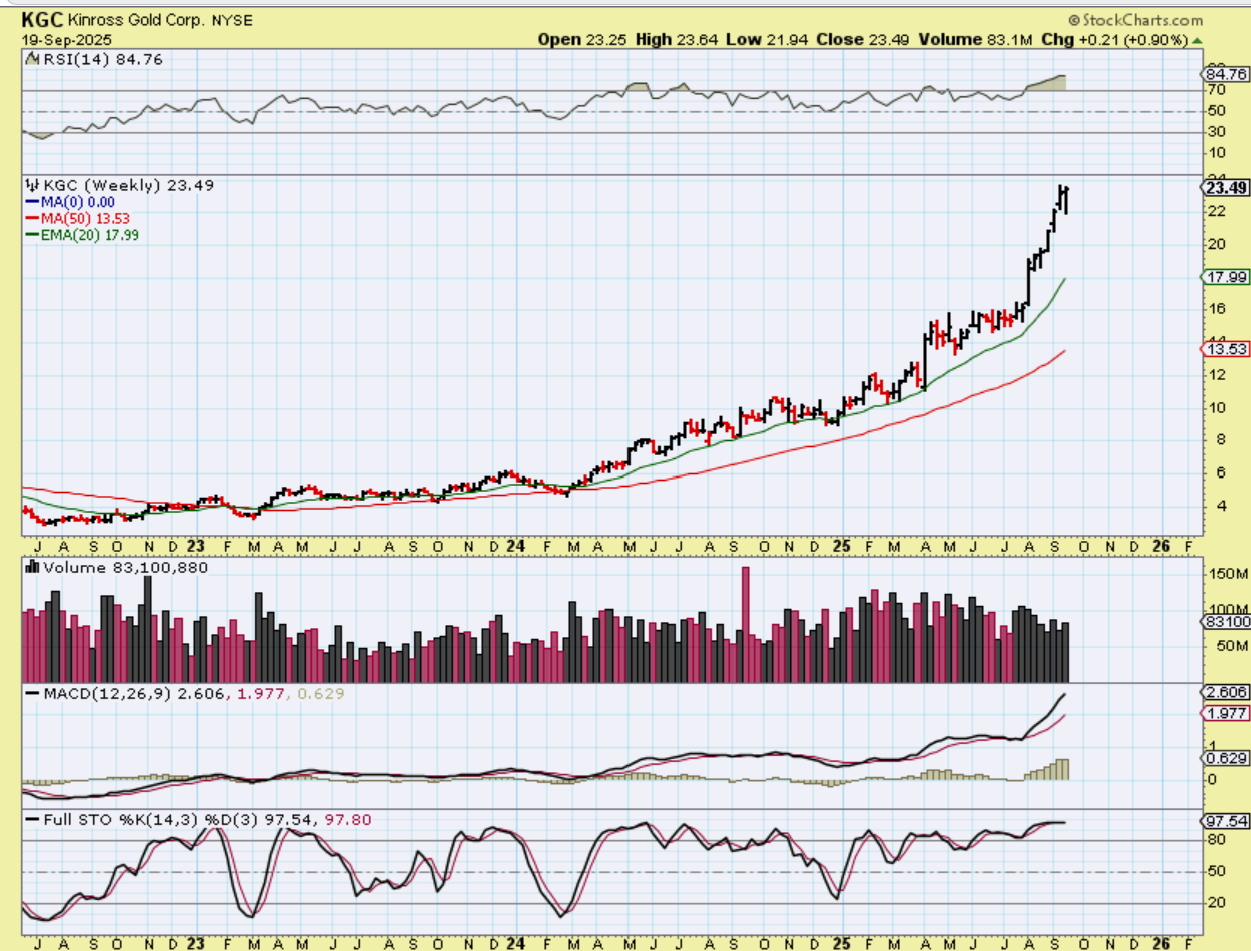
GDX also just put in a dcl on day 34, right? So even if we have a dcl that only runs up for 12 days, that is still roughly 3 weeks of gains on here and that could be parabolic. Remember what my charts of KGC, IAG, EGO, etc looked like? Parabolic.
.
GDX -Can you imagine a dcl now with 2- 3 additional weeks higher? THAT is parabolic.
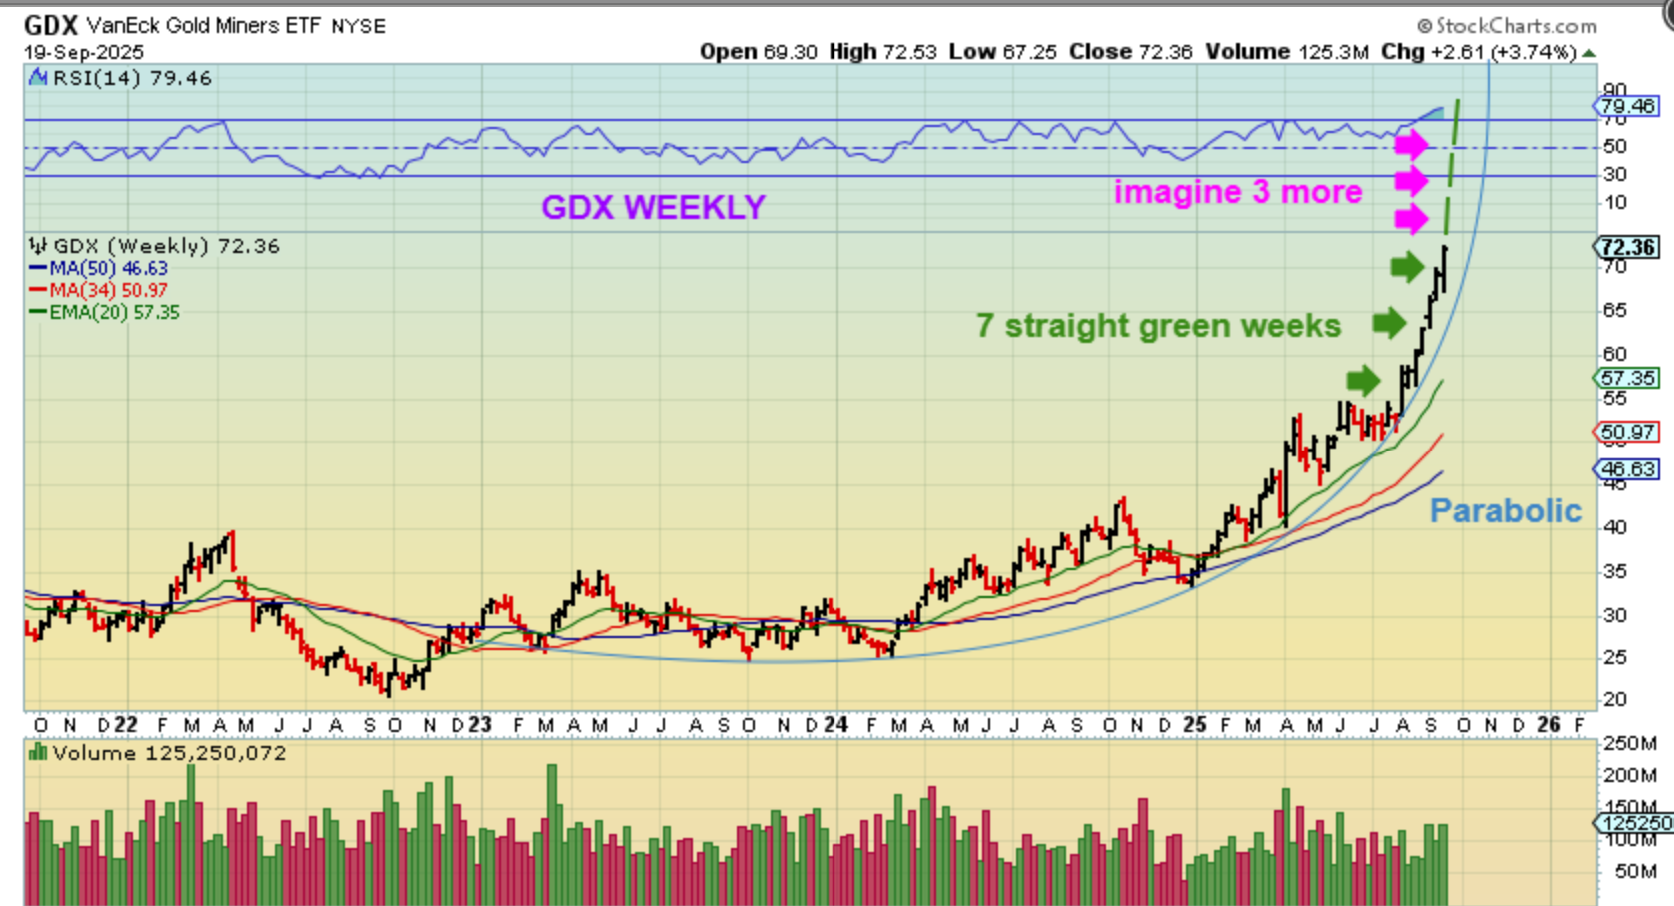
And stepping back, The GDX ETF is already looking abnormally straight up on a long-term chart. Add 2-3 candles here and I just have to say that this looks vertical, and parabolic. That break to new highs for the GDX was a buy signal for the masses and that is exactly what they’ve done.
.
CONCLUSION:
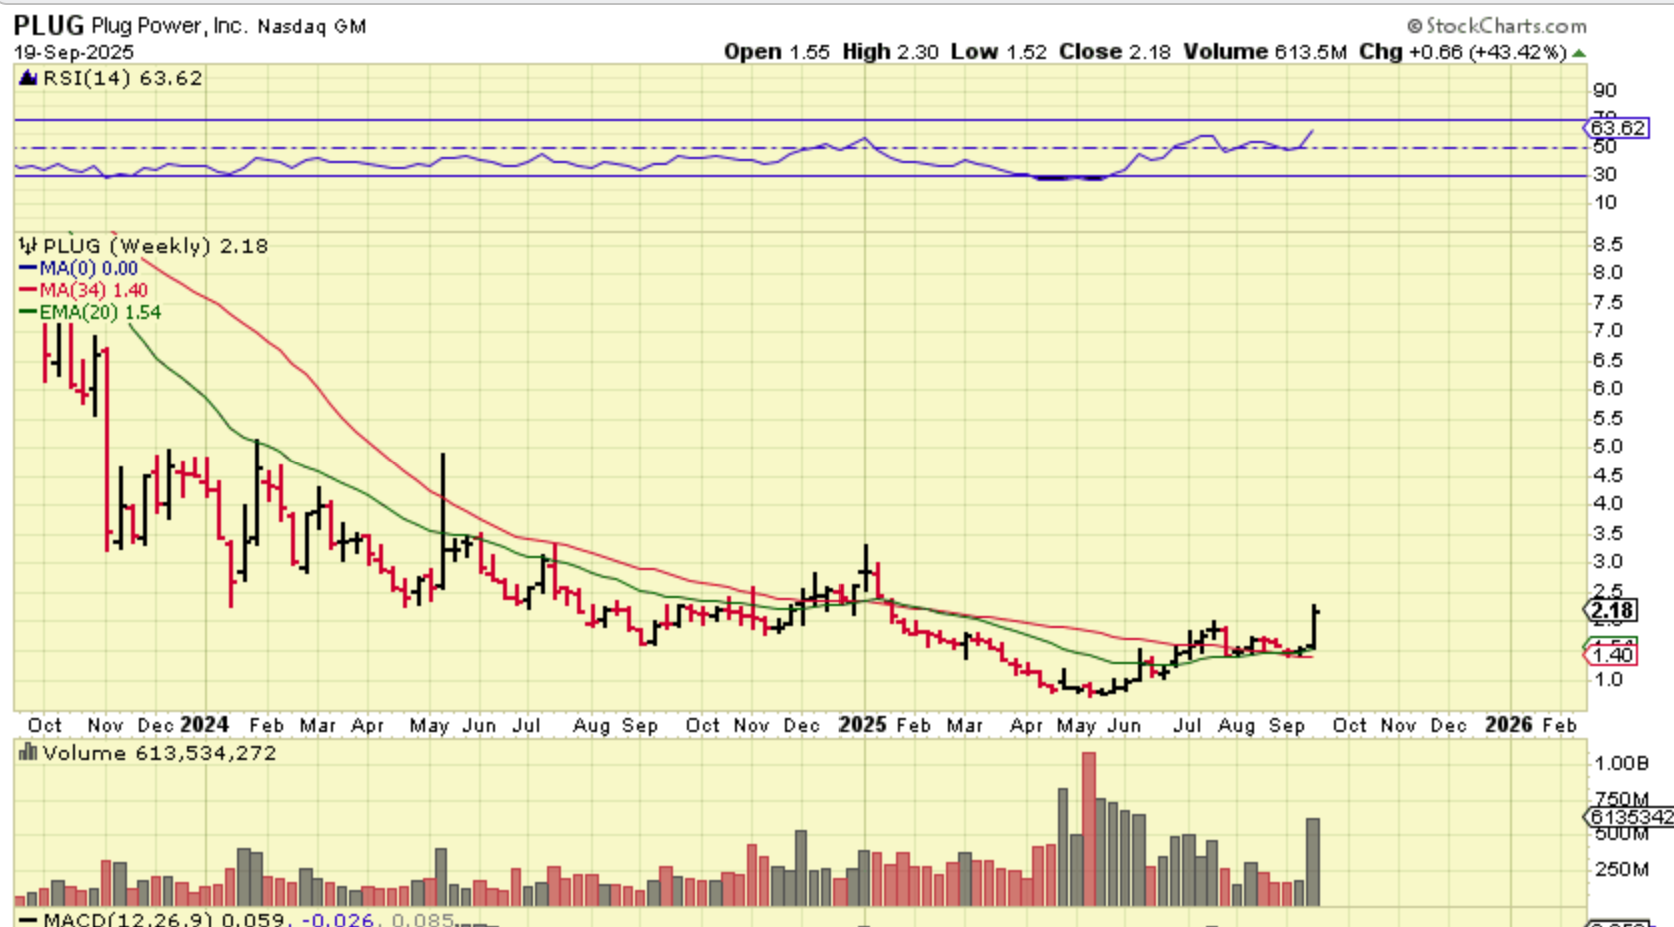
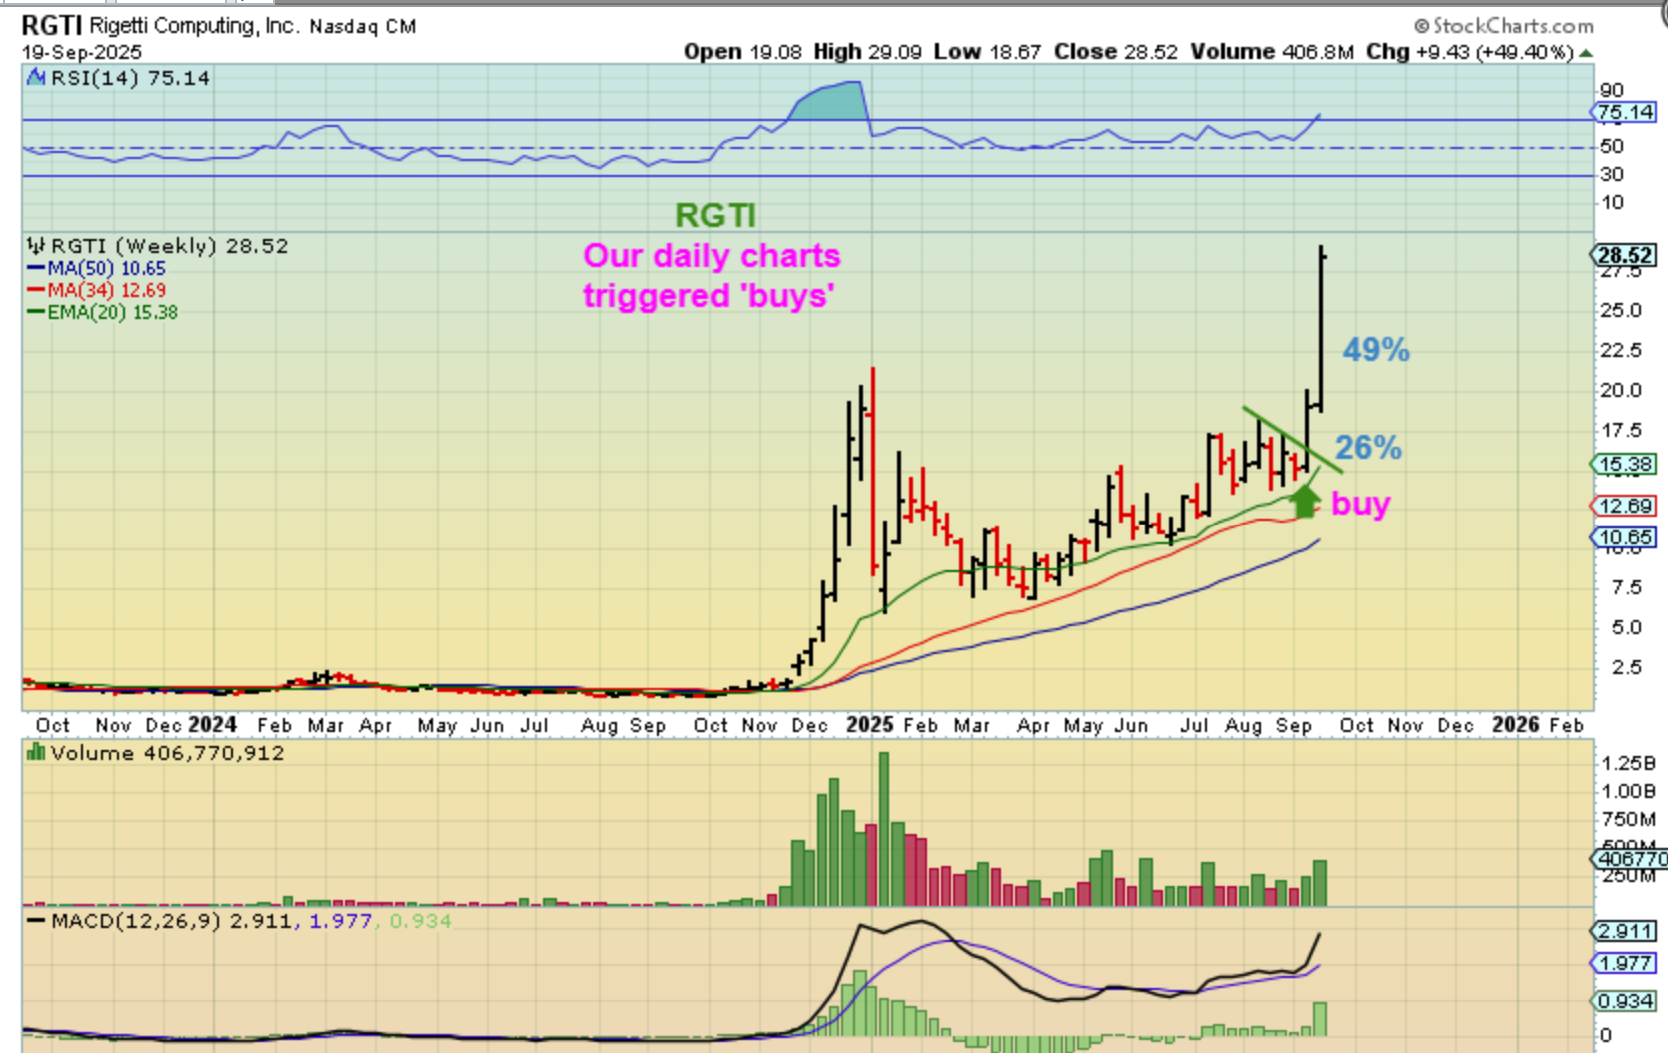
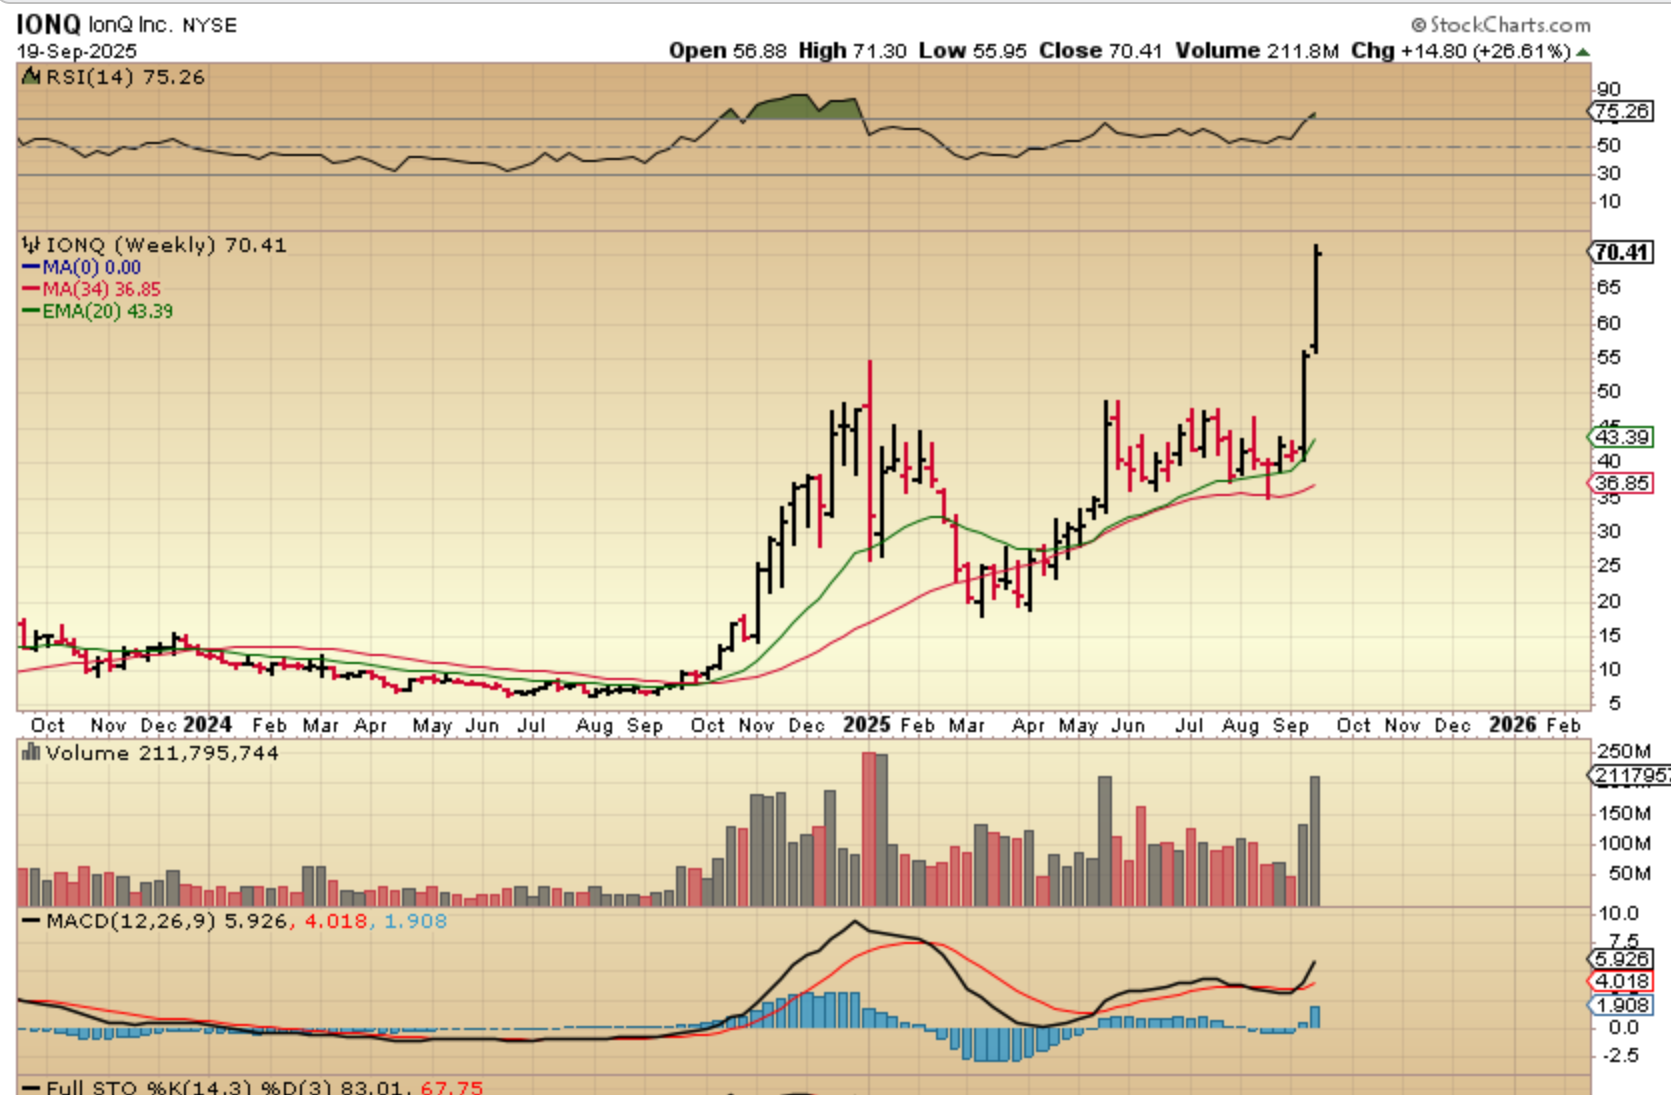
The Bulls are certainly still in control after the Fed rate cut this week. The General Markets have been running strong, and the Fed Rate Cut helped the markets to continue higher too. They could be due for a dip into a dcl at any time, but if we get a longer daily cycle, it could run into day 50. Last week heading into the Fed Mtg I said that we just seem to have too many Bullish set ups for a pull back. If I showed you charts of some of our recent picks, you’d see that the gains have been amazing. Ok, I’ll show a couple 🙂 I just want to say that recent picks are Huge gainers in many sectors. Like PONY (up 38% for the week), SERV, SOUN, & RR – up 30%, BLDP 38%, PLUG 43%, SMR 30%, OKLO 63%, LTBR 30%, RGTI 50%, IONQ, QBTS 51%, QUBT 40%, QMCO 61%etc etc –huge gains and it may continue.
.
PLUG was a buy on the daily chart with that wedge. Up 43%.
.
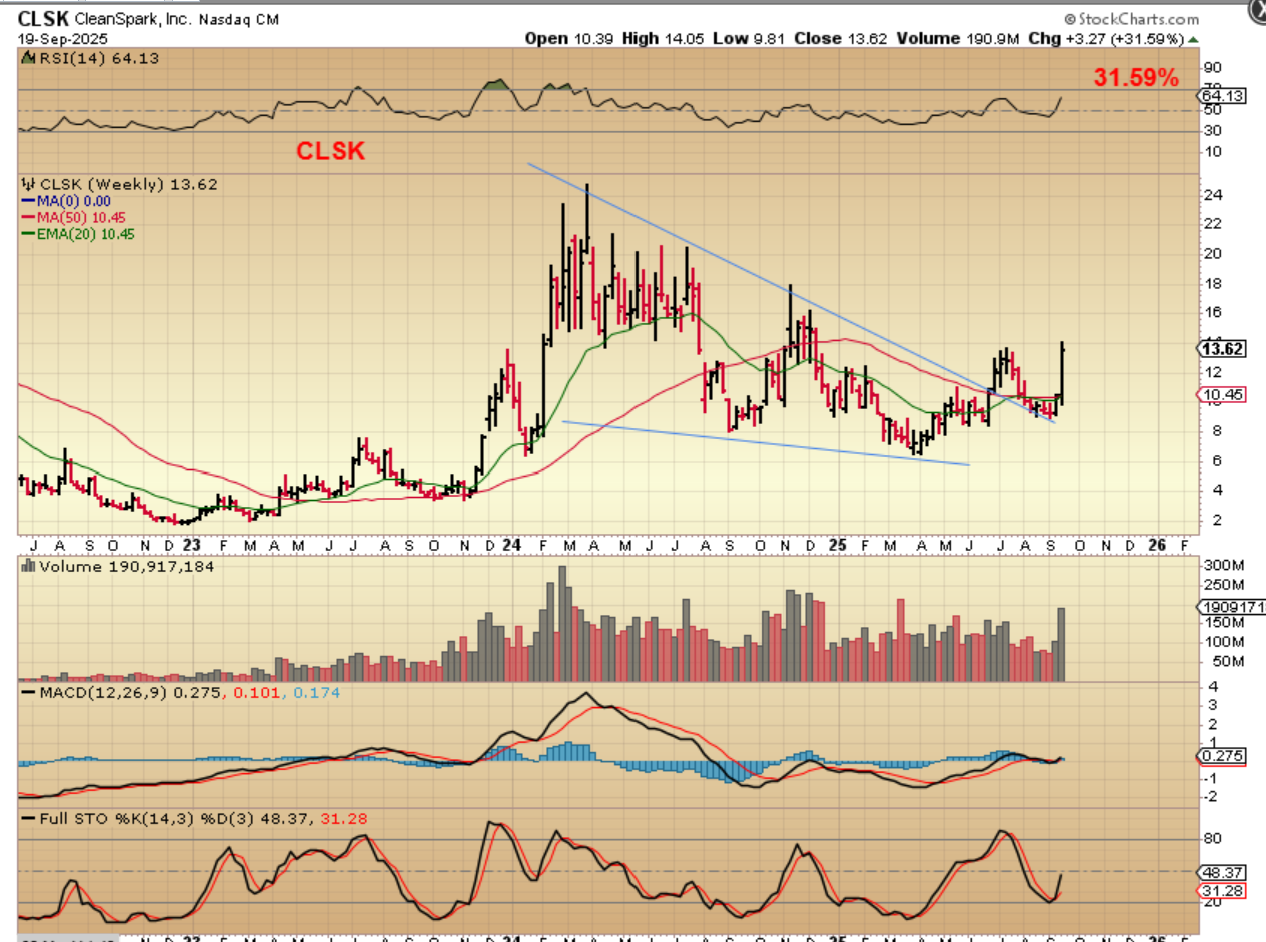
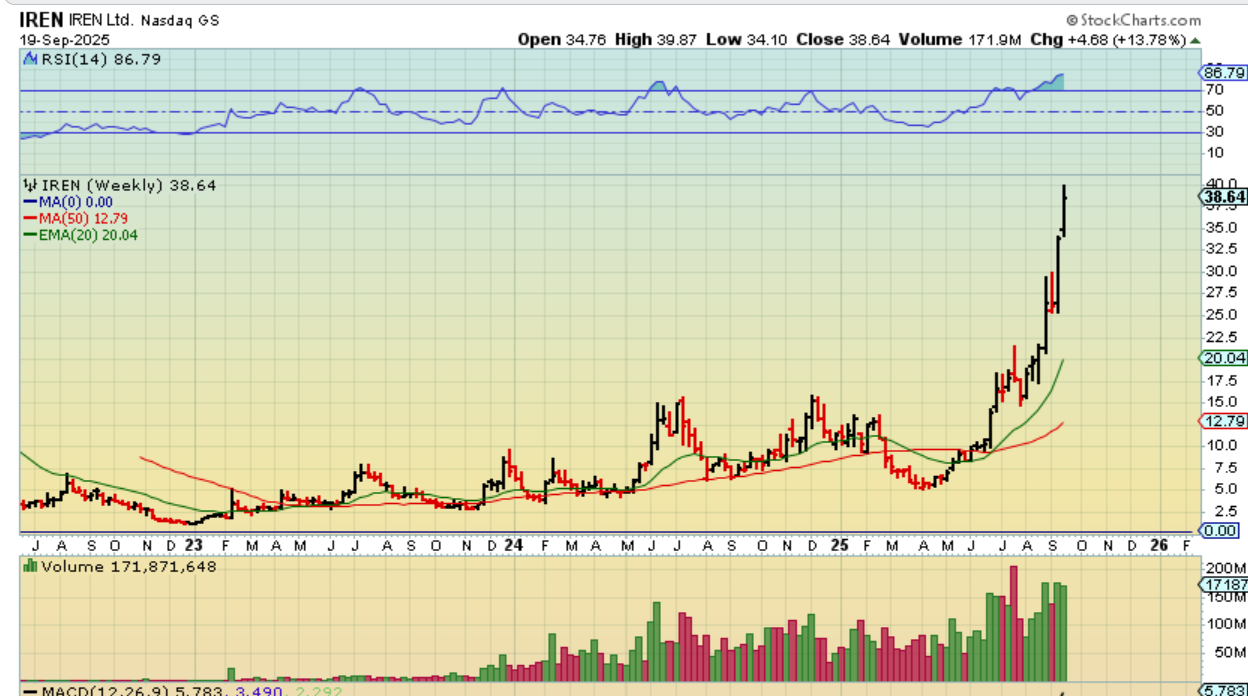
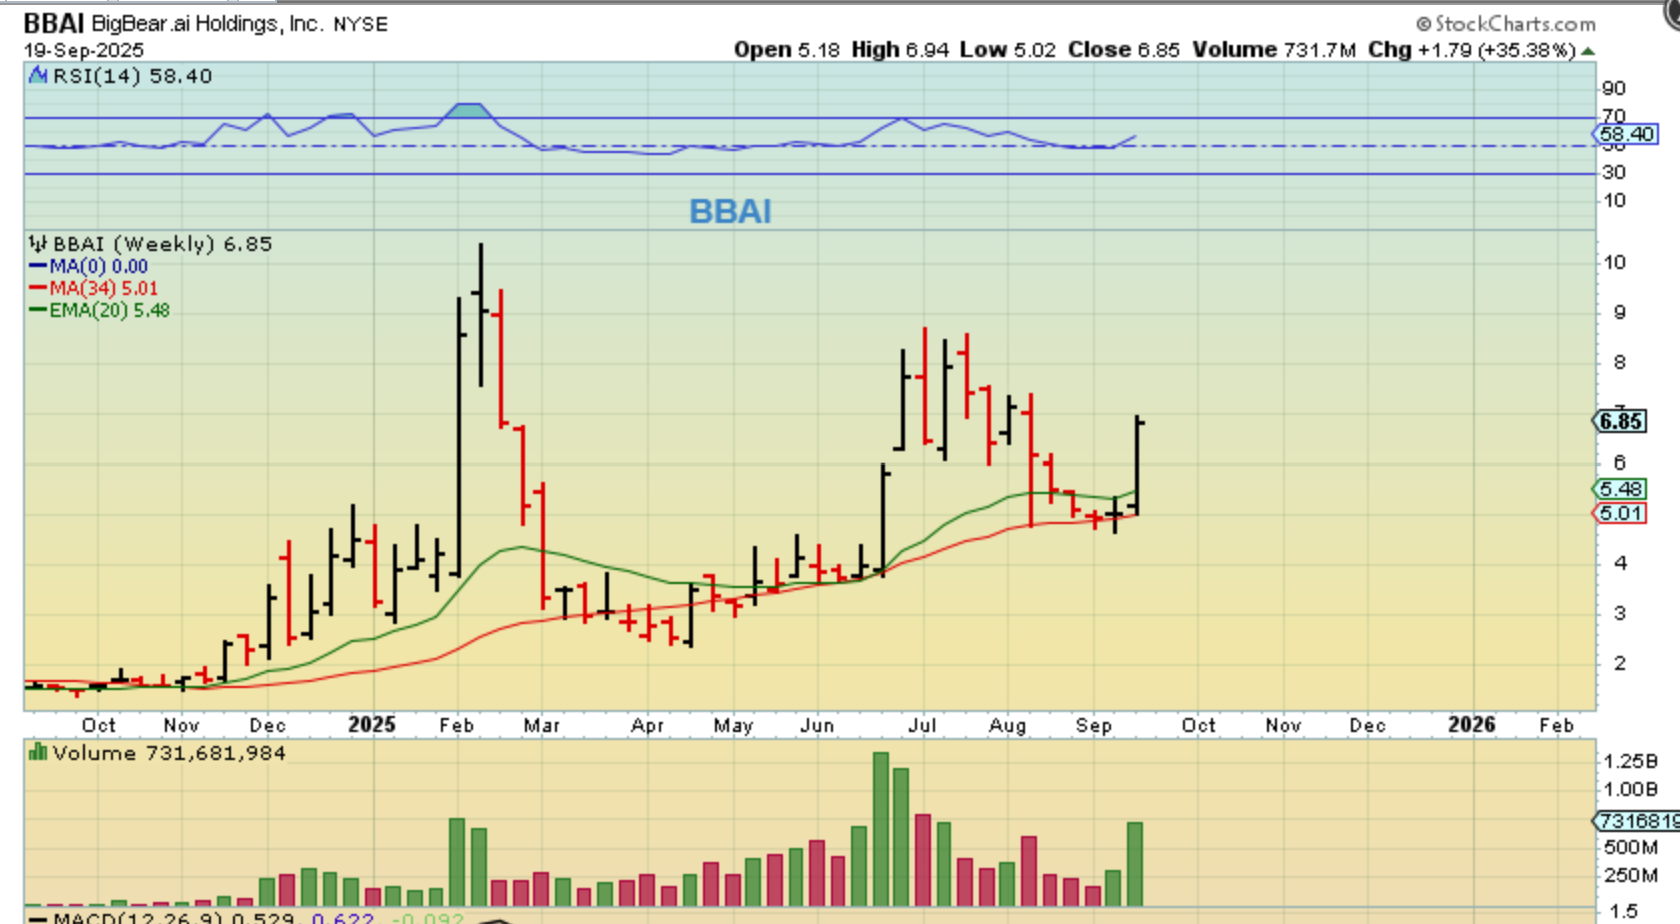
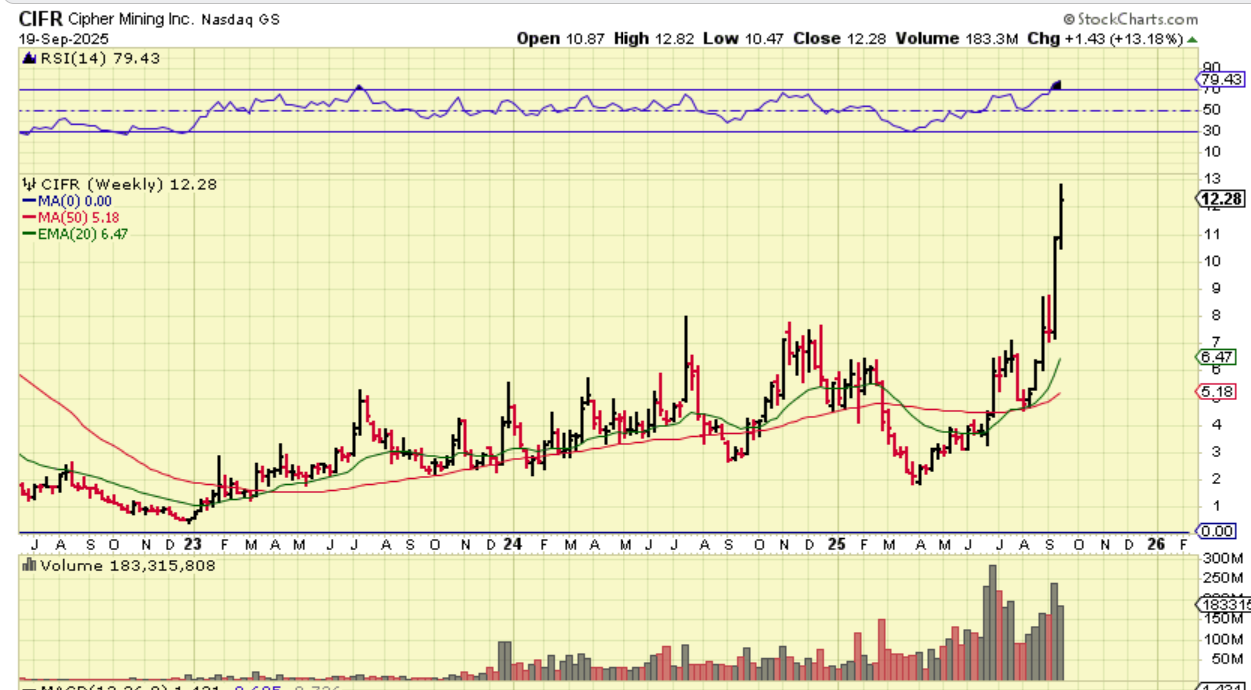
Even the ‘normal’ picks like BBAI, SOUN, SERV, RR, CLSK, IREN, CIFR, etc. etc that are set up nicely like 20-30%, making great gains in a week. Why? Because 5%-7% gains per day adds up.
BBAI was up 35% too.
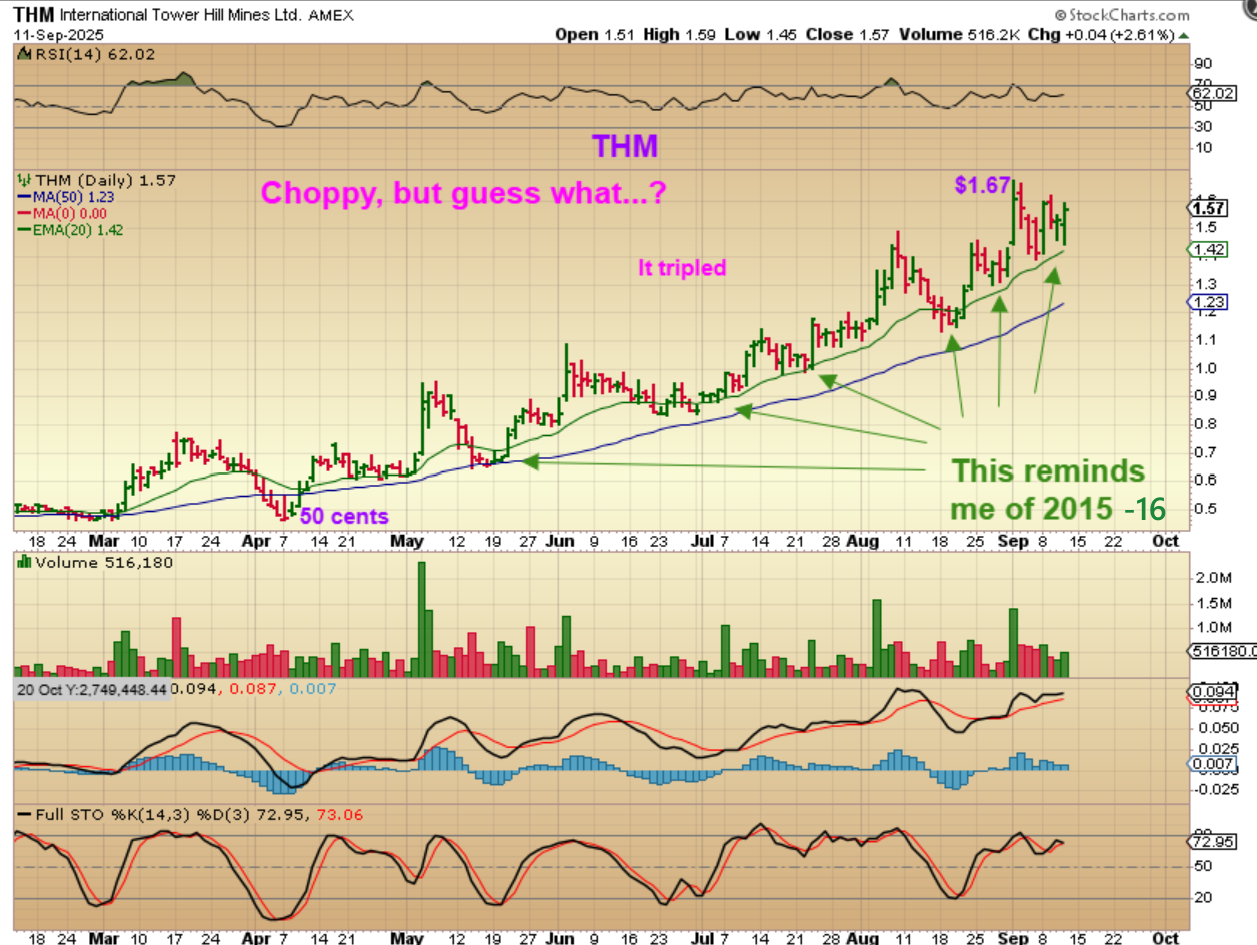
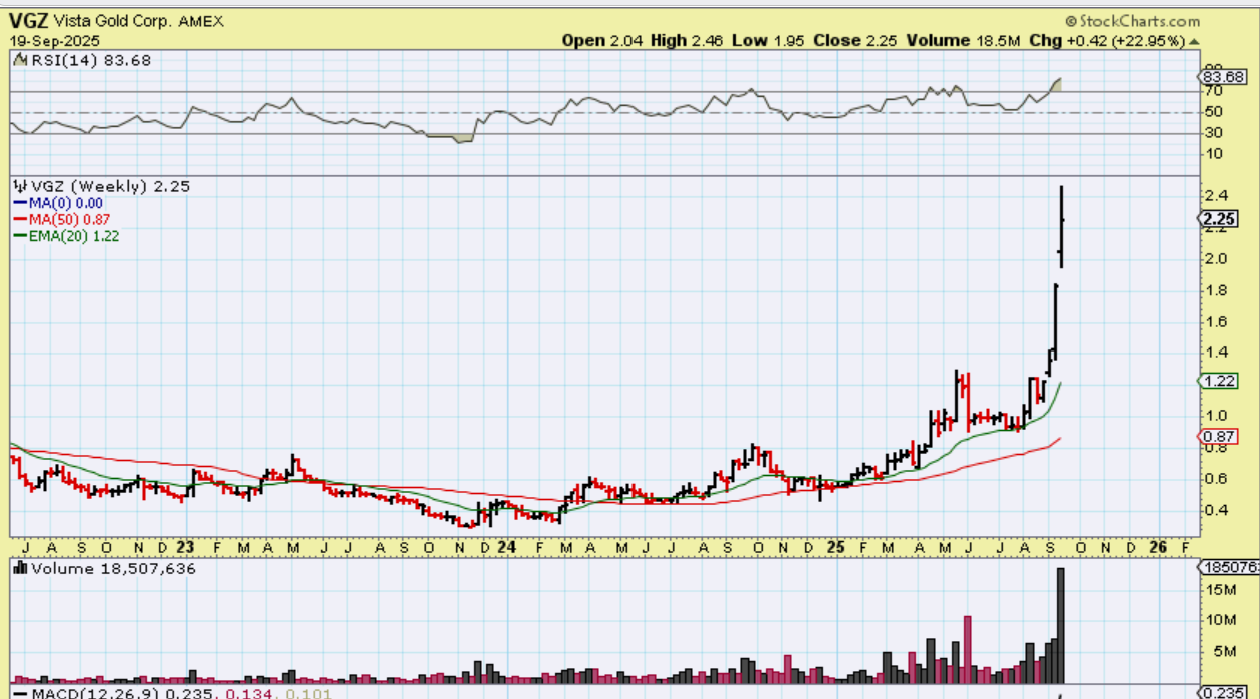
The Precious Metals look to have a dcl near the Fed Day Rate Cut and then they turned higher too. We may have 2 or maybe 3 more weeks of buying there and they could go parabolic. Some honestly already are parabolic. Could we see some lagging Miners also up 30-50% in a week? I certainly wouldn’t doubt it! We are already seeing the leaders run away and the laggers started to join in. Do you recall what I mentioned with charts a week ago for TRX, THM, GORO, VGZ, PZG, as shown in recent reports. They are now on fire too.
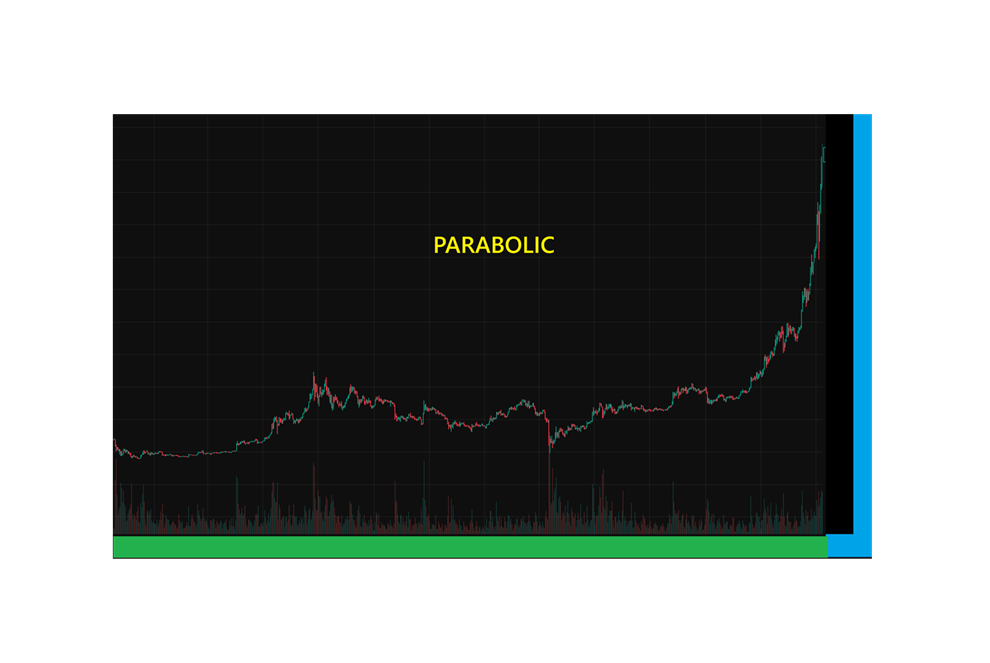
And then we can also take a look at what the crypto Stocks are suddenly doing, and we seem to be seeing another sector on fire. They can go parabolic too. Take a look at some of the stocks in that sector below. With a dcl in the Precious Metals sector and a possible 2-3 more weeks of exuberance, we could continue to see massive gains, but THEN we’d need to put up the caution flags, because in a couple of weeks if that parabolic run happens, we’ll become unsustainable. For now we enjoy the Bullish atmosphere!
.
~ALEX
.
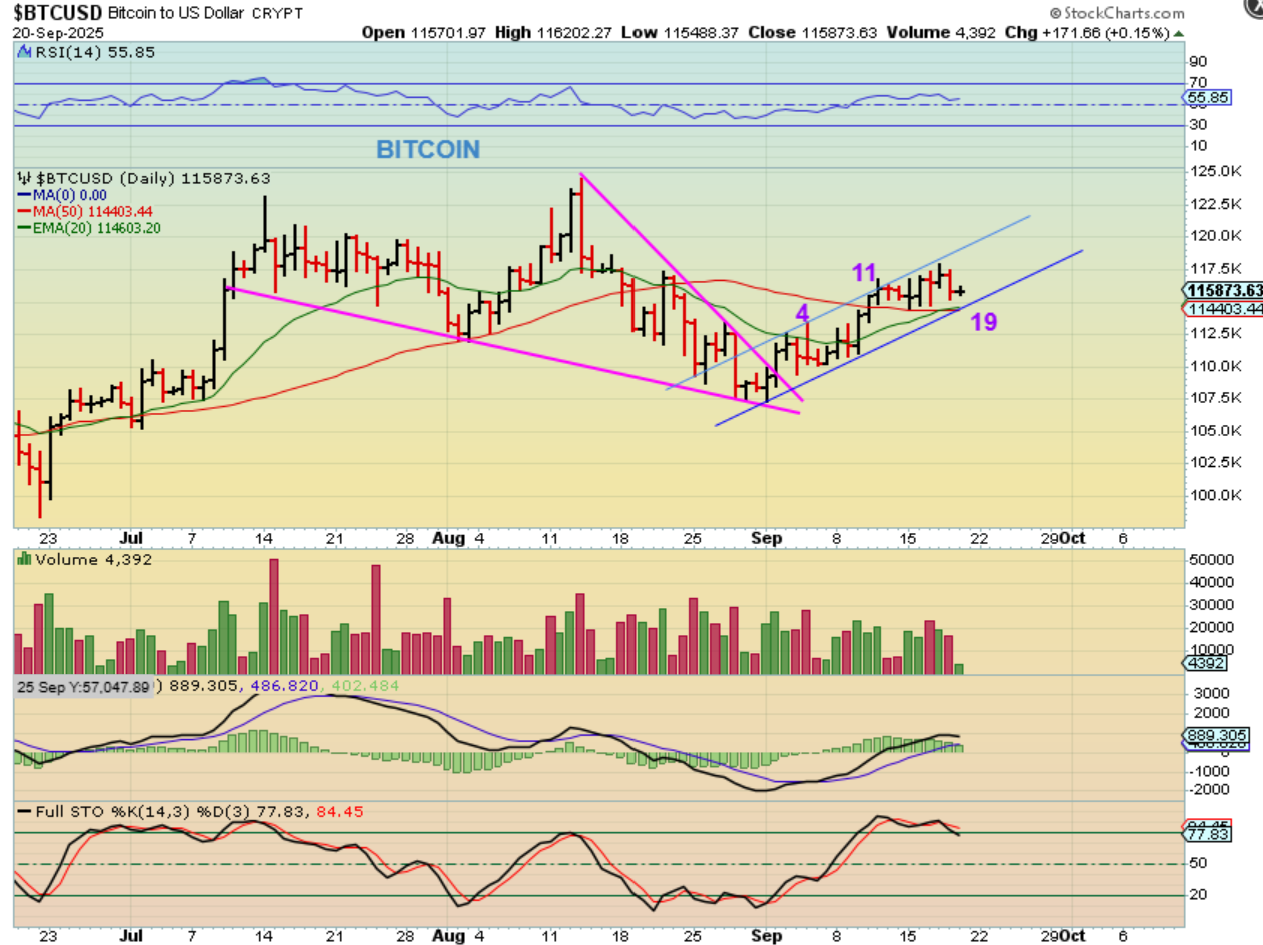
BITCOIN is only on day 19 (Saturday) and it has plenty of time to move higher. Crypto stocks are performing well. The leaders are doing excellent ( IREN, CIFR, HUT, WULF, BITF, HIVE,RIOT, etc) and the laggers started to push higher too. Next weeks should be a good week for Crypto if this trendline and 50sma hold rice on this dip.
.
As you know, the Crypto Stocks have been doing great, and the precious metals are also now doing this.
.
CLSK was a buy last week. It was then Up 31.59%