
September 6th Weekend Review
.
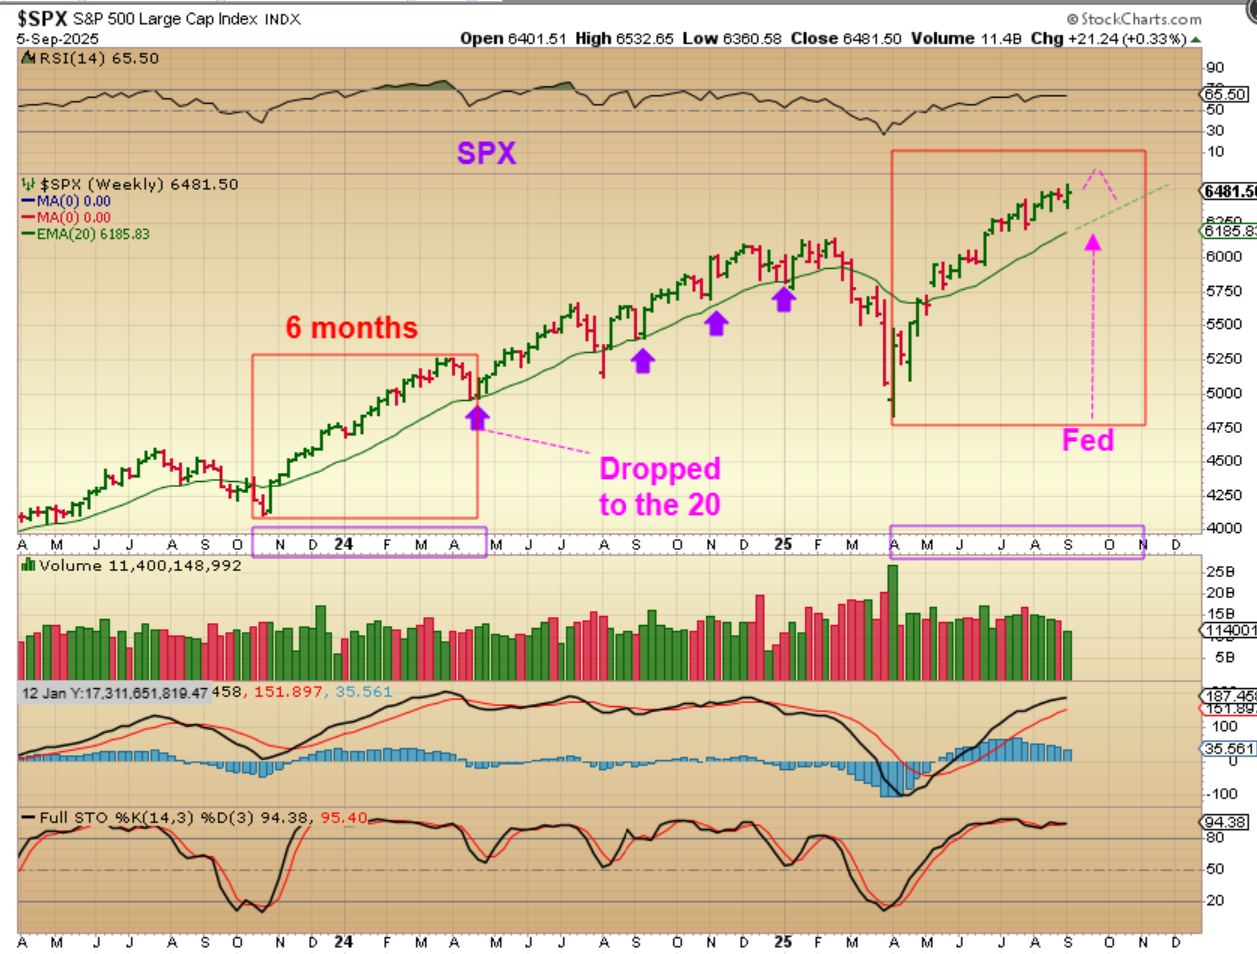
SPX – The markets gapped down and sold off early last week, but once again they recovered. We were within the timing for a half cycle dip on a daily, so the markets can continue even higher as we move closer to the Fed Mtg in 8 business days. I mentioned Friday that I am thinking that we’ll see more chop though. Why? Well, the ICL dip is also now coming into play. The last ICL was that deep sell off in April and the markets rallied nicely from those lows. I have pointed out the similarity of this run and the end of 2023. ..
.
IMPORTANT:
So a rate cut is being viewed as bullish, but contrarian thinking could be that the markets run up ahead of the Fed cut, and then roll over and sell into a dcl after the cut. The view will then turn to, “Yes, we got our cut, but the economy is slowing’ or something like that. Then we sell off into a dcl / ICL over time. That is known as “Buy the Rumor, Sell the News’ in trading.
.
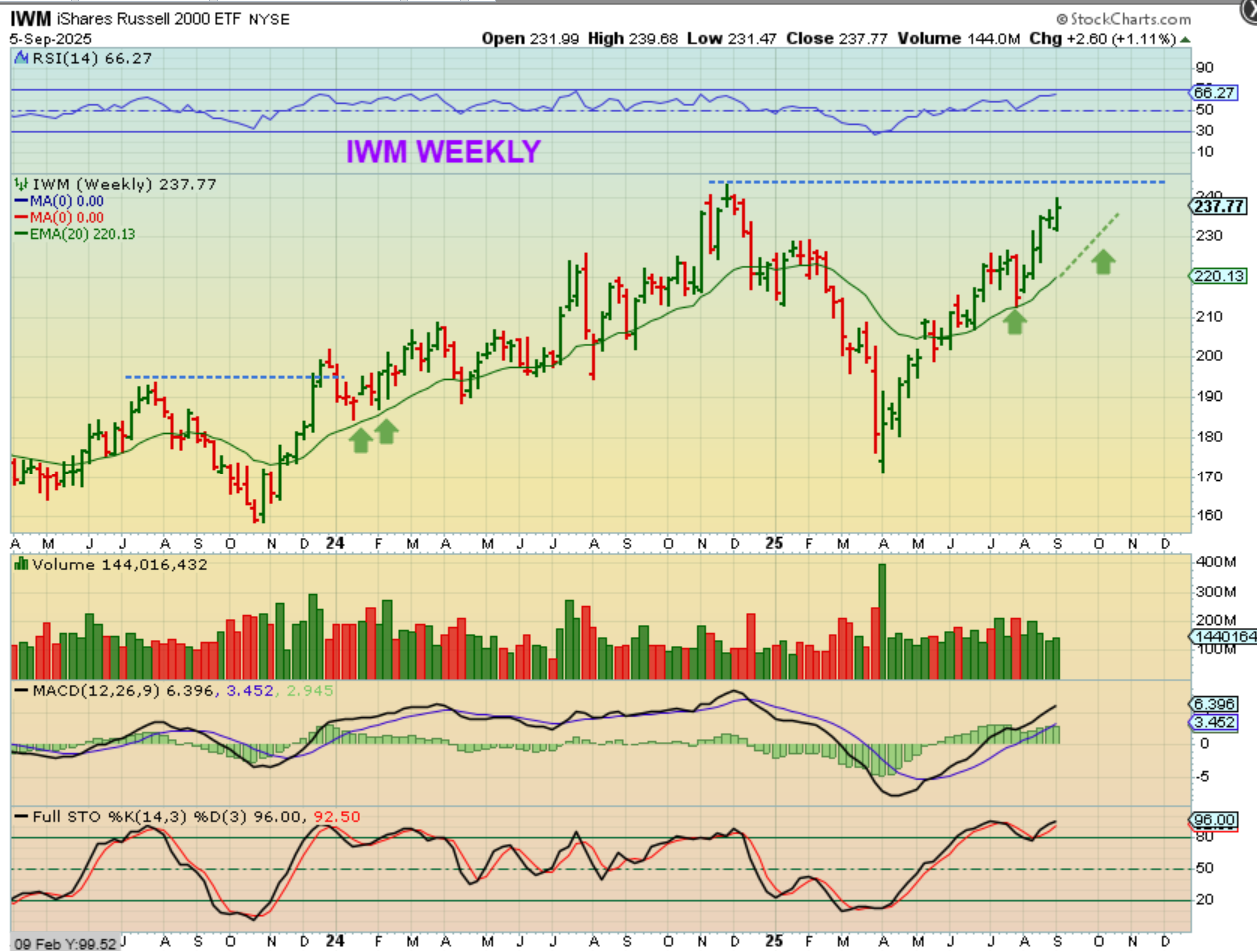
IWM also gapped down and closed higher, and it is still heading up to all-time highs. I could picture this making all time highs (similar to the end of 2023 on this chart) and then it becomes a false breakout. IWM seems to drop to the green 20 ema, and it is a bit extended above it.
.
CONCLUSION: A drop into an ICL could come after the rate cut, and then one more daily cycle lower, since October is often known as a weak month. After an ICL in October, we could see a bull run year end rally. Good Gains could be made coming out of that ICL too.
.
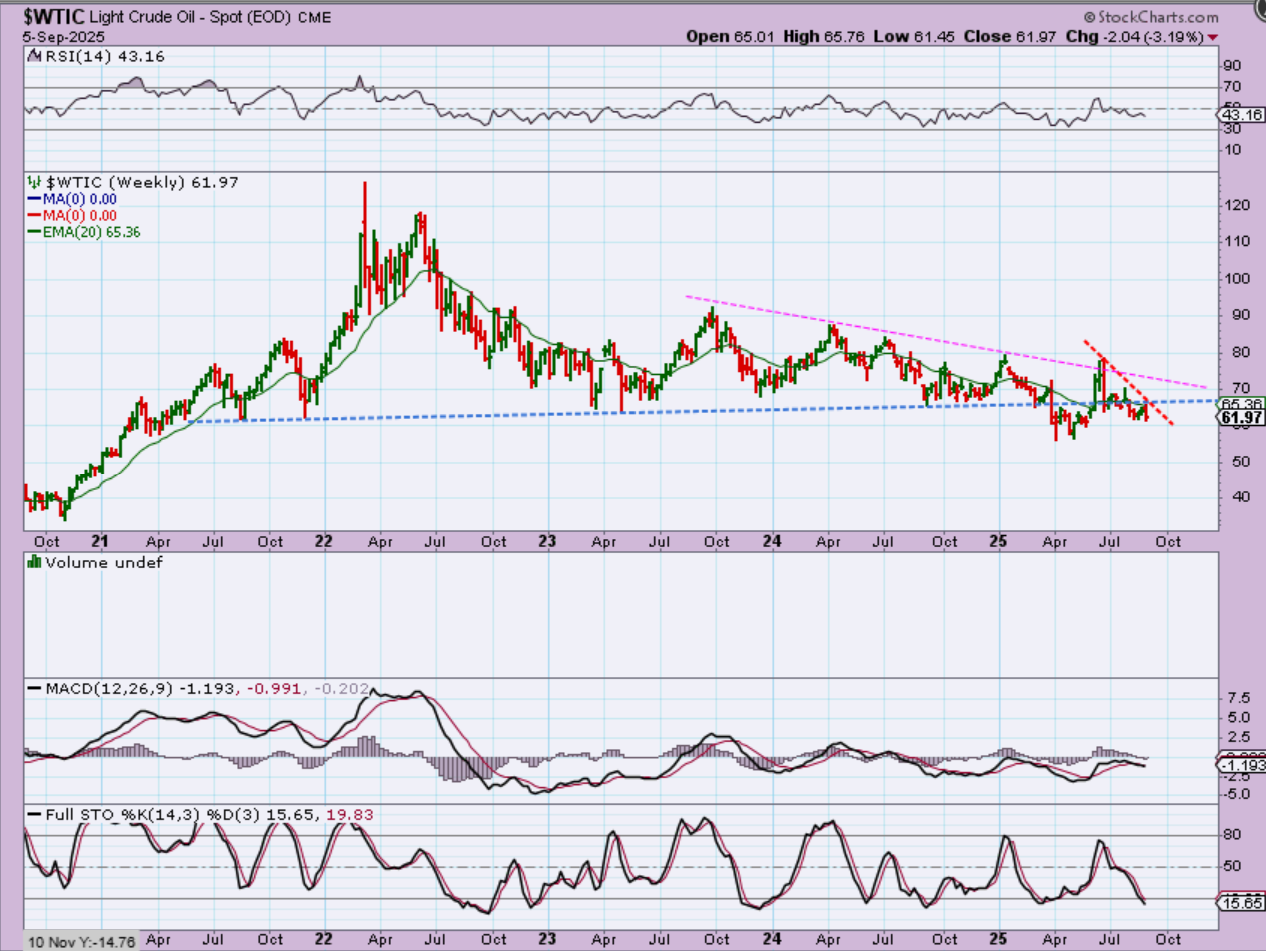
WTIC WEEKLY – Oil remains choppy and so far it hasn’t been unable to recover that second breakdown of support. We did discuss the fact that Oil stocks look better than OIL and are almost at a point of breaking out, so that MIGHT indicate that Oil will recover. Let’s look at the XOP again…
.
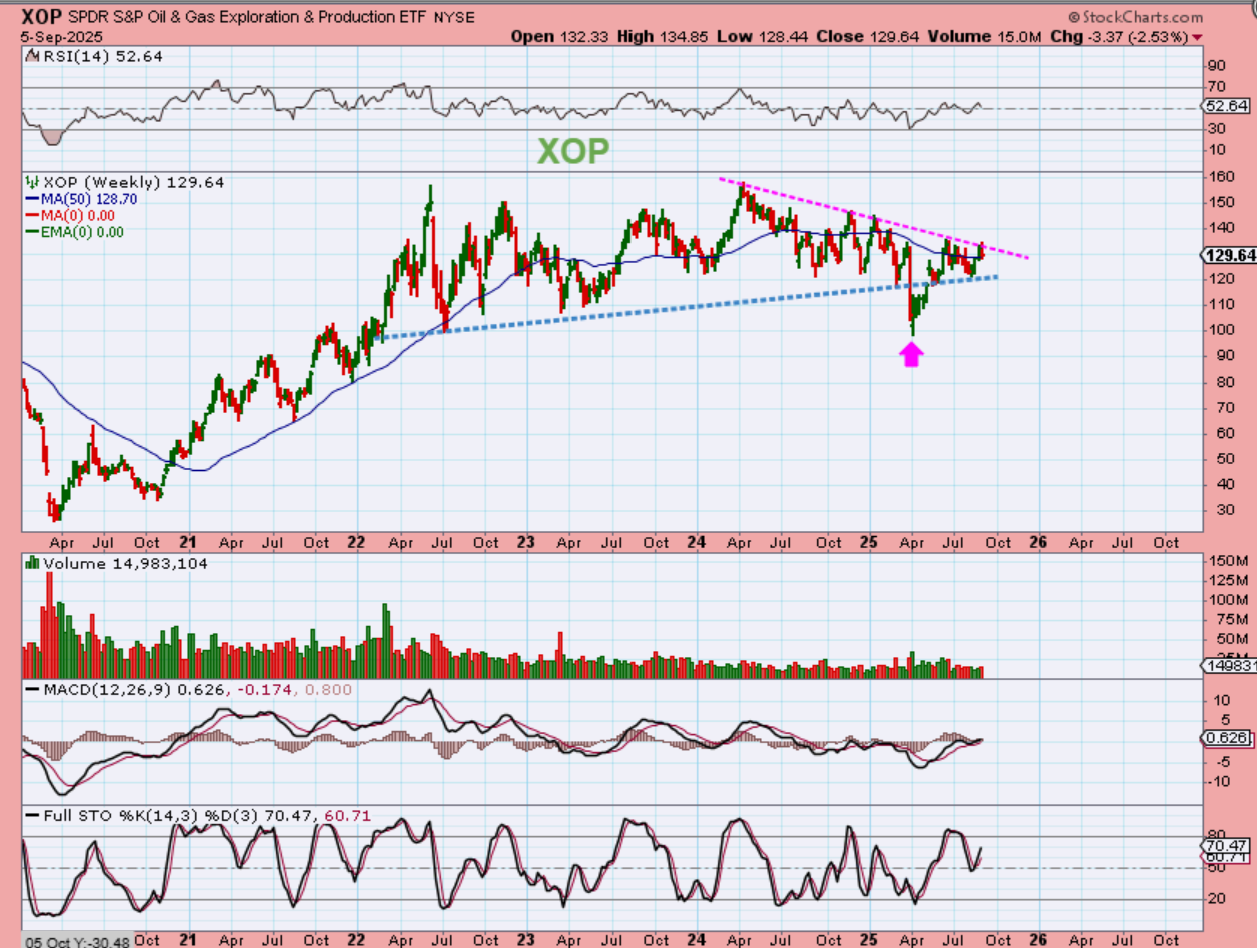
XOP WEEKLY – You can see that the XOP dropped 2.5% last week, but it is still above the 50 week ma. The XOP was able to recover the selloff in April where it lost support, and it still looks like it could break out above the downtrend, so we’ll see what happens next week.
1. It could be an additional drop to the blue trendline or
2. Oil stocks may make another try at a breaking out higher above the magenta downtrend line.
.
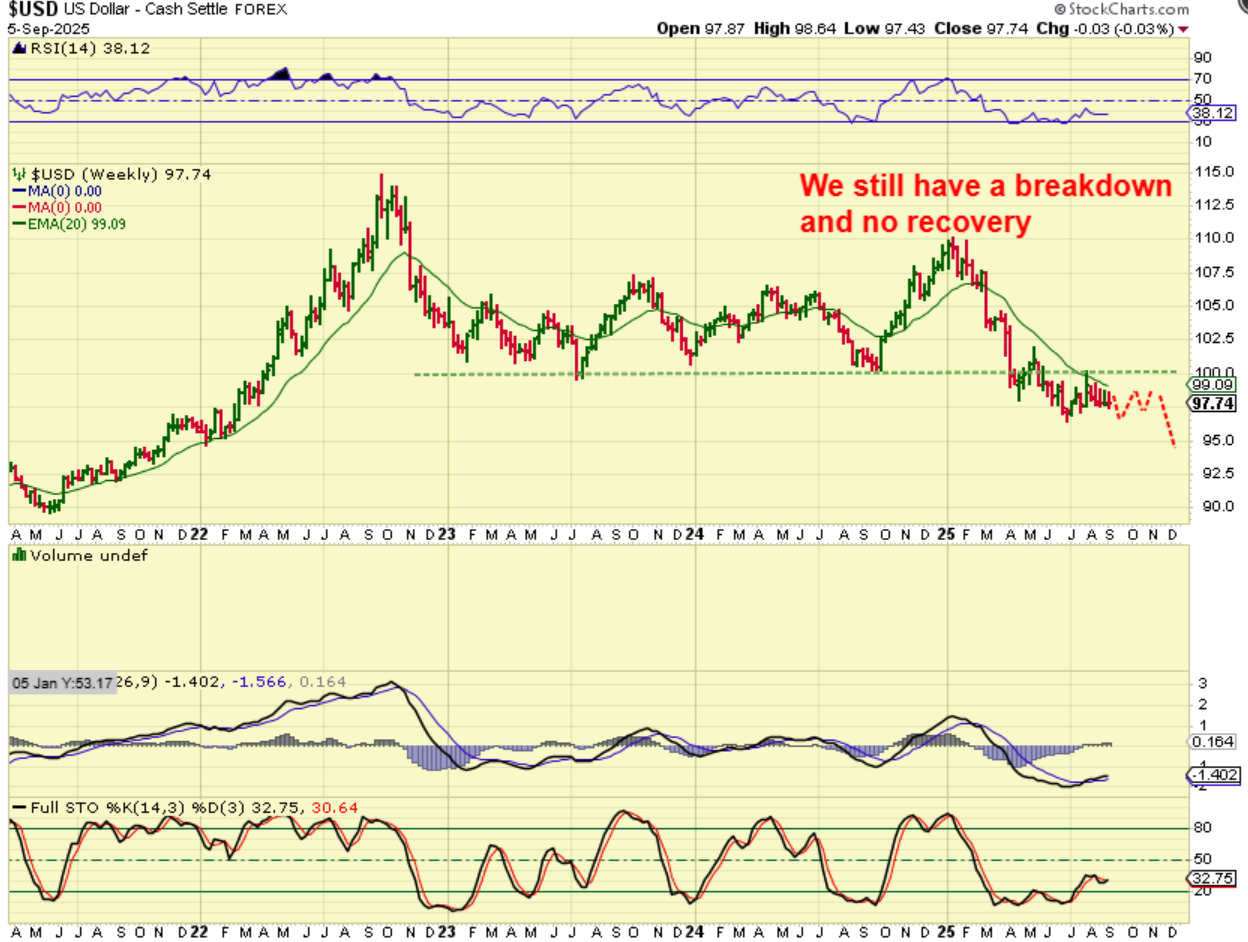
THE USD dropped when the Fed discussed rate cuts (or policy change) at Jackson Hole. It has been extremely choppy since the sell off into April, and it feels like it wants to weaken over time and break even lower, as drawn below. That could continue to push Gold higher. A move above the green 20 ema would change that, but so far that has acted as solid resistance.
.
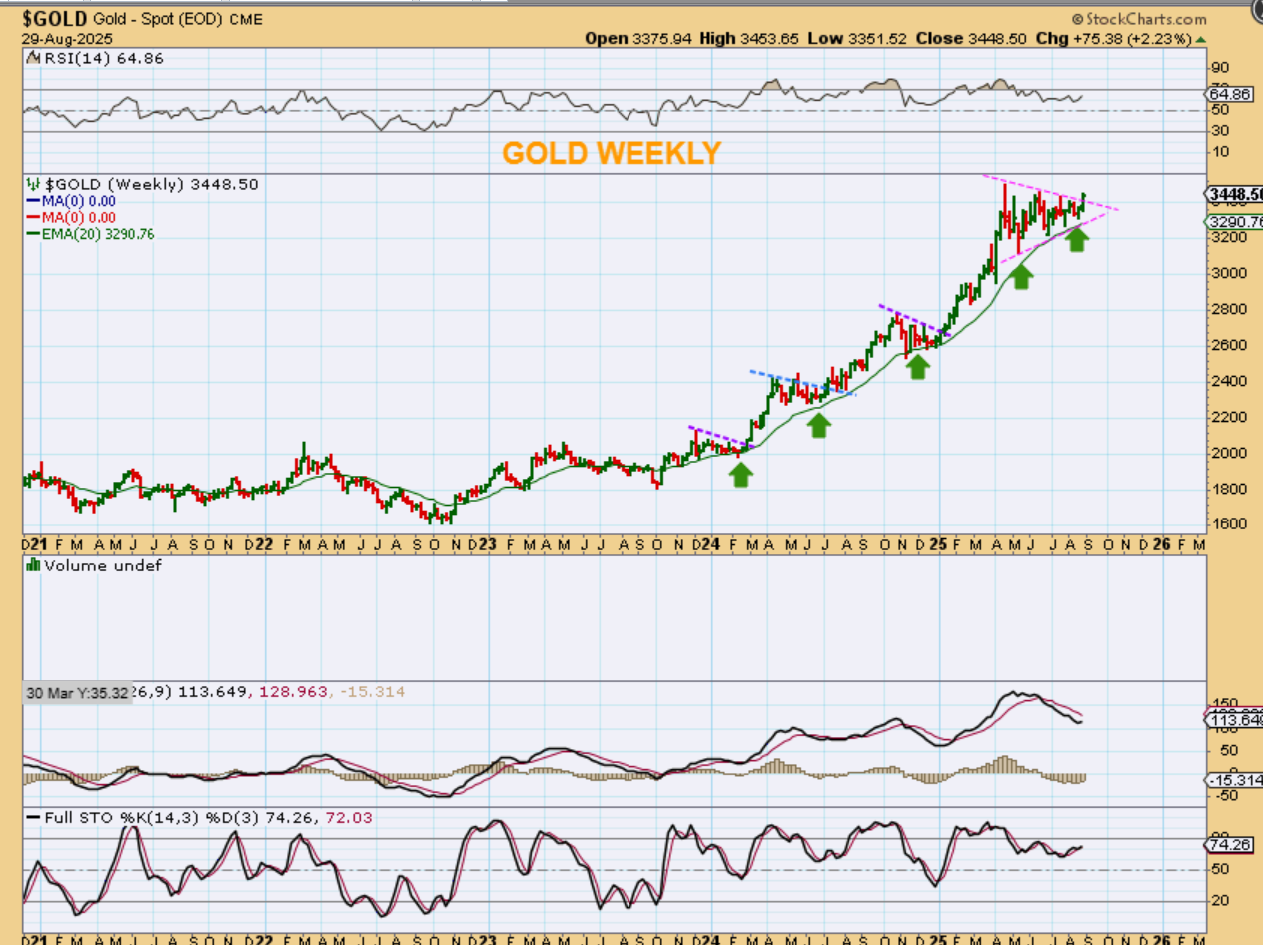
LAST WEEK I pointed out the breakout for GOLD with this chart. I thought that we might get a breakout heading into the Fed, and then a back test or drop into a dcl (ICL?) after the Fed cut. That said, there is another point to make…
.
GOLD did continue higher, but I have also mentioned in the past that with a large triangle, we do consider a move out of a long triangle as an ICL on its’ own merit. The RSI cools off, the stochastics pulls back, and energy builds up. After a LONG Consolidation, the energy that builds up can be released steadily. Now take a look at each of our prior triangles on this chart. What followed? THOSE WERE ICLS. With the 3 other triangles drawn below, the pauses after the breakout were only sideways pauses. No back-test, and…
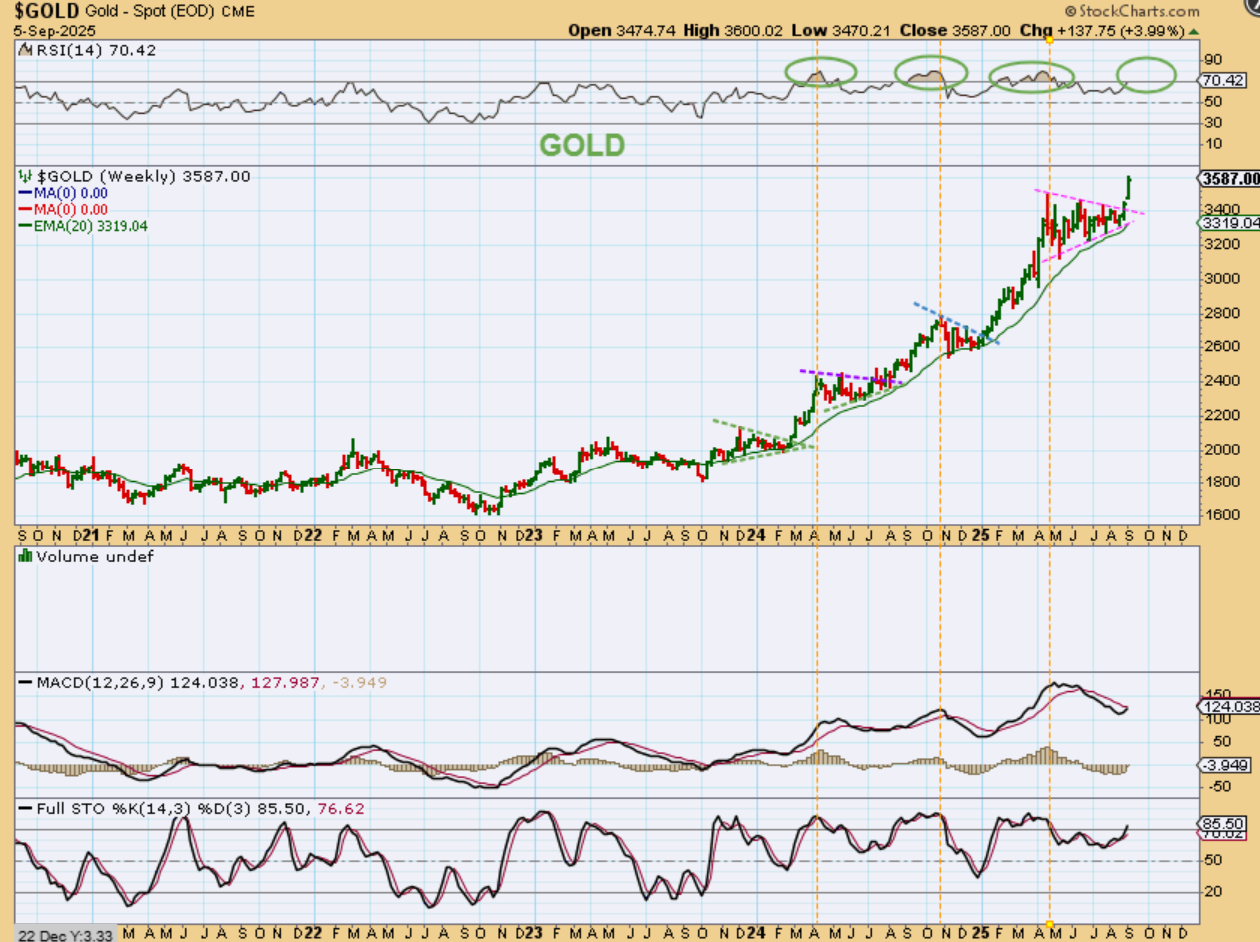
No back-tests and take note of the RSI when the rally ‘peaked’. The RSI & Stochastics have cooled off and now have room to go higher before a peak. With a Bull market that has this triangle, it would seem that we have an ICL. Holding positions is prudent, even if you sell some on the way higher, but I see 1 tiny problem…. The small problem on this is that some Miners are starting to look parabolic. I’ll discuss that too.
.
Finally:
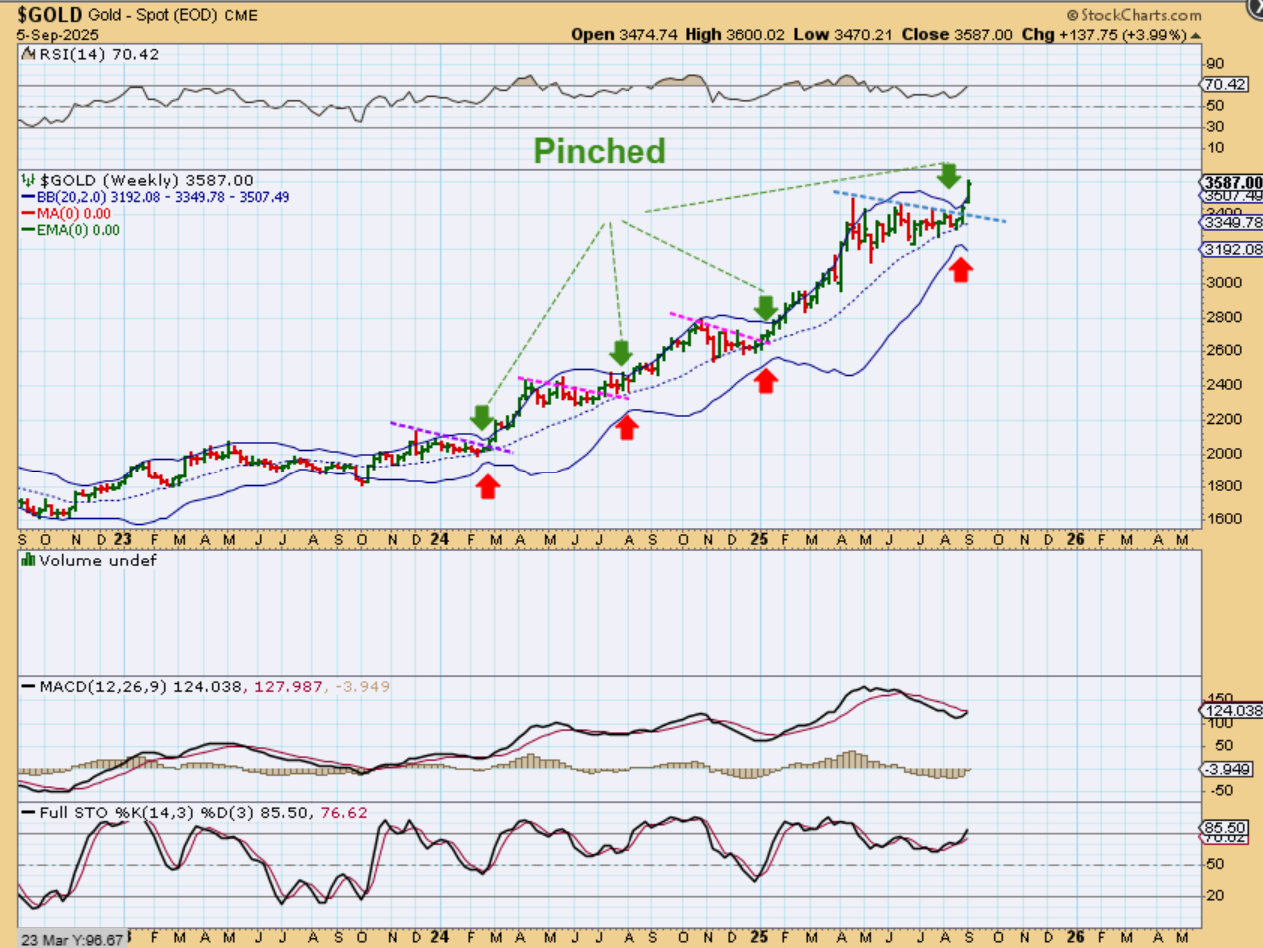
GOLD had a B.B. pinch that is now opening up on a weekly basis. It is a reset of sorts and now it looks that Gold will go beyond $4000+ (over time).
.
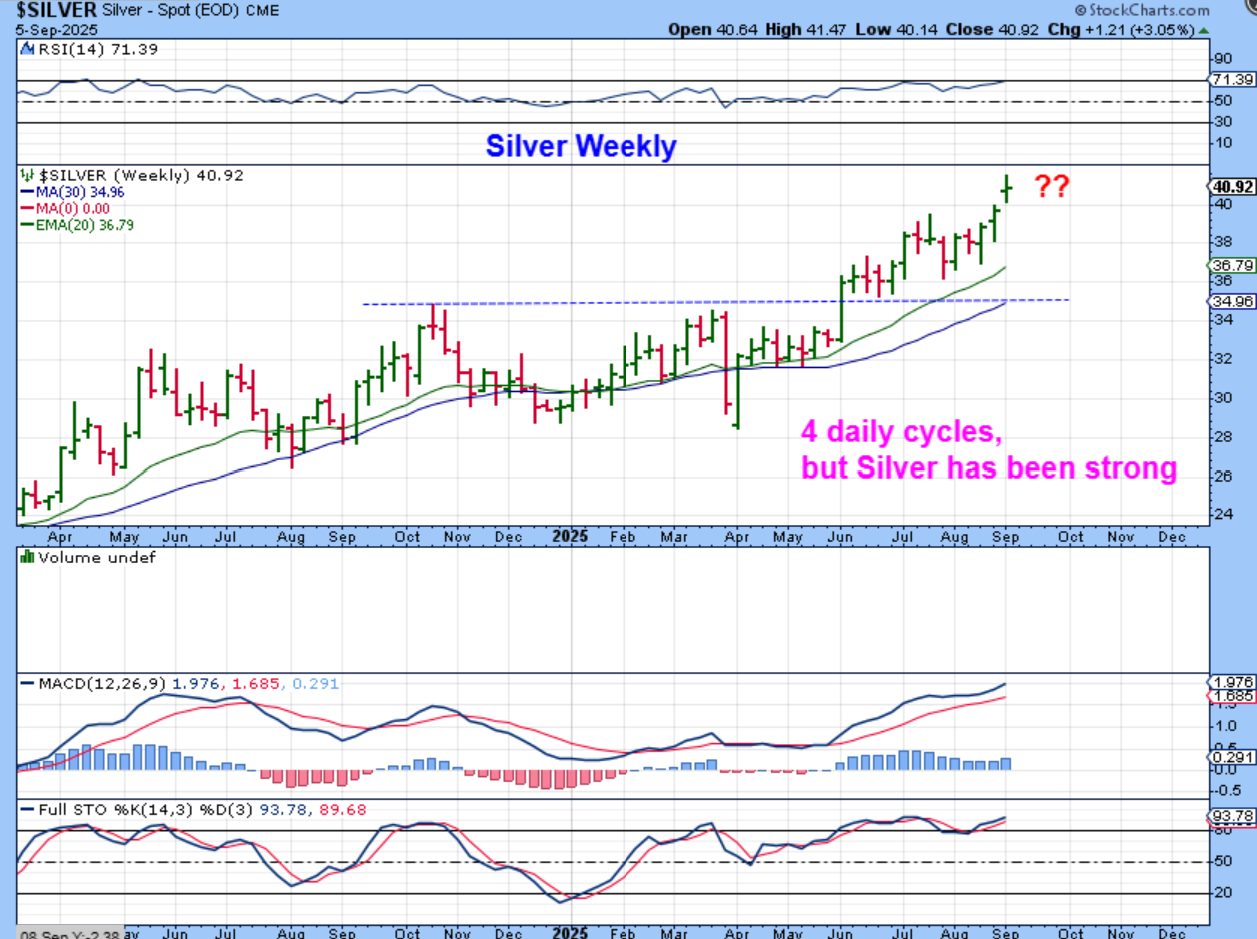
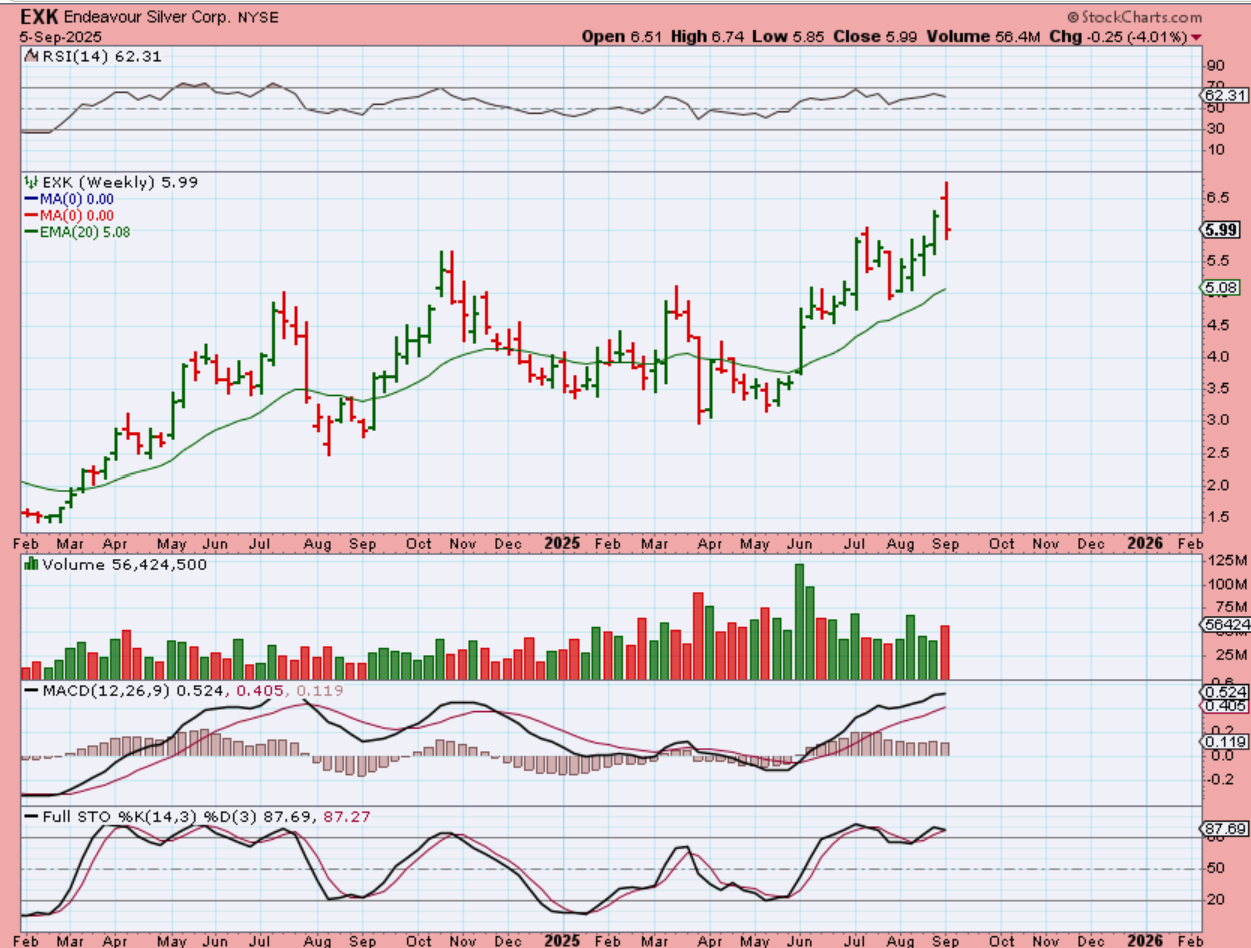
SILVER was up 3%, but it was actually up more than that and it eventually sold off into a doji candle or indecision candle. The problem here is that some Silver Miners, like EXK, FSM, MAG, ASM, and AG were actually red for the week. So we have a mixed set up in precious metals again, but Silver is still bullish too. Does this mean that Silver will pull back heading into the Fed? Well, this is the 4th daily cycle, so ‘time’ seems late, but it surely was a strong one too. Surprises can continue to the upside.
.
So it was a little odd to see some Silver Miners, like EXK, FSM, MAG, ASM, and AG actually close red for the week when Silver was up 3% and Gold was up 4%.
.
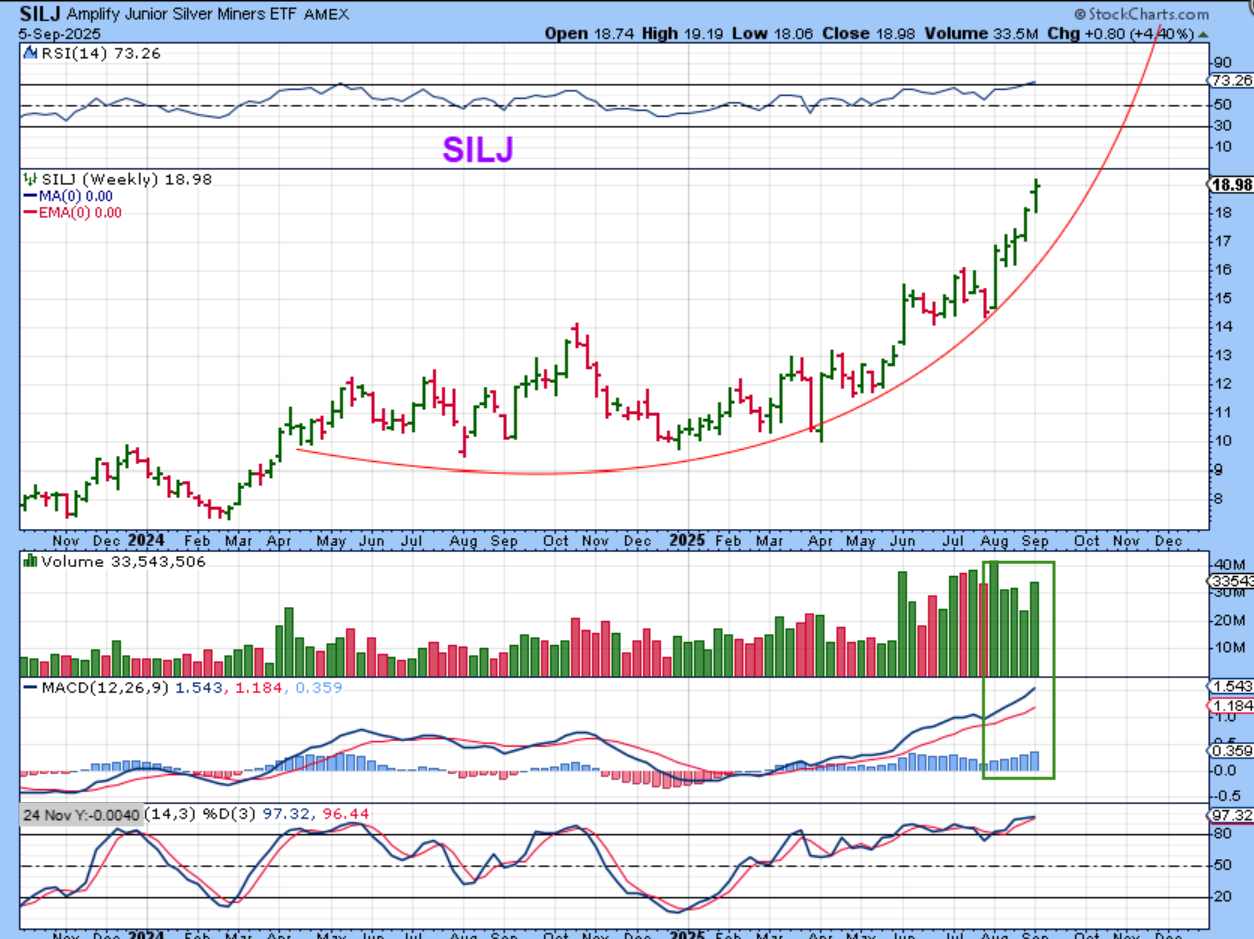
SILJ:
DON”T GET ME WRONG – Junior Silver Miners are starting to run at an incline too 🙂 They are bullish, and volume is increasing nicely.
.
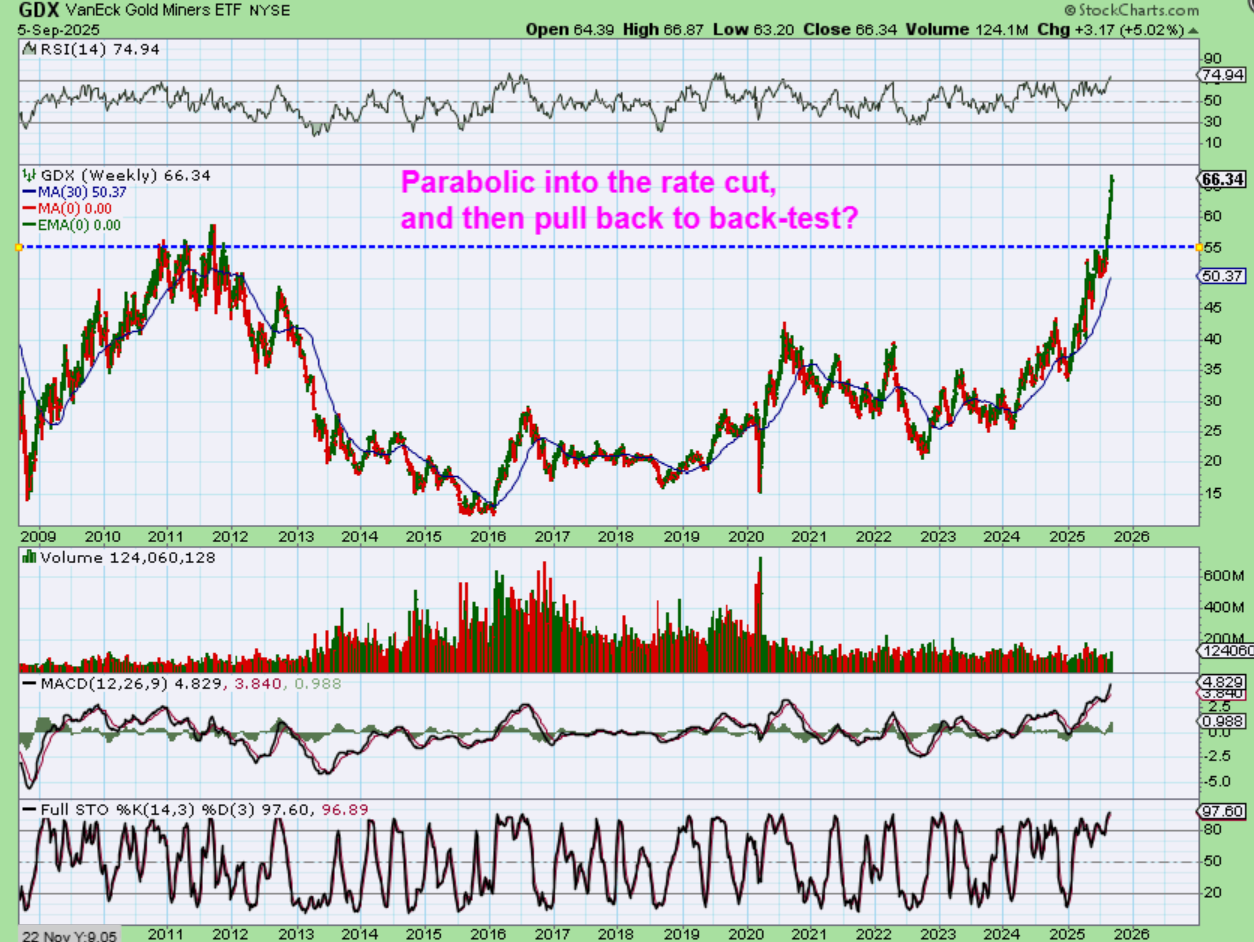
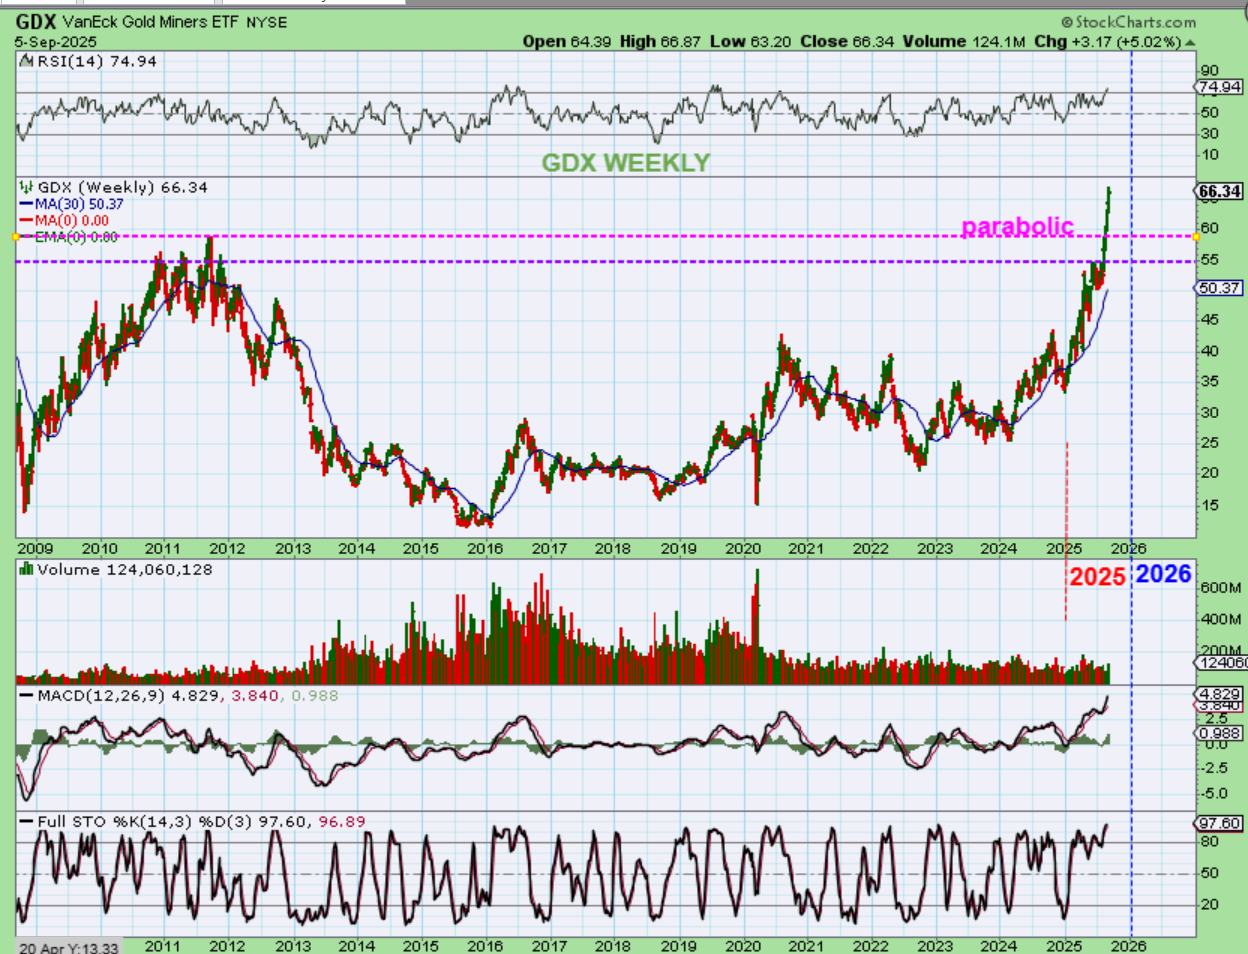
And now we get to the Miners in general and some of them do look like they are already going parabolic. I don’t want to scare anyone out of positions, especially with that GOLD set up breaking out from a large triangle, but parabolic moves can top out and drop fast, so use stops. When they finish their climb, they often do not pull back gently, they crash down as profit takers rush in. CALLING THAT TOP is often not possible. The run can continue with Gold breaking higher.
.
So here we see that GDX kind of appears to be taking on a parabolic look on the weekly chart. Can this climb continue? Yes. Can it top out and sell off sharply? Yes. It may be the Fed Mtg that acts as a catalyst, especially if you hear people saying that it cannot drop with a rate cut.
.
GDX WEEKLY– I mentioned a few weeks ago that as Gold chopped sideways in that triangle, we were seeing KGC, IAG, EGO, AEM, etc ‘leading the way higher’. So if this is what Miners are doing and they were leading the way, then it would seem that GOLD can do this out of that triangle too.
.
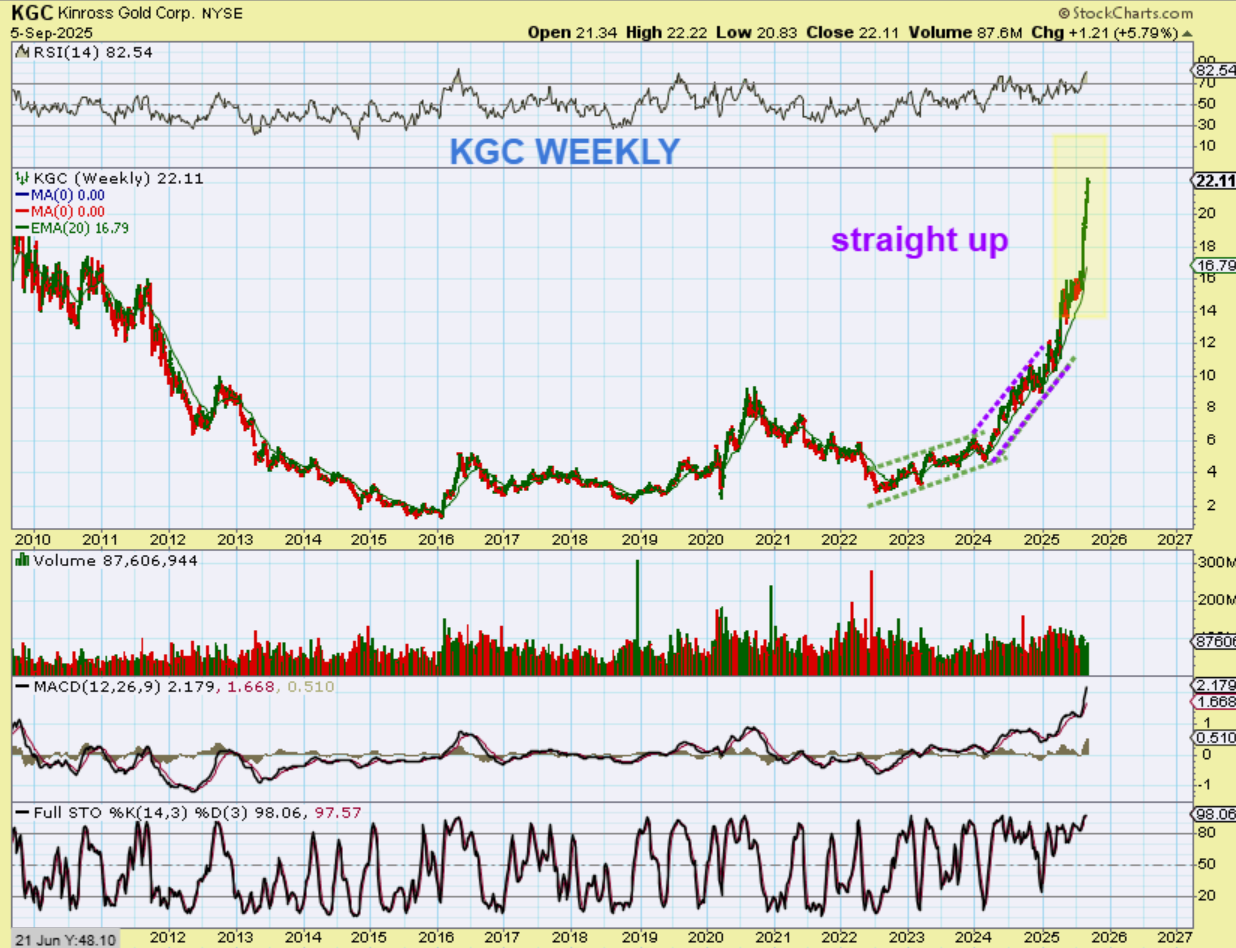
KGC WEEKLY– Again, I don’t want to scare someone out of position when Gold is just breaking out and running, but some of these moves are straight up on a weekly chart, and they do eventually become unsustainable. CAN this run higher? Yes. And if Gold back tests the breakout and then makes another run higher, could KGC put on a bull pennant and the do a final run up? It could, but at this point I’m just thinking USE A STOP. Maybe sell some profit if you have a big position & do not ant to risk a sharp drop.
.
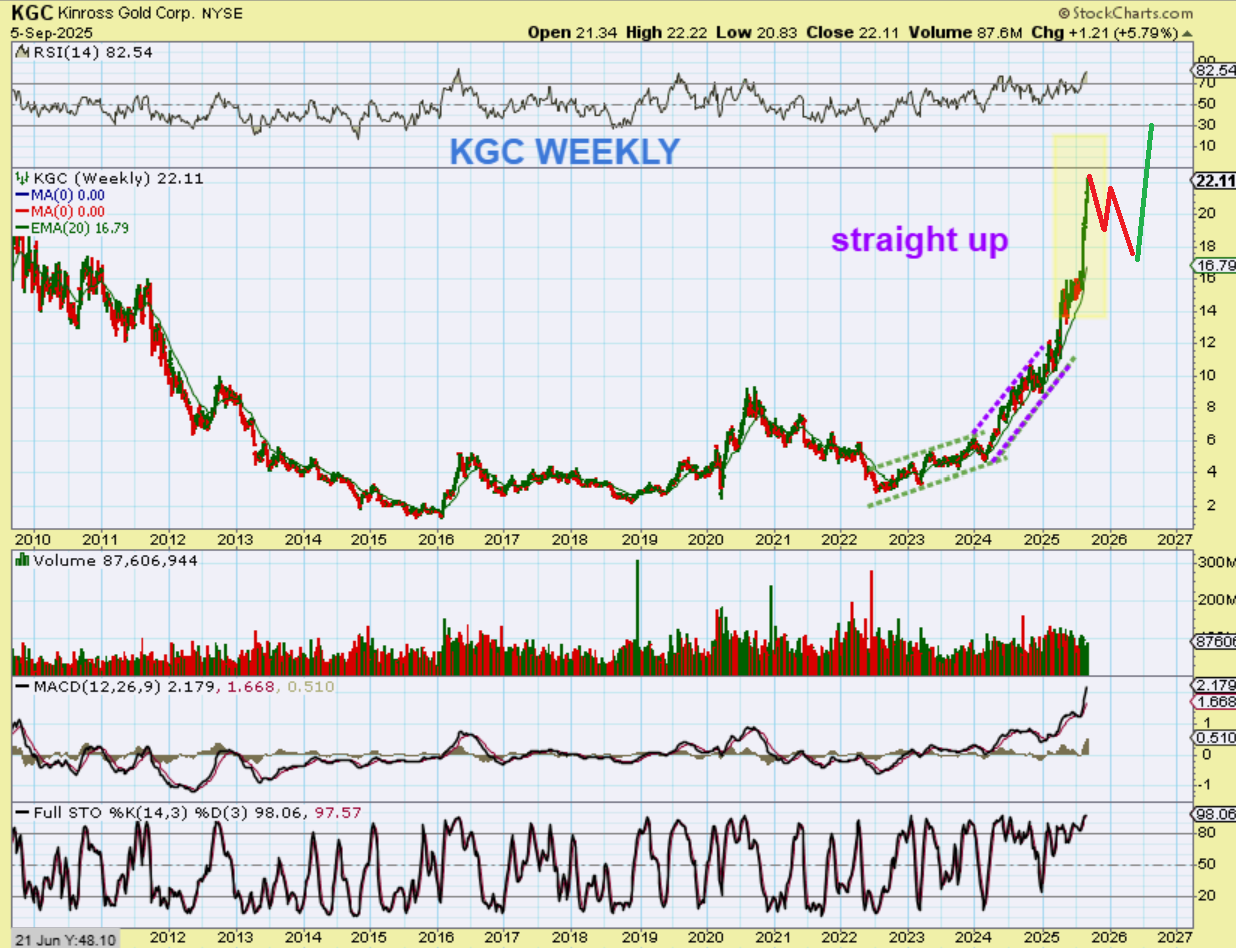
And if Gold back tests the breakout and then makes another run higher, could KGC put on a bull pennant and the do a final run up? It could. I drew it exaggerated here- it may play out quicker and not drag out into next year. So we’ll just see how these play out over time. What might the daily chart look like on these?
.
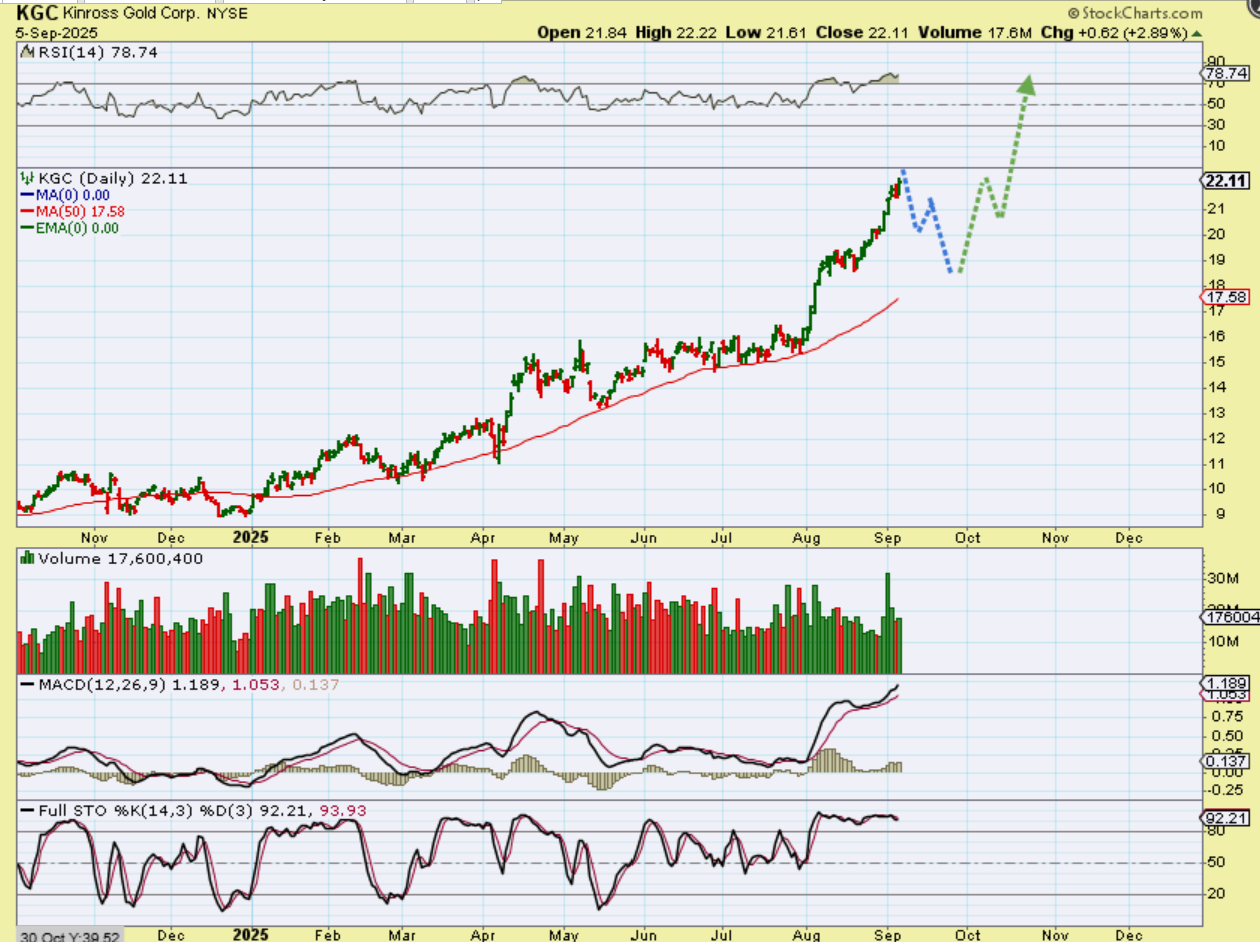
What might the daily chart look like on these? Well, the recent move has been very strong, but it doesn’t look as ‘parabolic’ on the daily chart, so a dip to the 50sma and another run after that could look like this and that represents the weekly chart above too (In that shorter timeframe).
.
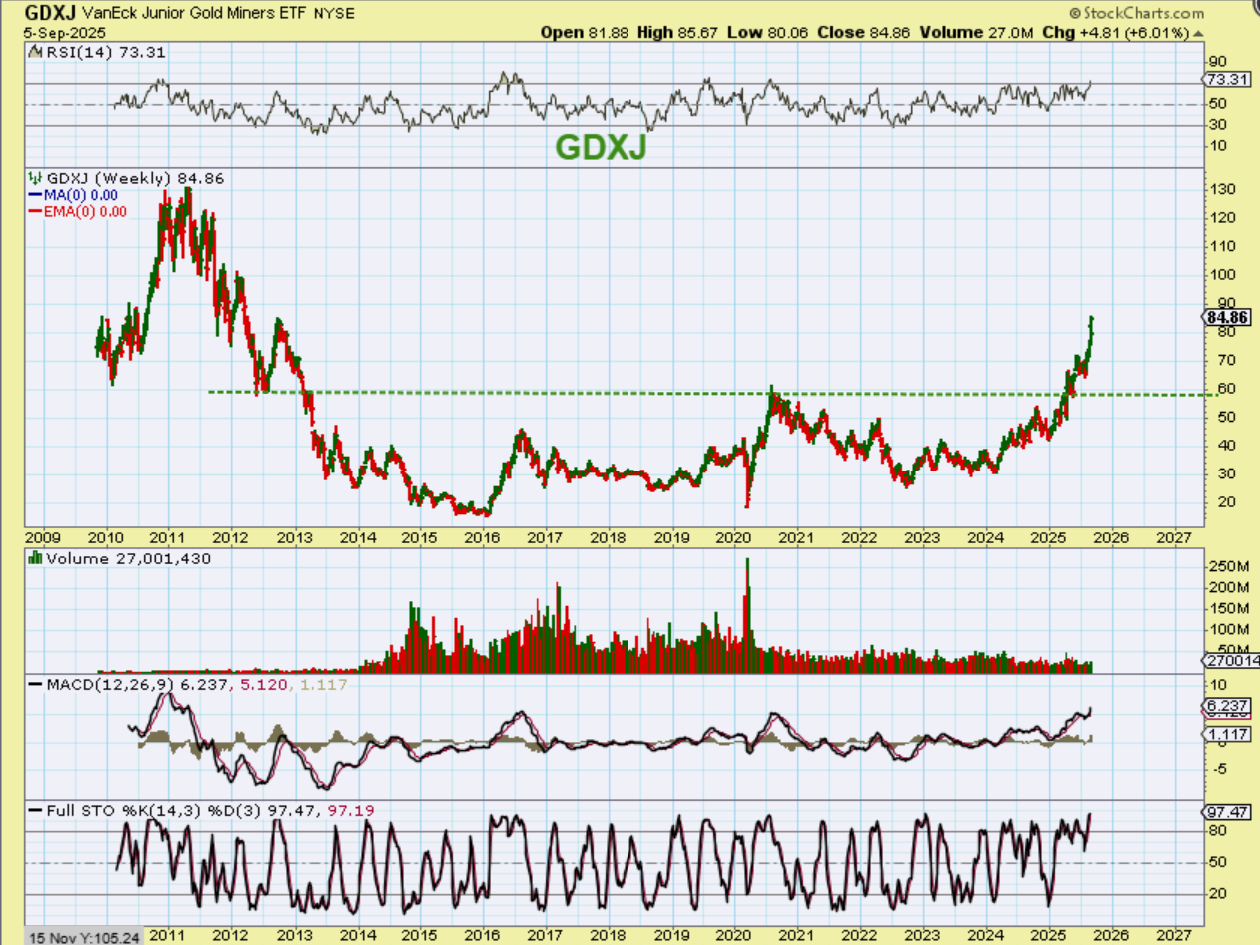
GDXJ: Last week I showed that The GDX is back to prior highs, but the Juniors usually start to run later in the bull market. Well, here we see that they broke from their base in 2025 and have been starting to also accelerate over the past few weeks. I’d like to see more volume, but the buyers are there, price is going straight up. If we get a dip, BUY THAT DIP.
.
The Bulls do remain in control, but the Gold Bull and its Miners really took off running recently, after the Fed hinted at rate cuts. I’d like to see Silver play catch up a bit quicker, but on a 4th daily cycle, it might need its own dip lower first. Then maybe the silver Miners will continue to do what the gold miners have been doing. Bitcoin will be discussed below. It has been choppy and the Bull there was resting, but is it ready to go? It could be.
Enjoy your weekend everyone!
.
~ALEX
.
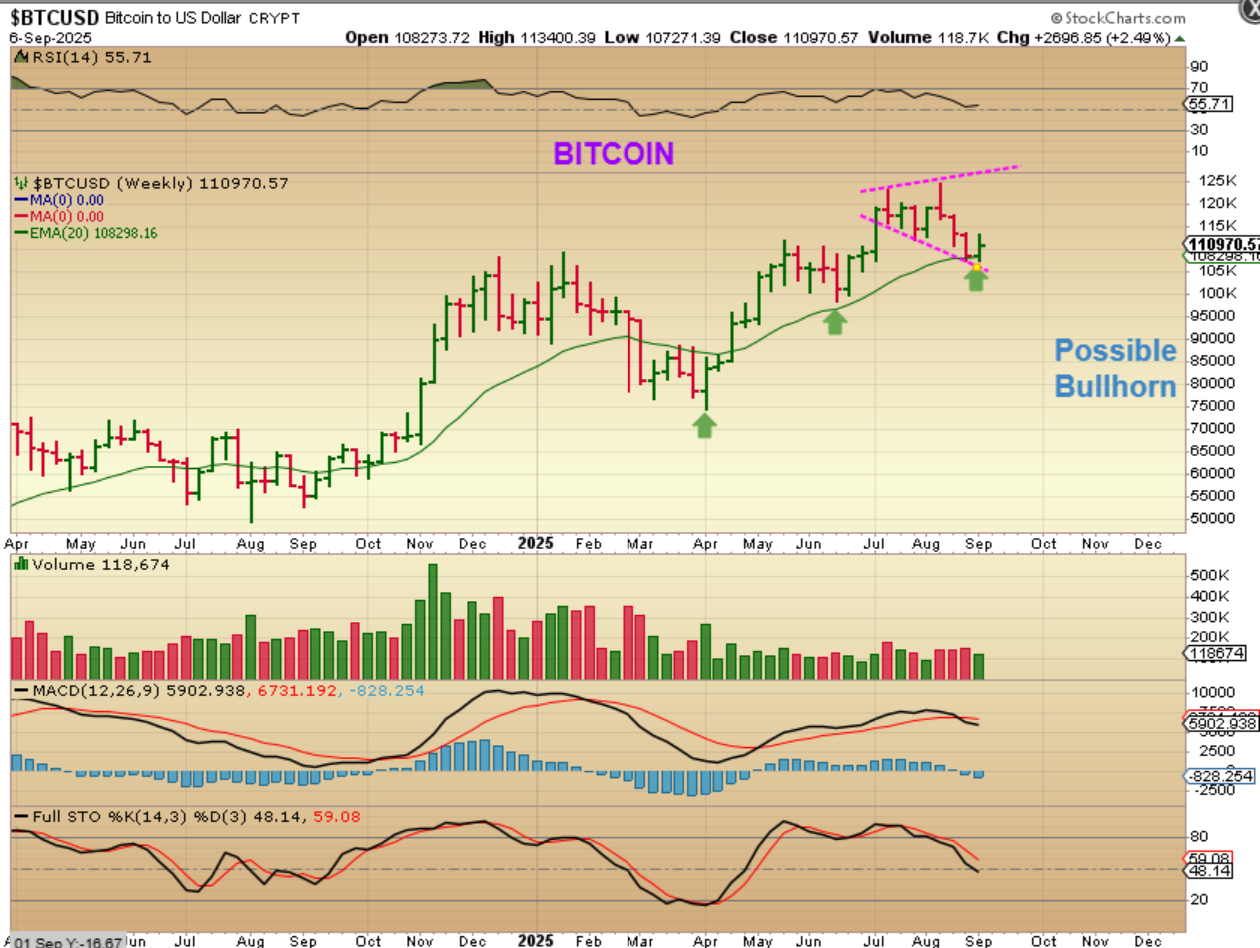
Bitcoin reversed as expected, since we are late in the daily cycle count. Below is the weekly chart and we may be forming a bullhorn here. If it is, we would run to new highs above that $125,000 plus area again. SOME Crypto stocks ran first and many were slightly red for the week, so that leads me to another thought…
.
Some Crypto stocks ran first, but many were slightly red for the week with Bitcoin up, so that leads me to this thought.
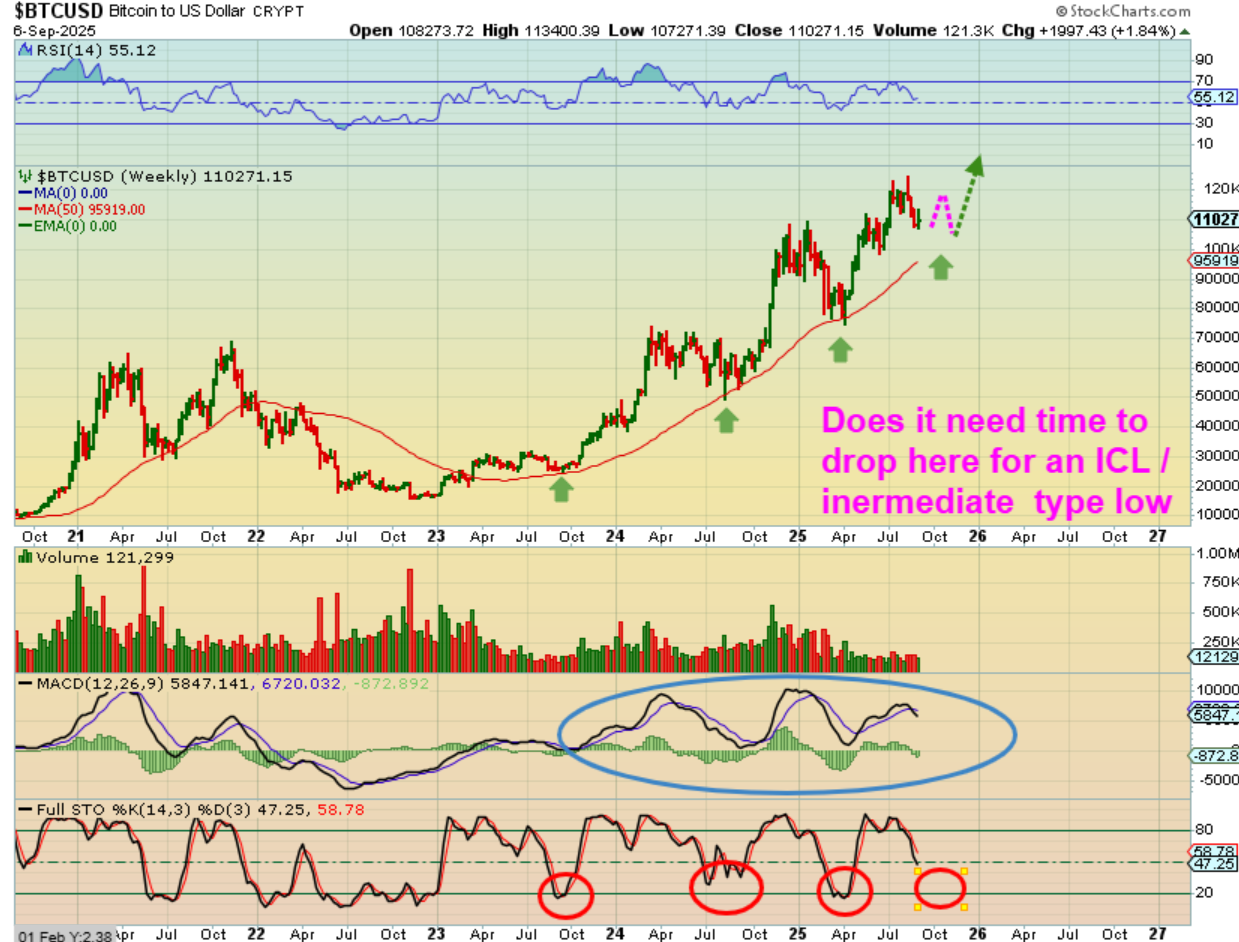
Is it possible that we need more of a weaker daily cycle now, to give us a drop that resembles an ICL at the 50 week ma? Past drops can be seen tagging that 50 week ma, and we may need to chop around and then drop there into say…October.
.
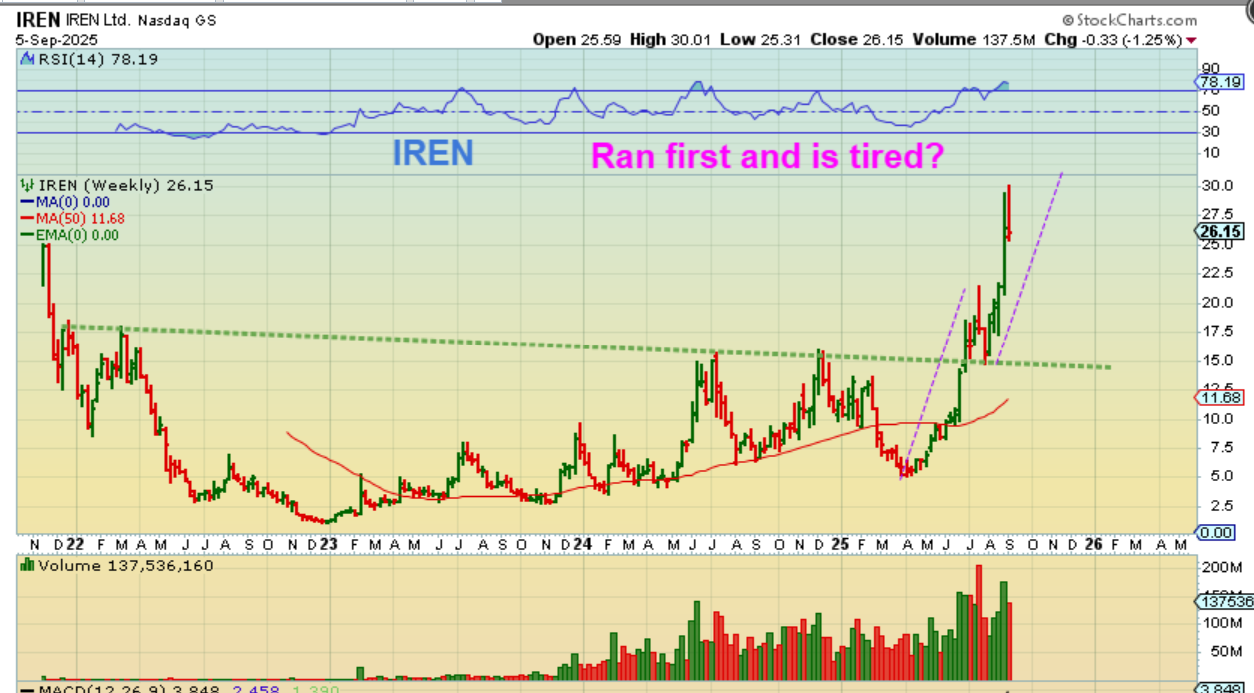
Some Crypto stocks ran with Bitcoin dropping and several are up near their recent highs. They were slightly red for the week though, as Bitcoin moved higher, so let’s look at weekly charts.
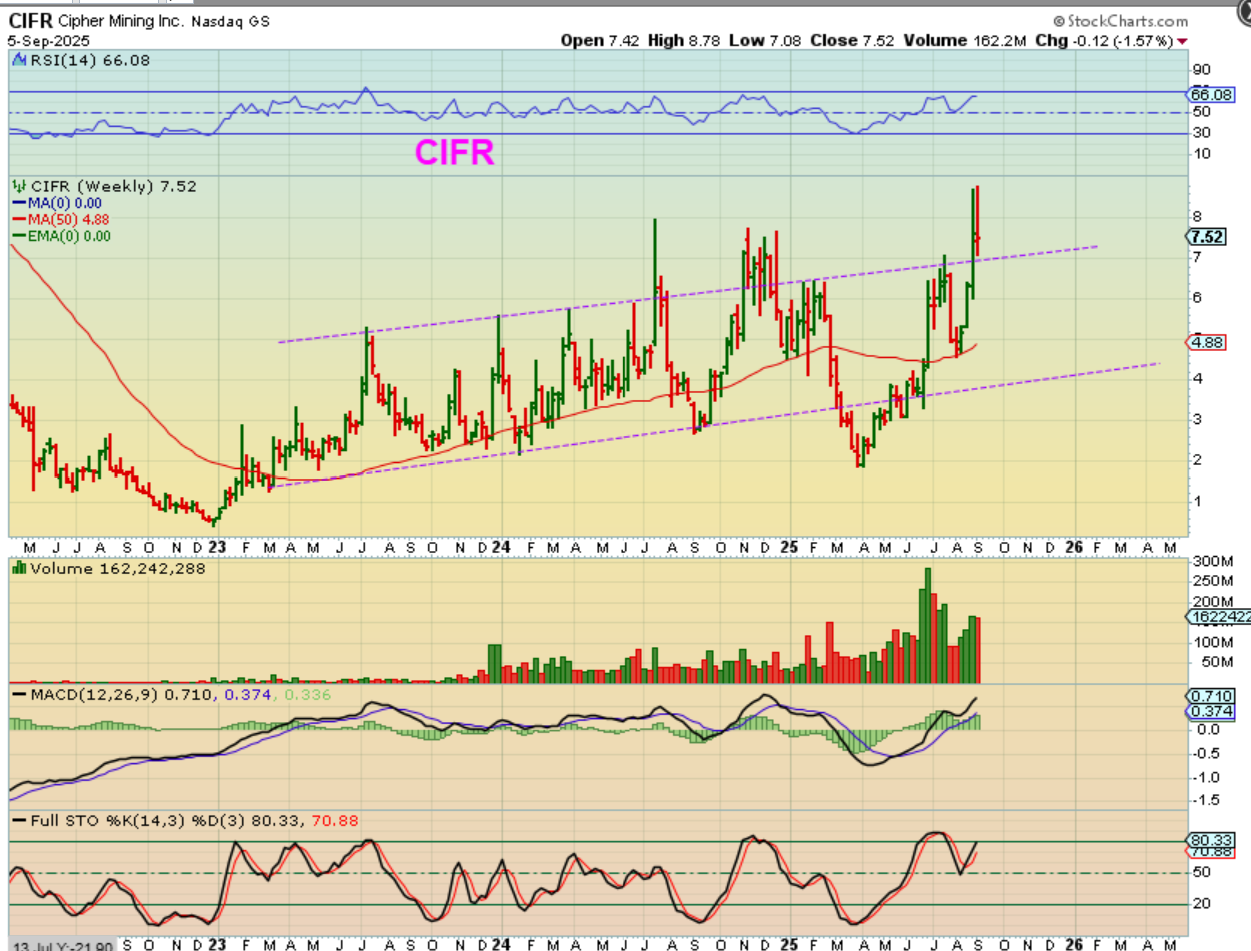
CIFR WEEKLY – CIFR was red as Bitcoin reversed higher. Does it need a rest and a consolidation as bitcoin finds that 50 week ma? Maybe.
IREN WEEKLY was red too. It is also extended, so is it also in need of a consolidation as bitcoin chops around? It is really hard to say, but I am thinking that Bitcoin need to run quickly soon, or we get a weaker daily cycle.
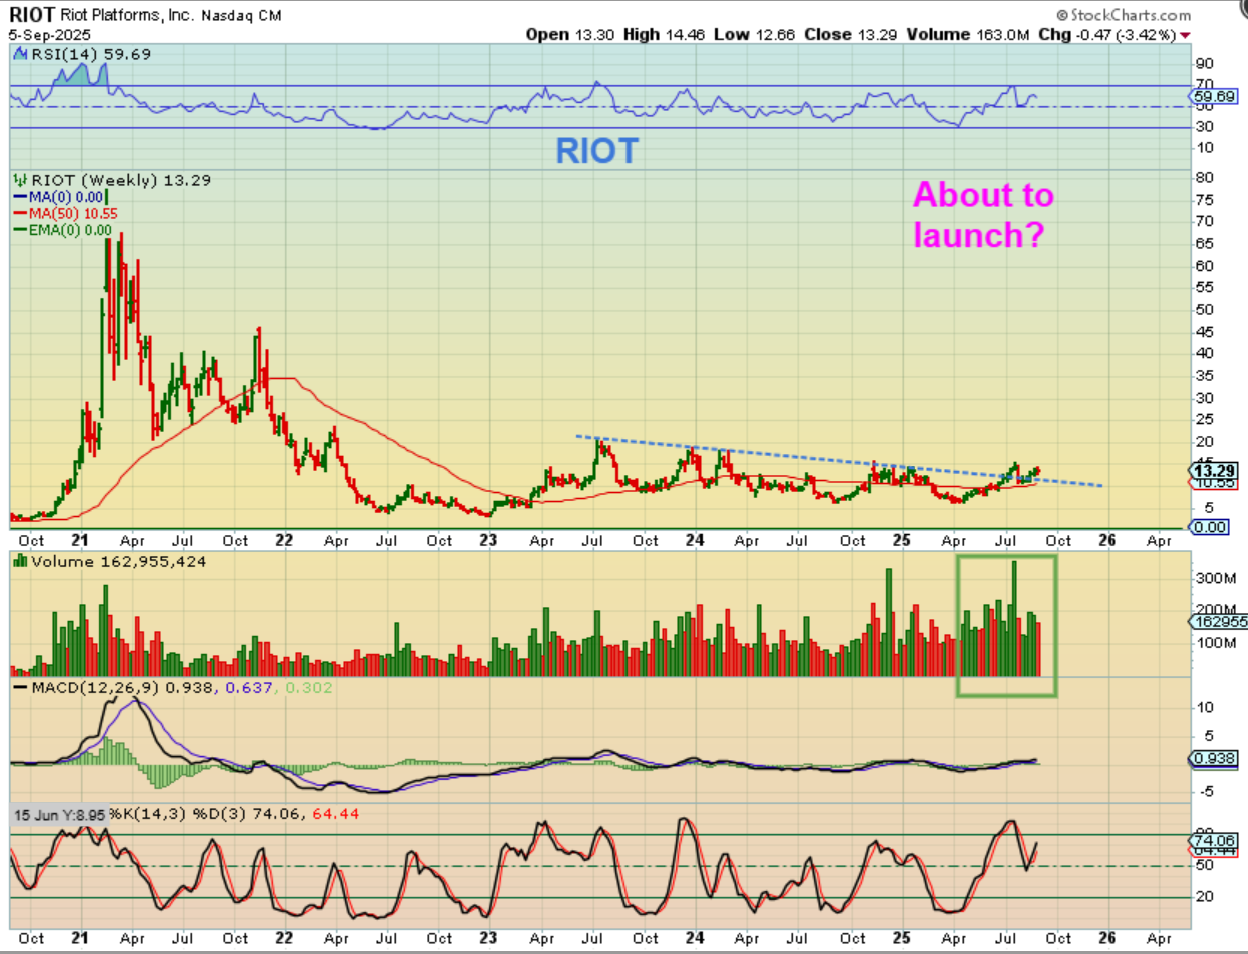
And then you have RIOT, MARA, CLSK, BTDR, etc: These chopped sideways for the most part. Nice bases too. This may indicate that bitcoin will chop around and drop into more of an ICL low in October and THEN these will join in.
.
These were red too, but look at that upside potential if Bitcoin has one stronger rally left in this 4 year cycle and they join Bitcoin! If this starts to trend higher into next year, I want to own it (them). They move with big %-gains.
.

