.
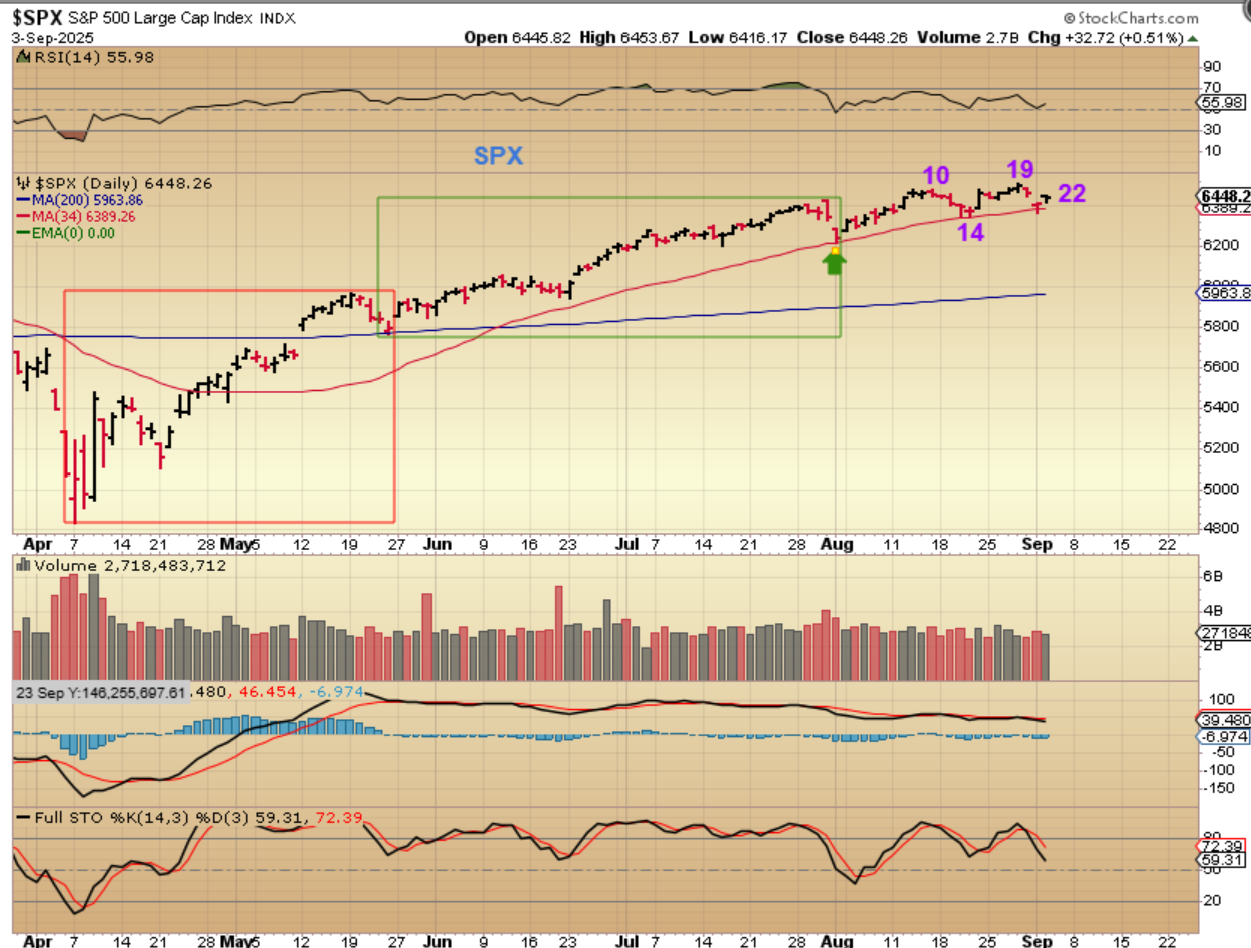
THE SPX popped higher on Wednesday after dropping on Tuesday. We are in the 3rd daily cycle and on day 22, and I am starting to wonder if…
1. We are just going to be stay choppy as the 3rd daily cycle plays out? or…
2. We are just going to be choppy until we see what happens with that Fed Rate Cut? Or..
3. Is this a half cycle low and we could just start to rally higher into that Sept 17th Fed Mtg.? Tuesdays dip was odd though; it was out of nowhere with no big news. We’ll see.
.
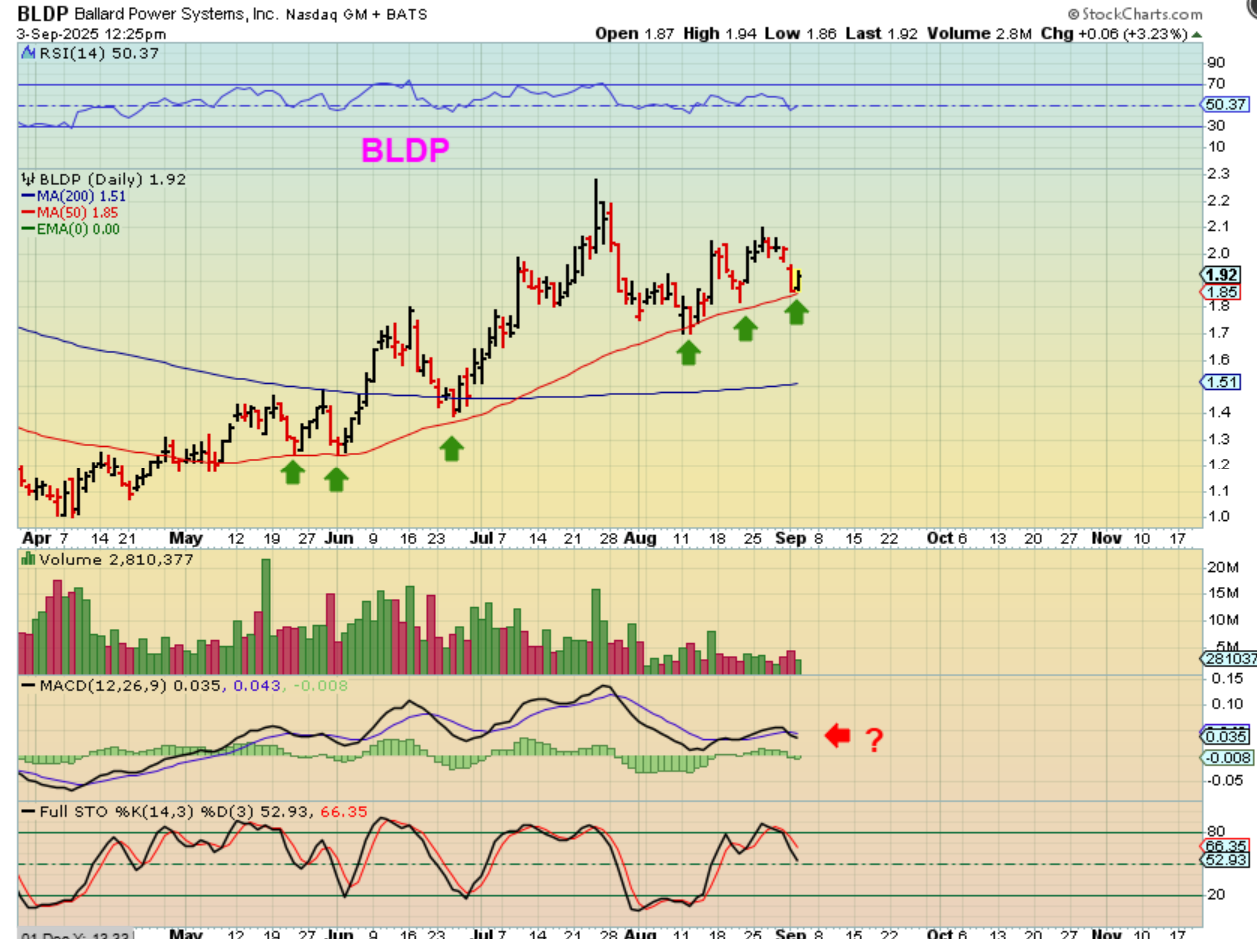
BLDP is sitting on the 50sma, and that has been support in this run. BLDP ran higher and then closed down in this area again, so it may be considered a buy with a stop. USE A TIGHT STOP, because the MACD is weak.
.
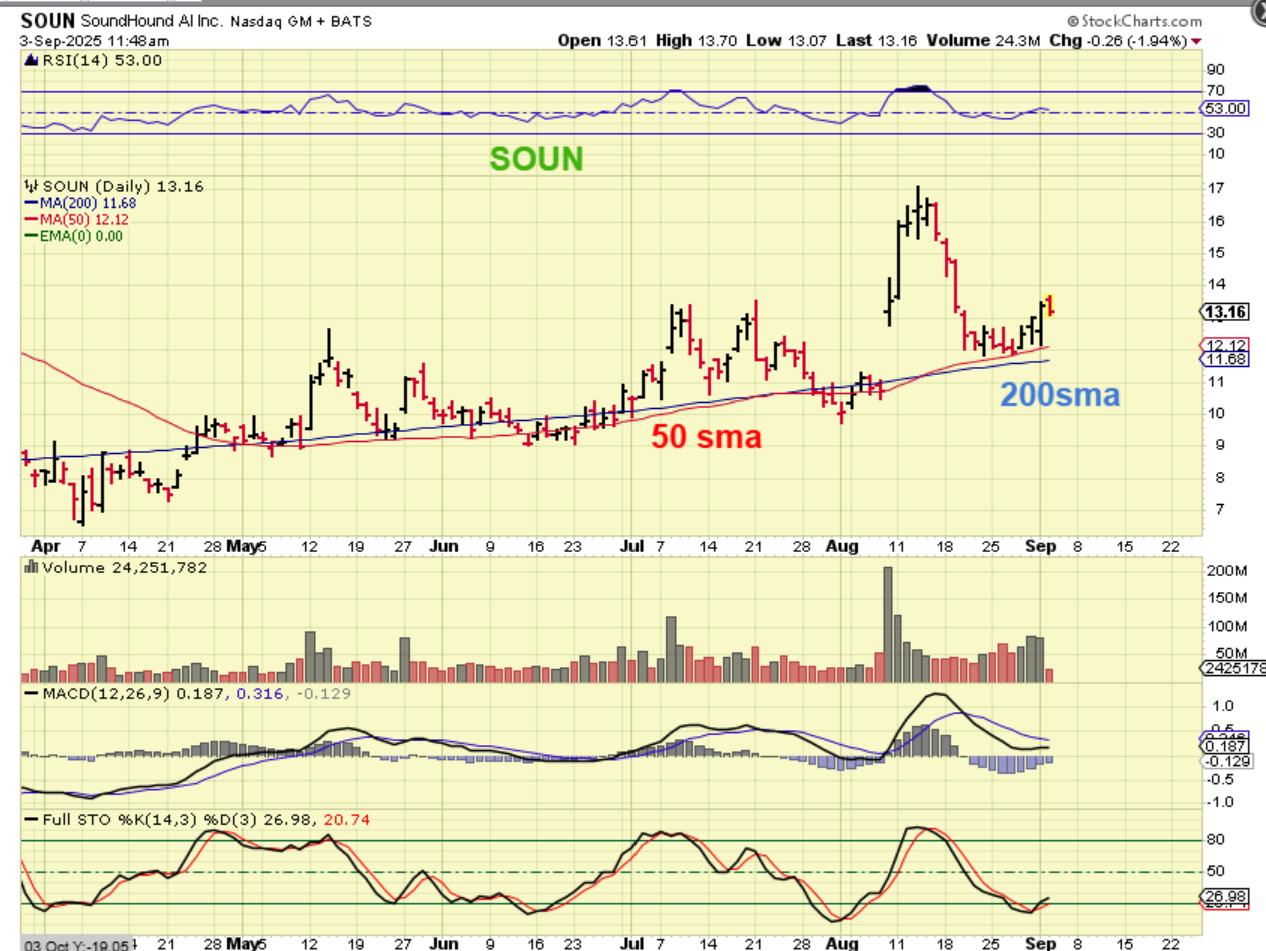
SOUN – After a strong ramp up that came with an earnings release, Price dropped and tagged the 50sma 3 times. I grabbed this chart midday when it was starting to sell down and it closed down 4%. It COULD tag that 50sma again, but with that earnings pop, I would think that it wants to move higher again soon.
.
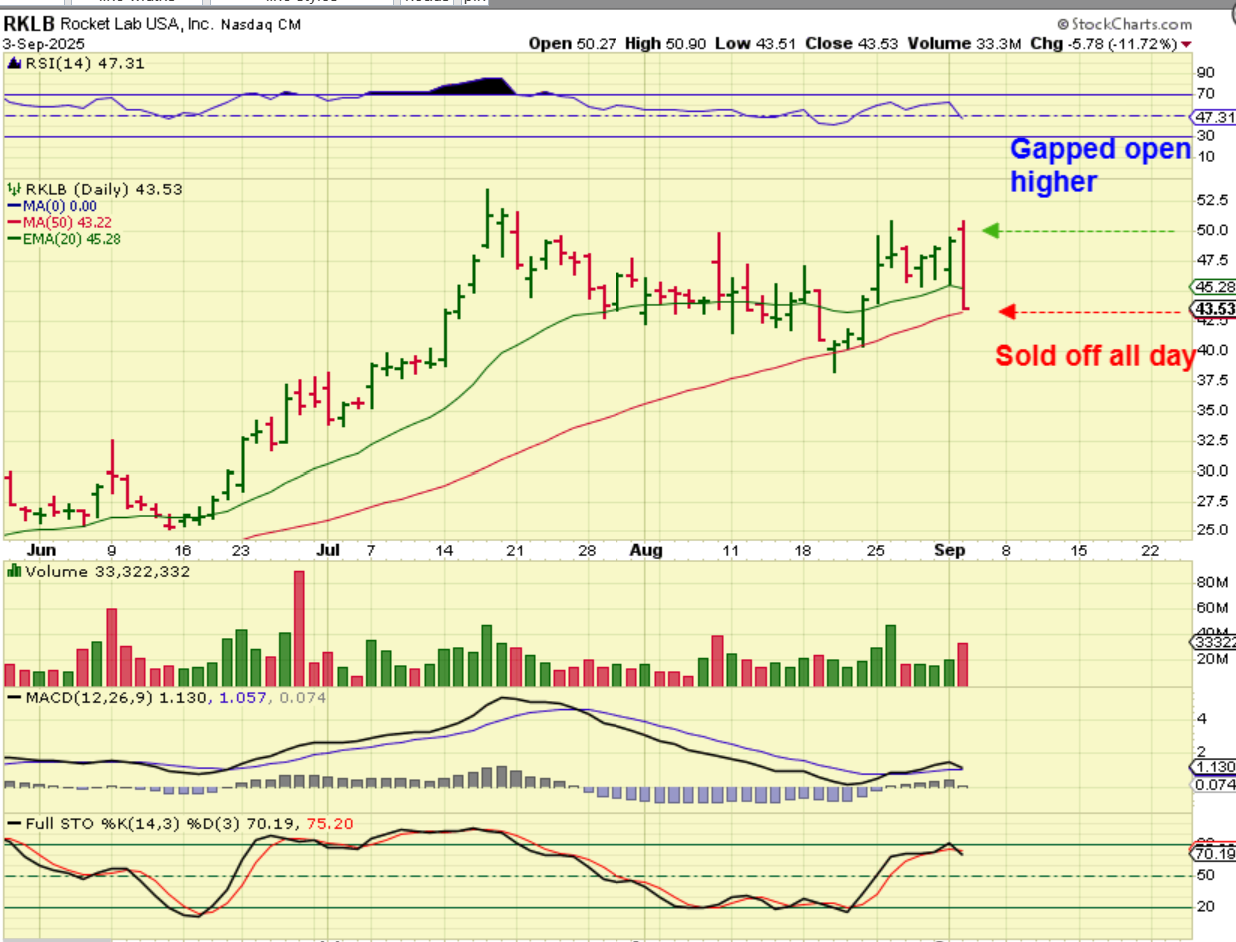
WHAT HAPPENED?
I couldn’t find any news on RKLB, but it gapped higher yesterday and then started to sell off. When I looked at it at the close, it was down to the 50sma again, down almost 12%? Volume swelled and its hard to explain. I’m watching to see if the 50sma holds, but like I said, I couldn’t find any bad news.
.
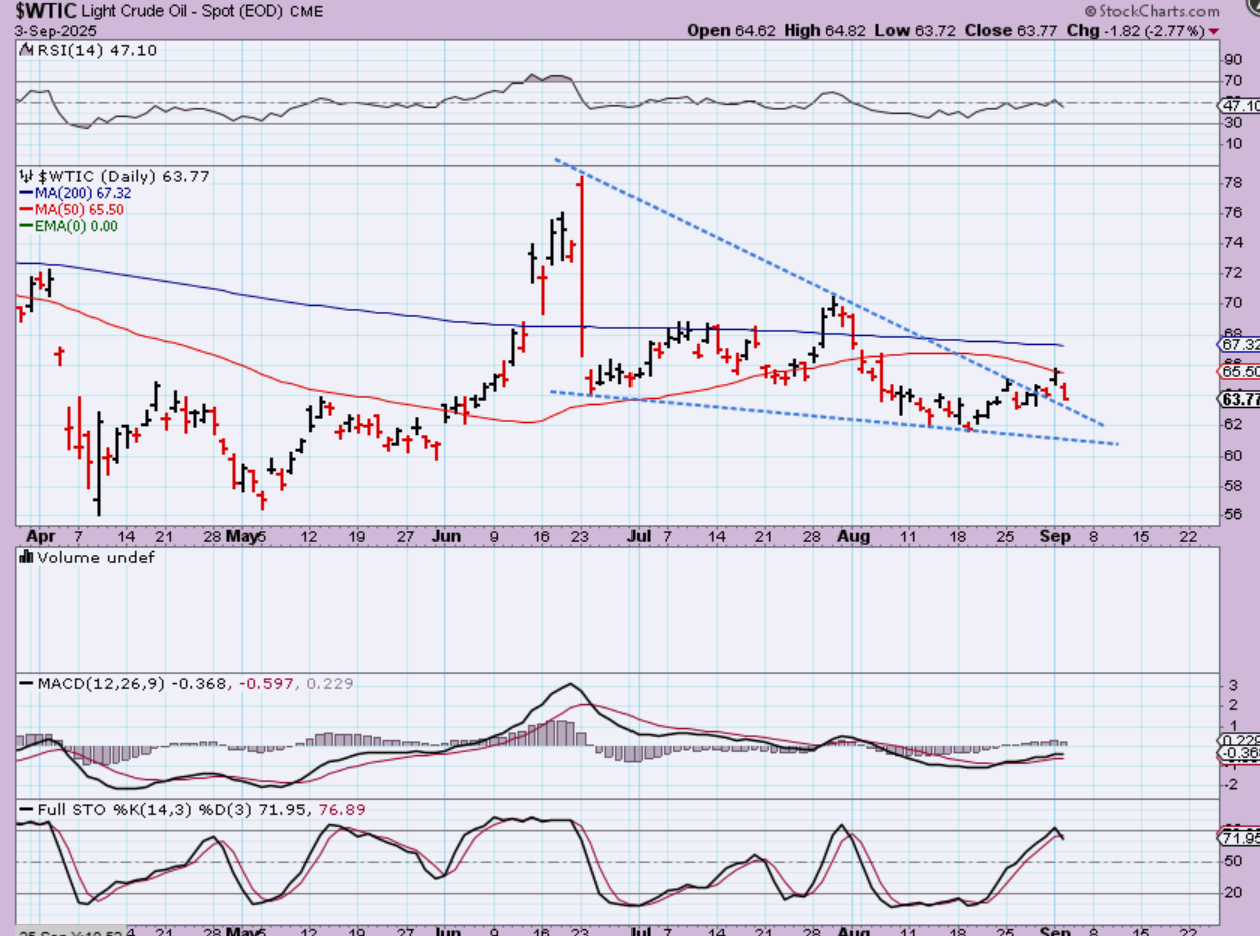
WTIC had bounced up to the 50sma, braking a downtrend and now it has re-tested it.
.
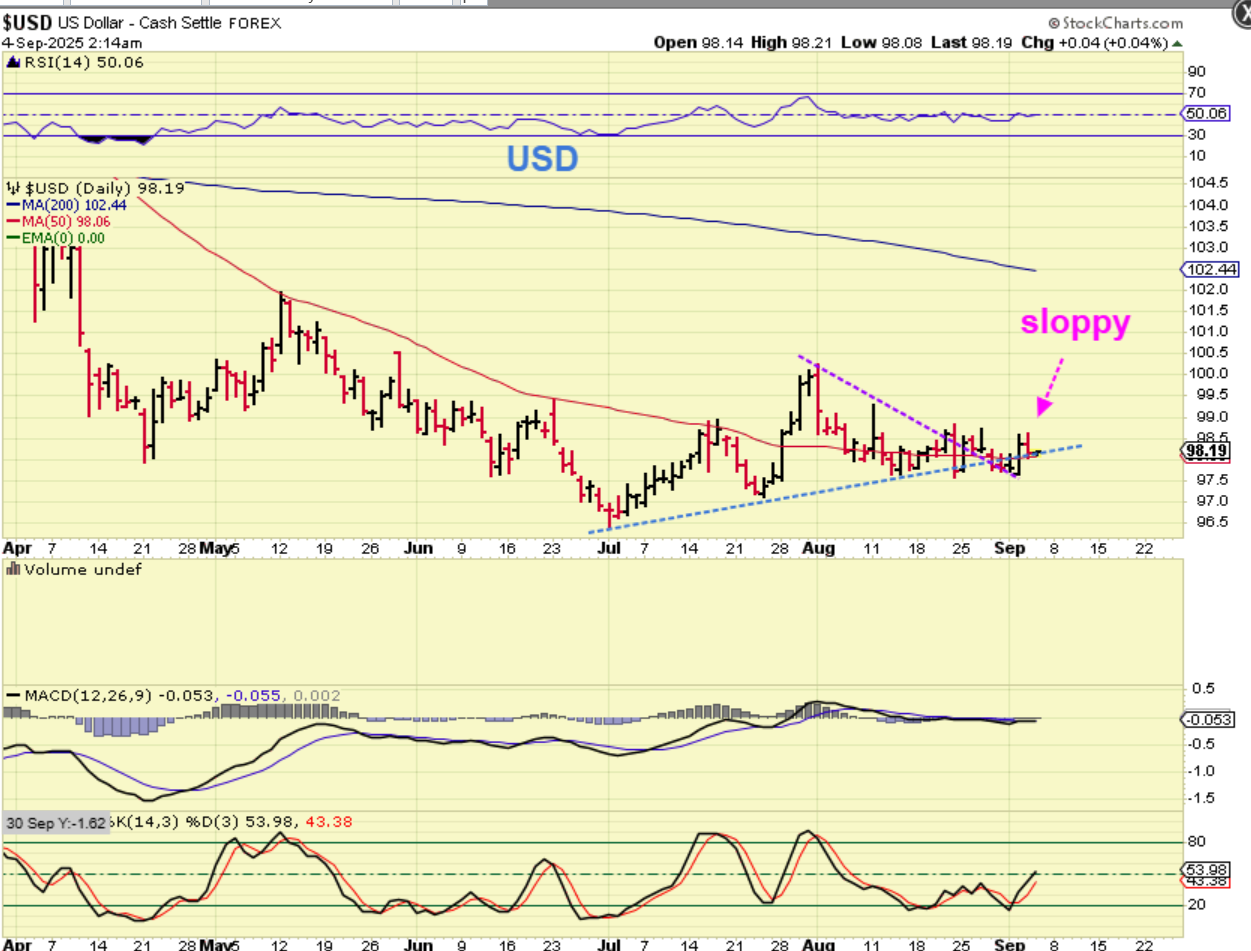
THE USD popped with Gold on Tuesday and dropped while Gold continued higher on Wednesday. It’s a little choppy and sloppy.
.
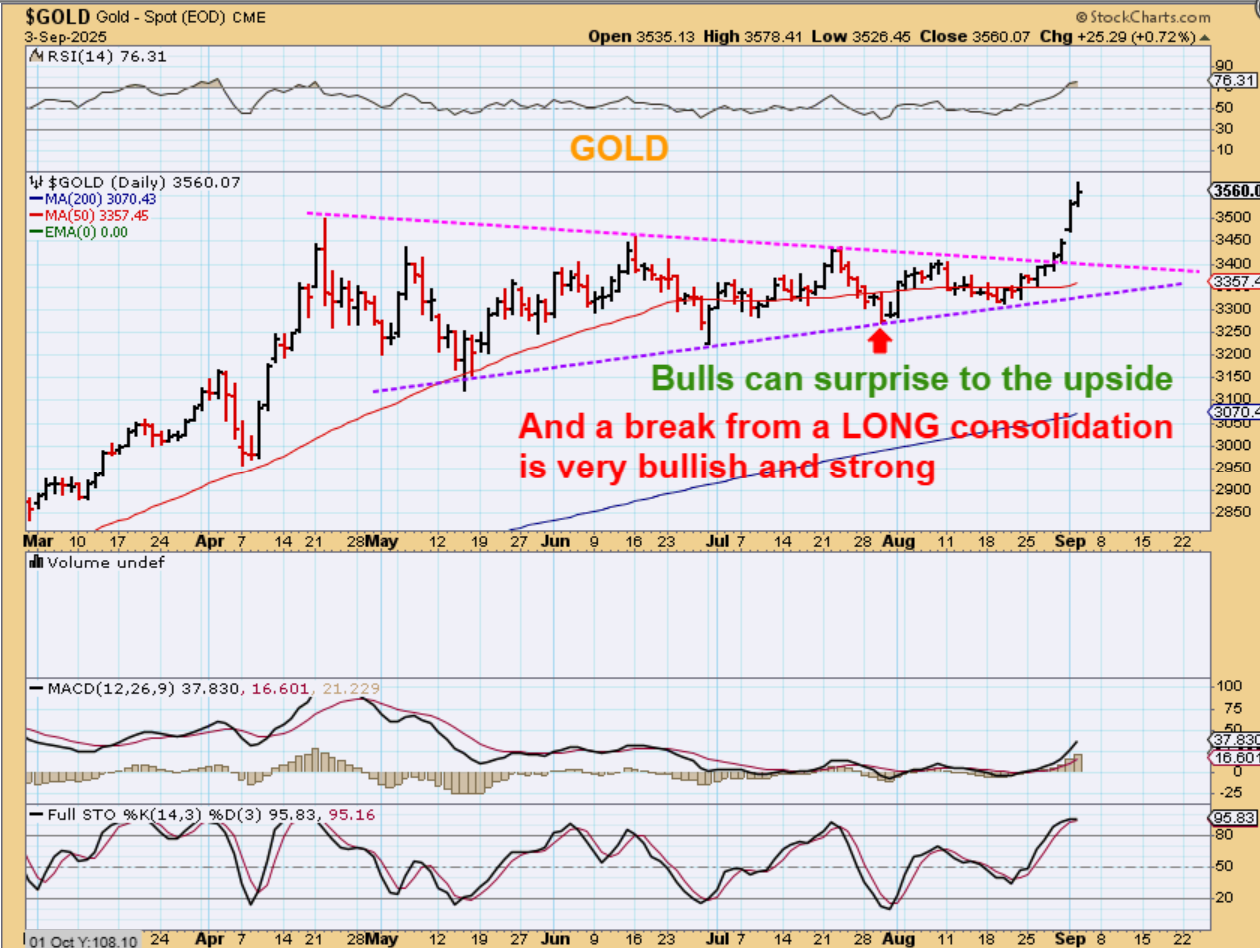
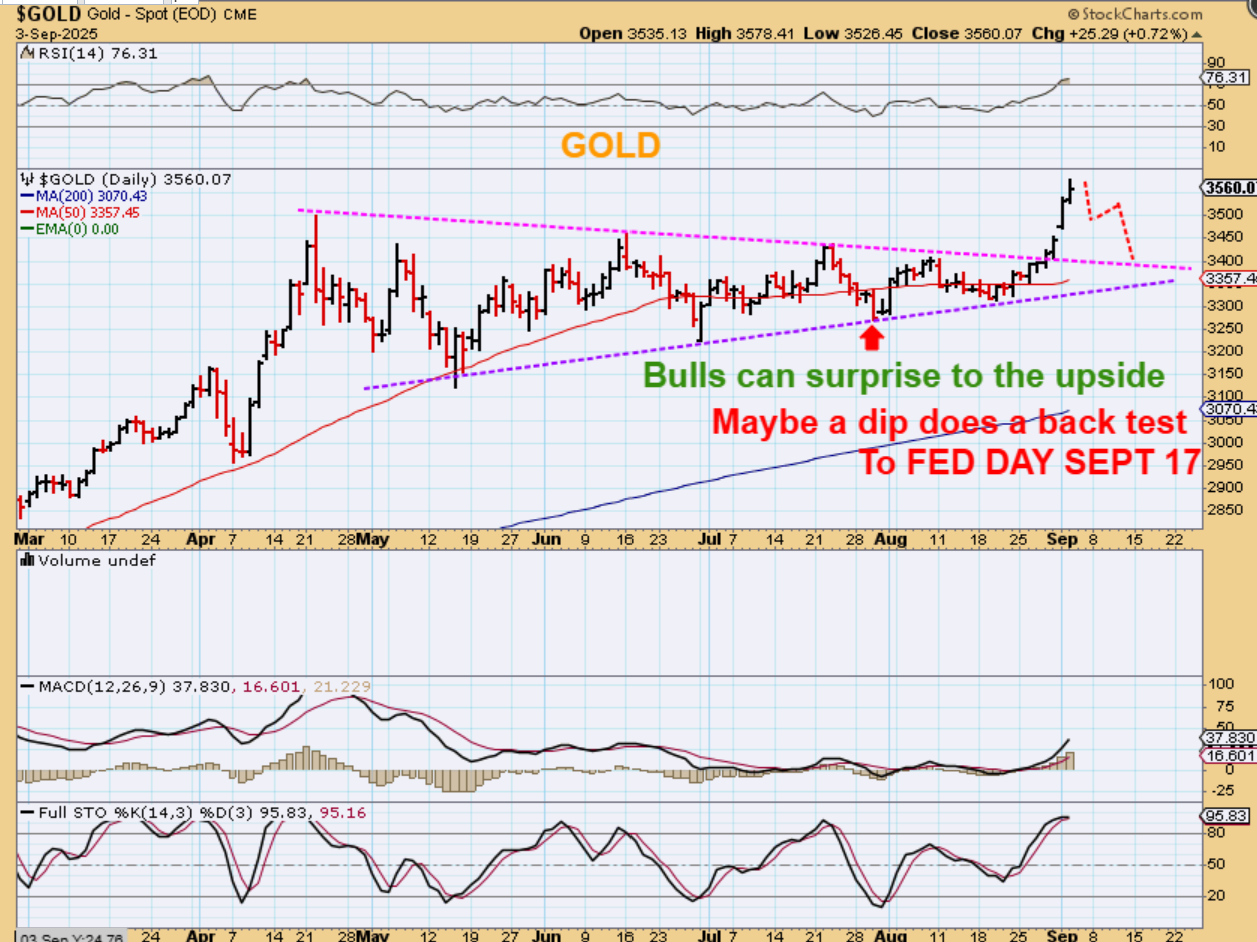
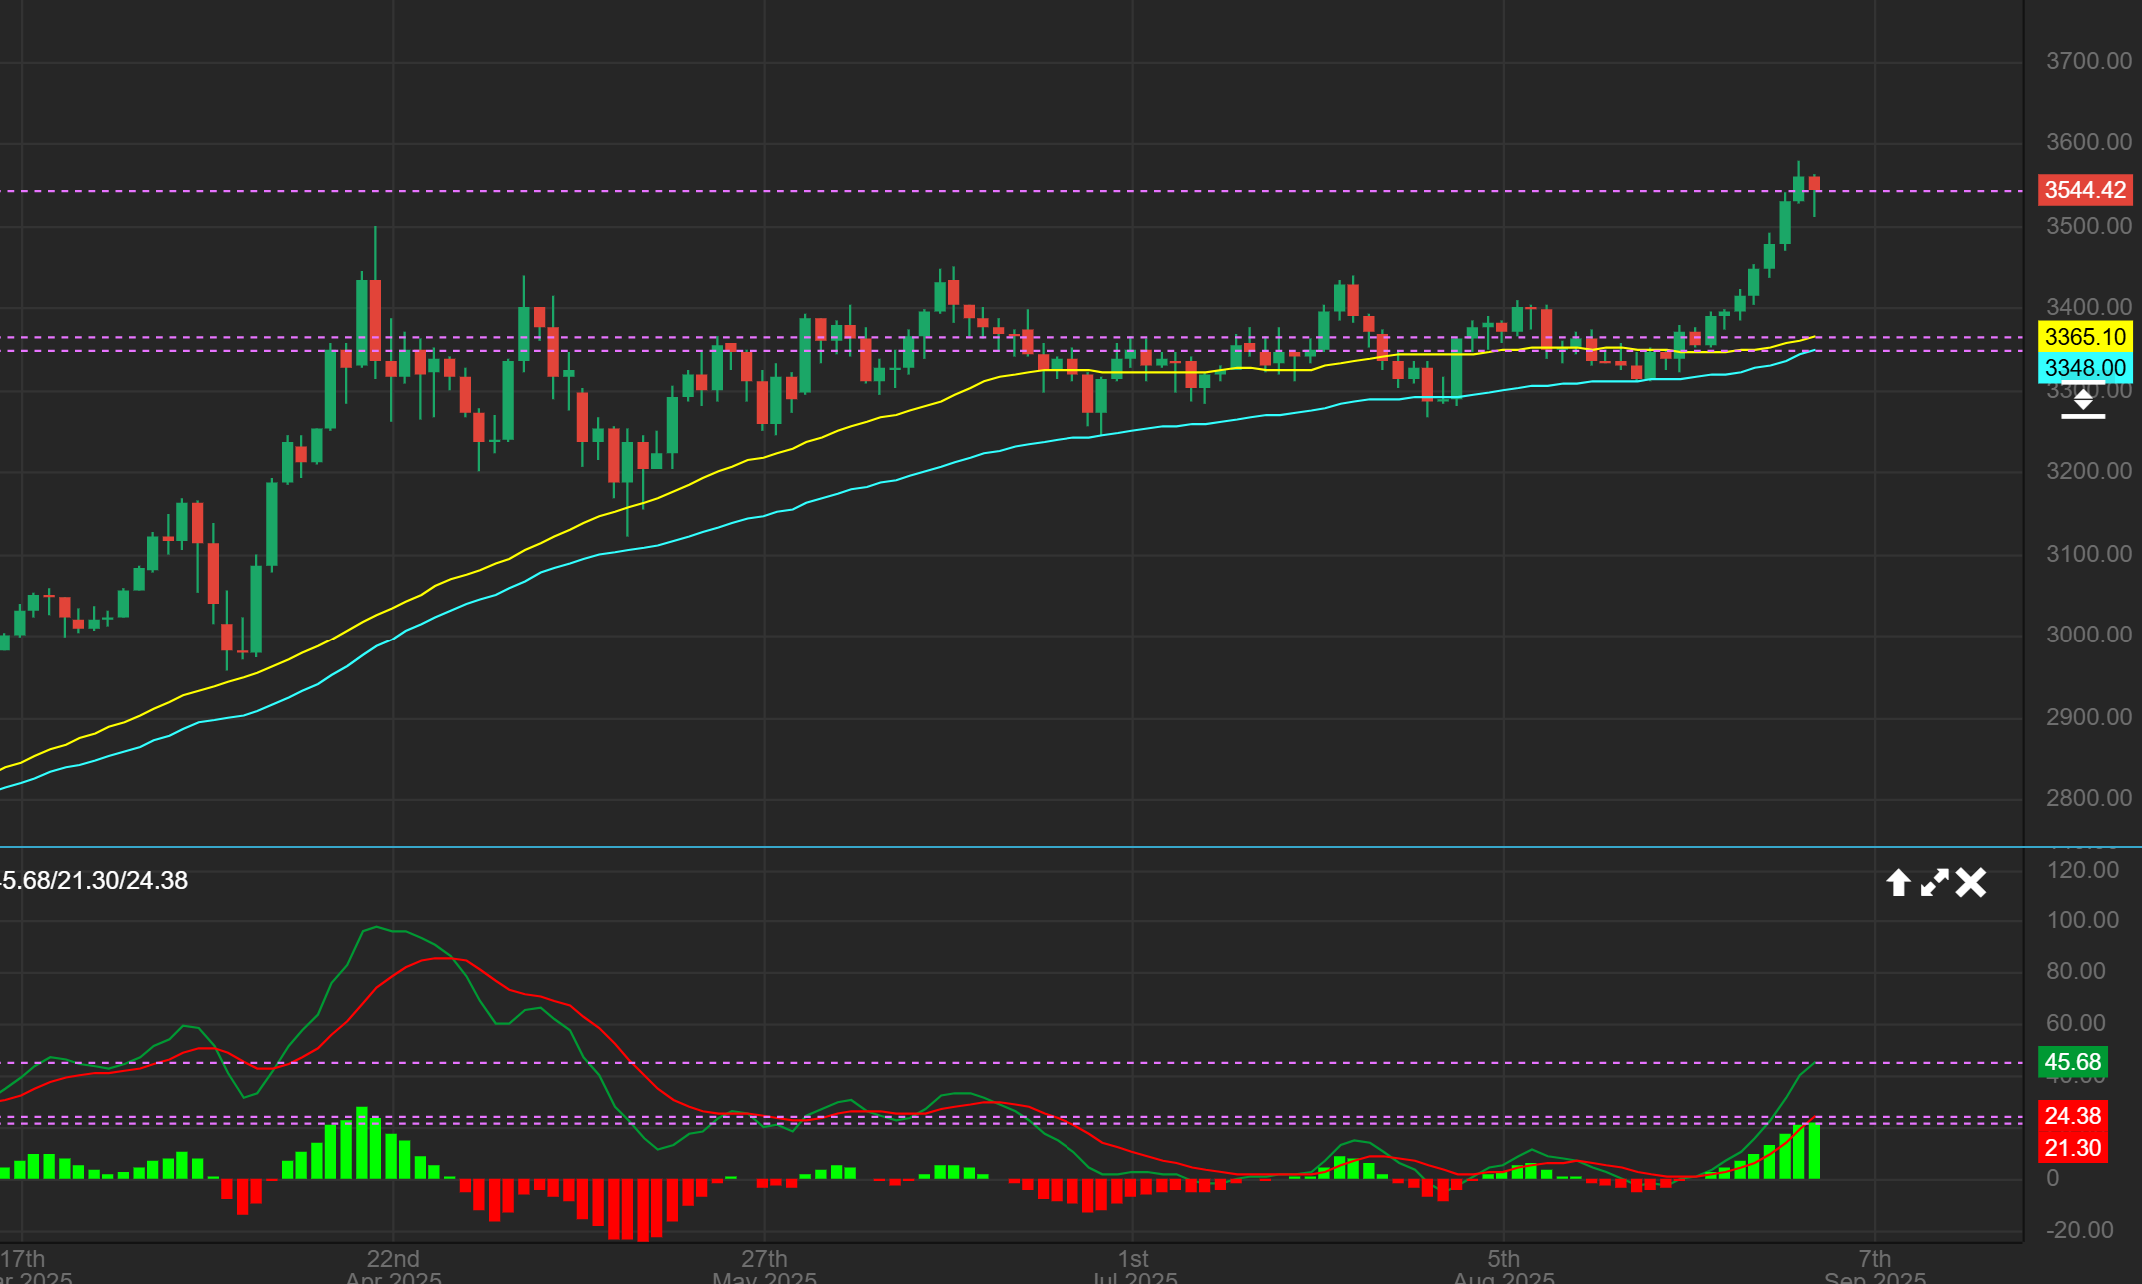
GOLD #1: Gold broke from that triangle consolidation and made another new all-time high. When you get a break from a long consolidation, it can run swiftly, since it has built up energy churning sideways. Let’s briefly discuss a realistic possibility.
.
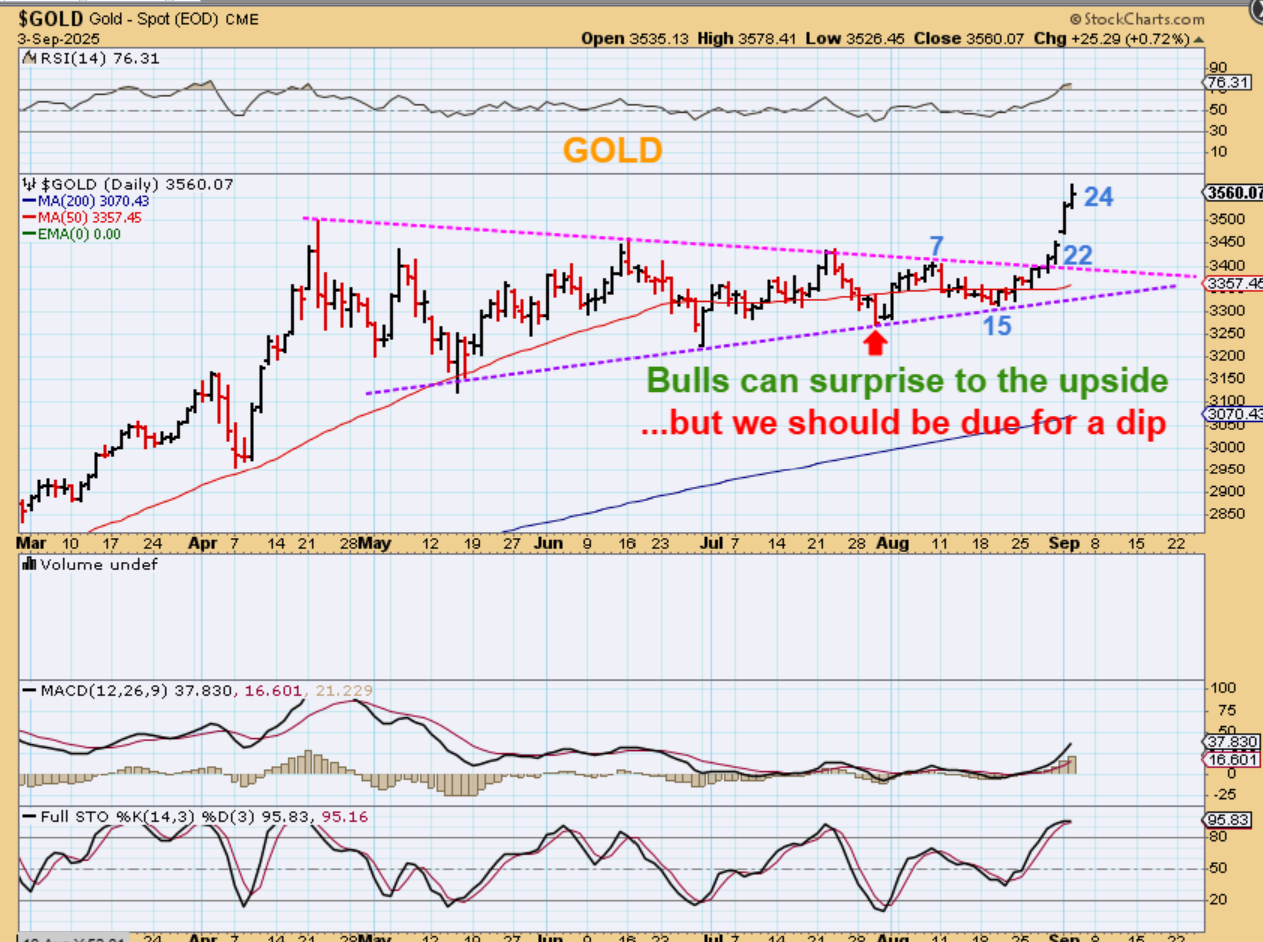
GOLD #2: Let me start by saying that Gold can just keep running after that breakout. That said, we could also look at the GOLD daily cycle count, we should be on day 24, so it is possible that we start to dip into the next dcl (as a back test).
.
GOLD #3 – Gold started to run higher after the Fed Jackson Hole Speech about a likely rate cut. We could drop into the Fed Mtg and then rally from there, since that Fed Day is 10 trading days away. THAT would be day 34.
.
GOLD #4 – This is a 6 am live shot. Gold sold off and is trying to make another come back, but if it does start to slow down and drop back into the Fed Mtg as shown above, Miners will pull back and become a very strong buying opportunity.
.
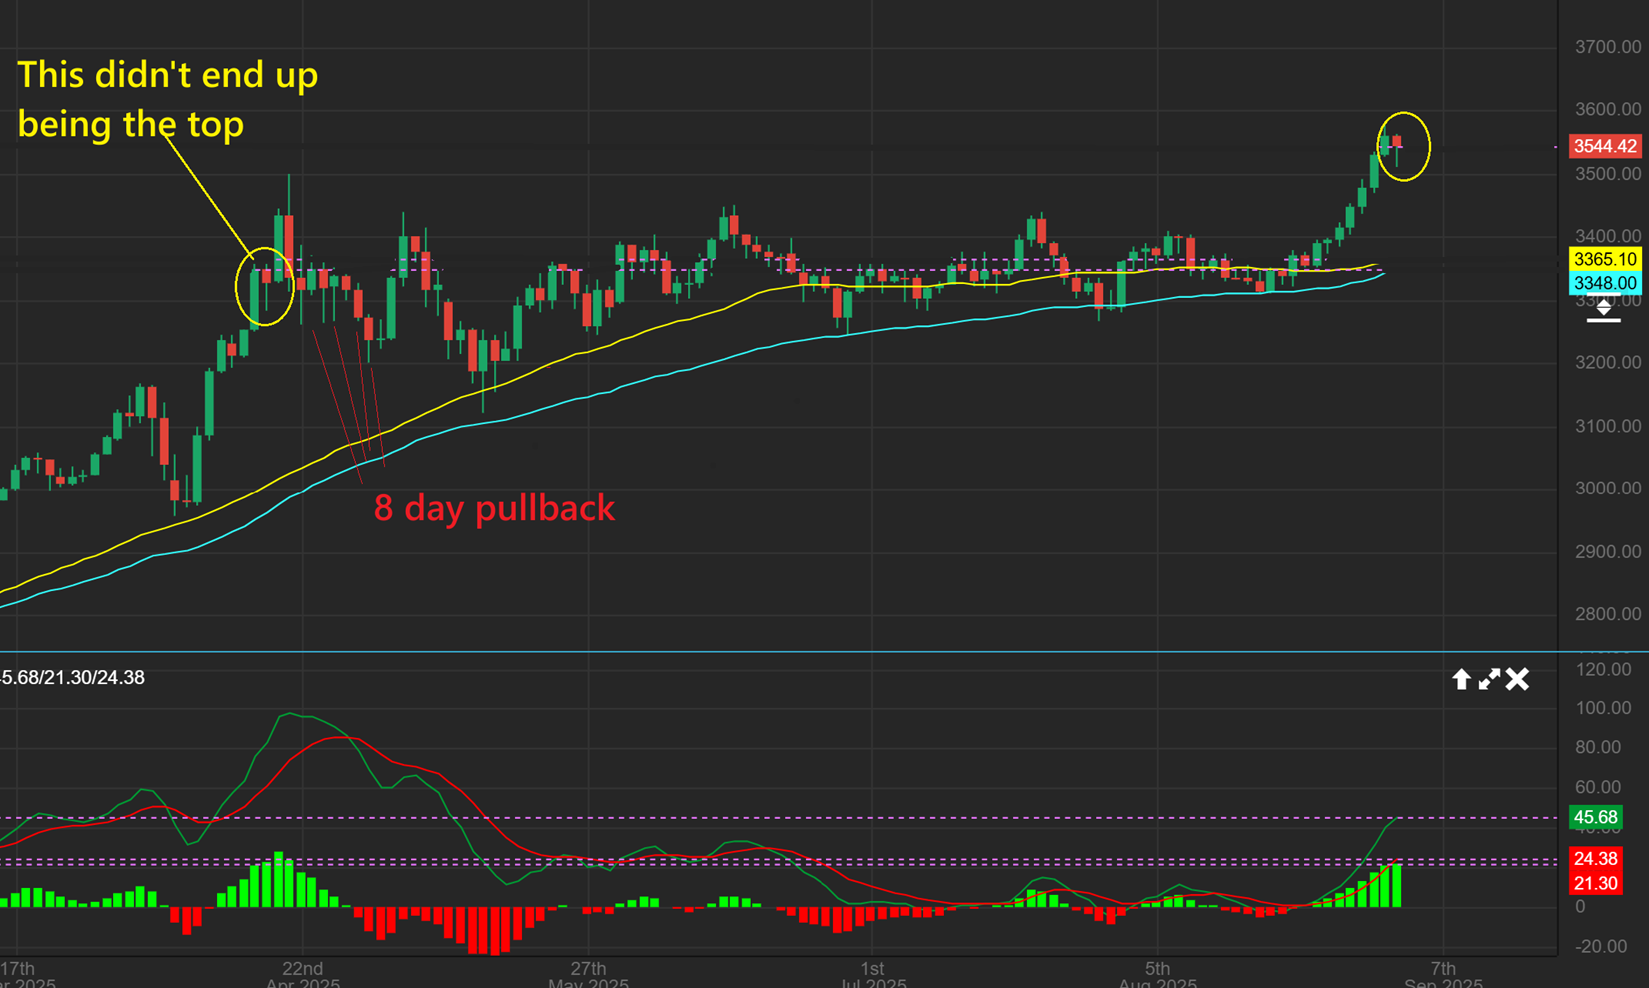
GOLD #5 – I see a similar candle on the April run up with Gold, but it didn’t end up being the top, so I just wanted to point that out.
.
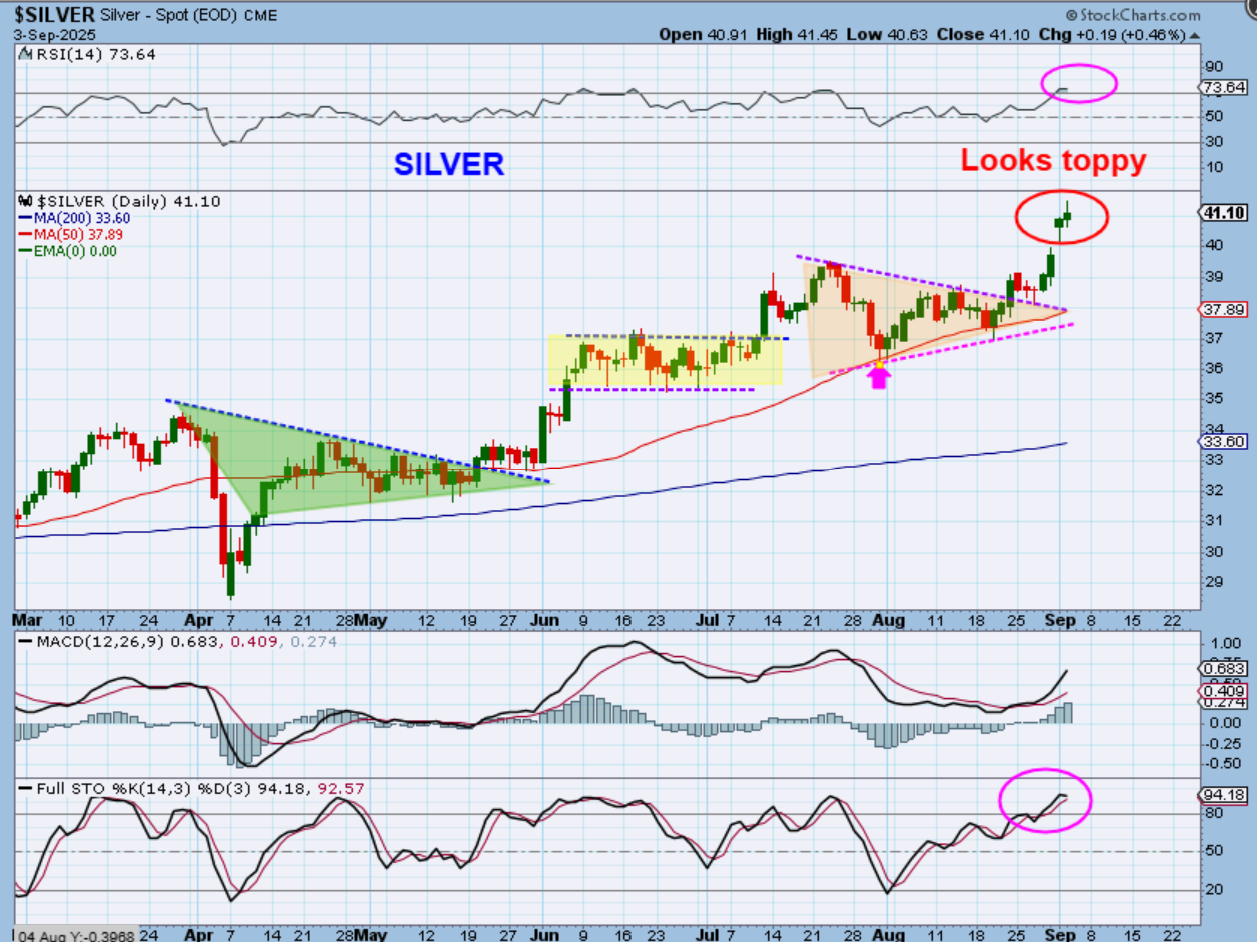
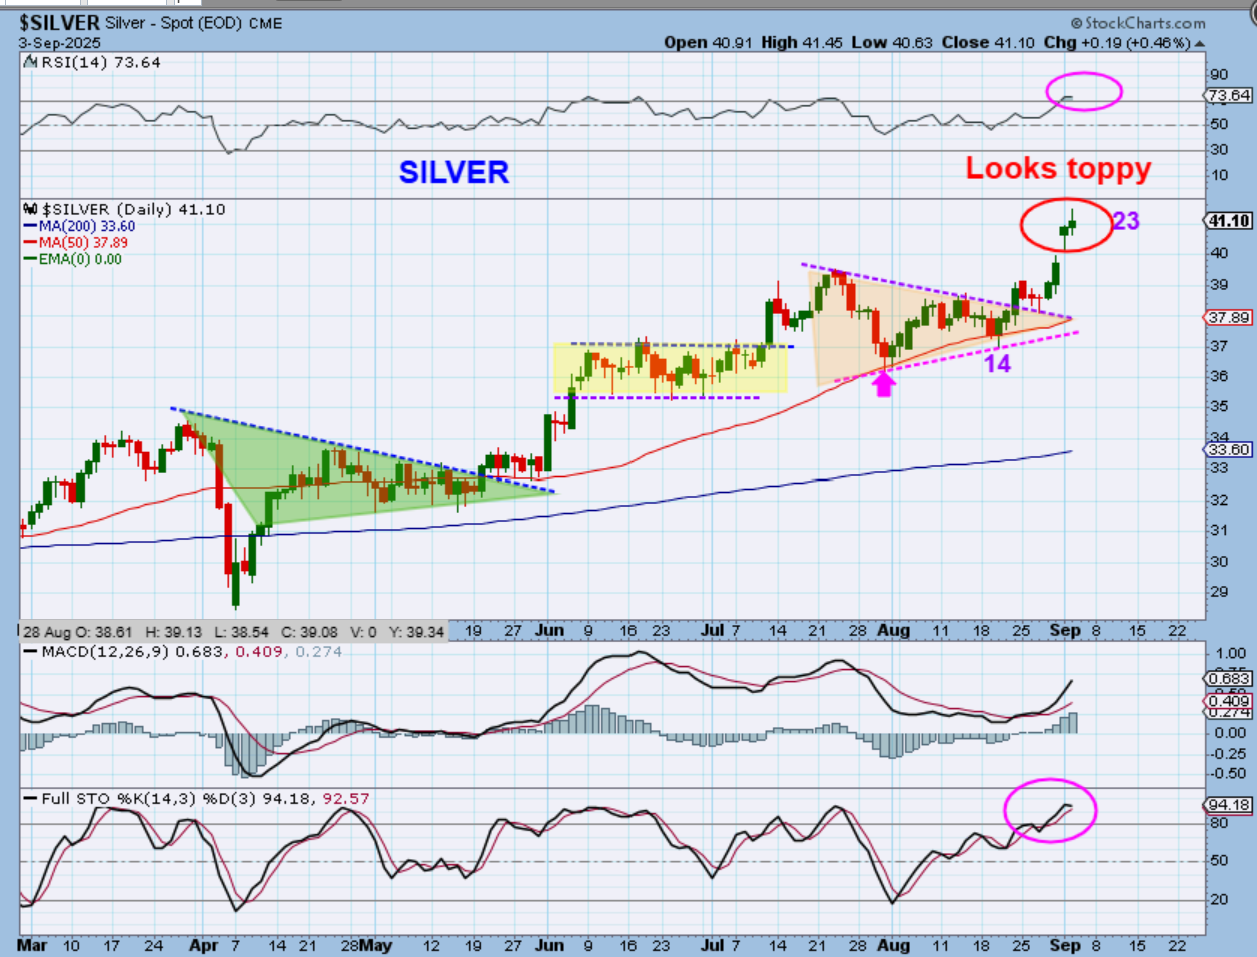
SILVER has what are normally 2 topping candles and we know that it is late in a 4th daily cycle, but in this bullish rally, we know that ‘surprises come to the upside’, and many individual miners are still Popping. Let’s take a look at Silver like we did with Gold…
.
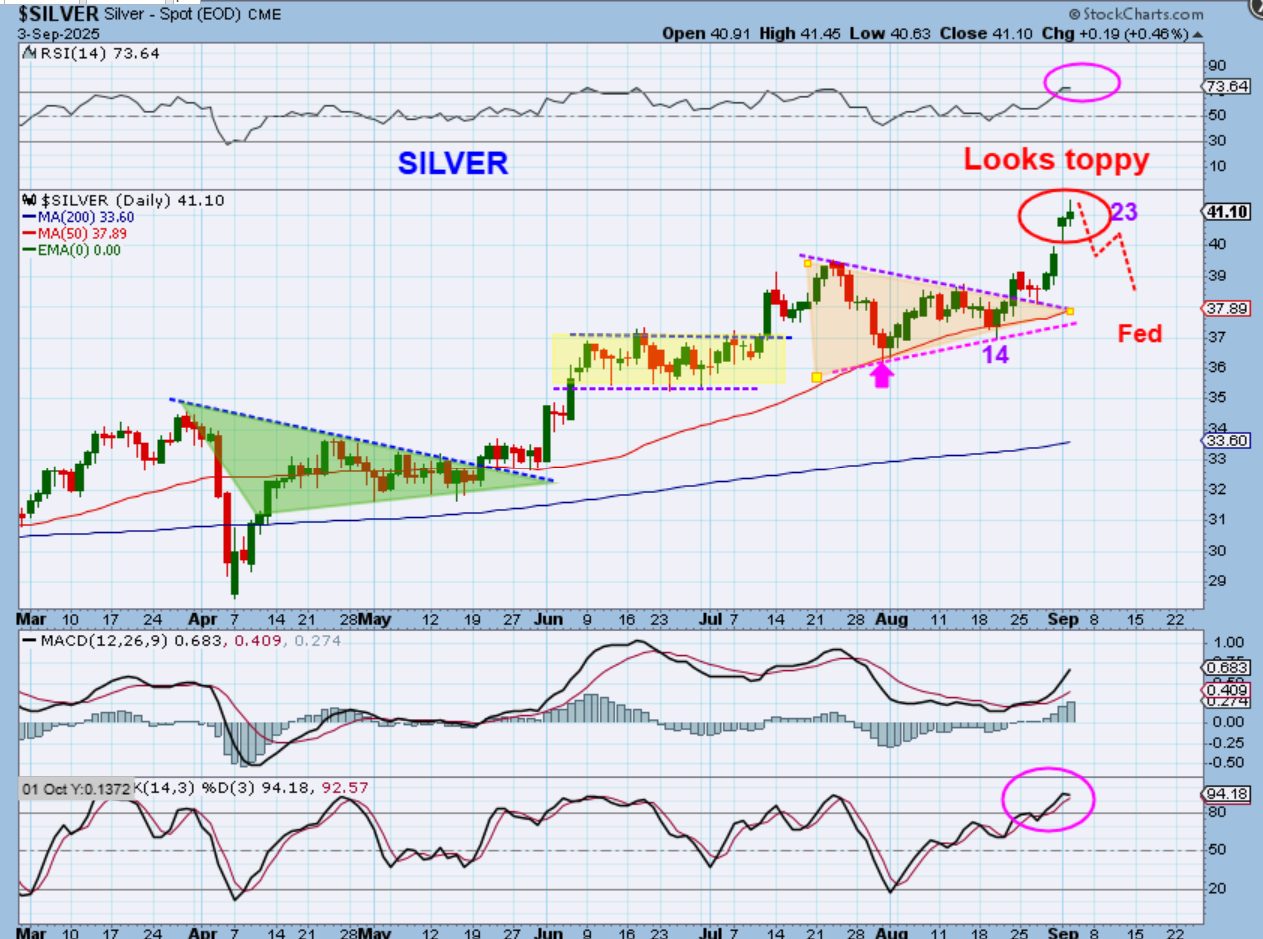
SILVER should be on day 23 with 2 toppy looking candles, so it also could begin to chop and drop into the Fed-day time period.
.
SILVER – The Fed Mtg is 10 days away, so this could chop around and slowly dip lower into day 33 for a dcl. Again, if we get this chop lower, it would be a buying opportunity.
.
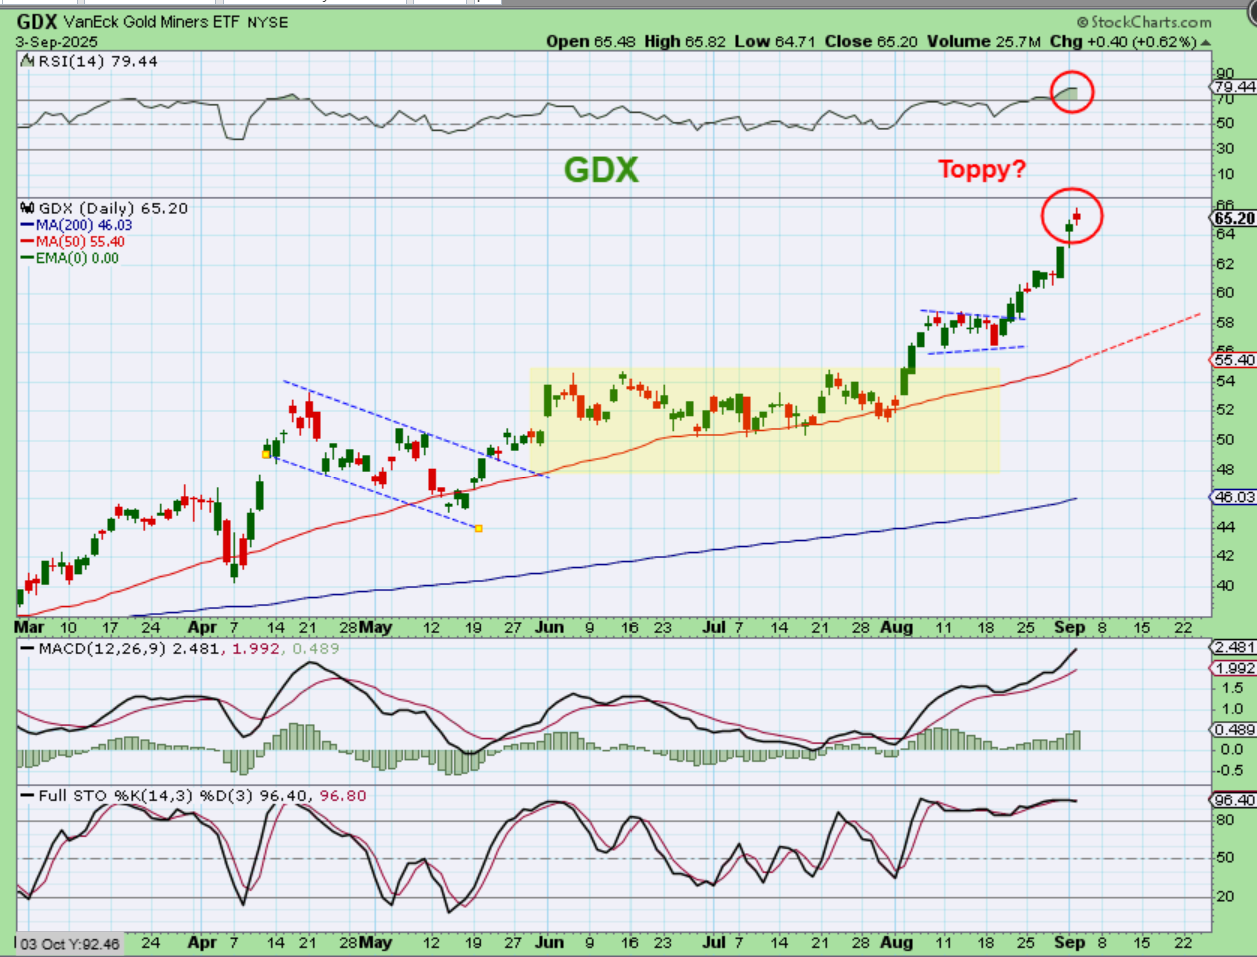
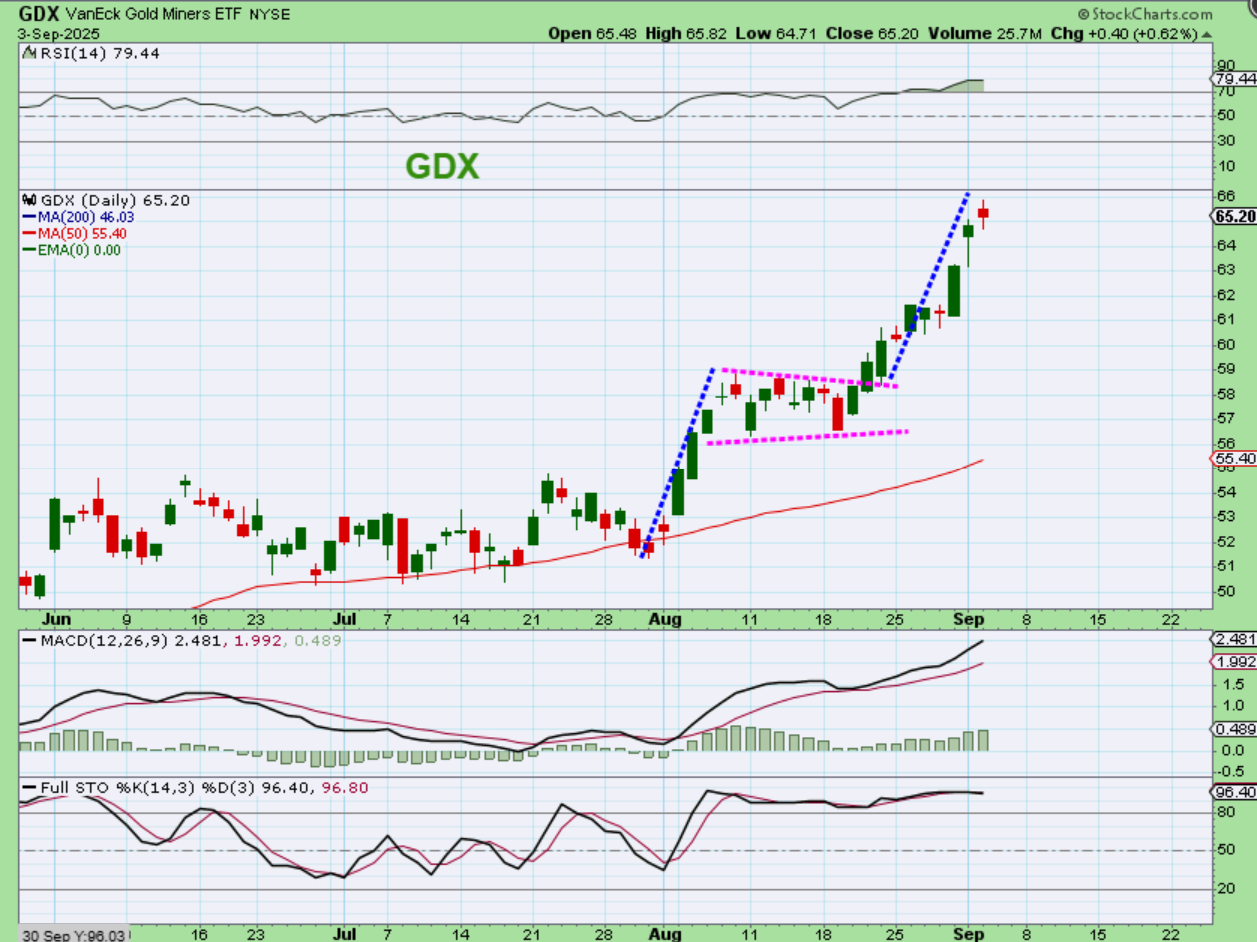
GDX also shows a strong rally higher that is getting overbought & possibly has toppy candles. Again, Bull markets surprise to the upside, so I certainly wouldn’t short it, but a pullback would be normal. Also…
.
You may recall when I pointed out a measured move for the GDX breakout, but it seemed too high at the time. Well, GDX has actually reached that initial target area. GDX is also getting a little overheated.
.
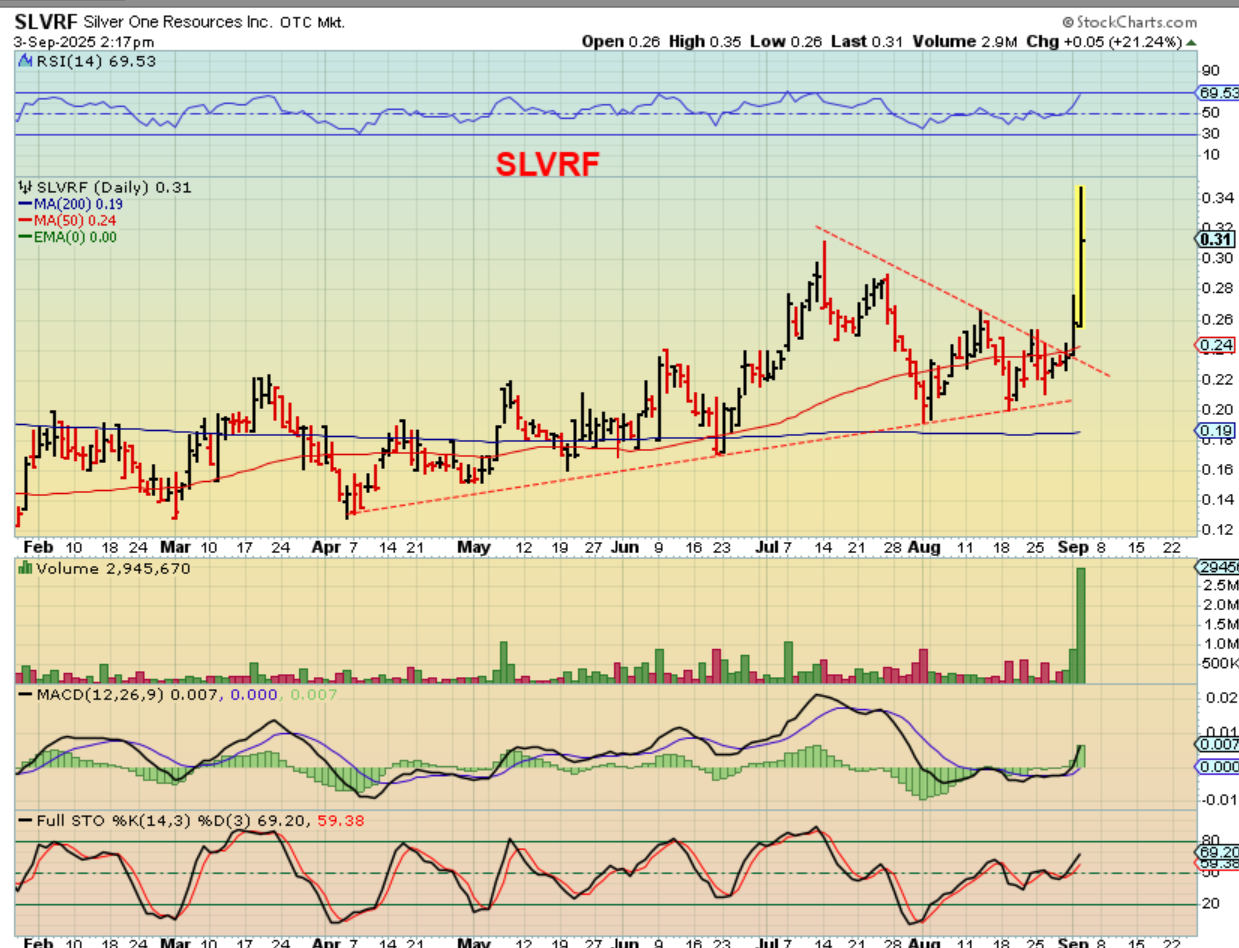
SLVRF is an example of a Silver stocks that had popped but then dropped again. It actually just became very choppy, but on Tuesday it broke a downtrend and yesterday it rallied almost 40% before pulling back. This used to get 100,000 or 200,000 volume on a good day, but it had almost 1 million on Tuesday and 2.9 Million on Wednesday.
.
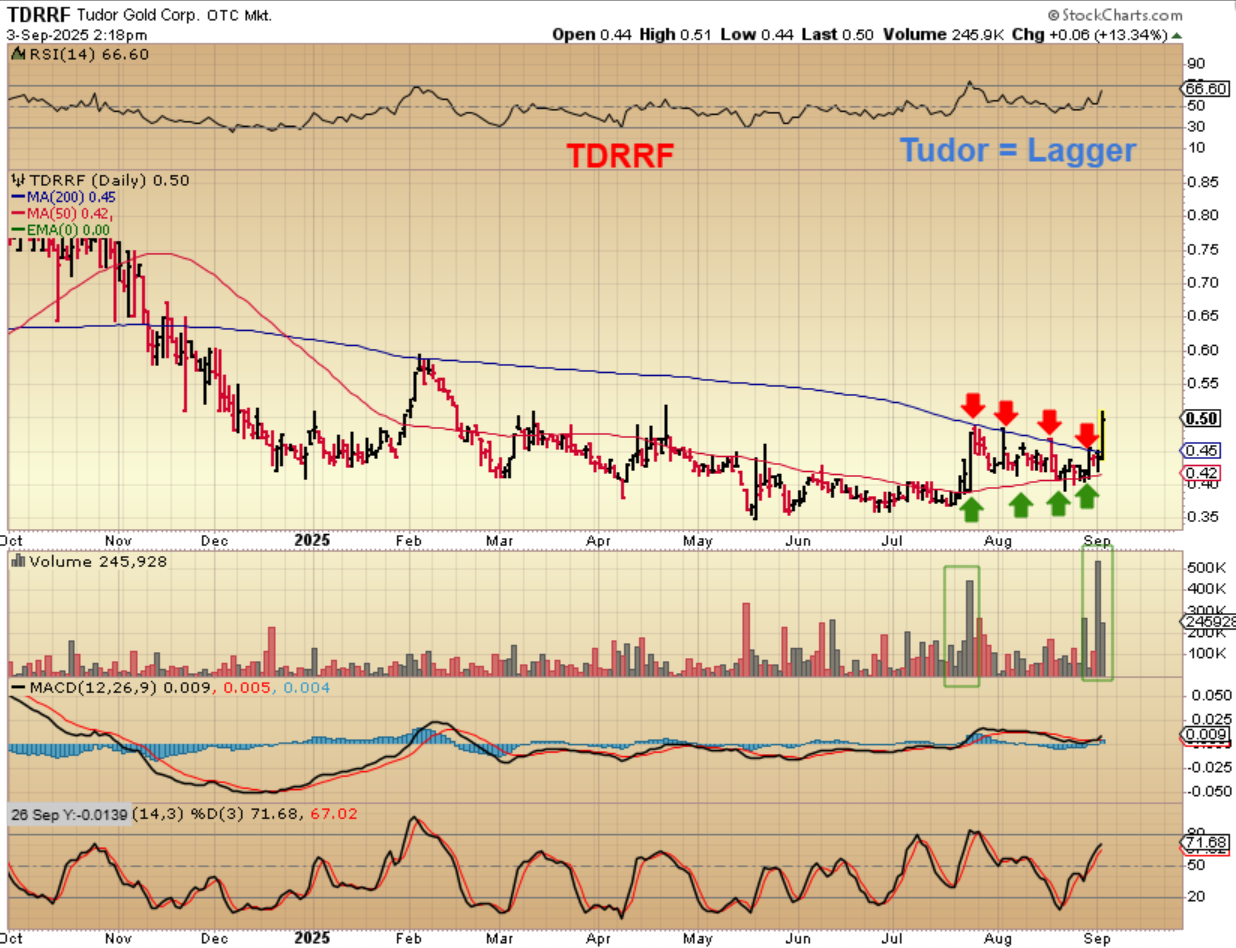
TDRRF – Tudor has not participated in the rally since April lows, but recently it formed a crawl between the 50sma & 200sma. Notice the volume on the Pops. This indicated that it could breakout and it broke out yesterday. A bull flag or back-test may offer an entry (watchlist), or just start a starter position and see what you get to add over time. Tudor is breaking from a base.
.
We are still seeing bullish price action, but day to day can be a little choppy. We have the ‘Jobless Claims report’ released at 8:30, but a sign of weakness may be viewed as good, because it increases chances for a rate cut. If we eventually get a pullback heading into the Fed mtg over the next 10 trading days for the General markets or especially for the Precious Metals, it could offer a buying opportunity. We will continue to monitor that, but remember that some Miners individually do their own thing, and some can Pop or run higher despite a pullback. Buy & Hold has been a pretty good idea lately. Bitcoin is below. Enjoy your Thursday trading.
.
~ALEX
.
FIRST A QUICK REVIEW:
THE CYCLE COUNT WAS IN THE WEEKEND REPORT WITH THIS CHART:
.
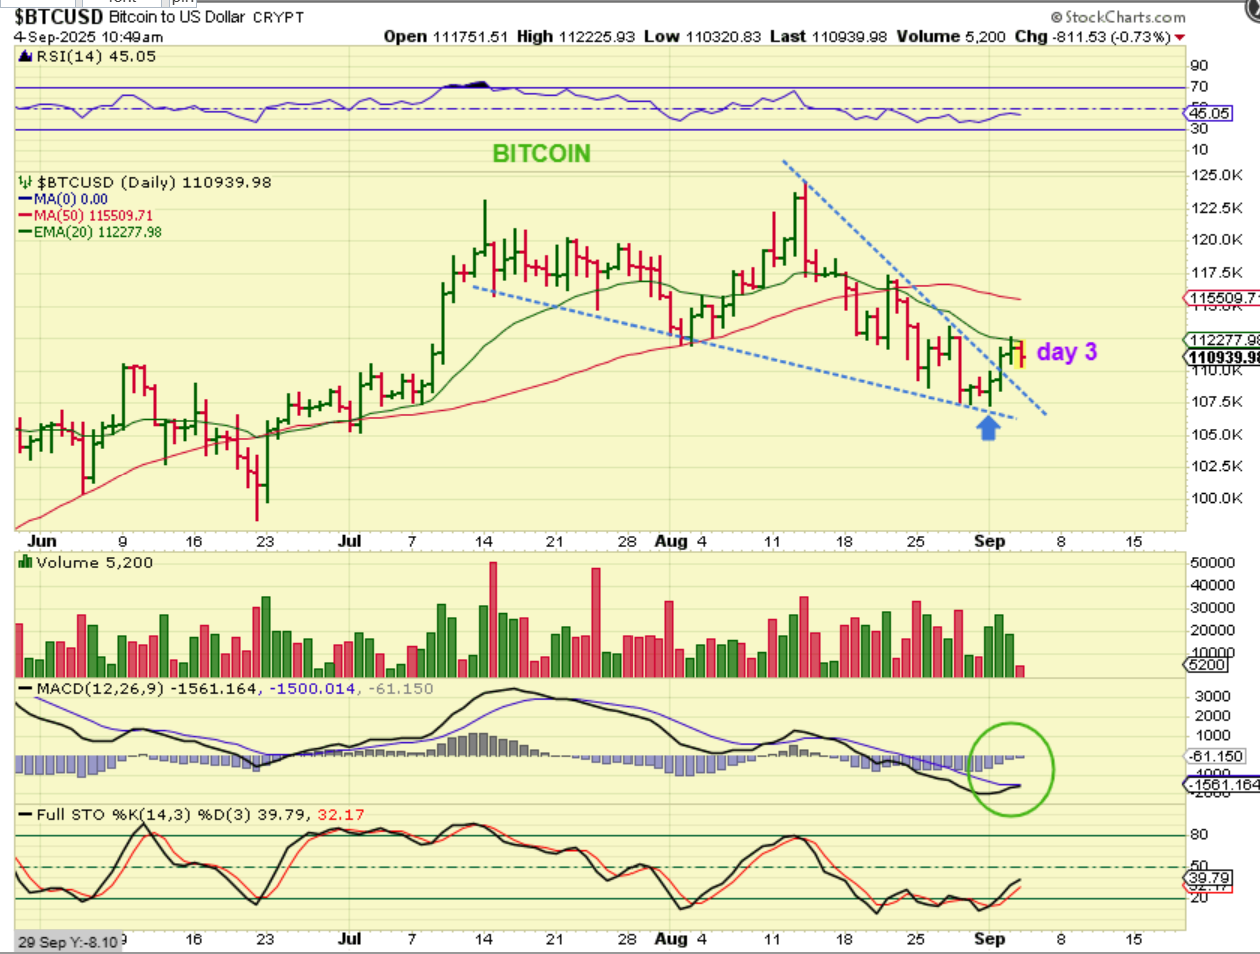
BITCOIN DAILY -A new low formed on Saturday, Day 69, of what is usually a 60 day daily cycle.
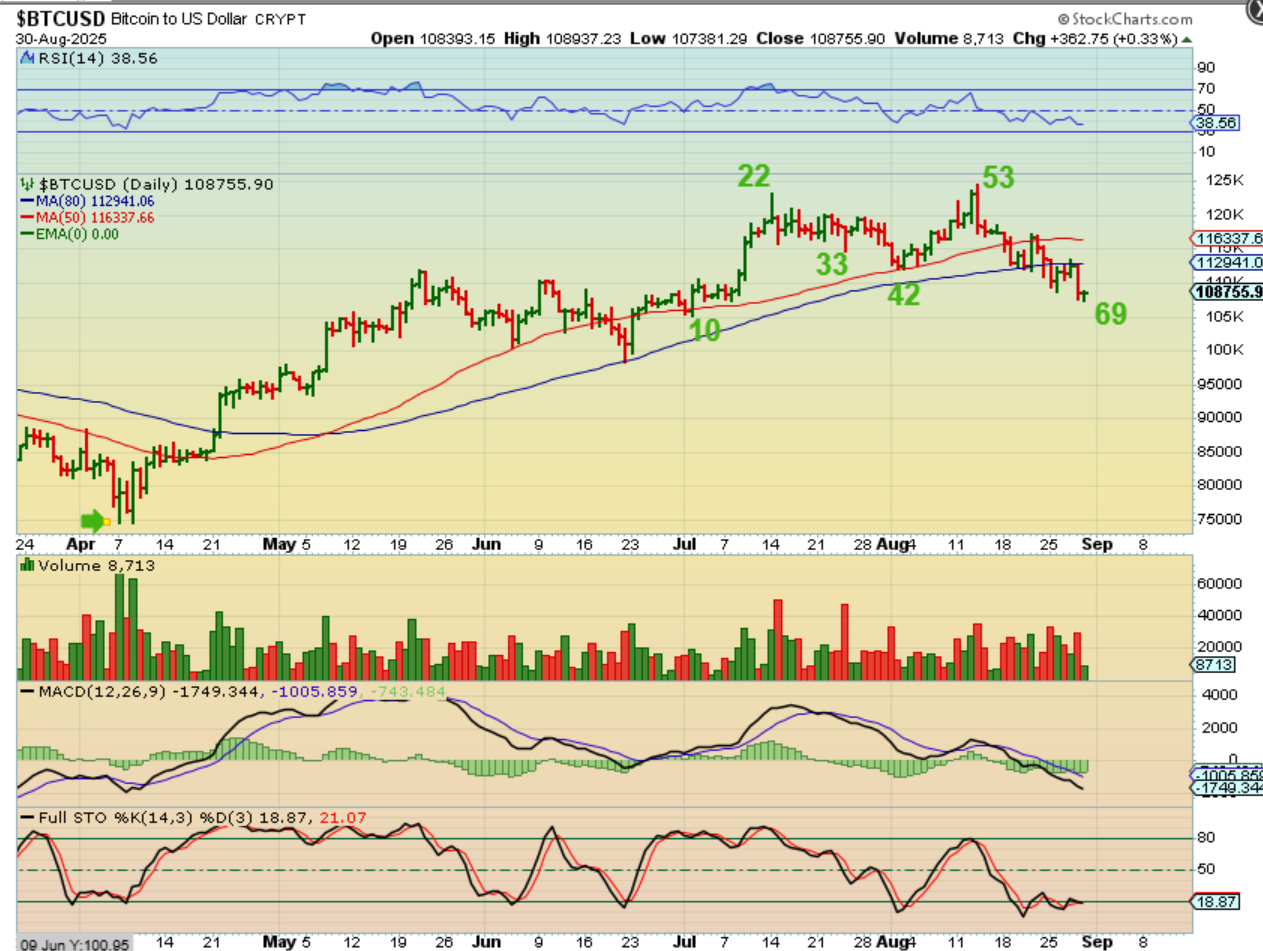
BITCOIN was on day 70 when it put in a low & reversed higher. On Tuesday it started breaking out, so I pointed this out along with the crypto stocks, which have been bullish as Bitcoin dropped.
.
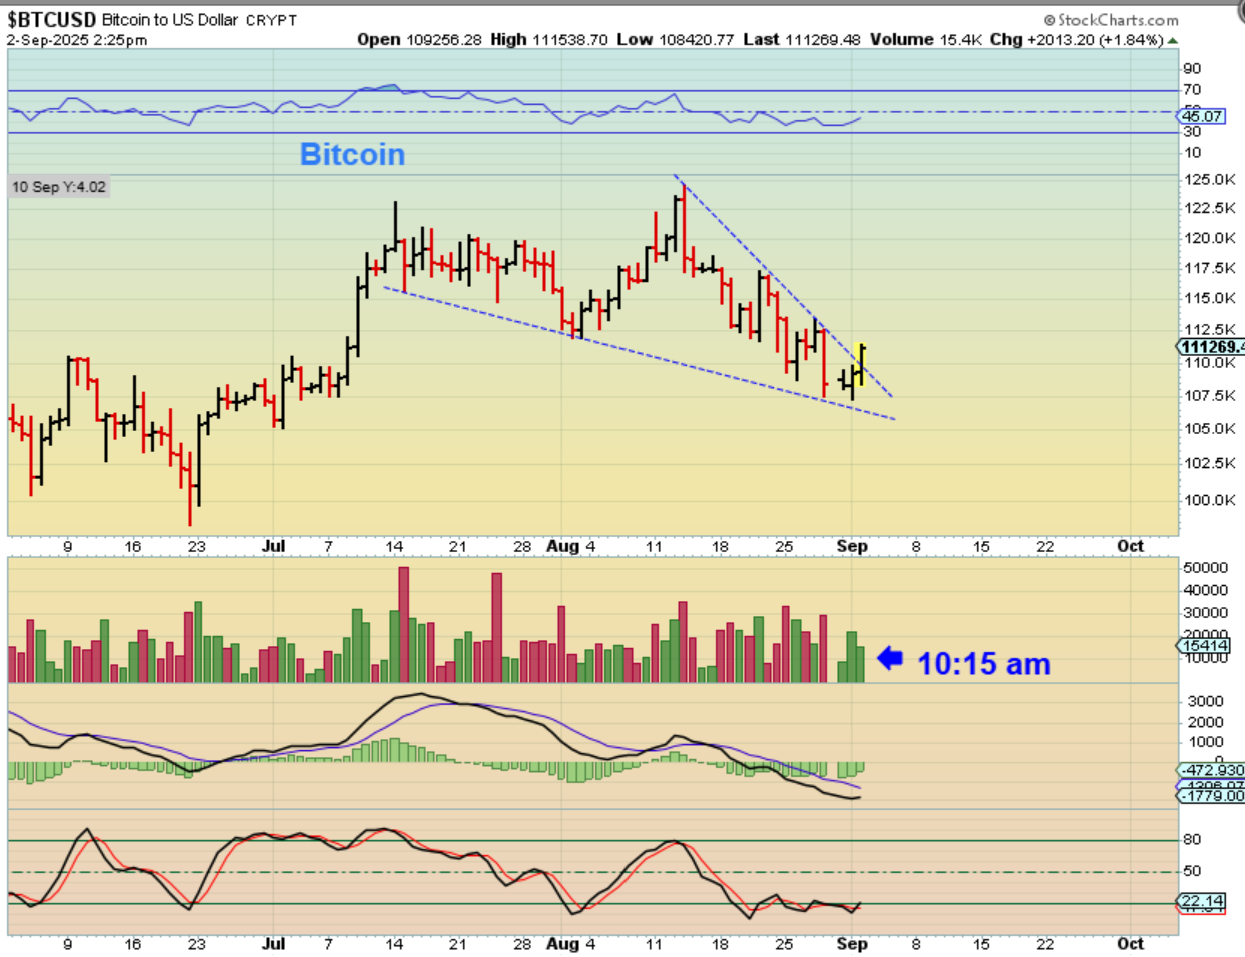
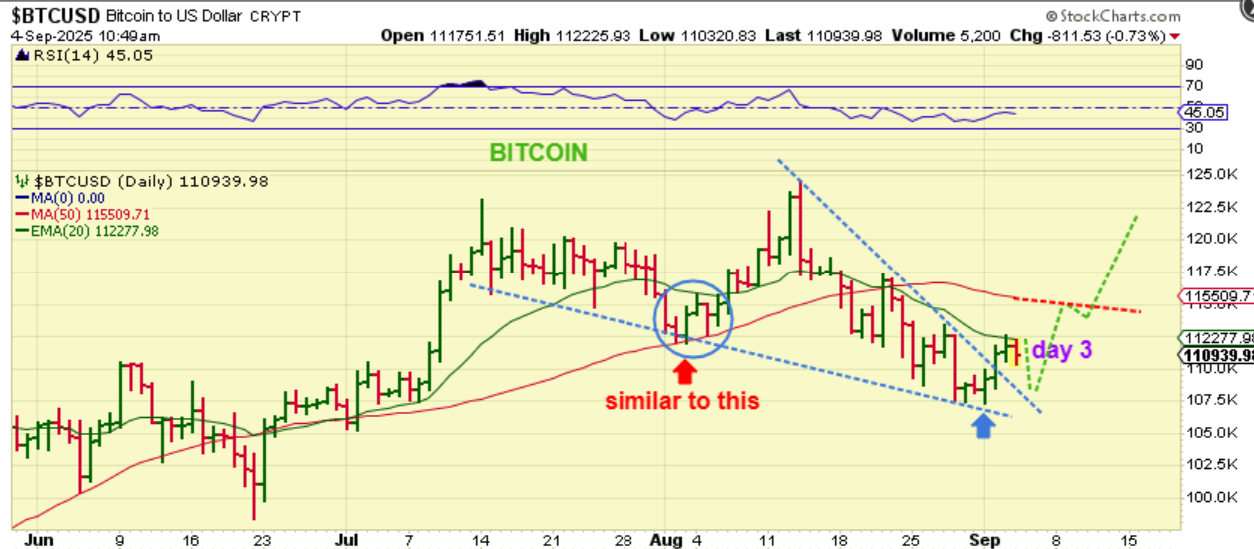
BITCOIN 6:30 a.m. Thursday – So with that day 70 low and a swing low to the 20ema, we should be on day 3 with temporary resistance at the 20ema. This means that Bitcoin can drop and back-test the trendline, but it doesn’t have to. IF IT DOES…
IF IT DOES DIP LOWER, check the charts of RIOT, CIFR, IREN, HUT, BITF, HIVE, etc for any ‘Buy the Dip’ opportunities. We saw something similar in early August.
Wednesday September 3rd – Dips 
 Friday September 5th
Scroll to top