Tuesday August 26th – It’s Probably Just a Pause
.
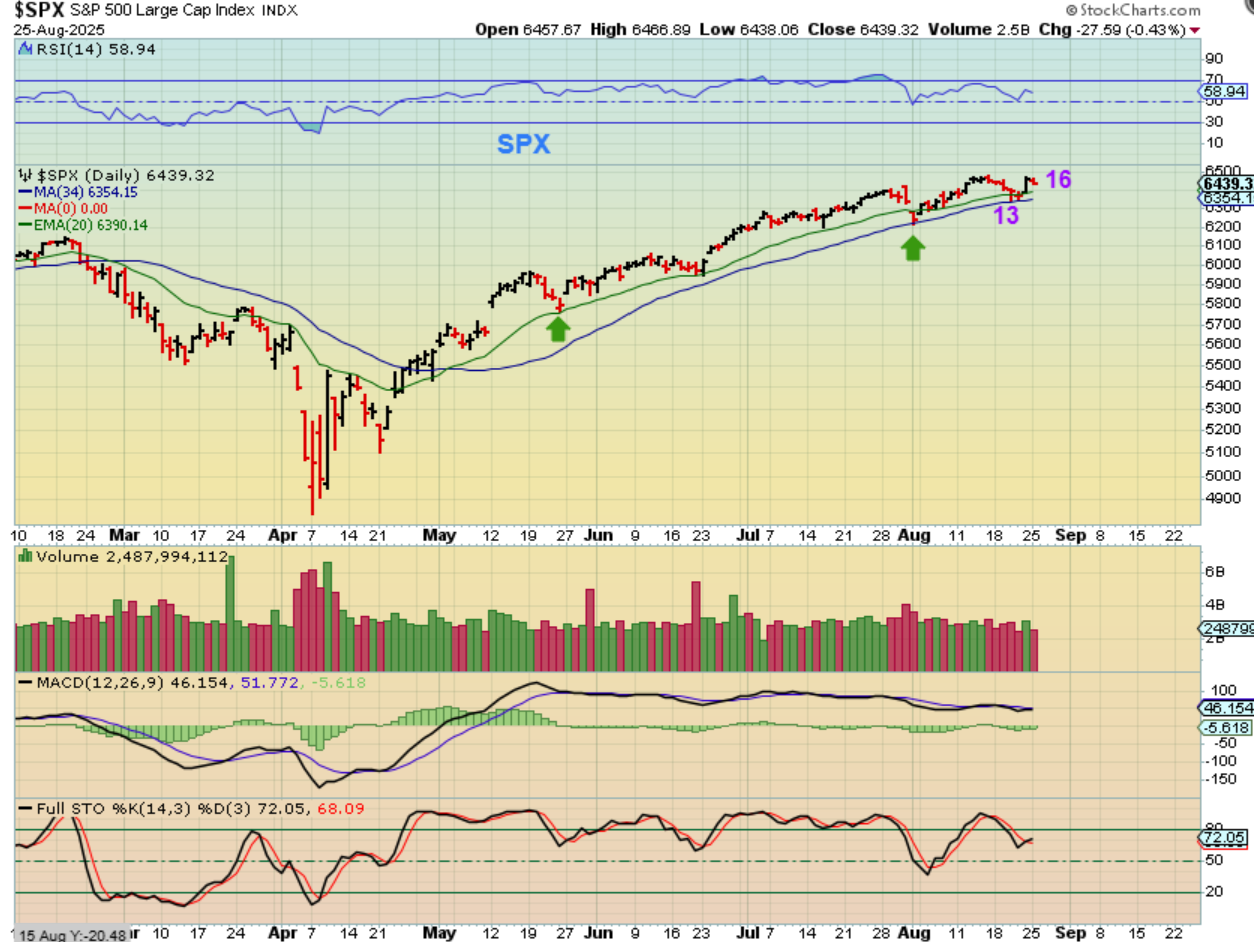
SPX – After Fridays large pop based on ‘ The Fed said that a rate cut is likely’ enthusiasm, the markets took a rest and dropped slightly on Monday. This was day 16 of a 3rd daily cycle and there is definitely time for more upside if the buyers step in. Note: This can pause for 3 days and then run if it wants to.
.
I want to look at a few Charts of the ‘stock set ups’ that I have mentioned from my watchlists before, and to show that they do still look good.
.
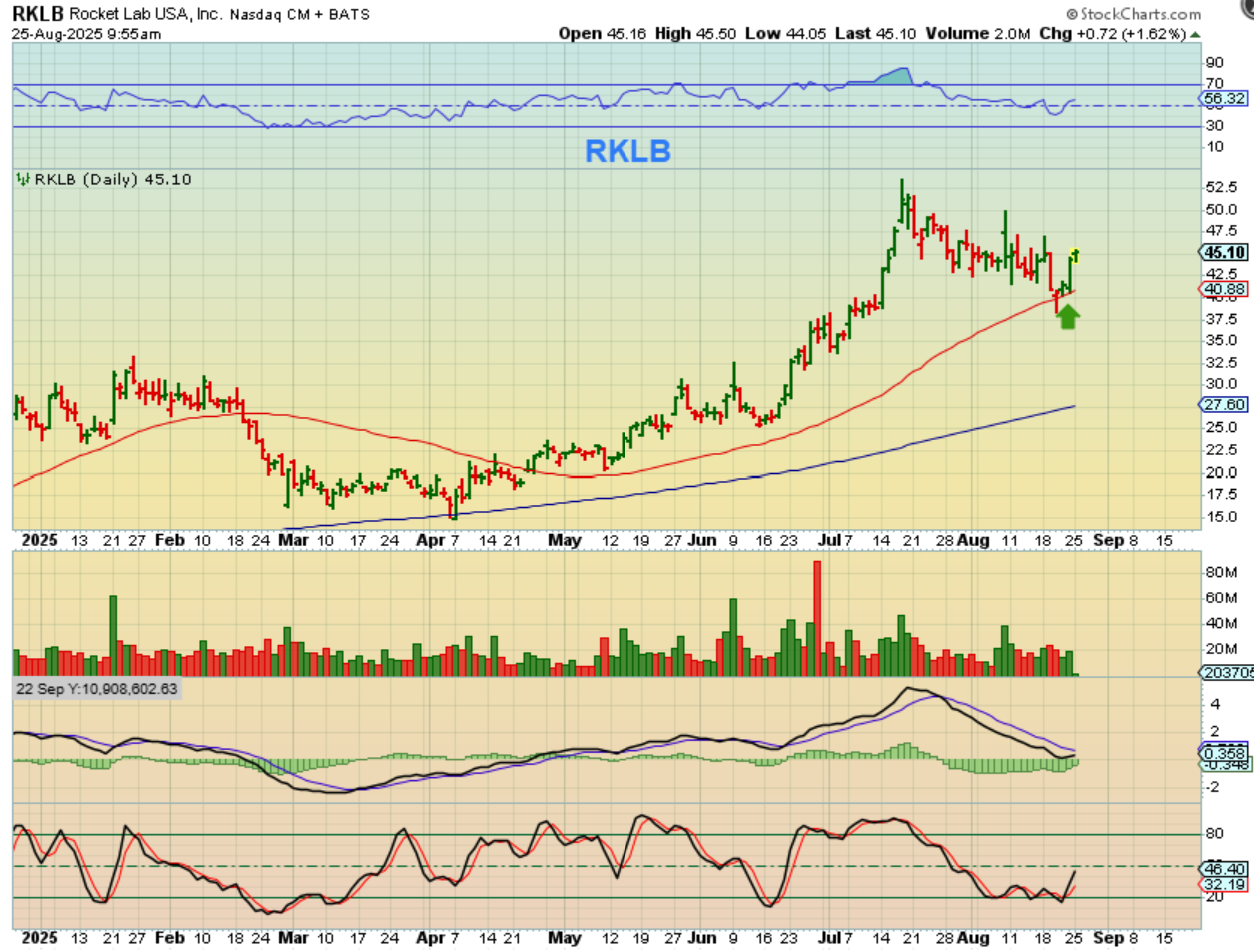
RKLB popped Friday, so I posted this at 9:55 am. It gapped up, filled the gap and reversed higher. A trader will buy that reversal with a stop under the days low.
.
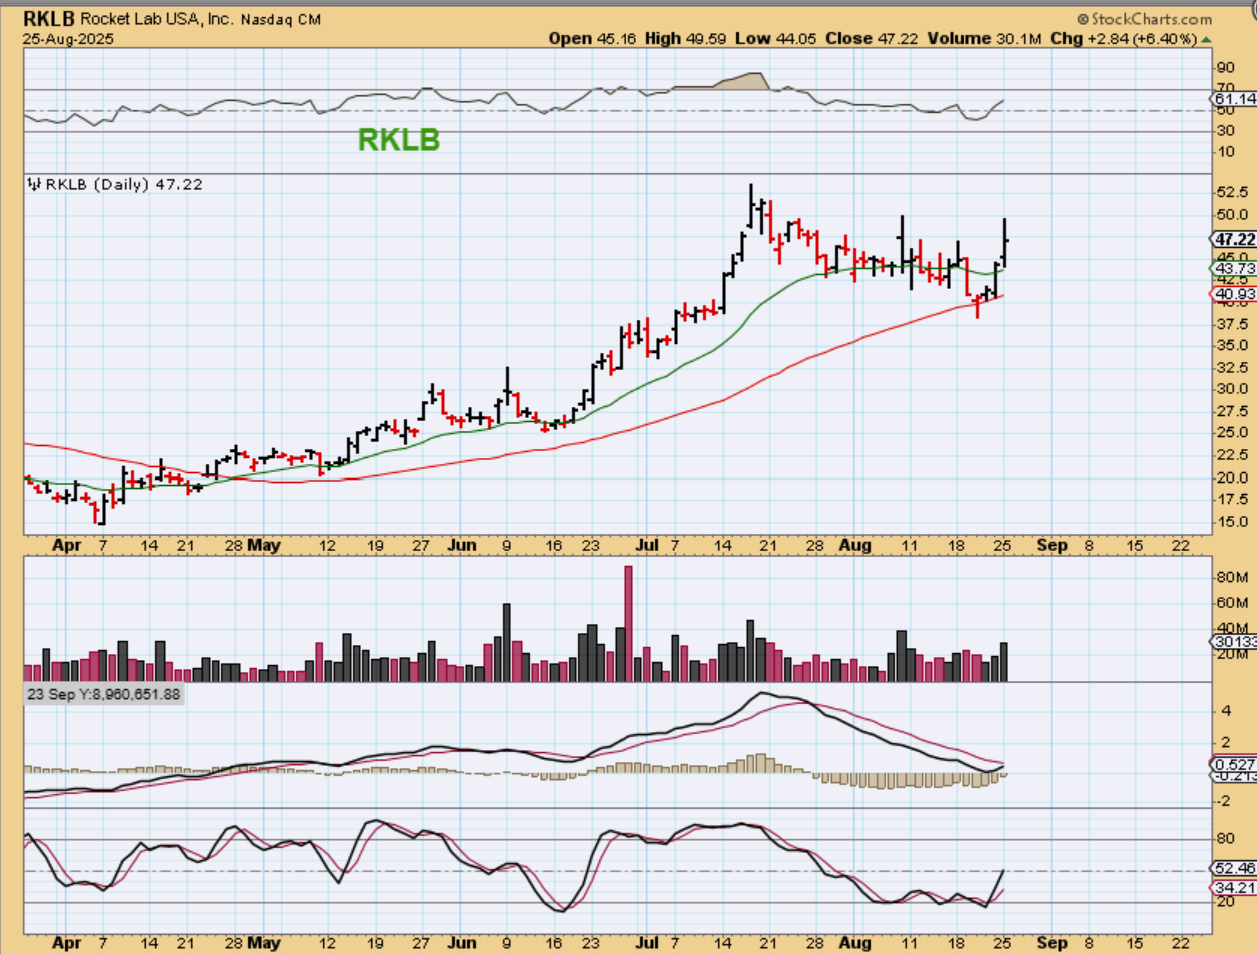
RKLB was up over 10% at one point, but sold off a biy into the close. It is still a good-looking chart that reversed right off of the 50sma last week.
.
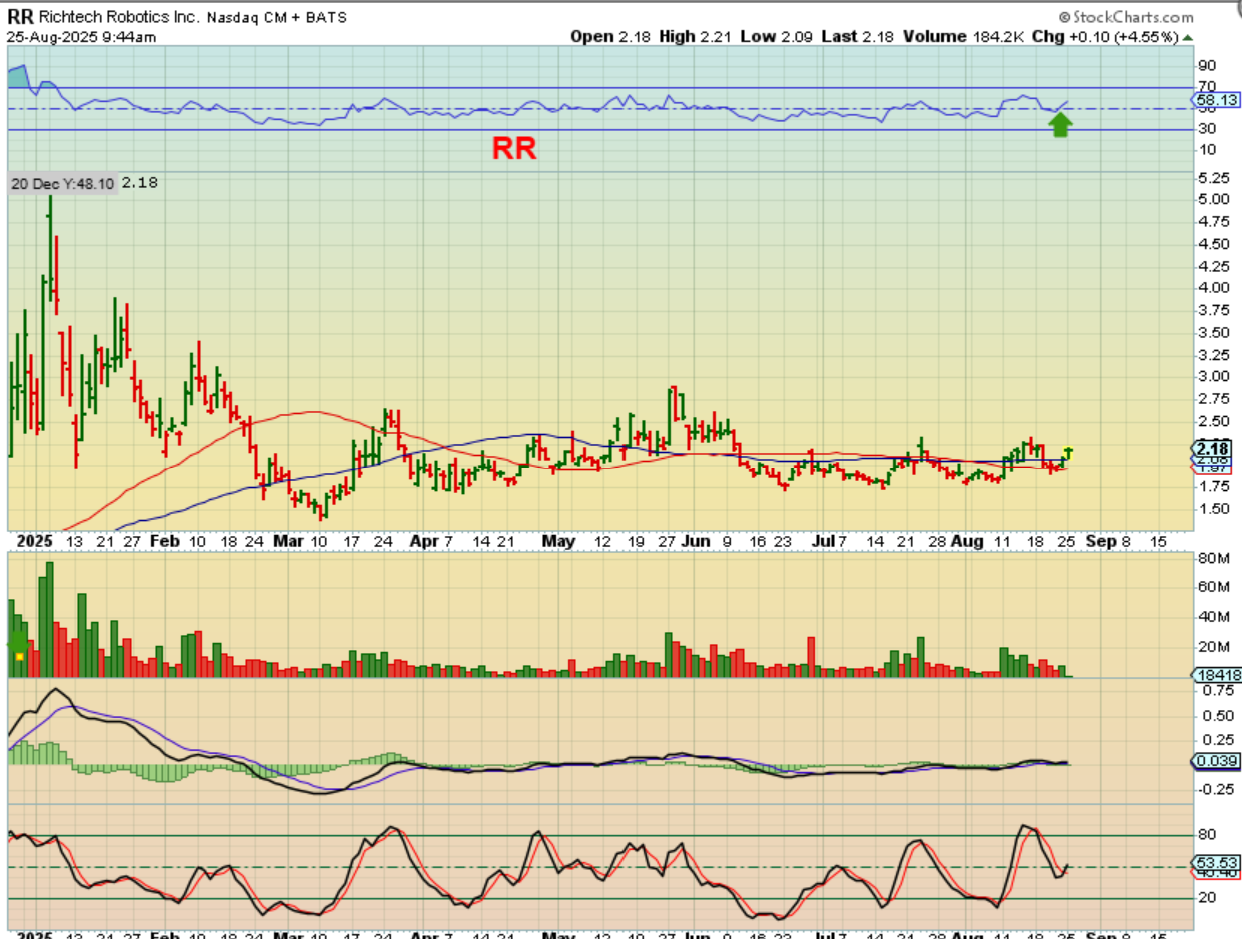
RR was up big in pre-market on news and after a gap open, it closed the gap and reversed quickly. Within the first 15 minutes, it was now up 4% and climbing, so that is a buy to a trader or someone looking to hold this one.
.
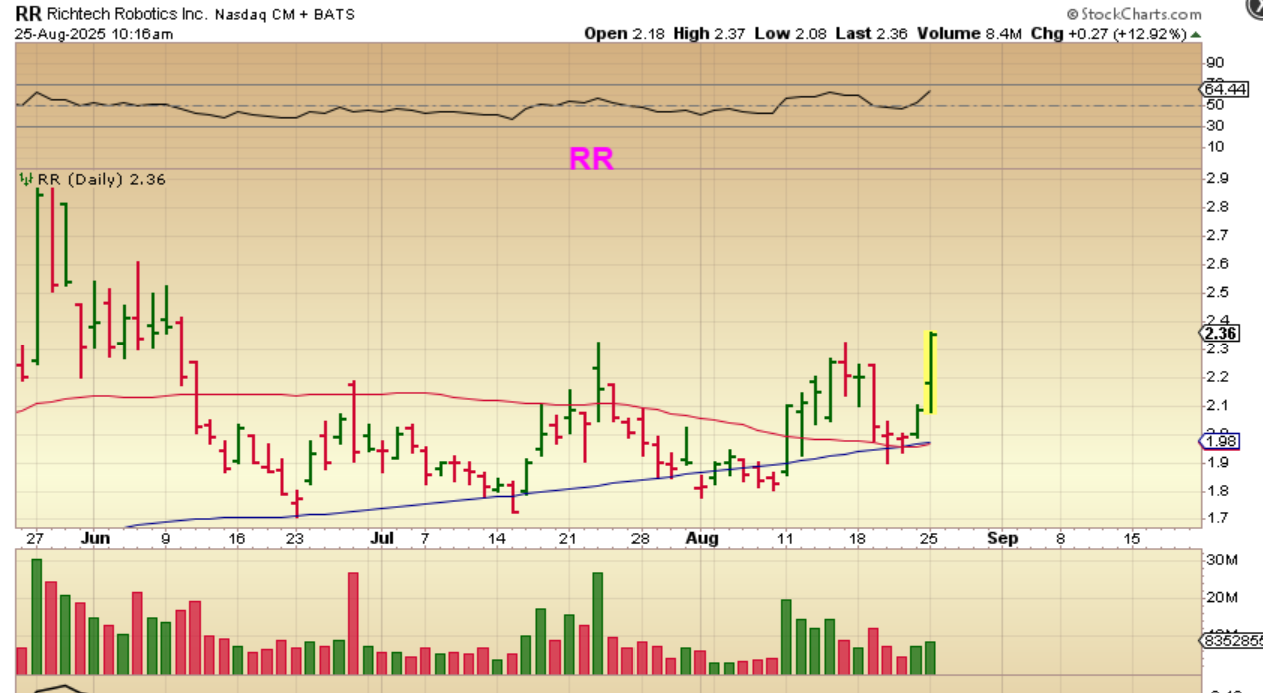
RR was now running up quickly! Within that same first hour it was up 13%…
.
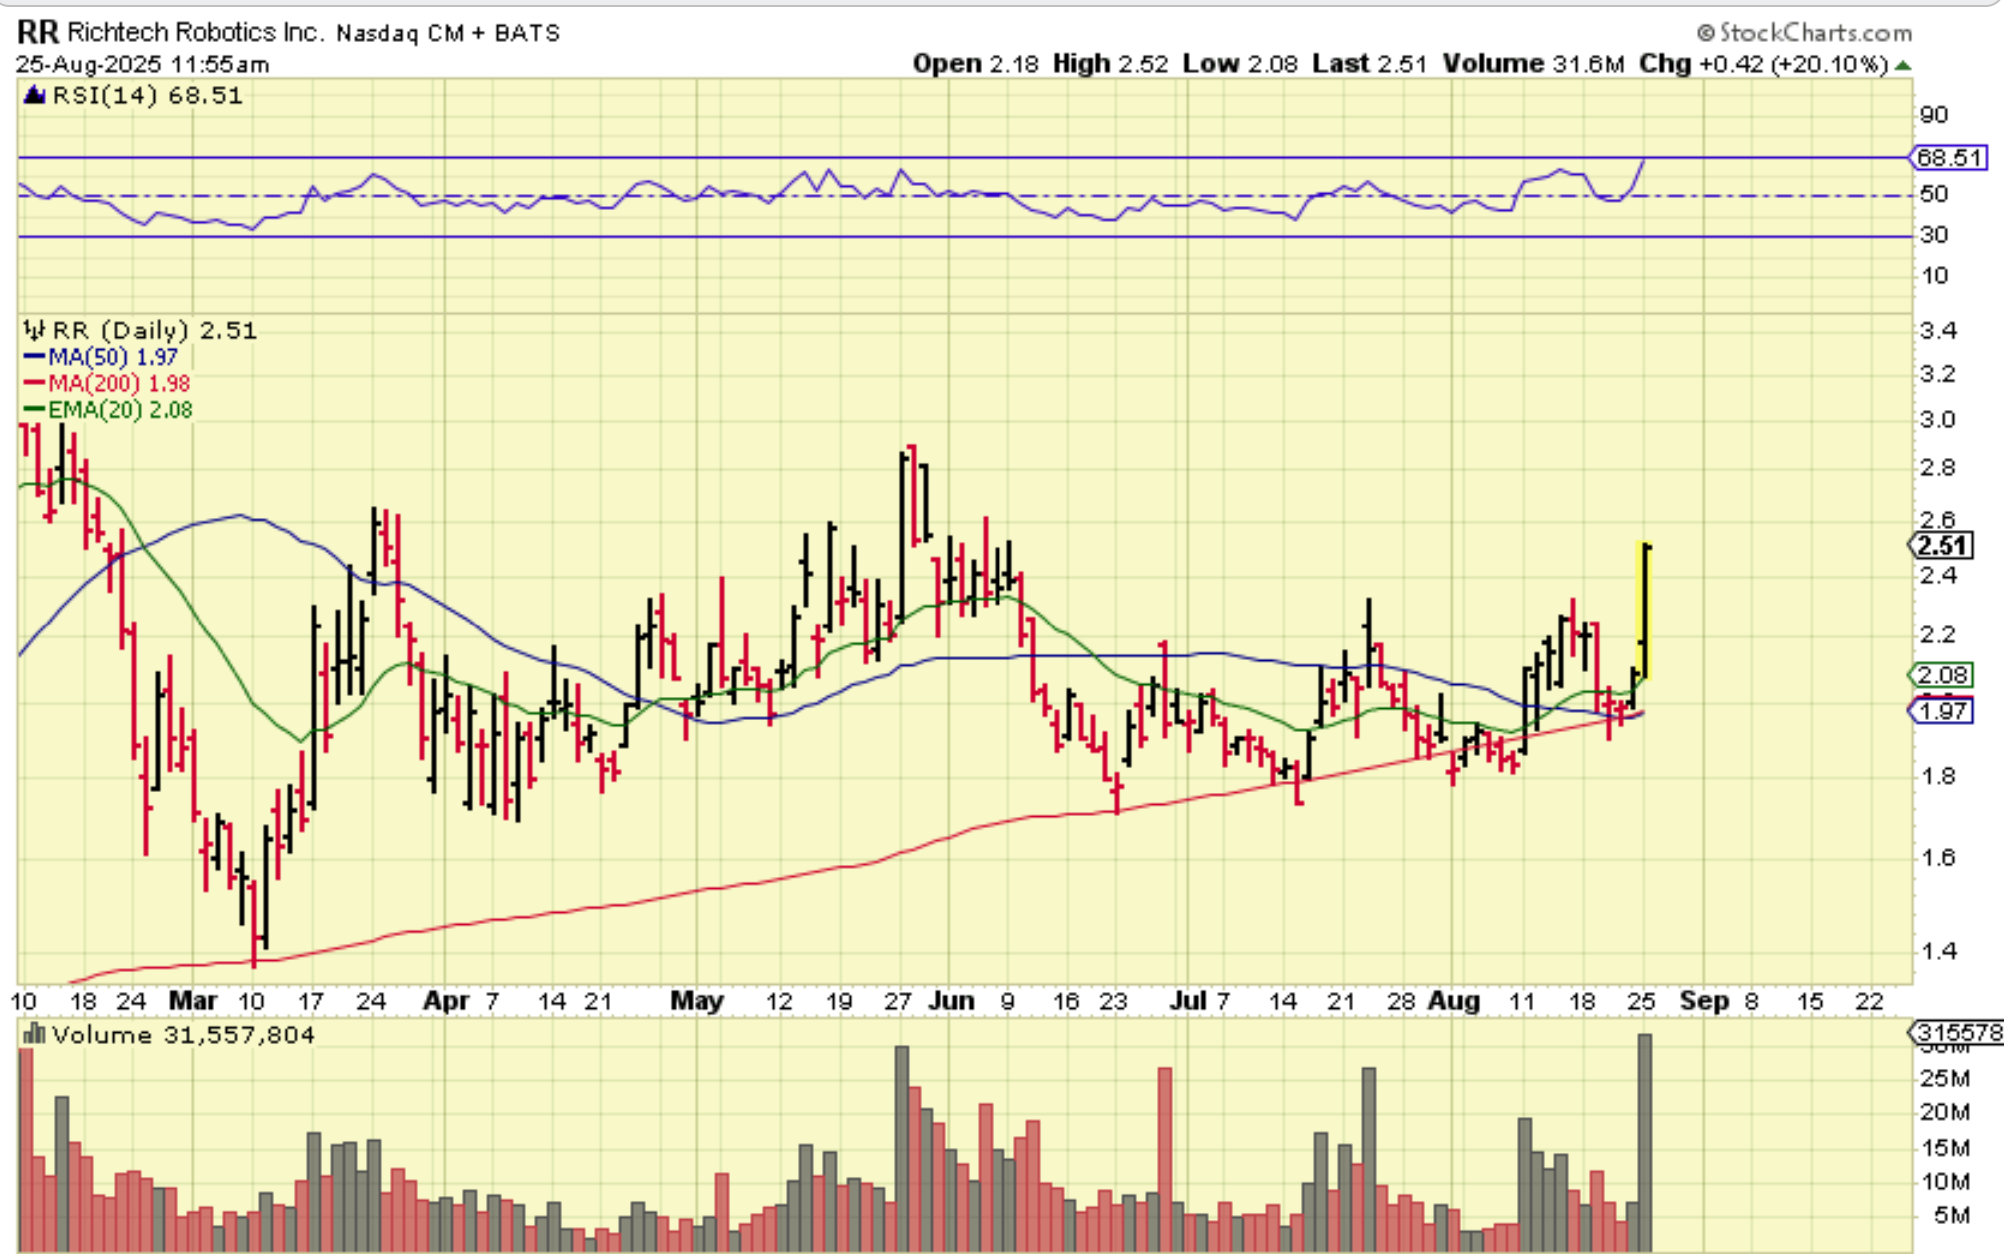
RR continued higher and was up 20% in the next hour.
.
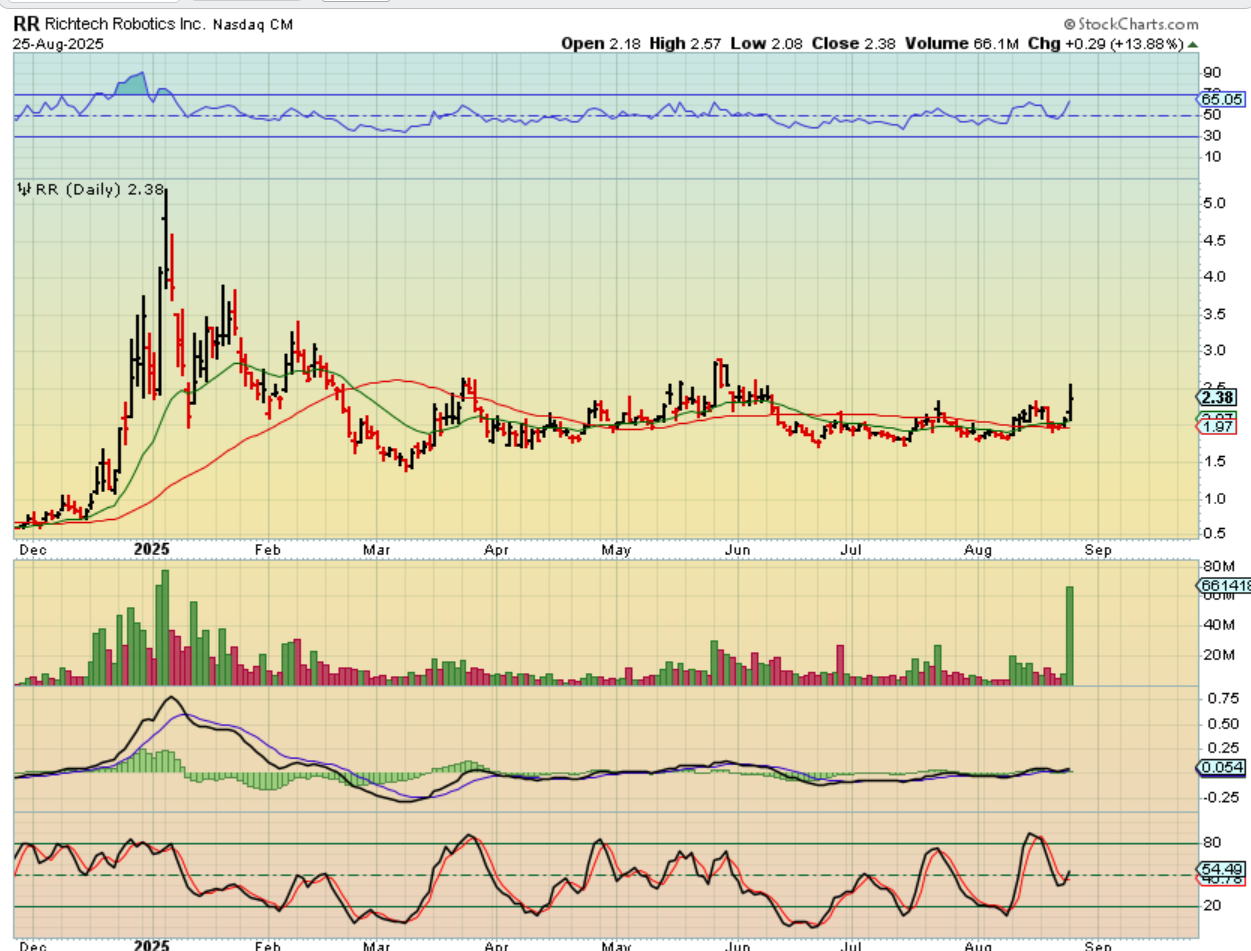
RR sold down when the markets sold off into the close, so it ‘only’ closed up 13%, but when you step back and look at RR, you can see good upside potential. A rally to former highs is a double, so I only sold half of my position as a ‘trader’ midday, and I am still holding some. I will add to that position if I see an opportunity. A stop at $2 is reasonable.
.
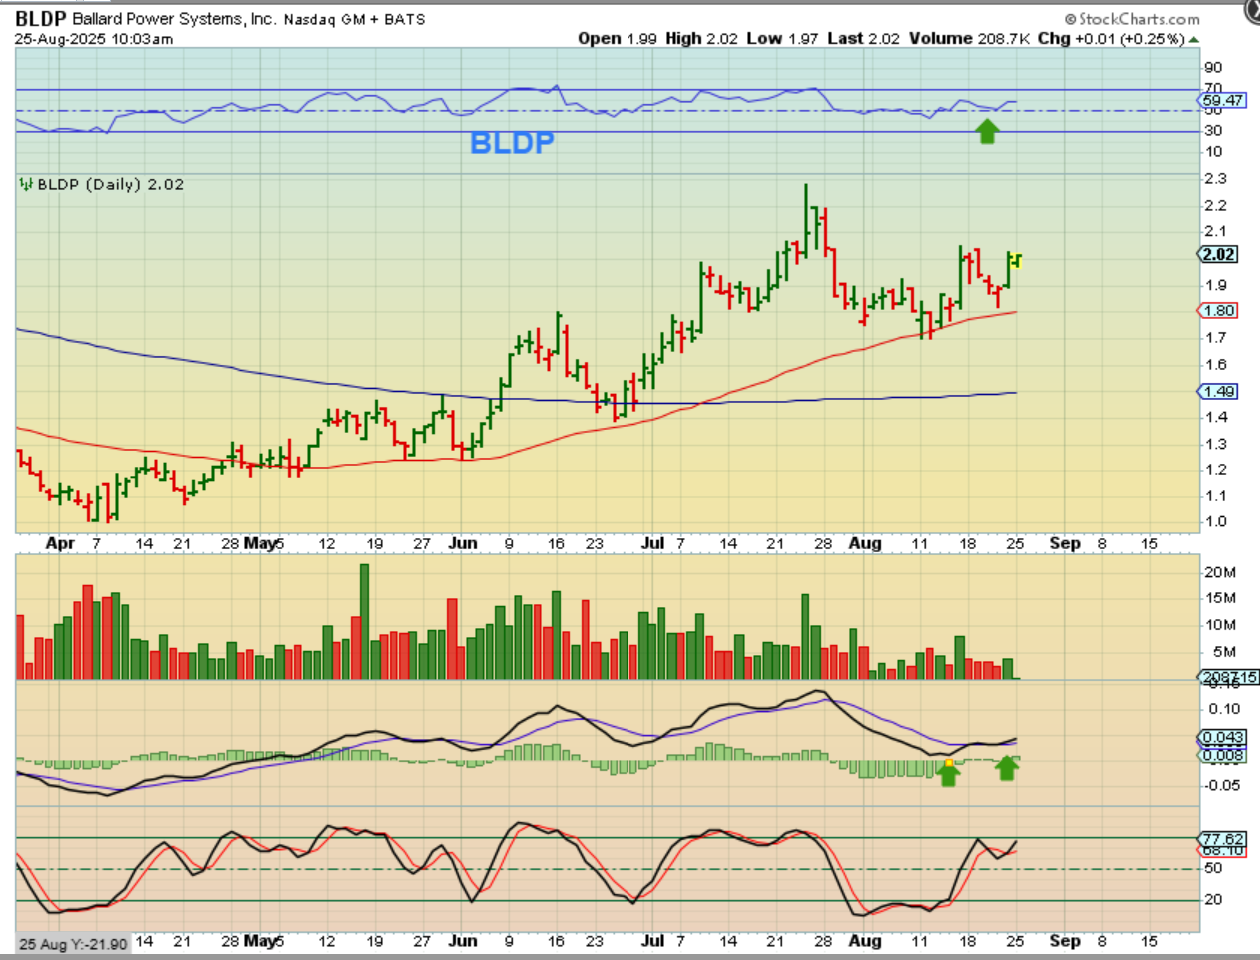
BLDP reversed at the 50sma 2 weeks ago, Popped, and dropped back to the 50sma last week. This looks like a good buy and hold, since it is trending higher at this point.
.
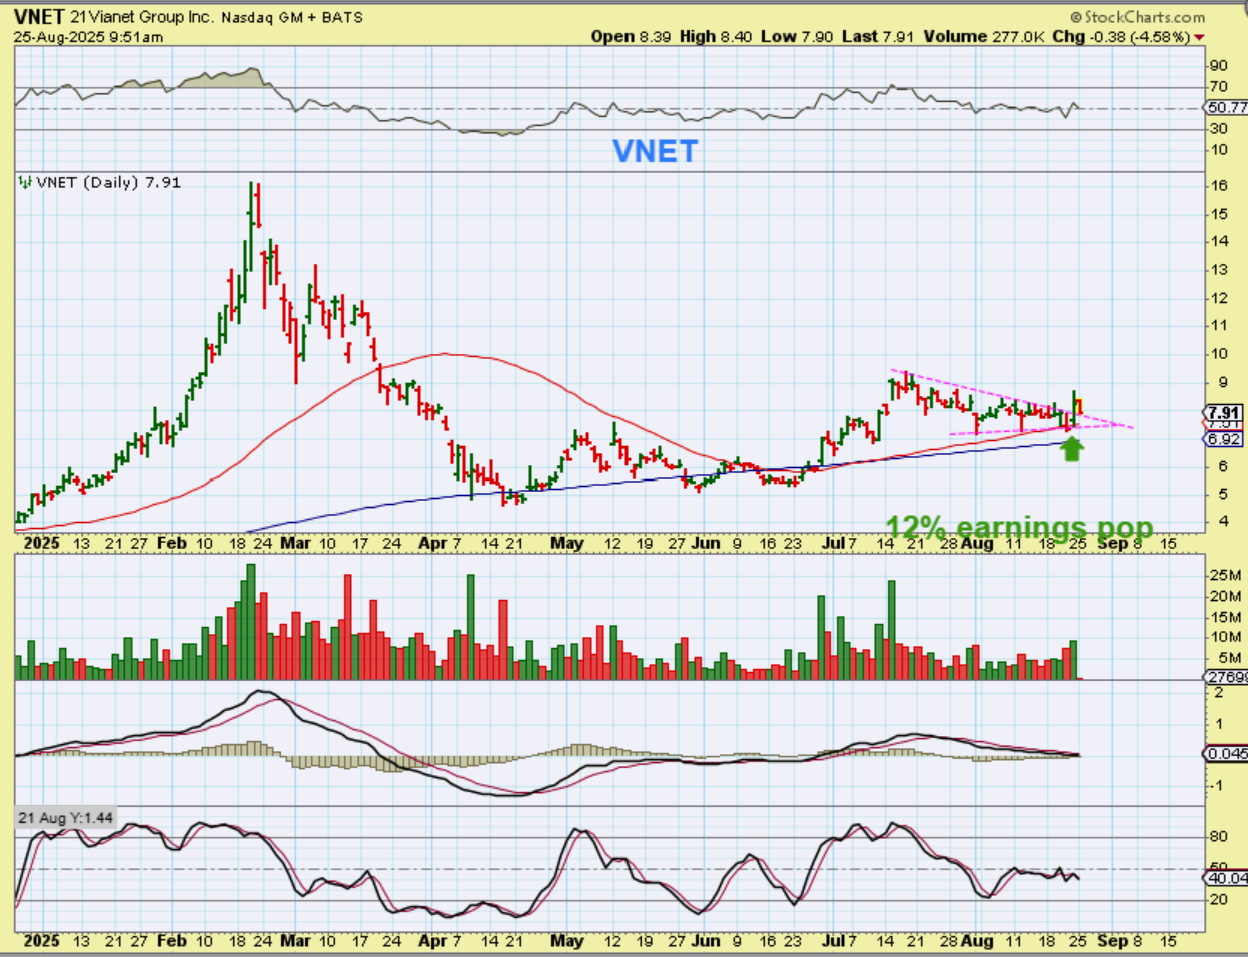
VNET ramped up HUGE in early 2025, $4 to $16, but like many of these do, they fall back to support over time. It has been climbing the 200sma and that gave it a run from $5 to $9. It has since formed a triangle or wedge, and the set up is bullish. It had a 12% Earnings pop Friday and dipped 5% on Monday. I think that an entry around here could do well over time. NOTE: As nice as this set up is, obviously we know that the ICL is coming due in a month or 2, and that is a bit concerning. I like to go in Really heavy at ICL’s, but smaller positions now. Note#2: If this ramped up like it did in January, we’d be back at the highs in about 1 month anyway 🙂
.
2 stocks that started off green but sold off as the Nasdaq sold off. That said, They may still be fine.
.
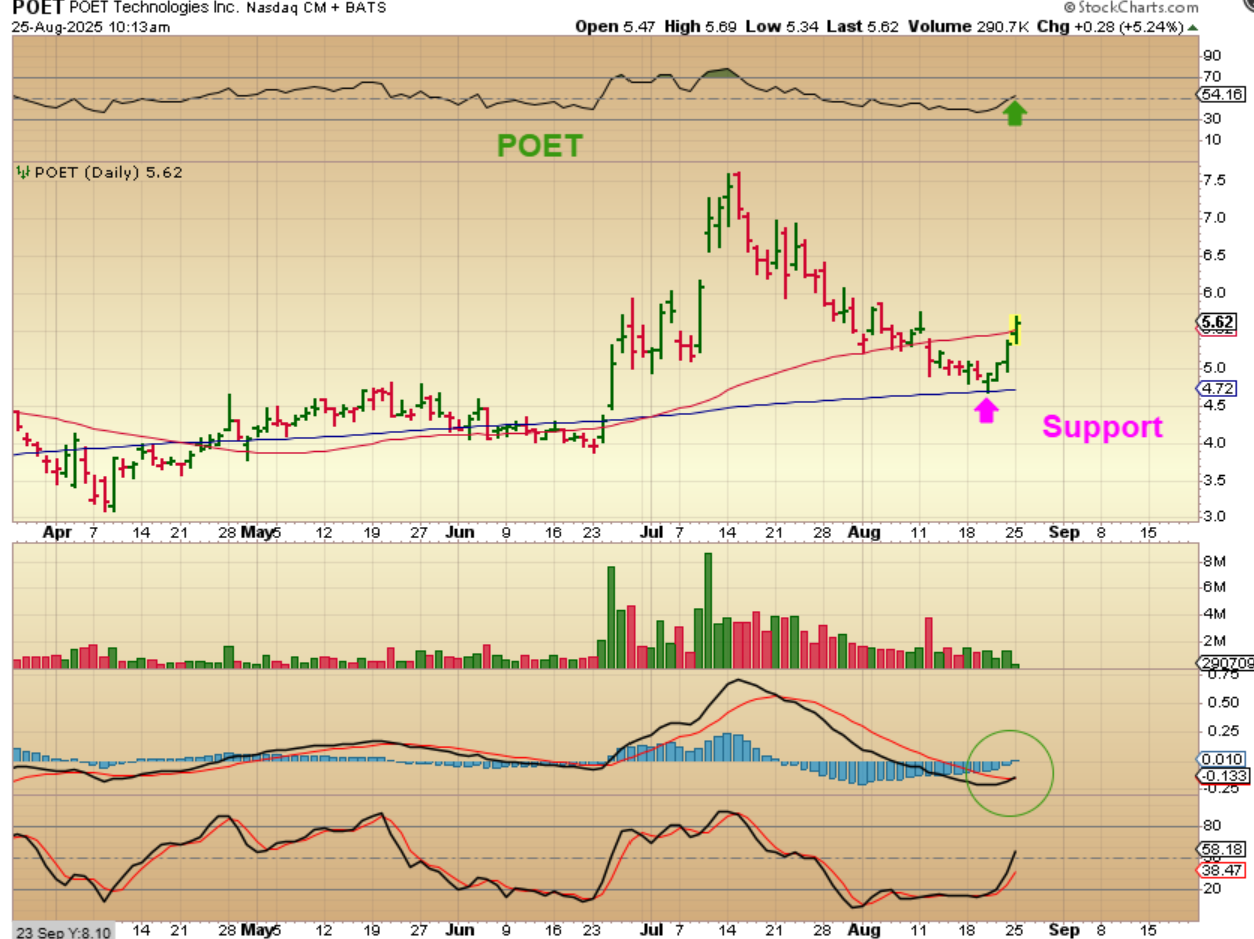
POET has been mentioned here. It ran from $0.78 to $8 in 2024-2025. It has been bouncing along the 50 & 200sma for months UNTIL JUNE. It suddenly ran from $4 to $7.50 in June-July and I don’t know why, but it has now worked its way down to the 200sma again (THERE IS A LESSON HERE, RIGHT? This is why I often do not chase runners; I make a watchlist and check it over time or buy WITH A STOP). So Poet started to break on Monday, BUT…
.
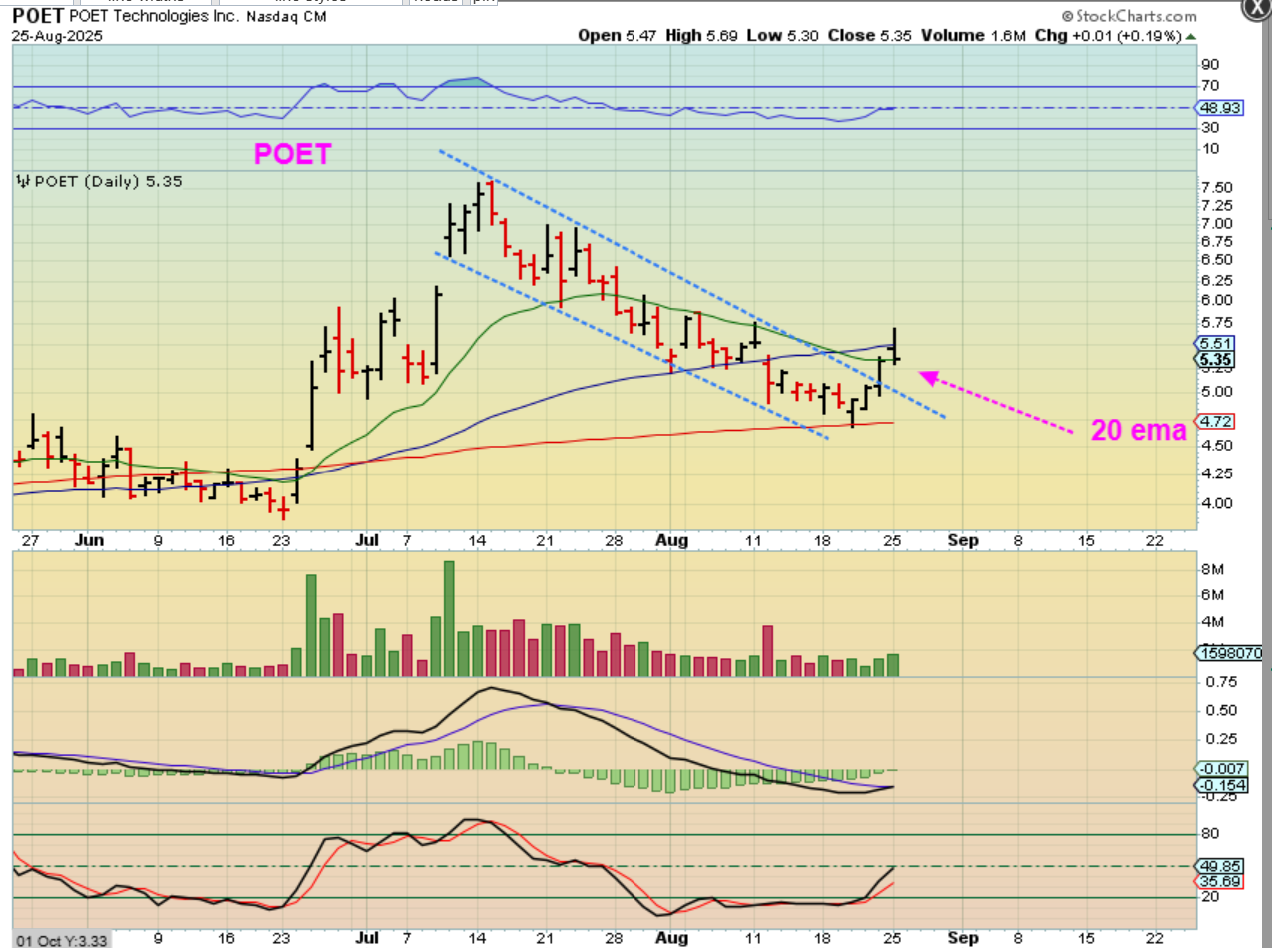
POET reversed as the markets sold off and only closed up 1 penny. Does that make this a bad set up? No. This might just back test that downtrend line and reverse higher again. It may reverse here at the 20ema, we don’t know, but we just saw 4 days higher and it is a good set up off of support.
.
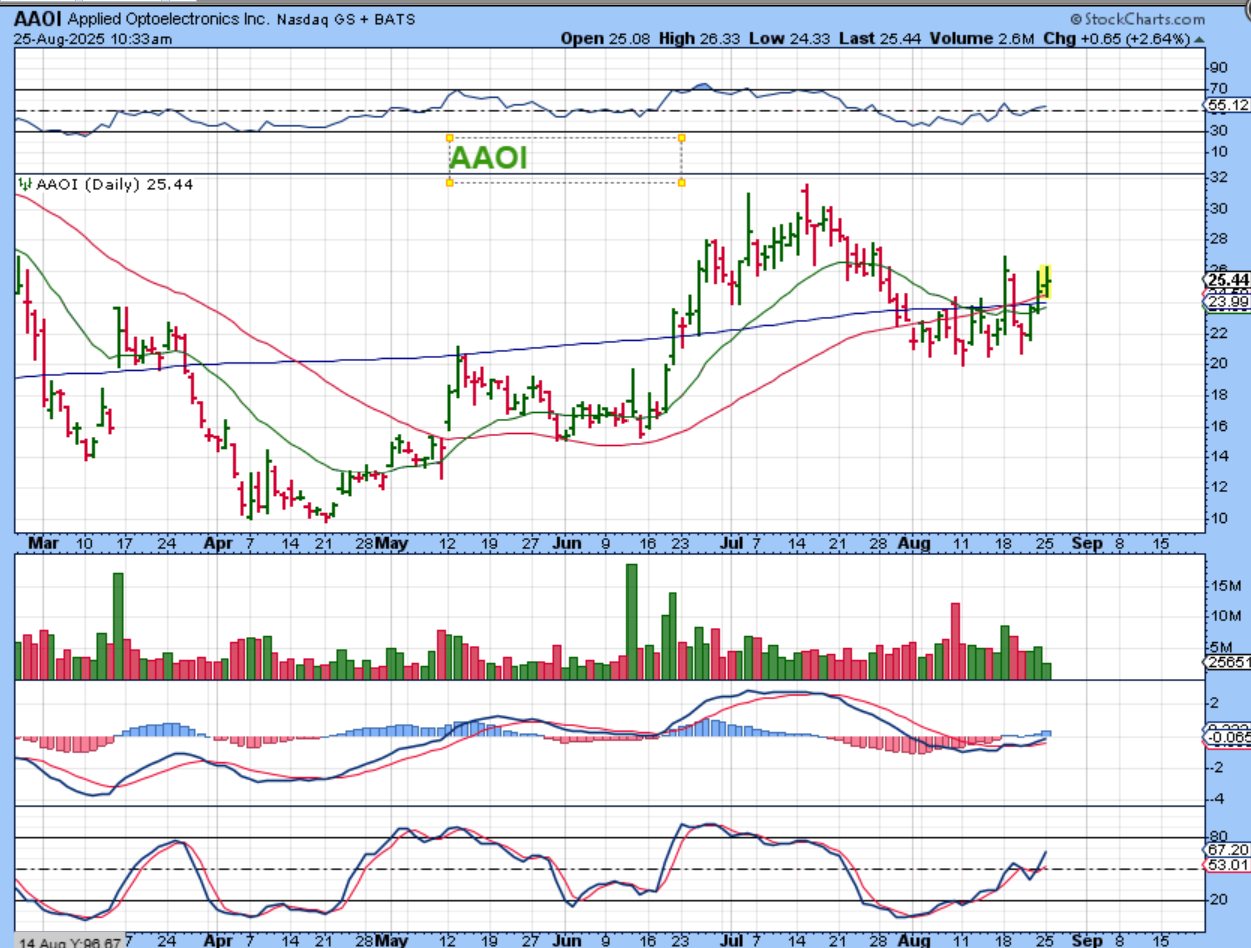
AAOI – I posted this at 10:30 a.m., it was green. I love and I hate this stock, and I have mentioned it many times. It pops and drops, but we’ll discuss that shortly. Right now we see that AAOI has moved above the 20ema and the 50 & 200sma. This is the stock that I pointed out as having moved from the ICL low of $10 to $20, then $30 (triple). It pulled back to $20 and looks ready to go, so…
.
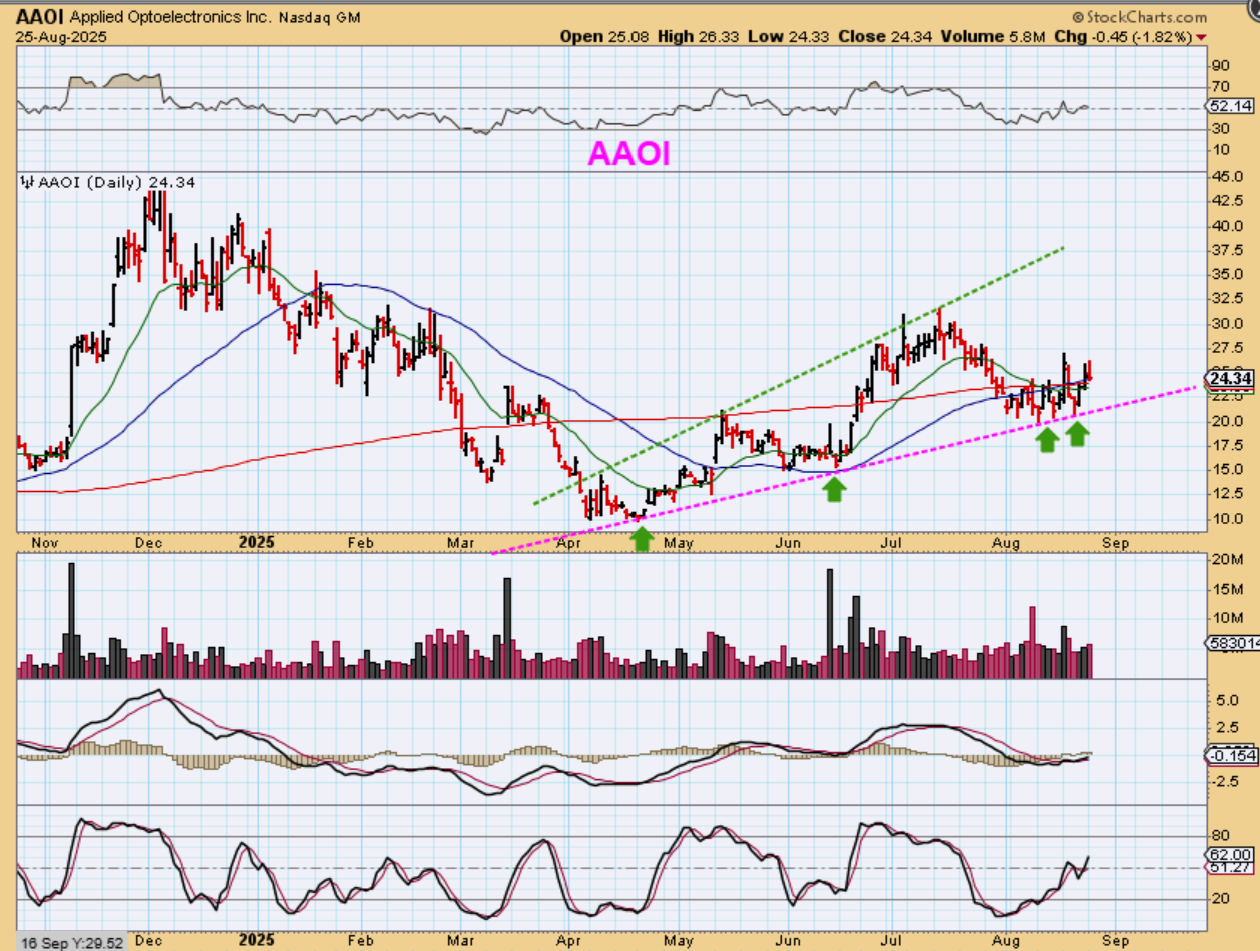
AAOI also sold off when the markets closed red and it was down 1.82%. Does THAT make this a bad stock? No! It is rising along a trendline and it has always been a choppy stock. In fact, …
.
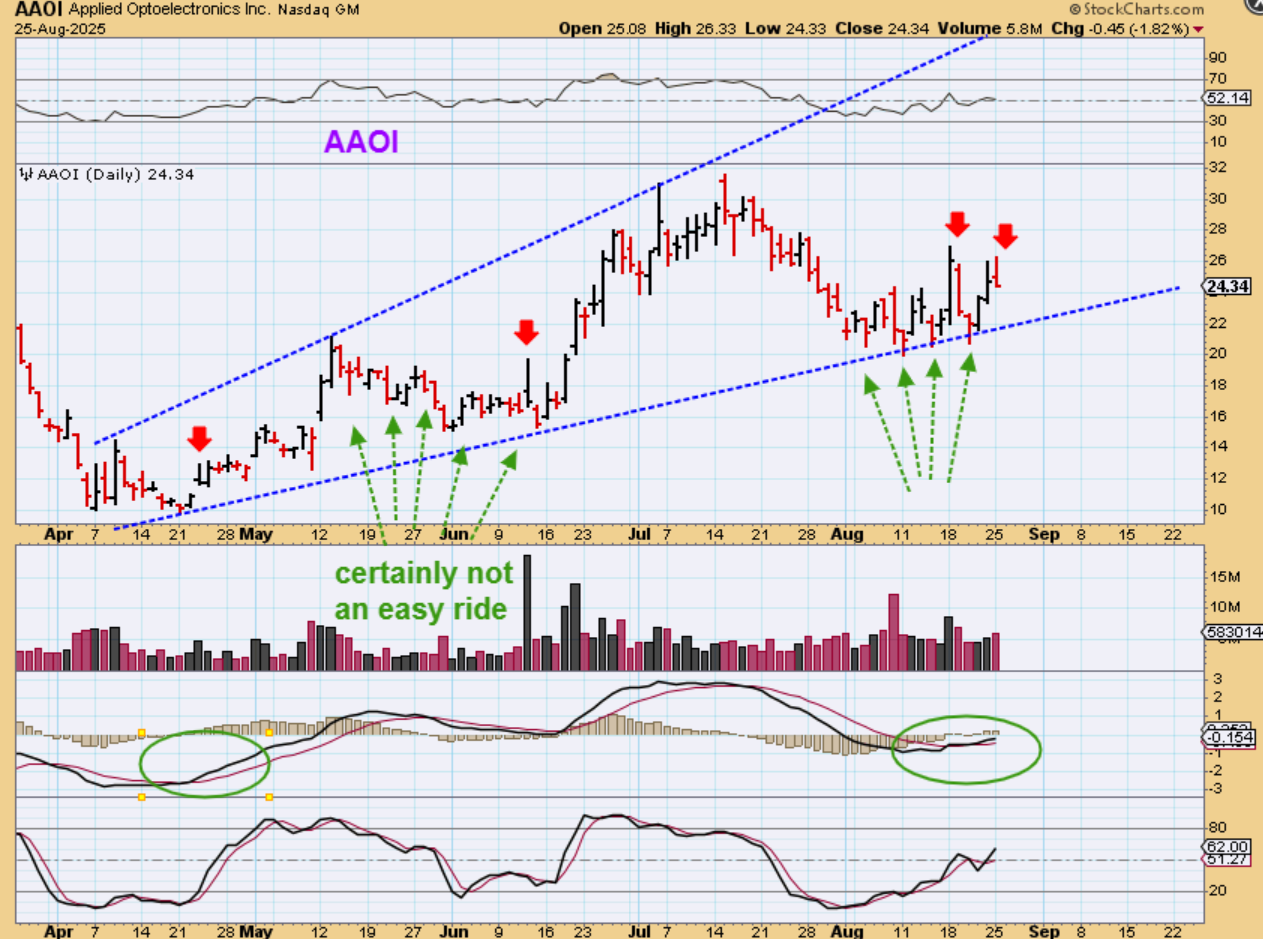
AAOI – I wanted to use this chart to remove the moving averages and simply show you that the only way to profit from AAOI is buy & hold, if you have the mental fortitude. I have tried to ‘trade’ it plenty of times, and it is the bucking bronco of the bull herd. It pops 10% and drops 9%. I have made money here, and I have been stopped out often. BUY and Hold at the ICL however, was a triple.
.
So I’m seeing that many of our stock set ups still look good, some closed quite green, but the markets were down slightly on Monday. CRYPTO STOCKS were also very interesting. I will cover that with Bitcoin.
.
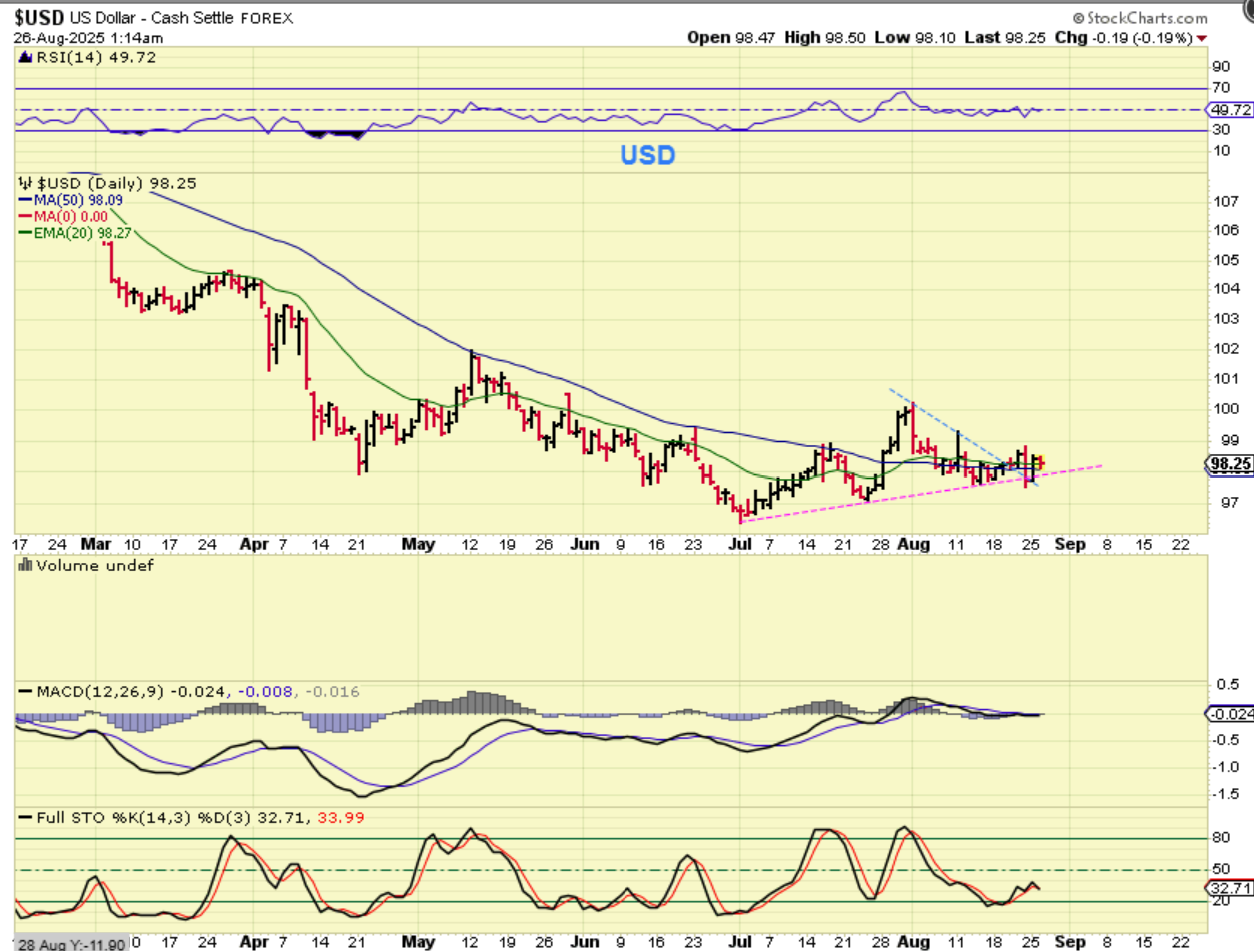
THE USD is chopping sideways along the recent trendline.
.
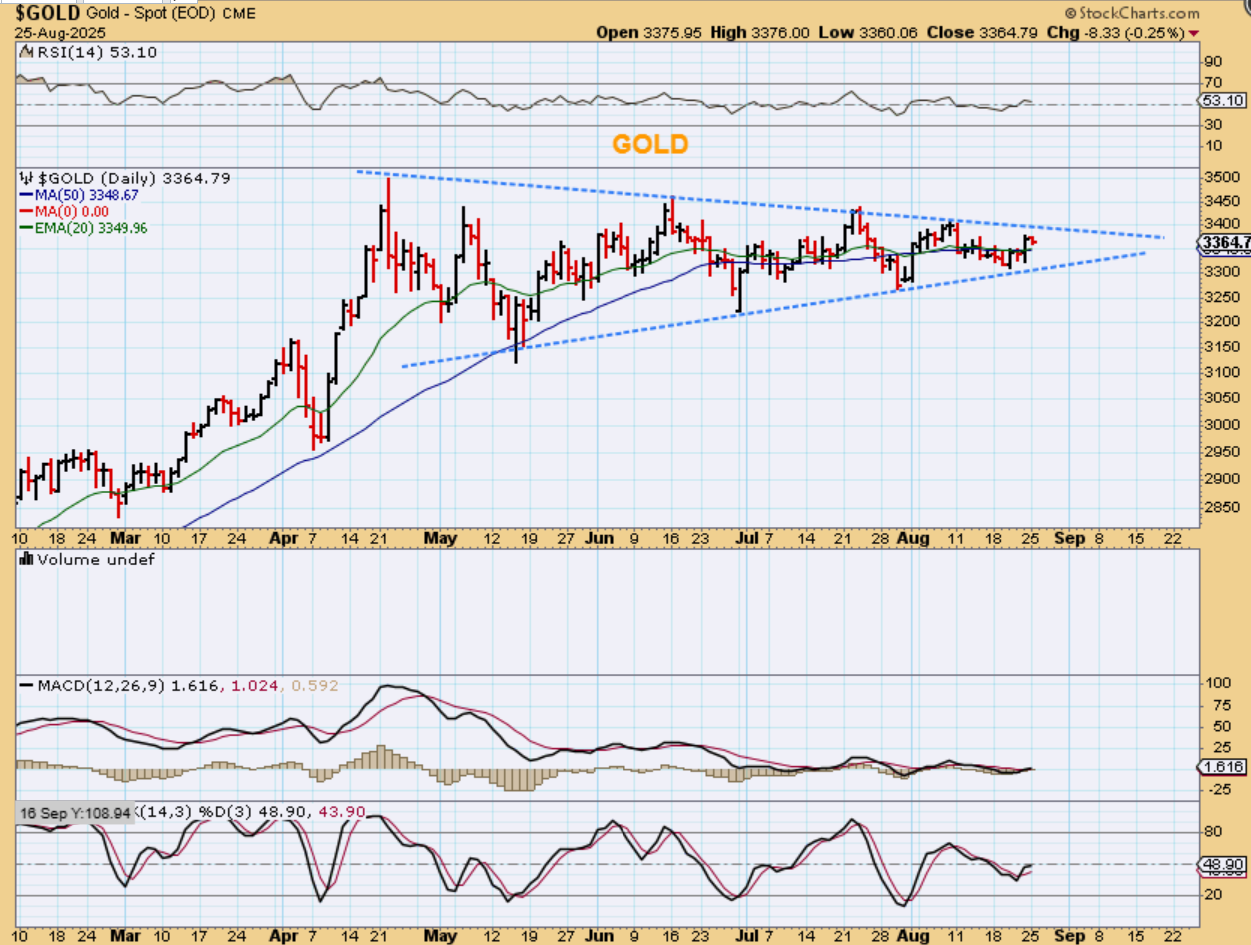
GOLD – Not much more to say here from Mondays action. Gold is getting closer and closer to the apex of this triangle. I cannot believe how bullish this consolidation looks and yet it lingers on sideways. Now let me remind you of something: I have explained in past reports that this SHOULD breakout higher, but if we view the ‘timing’ as becoming late, I said that we could also see a drop to form a Box consolidation. Do you remember that?…
.
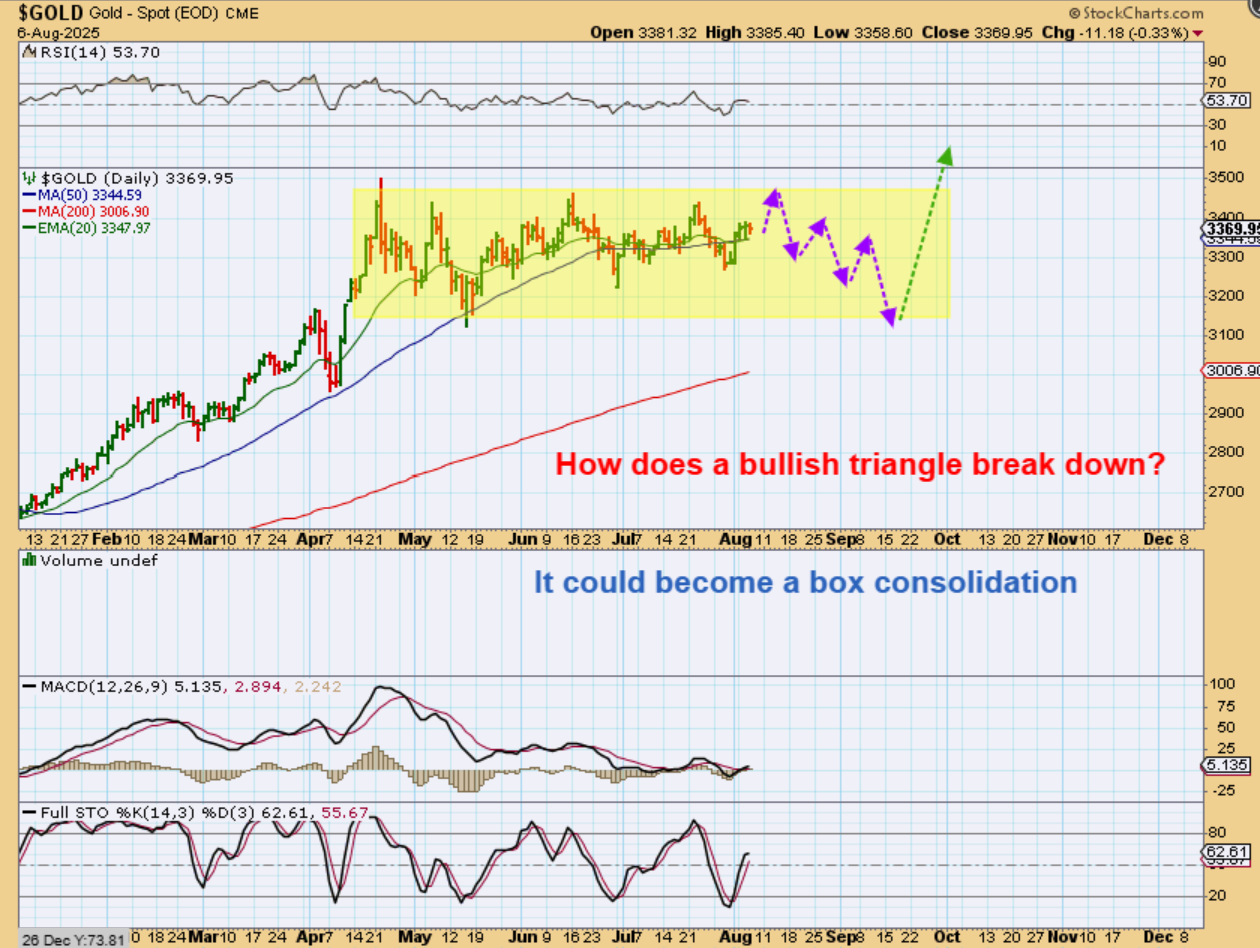
I have explained in past reports that this SHOULD breakout higher, but if we view the ‘timing’ as late, we could also see a drop to form a Box consolidation. This was my AUG 6 chart and we should keep it in mind. A drop to an ICL at the 200sma in September or October is not a bull killer. (THE FED MTG IS SEPT 17. DIP INTO A RATE CUT RALLY?). Or break out and back test into a rate cut.
.
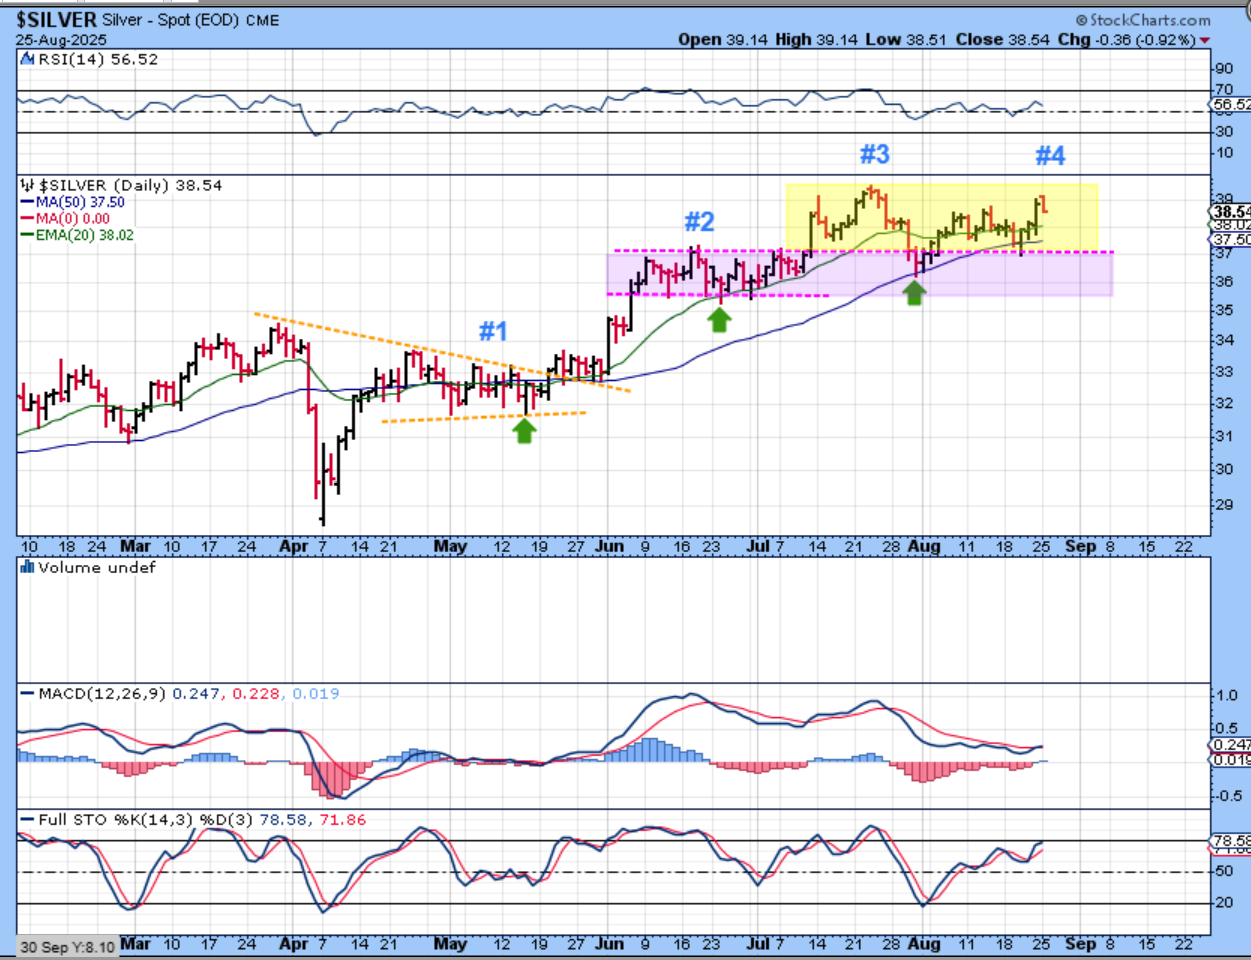
SILVER dropped and is on daily cycle #4. Using technical analysis, we see bullish consolidations as it moved higher. An ICL would be viewed as a shakeout in technical analysis, and then the rally could be very a very sharp ‘V-Bottom low’. THE FED MTG IS SEPTEMBER 17 (rate cut rally?).
.
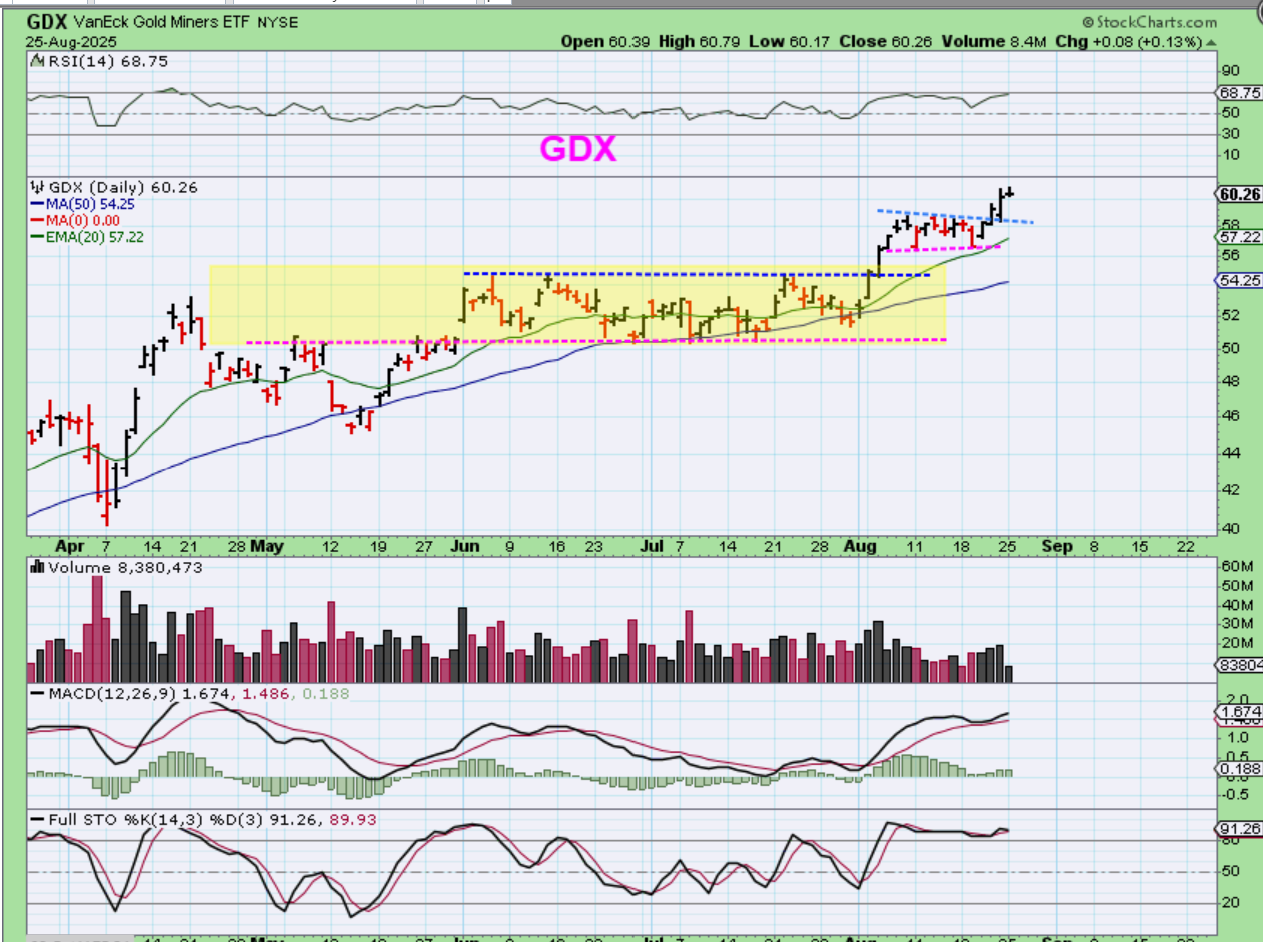
GDX – The Miners have been stronger than the metals, and we really do welcome that. Any dips from here (be patient, We’re talking about multiday dips) are buying opportunities. and ICL at the 50sma would be a great entry, if it happened.
We had a STRONG POP on Friday with the Fed speech at Jackson Hole. Now we had a ‘pause’ on Monday, but that doesn’t change anything. The markets and set ups still look good. Enjoy your Tuesday trading!!
.
As a sidenote: I get emails from readers at times and thank you , I appreciate all of them. I wanted to just explain something here briefly. I honestly am usually a bit of a private person, and I don’t like to complain at all. I feel that many others are going through MUCH MORE than I have this year. Much more! That said, I also have been assigned many follow up blood tests, Ultrasounds, and ‘Dopler ultrasounds’, which also require follow up discussions with the doctor in a separate appt too. At these times, I wont be in the live commenting area for a while, so I just mention those visits to explain my absence. My calendar was absolutely littered with these appointments in August and September, sometimes 2 appts /week. So at times I just cannot be in the live commenting area. I have 4 different doctors, and each require several appointments, so it adds up. I am assuming that after September I’ll just go back to every 6 month check ups, but they are really trying to nip this in the bud (I had sepsis, blood clots, and kidney stones & infections). I feel very good now, I feel right back to normal, but the follow up tests are ongoing and necessary. That said, I’ll see you at 11 am today :). I have a follow up at 9 am.
.
~ALEX
.
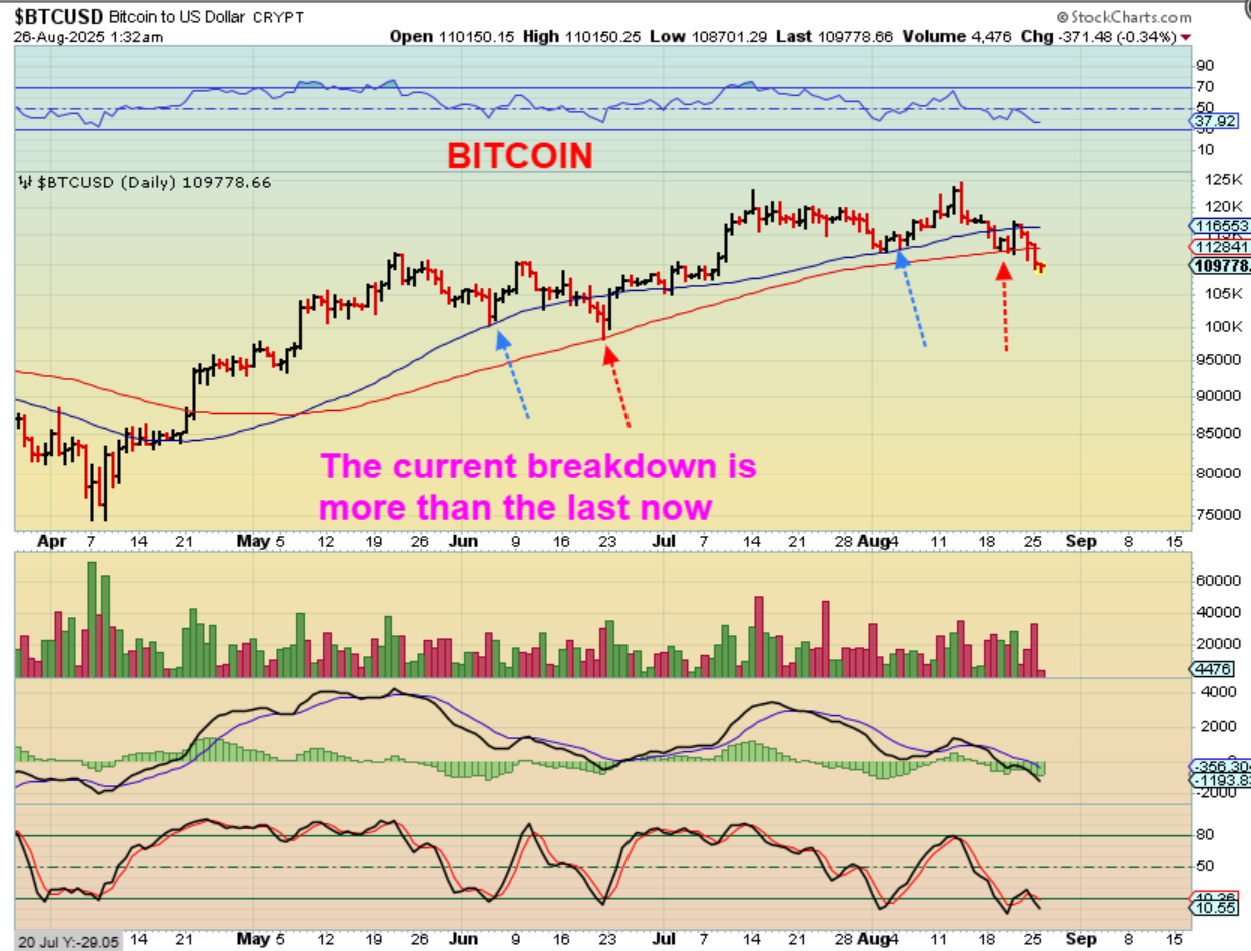
BITCOIN continues to make new lows. I was a bit surprised at that after Fridays pop, because Crypto stocks that I own sell off and recover each day. I feel that, like when Gold Miners rally before Gold, they must be foretelling that Bitcoin will bottom, but we’ll see. Let’s discuss Bitcoin a bit more.
.
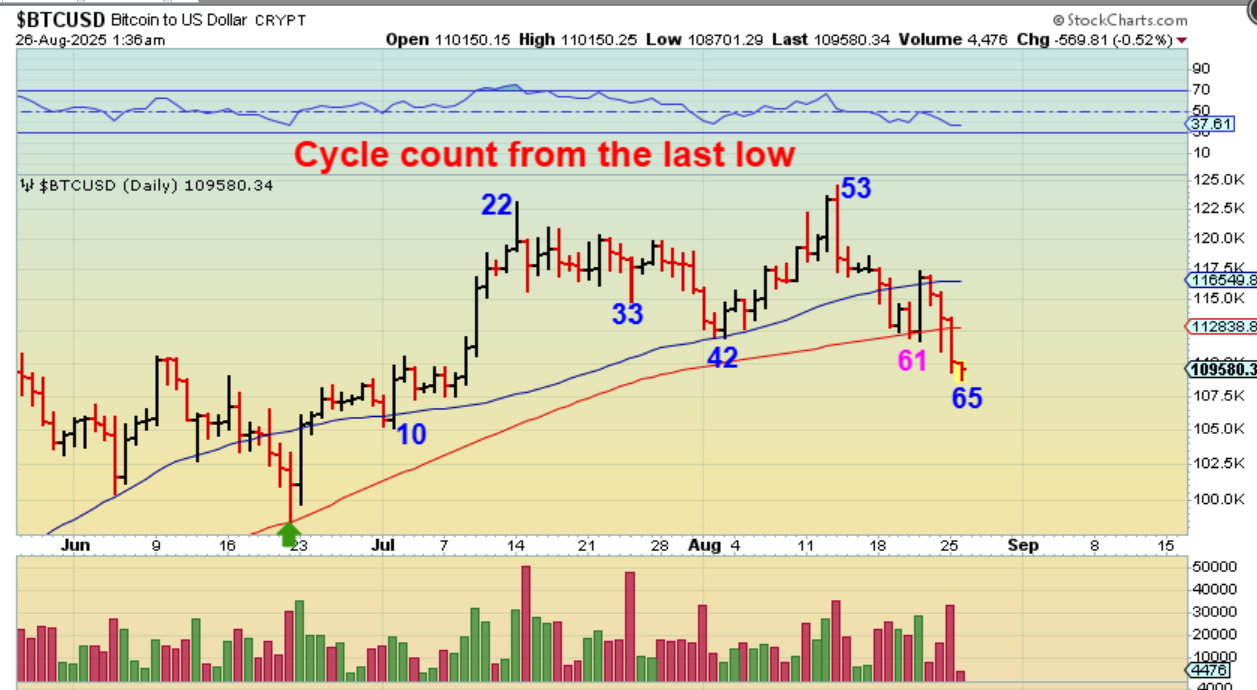
BITCOIN and Cycles: If we count from the recent lowest low, we are now on Day 65. That is where Bitcoin should bottom. Crypto stocks are NOT following Bitcoin and they are NOT making new lows, in fact, some are making new recent highs.
.
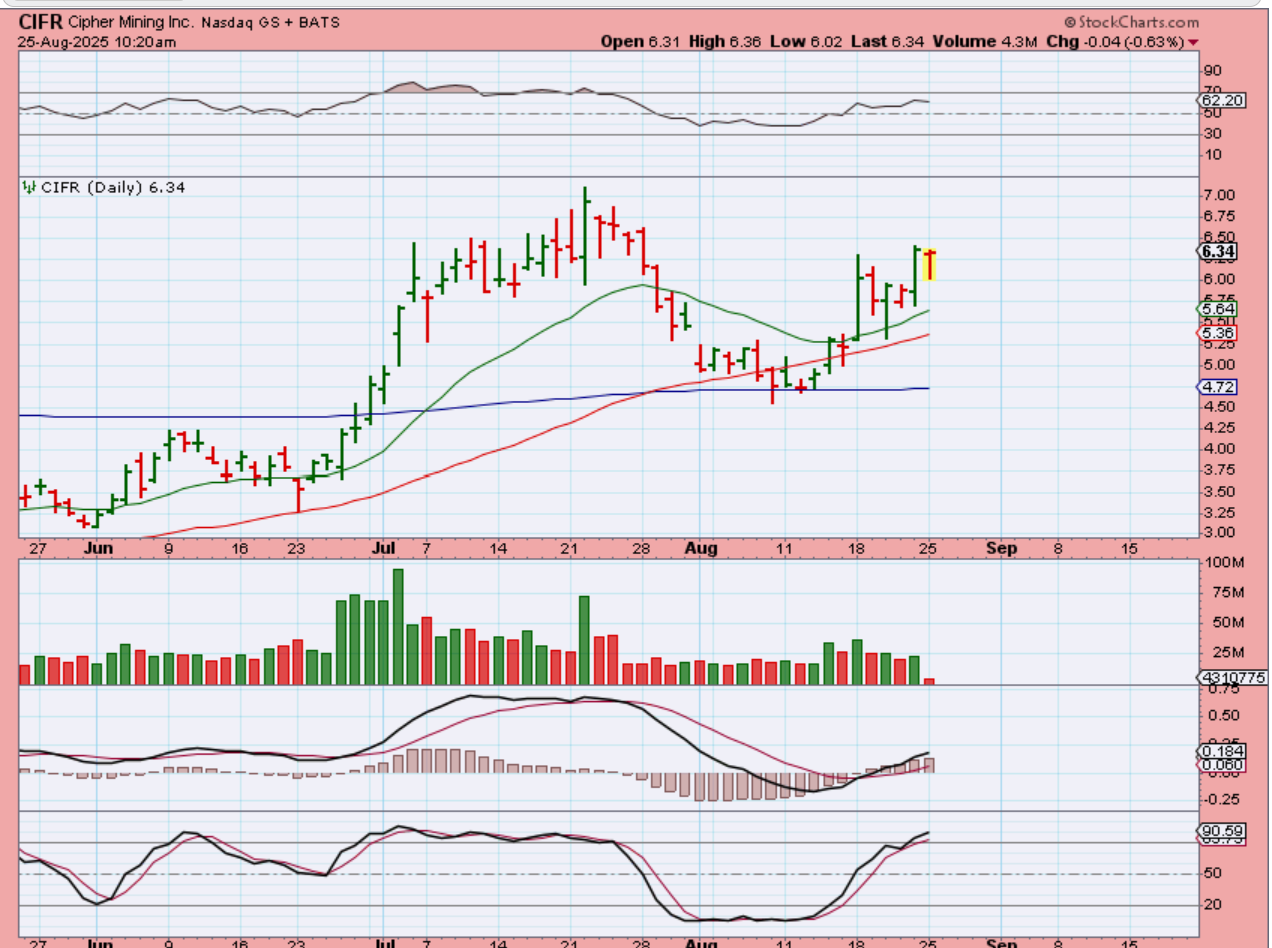
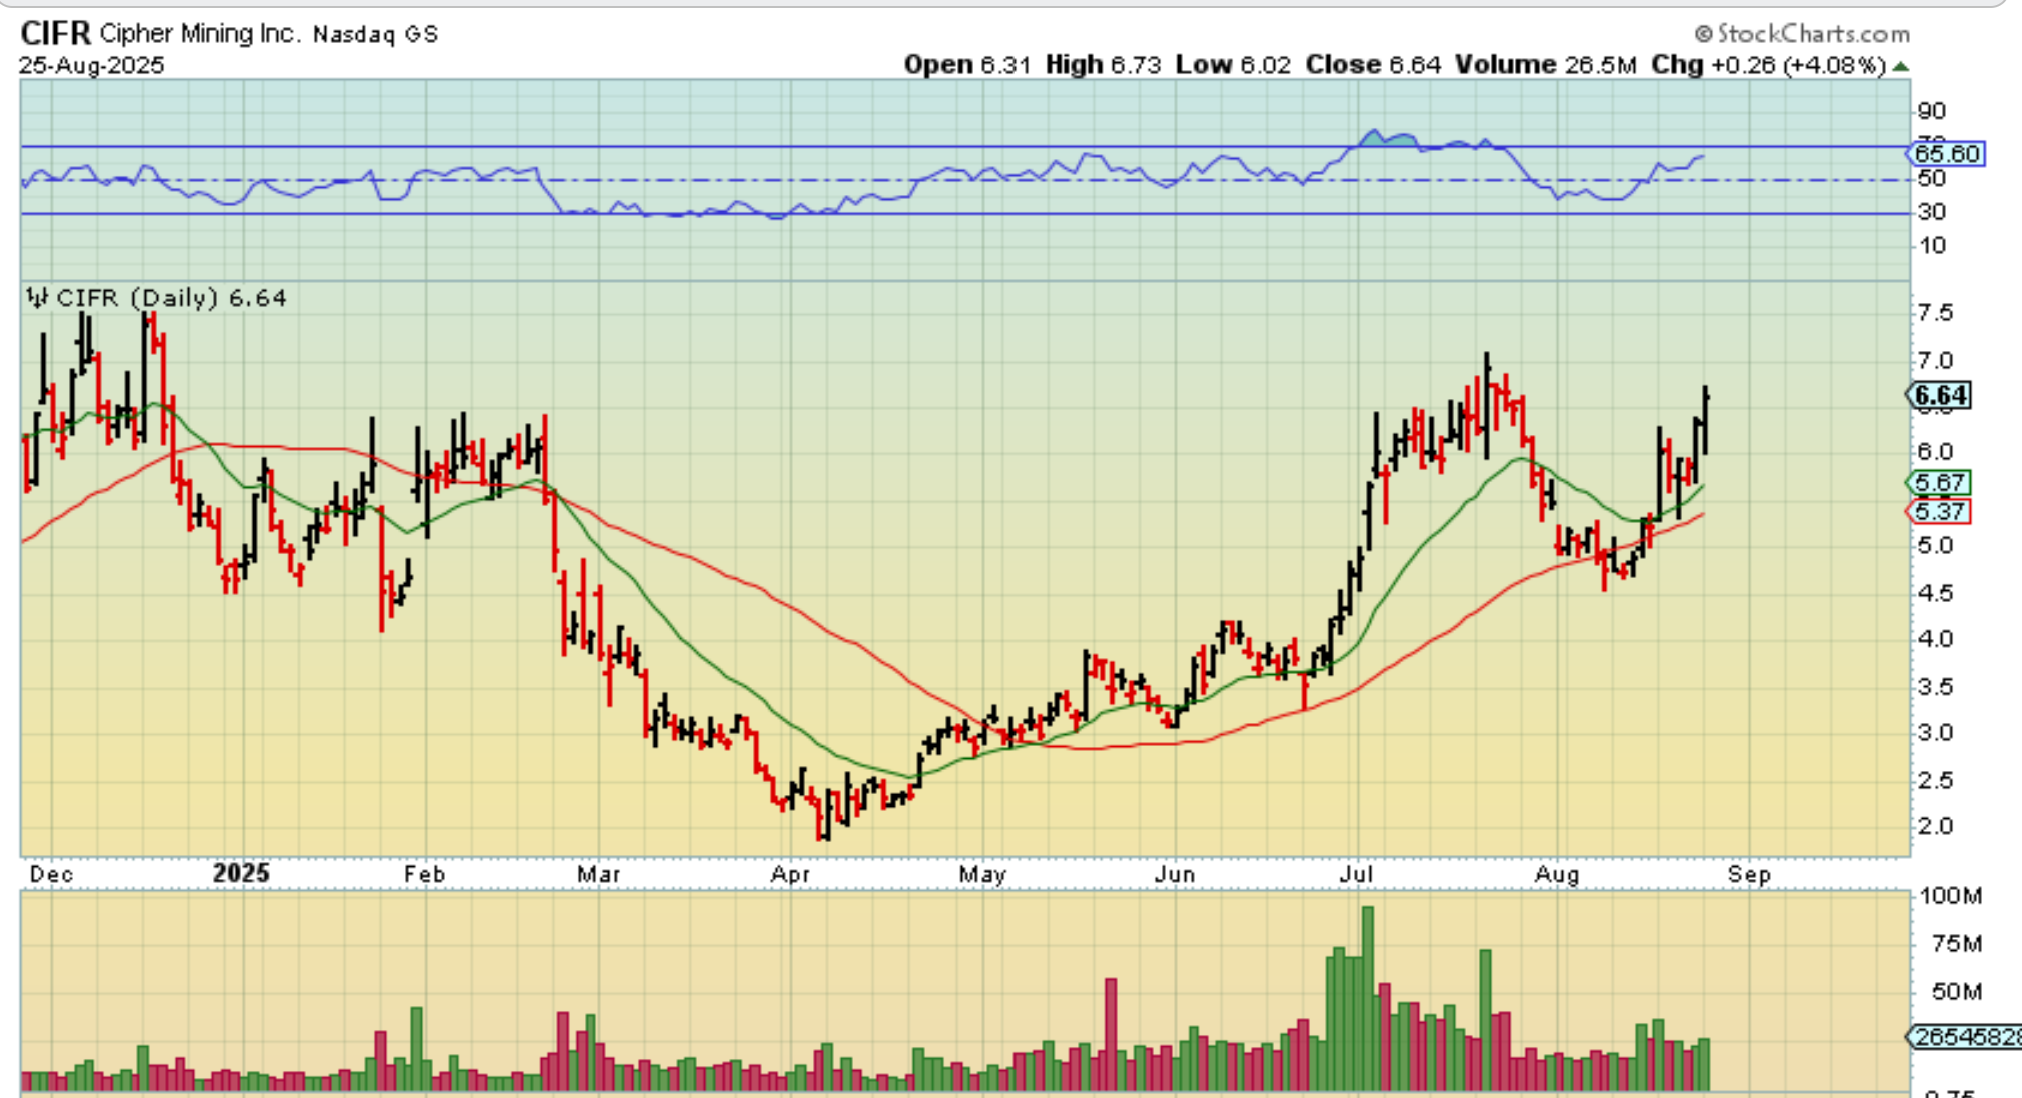
CIFR sold off and reversed higher, so I posted this at 10:20 to show that with Bitcoin selling off, these were (AGAIN) rising higher.
.
So with Bitcoin breaking the lows, CIFR closed up 4%
.
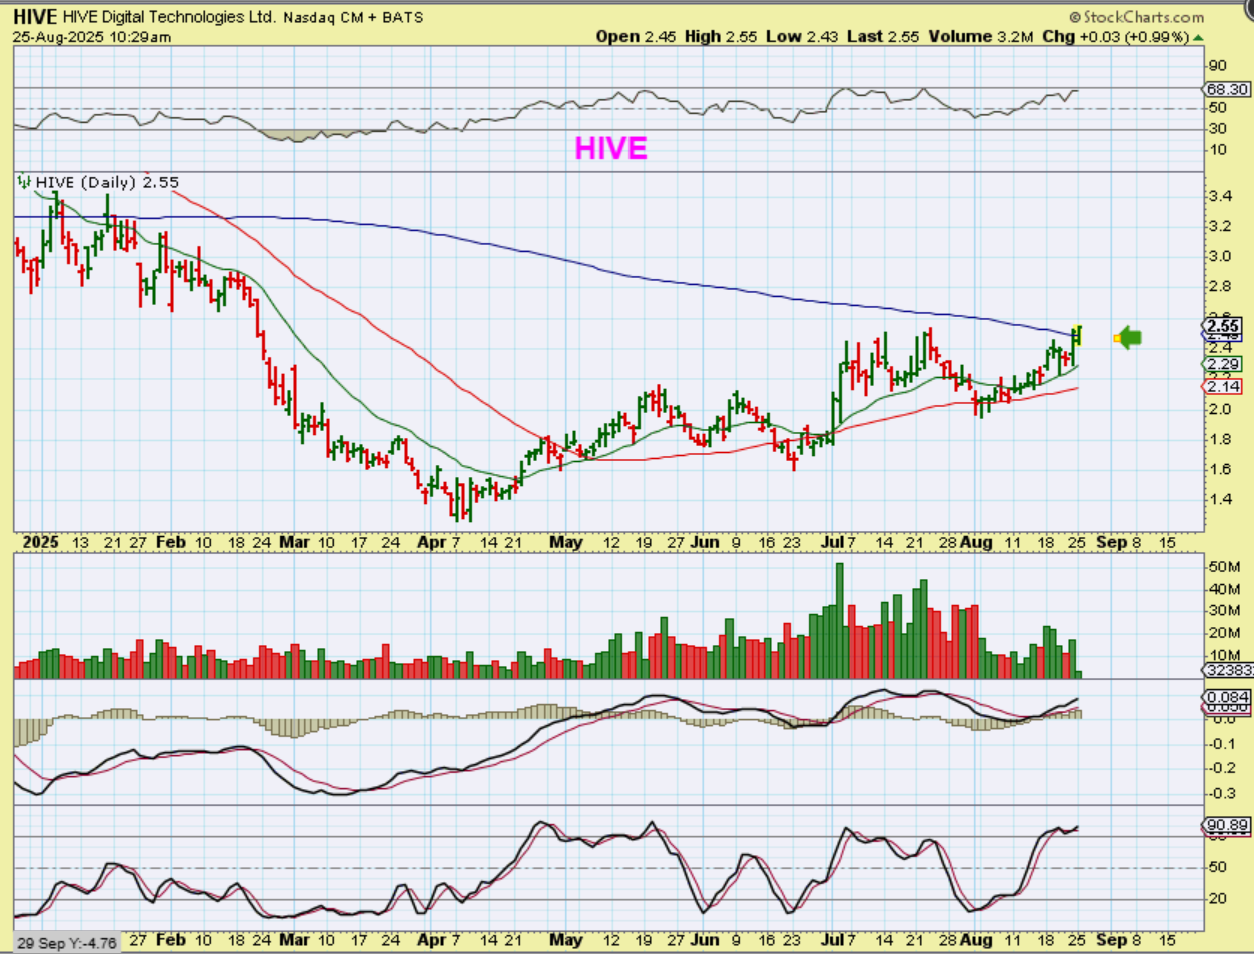
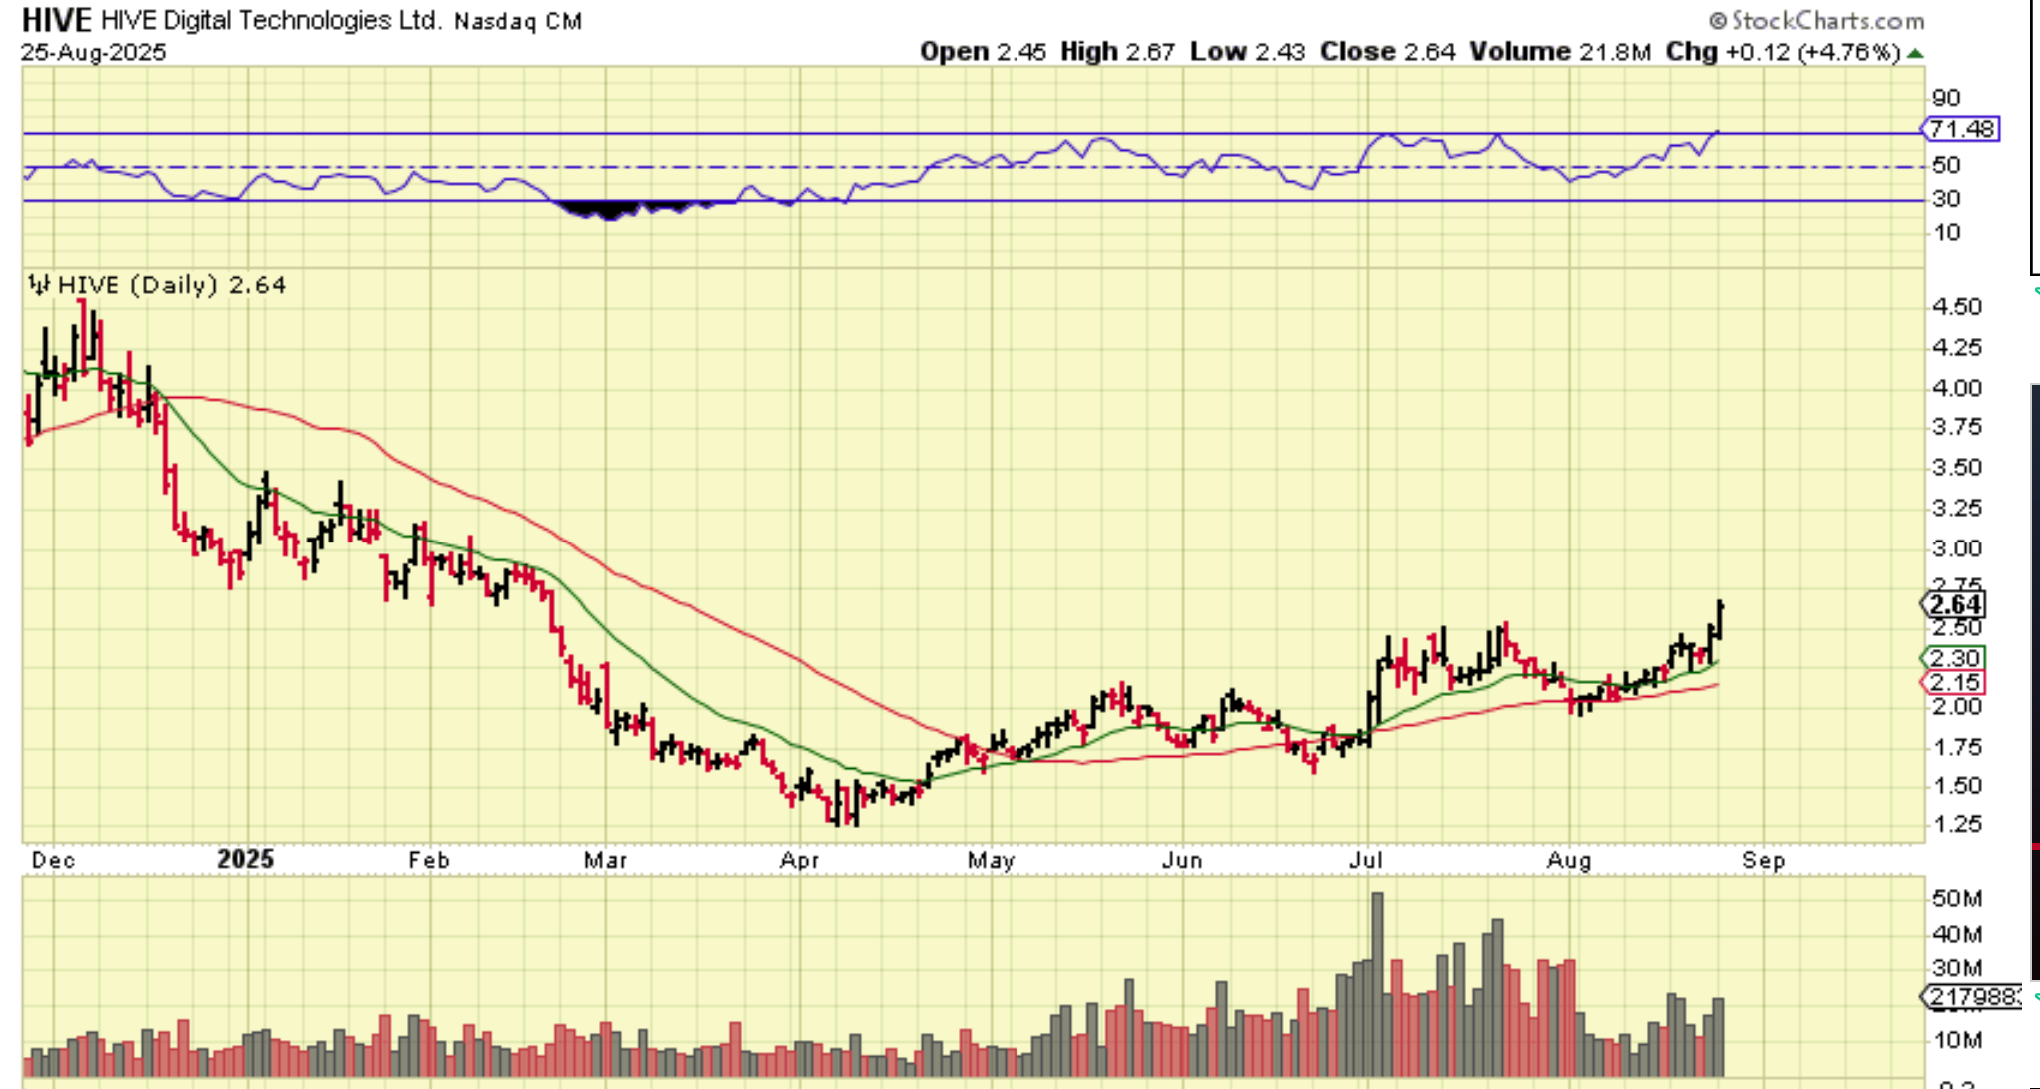
HIVE was also up in the first hour, and breaking the 200sma (with bitcoin down and the general markets down too).
.
HIVE looks very bullish and closed up near 5%. Again, this was with the markets down and Bitcoin down quite a bit.
.
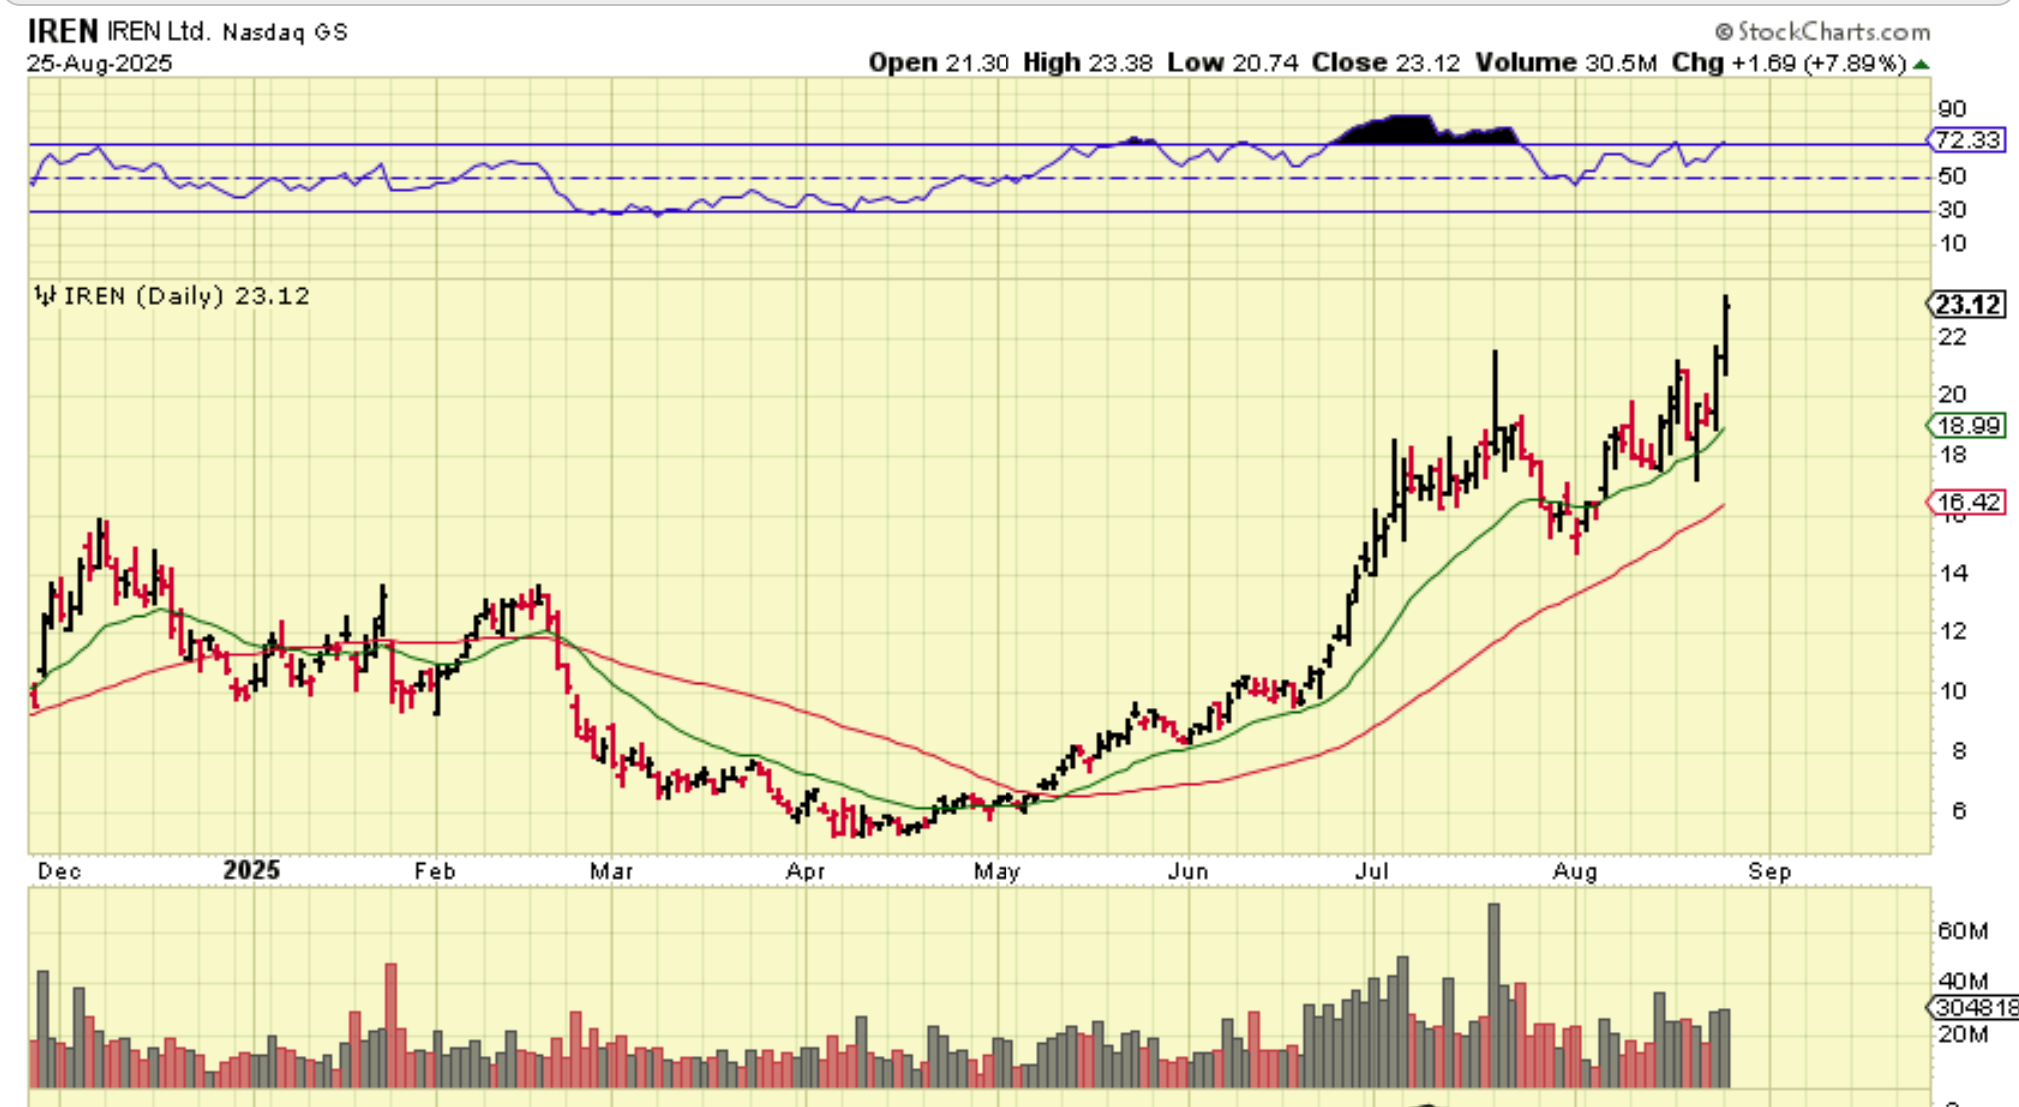
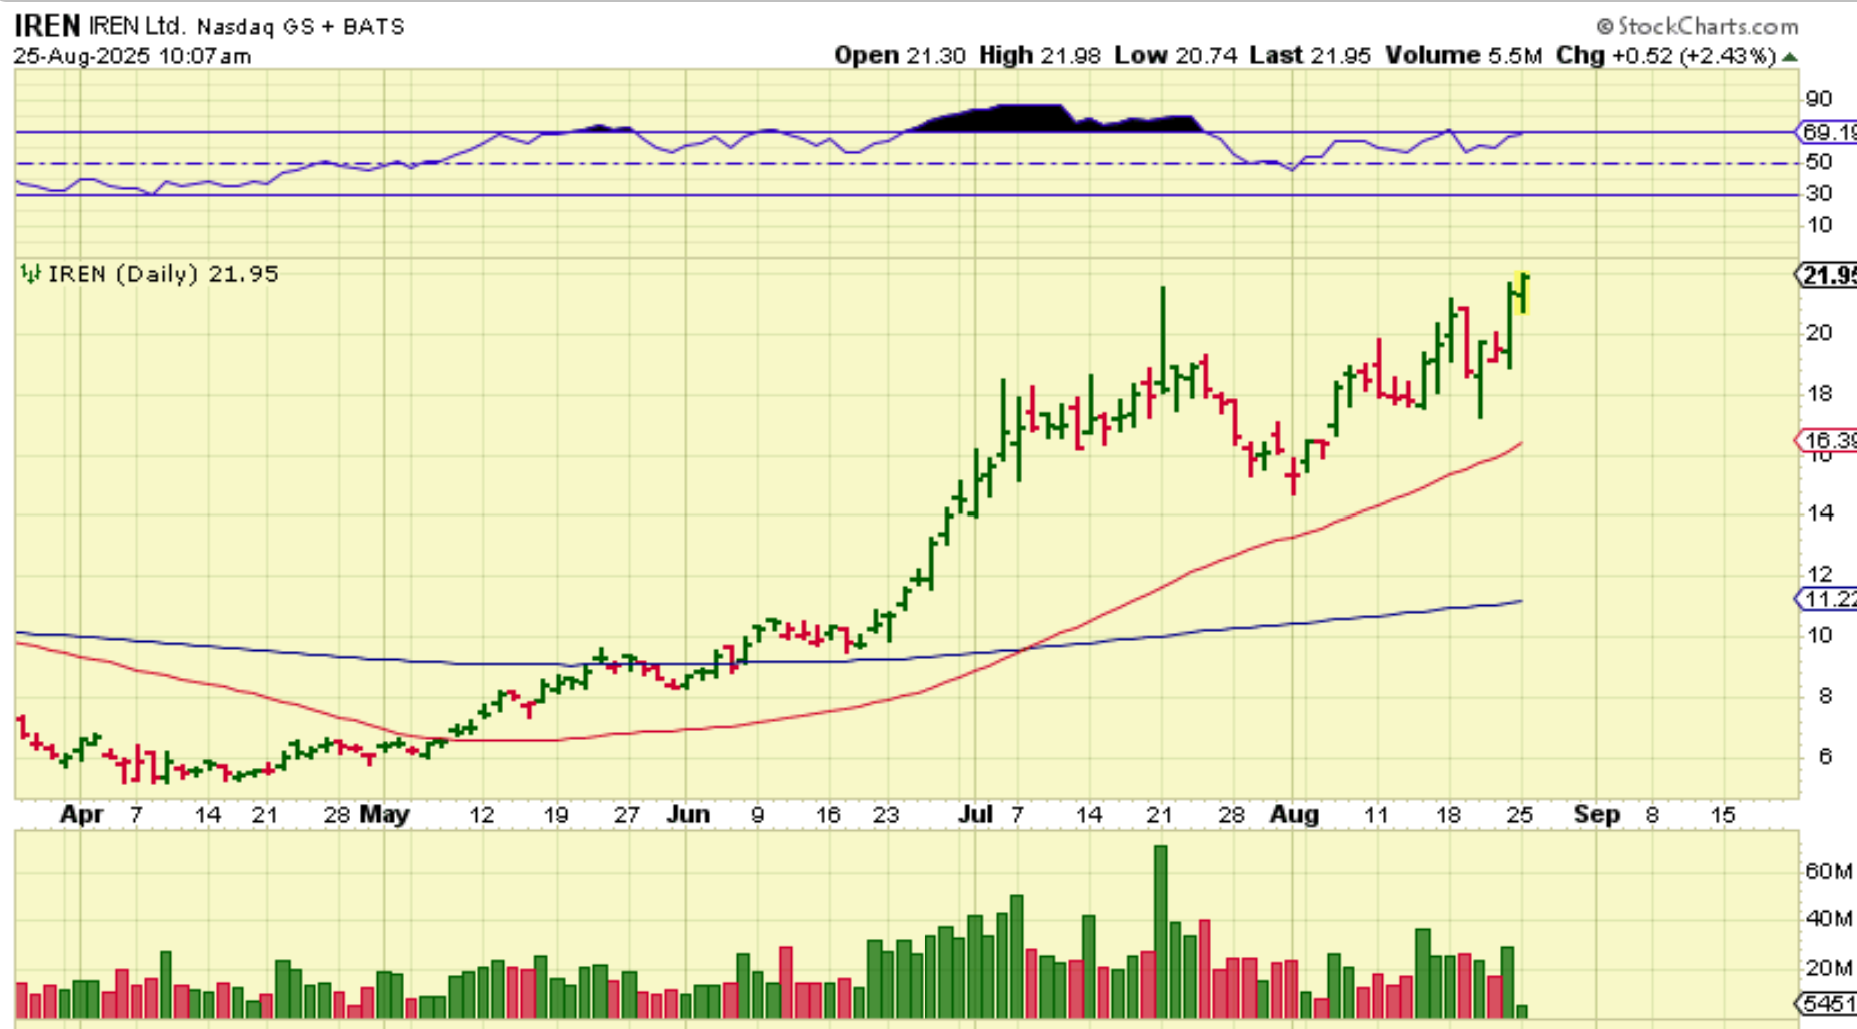
IREN had a very strong move on Friday and I pointed all of these out on Friday morning with the Fed speech. I pointed out this Red to Green move, now up 2%. Would it continue?
.
IREN closed up almost another 8% with the markets and bitcoin red.