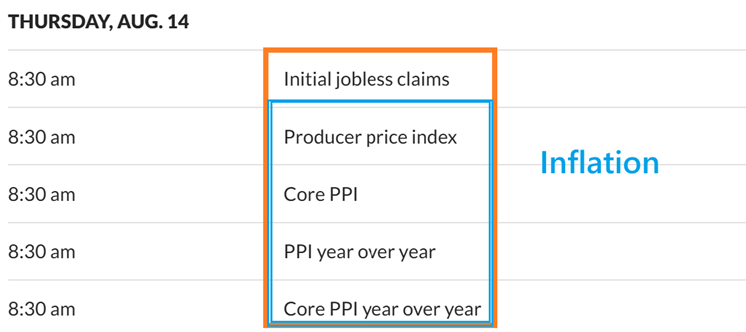
Thursday August 14th – PPI
MARKET MOVING DATA: Which Direction? We’ll see at 8:30 a.m. ET
.
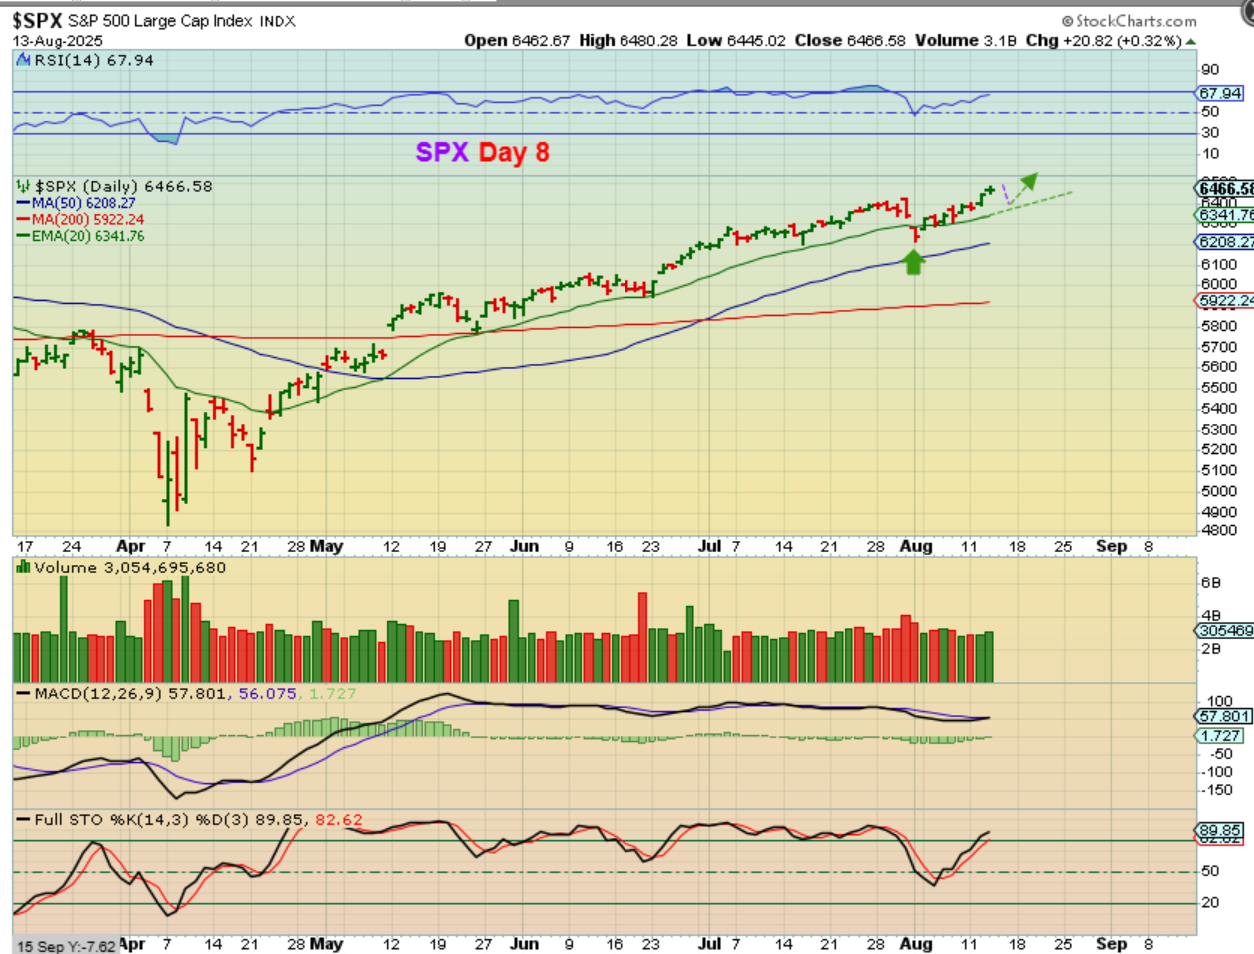
THE SPX gave us a doji and we do have a little divergence, so I have to wonder if our data gives us a knee jerk reaction dip, and then we bounce at the 20ema. This dip does NOT have to happen yet. We could rally sharply today *& tomorrow and then pull back next week too, but I just thought that I’d mention it with that doji, so we aren’t caught off guard if the Data dips us lower.
.
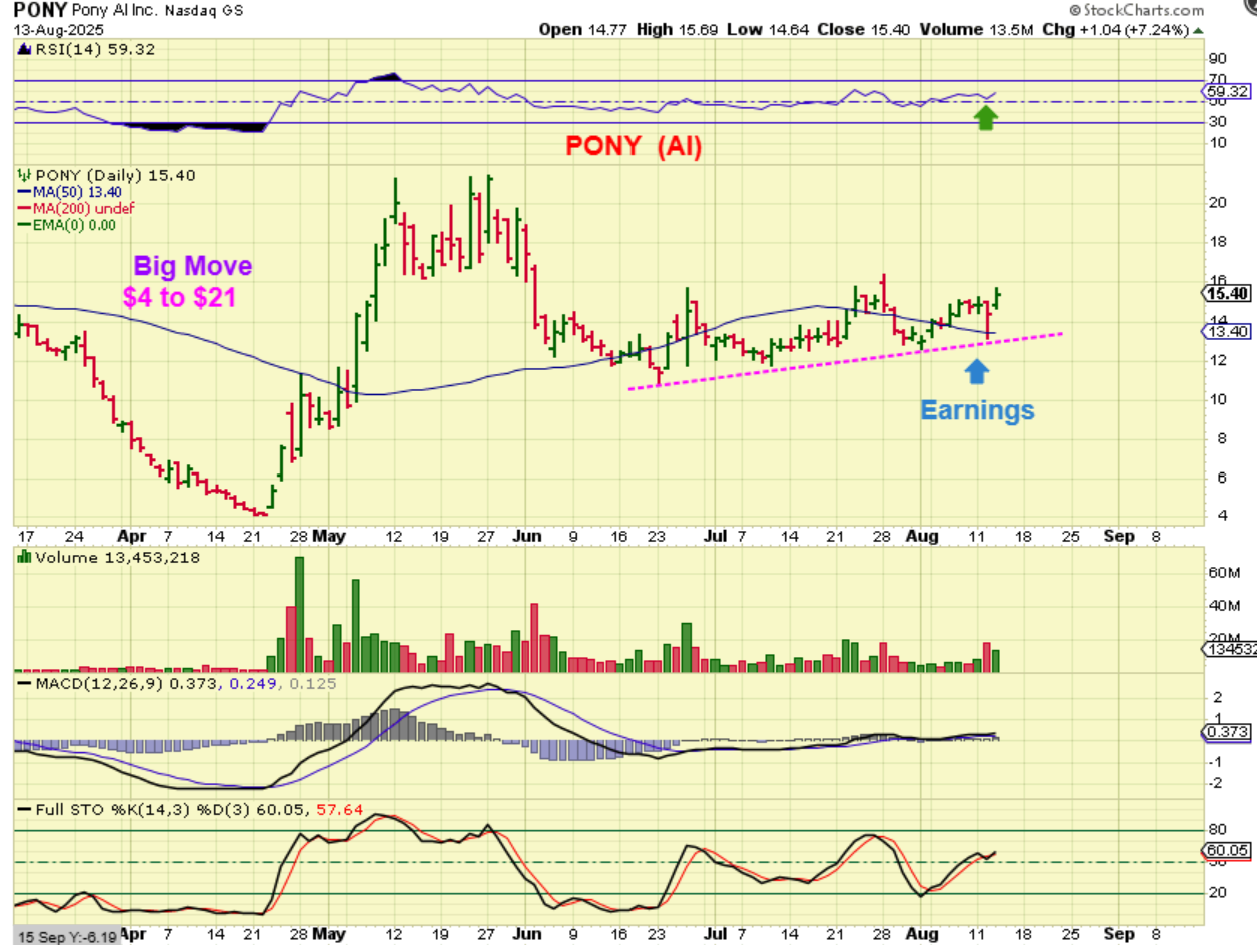
PONY is an AI stock that I was watching with earnings coming up. It initially dropped on earnings and then bounced back on the same day at the 50sma (& it continued to form a trendline). This ran from $4 to $21 out of that ICL, and this is why I take note of those ‘runners’ and wait for a consolidation. We may see something like this in MJ stocks too.
.
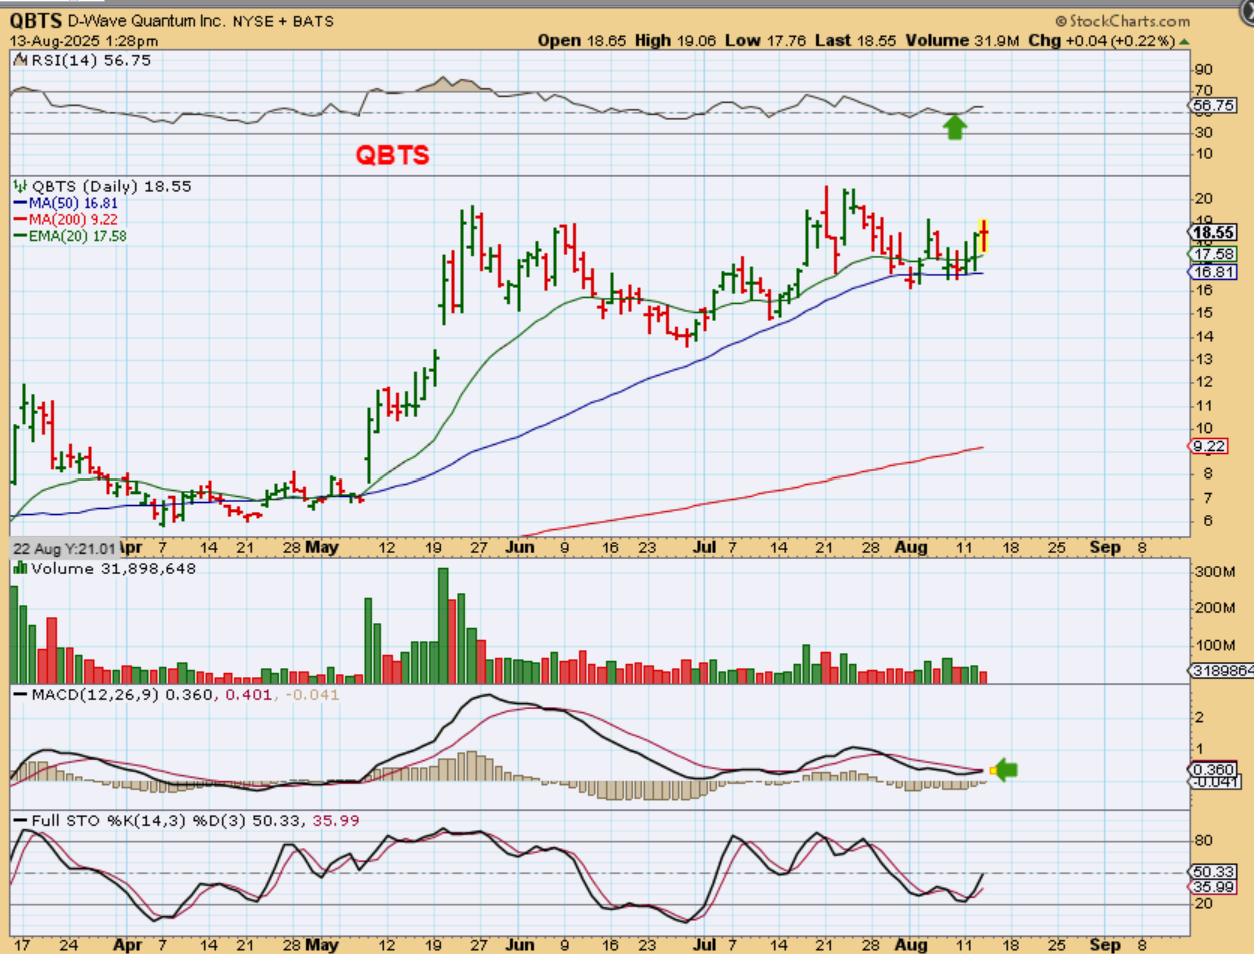
QBTS – This company was in Wednesdays report. I grabbed this chart on Wednesday because QBTS released earnings a few days ago, but it held up at the 50sma. It dropped on Wednesday and started to bounce back off of the 20ema. It closed green.
.
YESTERDAY I SAID:
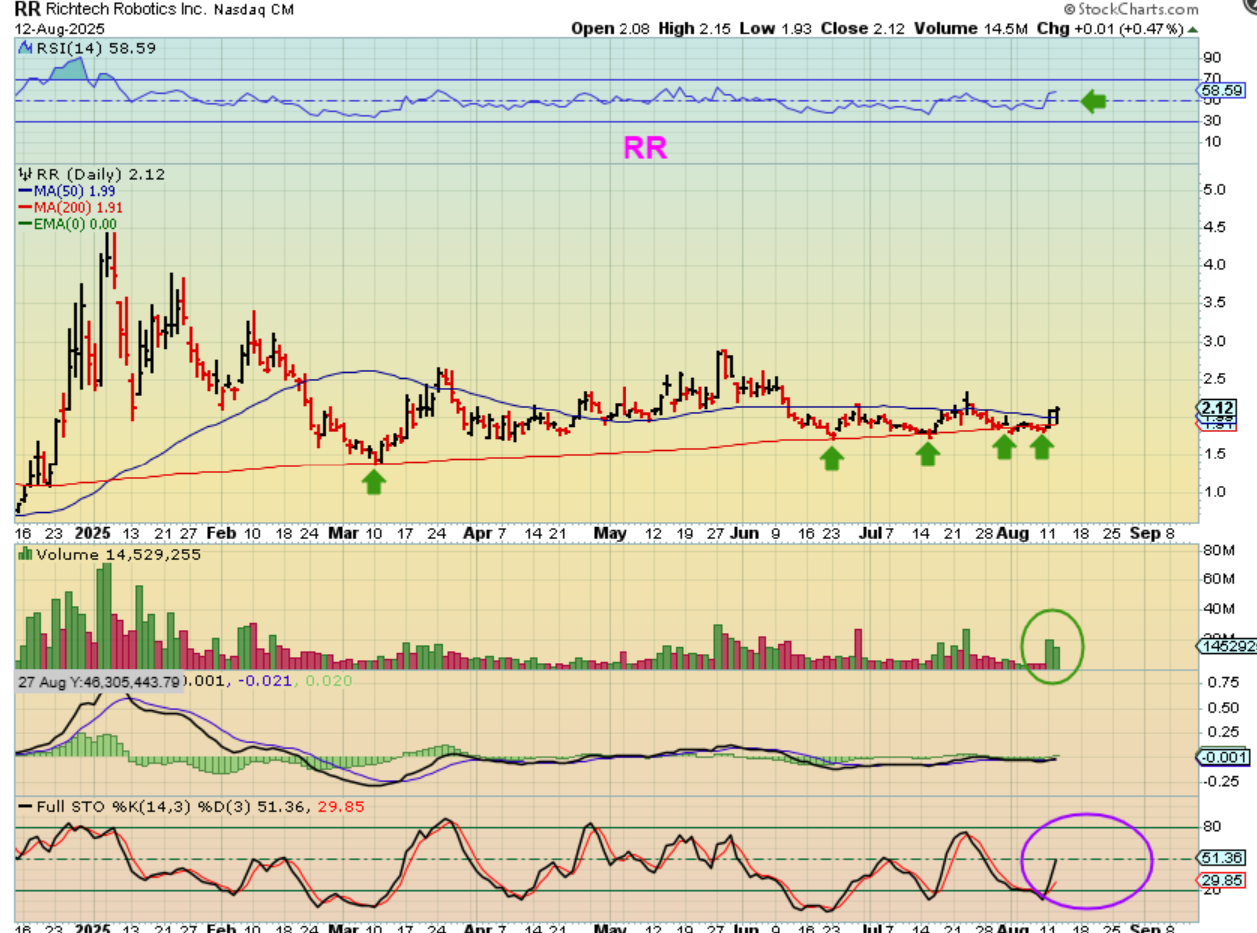
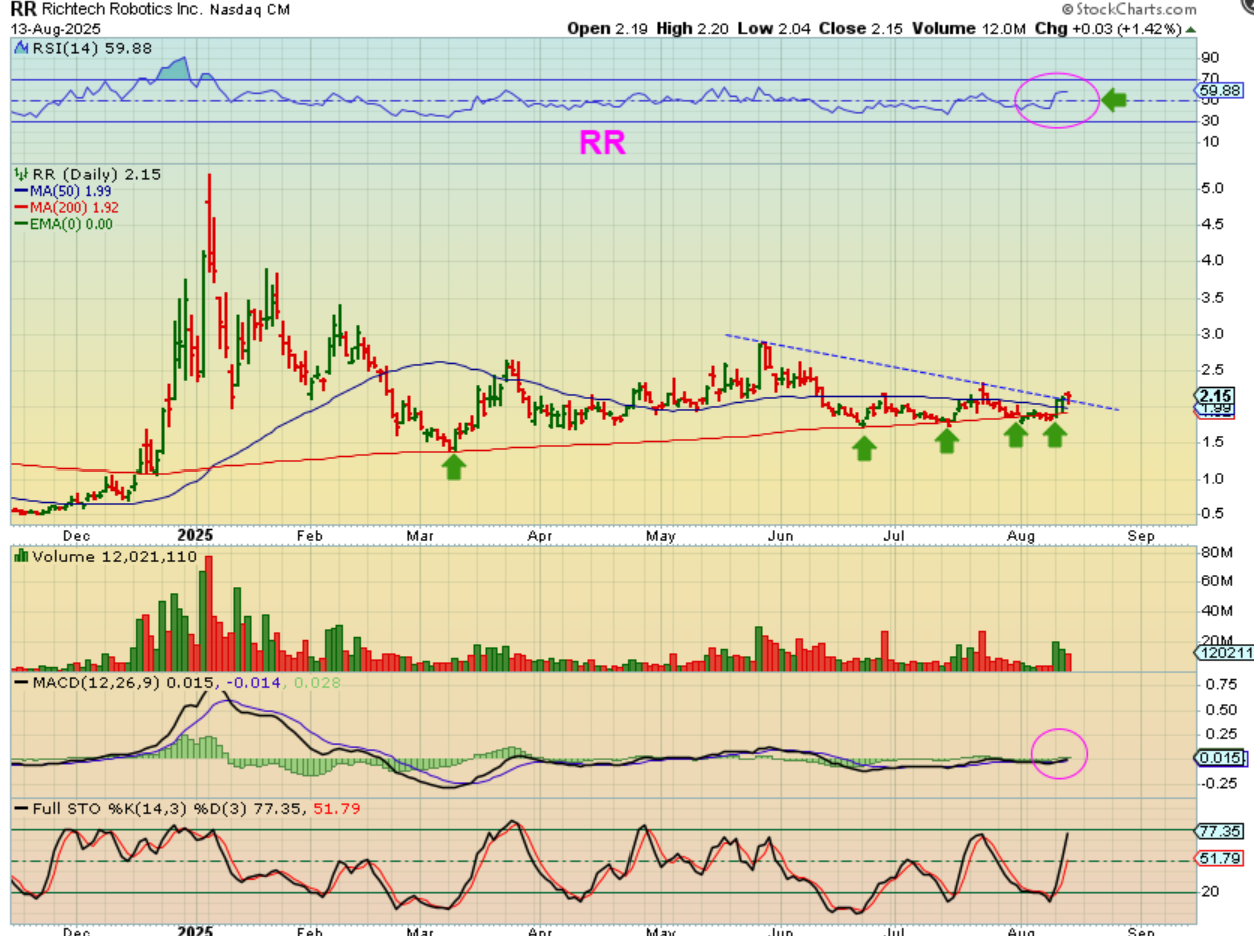
RR: I like bigger picture of RR as it has been riding along the 200 sma.
.
RR dropped and recovered on Wednesday and it seems to be breaking a downtrend line, so again, this set up does seem ready to go higher.
.
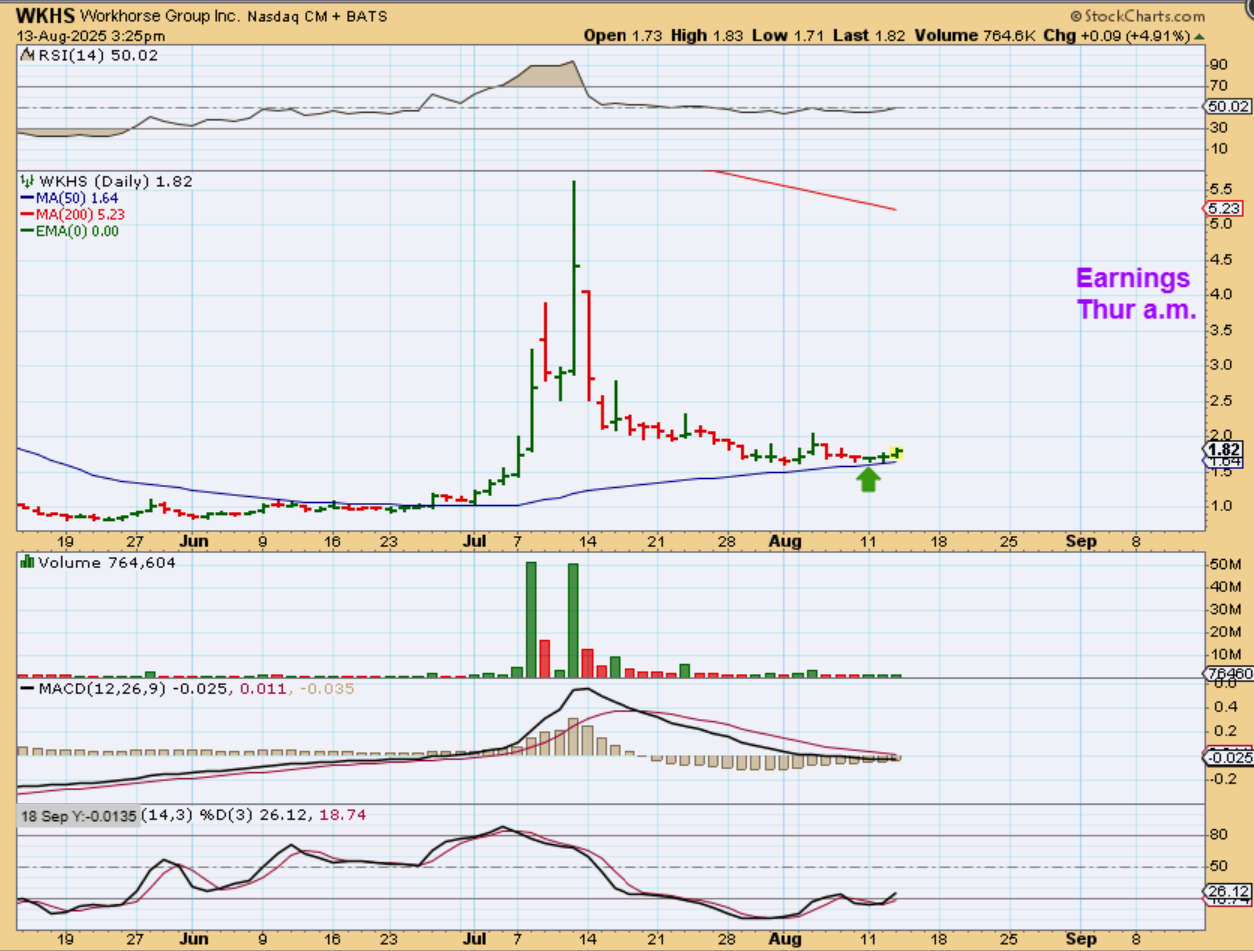
WKHS – I remember when WKHS ran from the $1 area to the $5 area in a month. I never chase these since they get too extended, because the drop can be costly. Instead, I put them on a watchlist and try to be patient. WKHS has now dropped all the way down to the 50sma and is back under $2. This set up looks excellent, HOWEVER, they release earnings on Thursday. I would have bought tis but I’m going to wait until they release their report and see how things go.
.
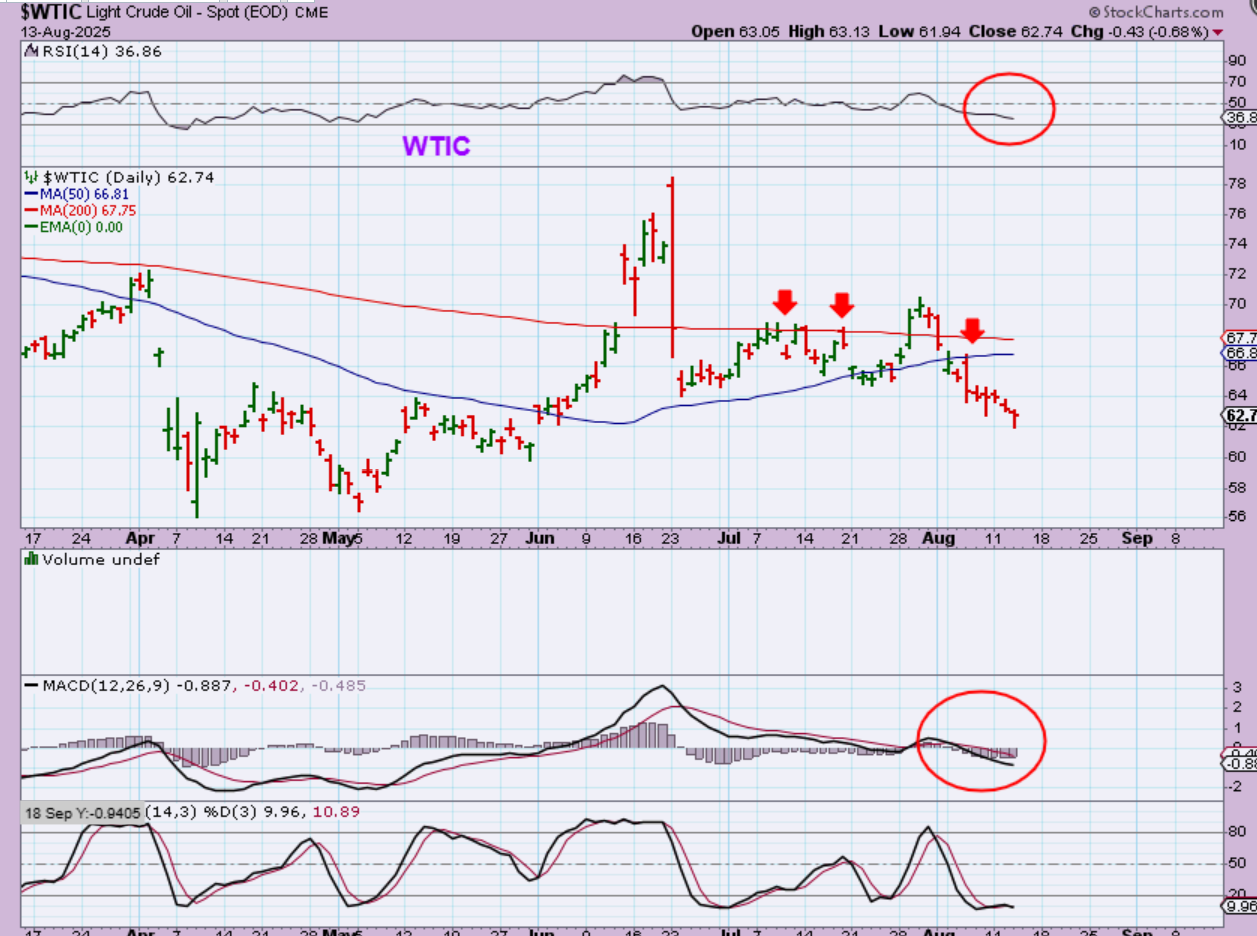
WTIC – Oil continues to drop and as it does, the RSI shows real weakness (RSI 36) and it seems like it is struggling to bounce. The rally was caused by the War in Iran, and that is hardly in the news anymore, so Oil may remain weak going forward if things don’t change geopolitically. Oil may bounce to the 50sma & 200sma and then chop around.
.
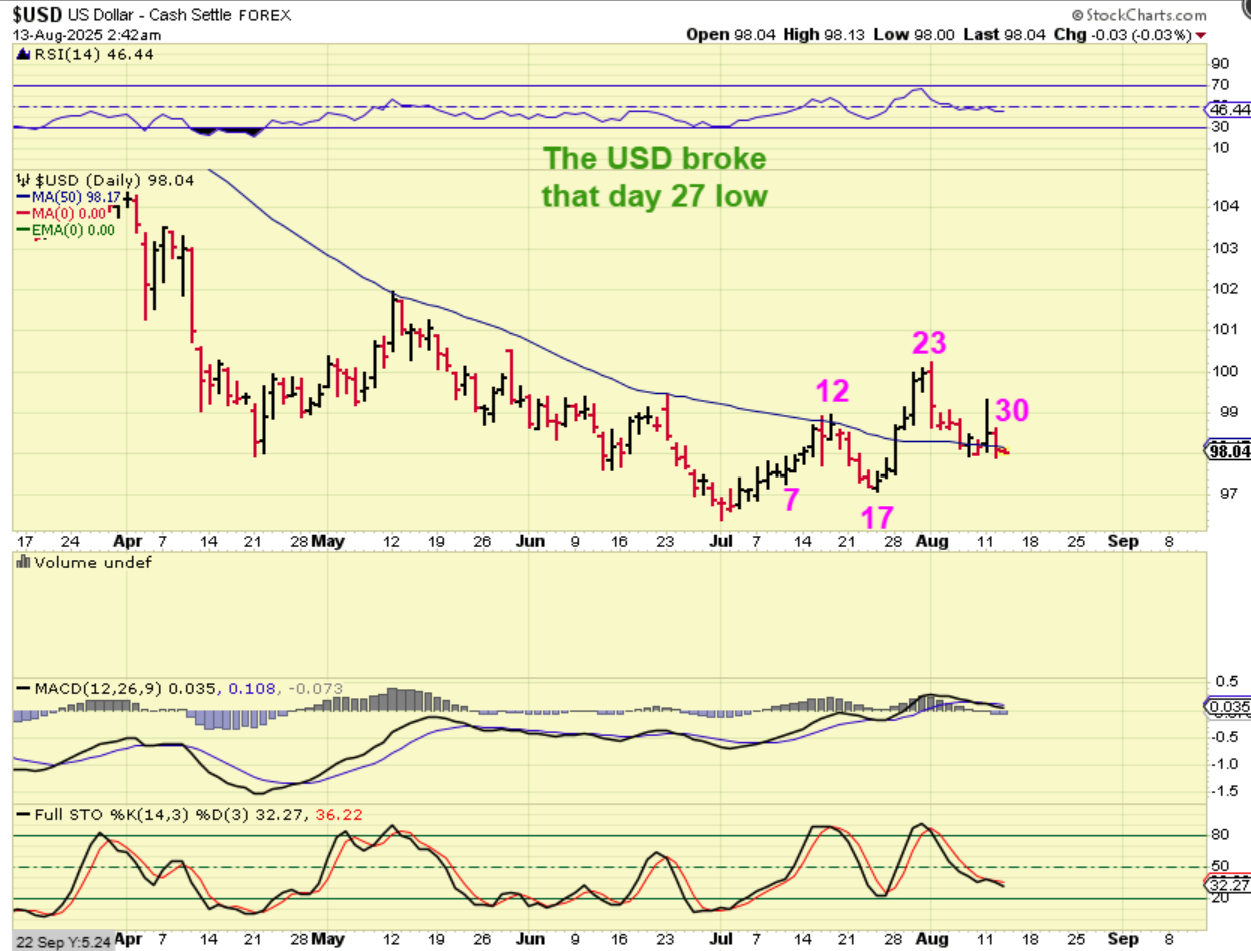
In yesterdays report I discussed the cycle counts:
USD – That day 27 was slightly broken on Tuesday, so that would extend this to day 30 – OR – it is possible that day 17 was a dcl? Lately, however, the daily cycles have been long. We still have a higher low and a higher high in place, but it keeps coming close to losing the 50sma.
.
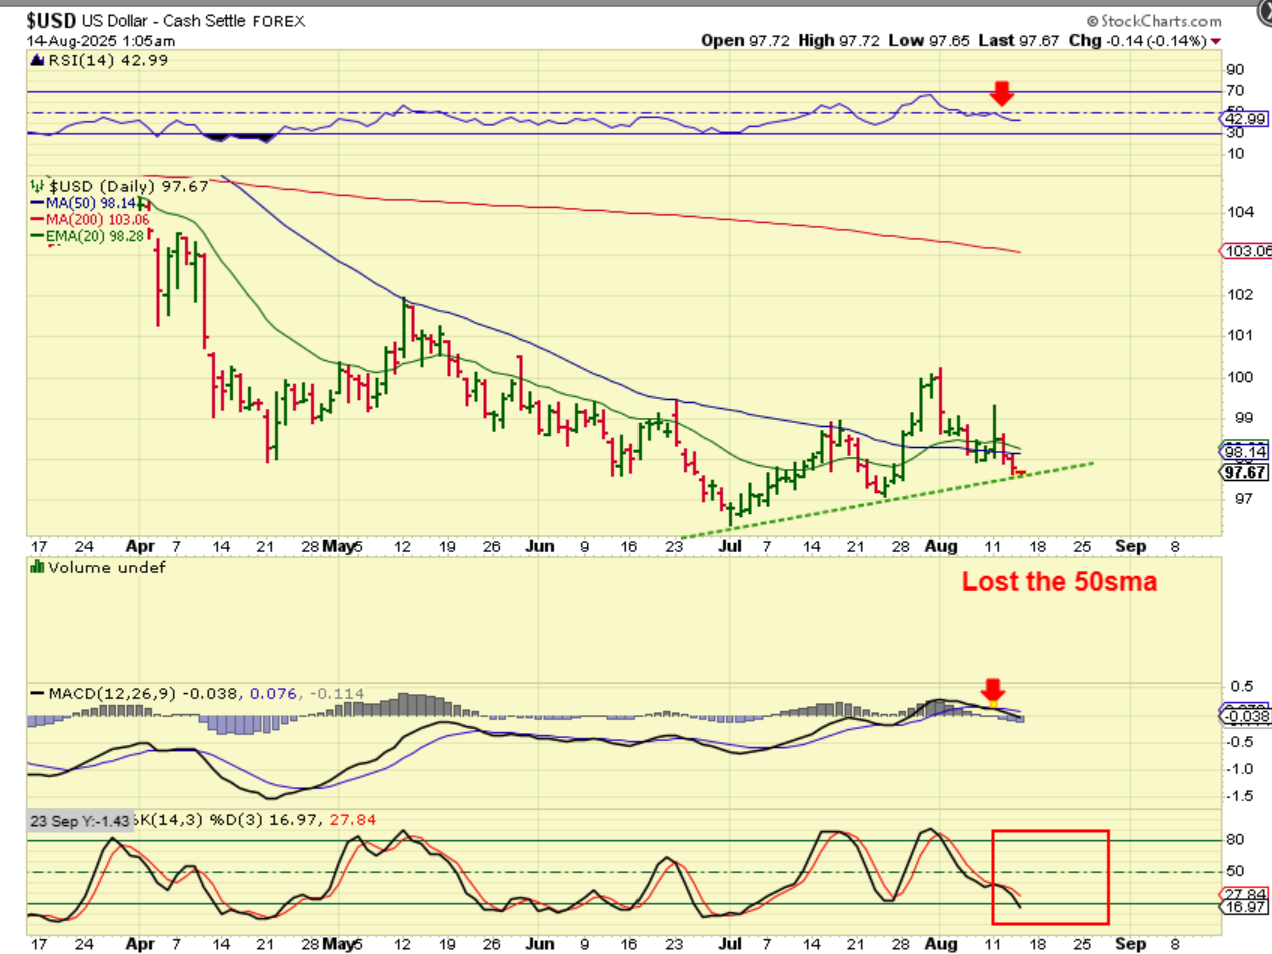
I expected the USD to hold up at the 50sma, but it didn’t. Now it has reached an uptrend line at day 30 (Or 14 of a 2nd daily cycle) and we’ll see if it finds support there. It is finally oversold again.
.
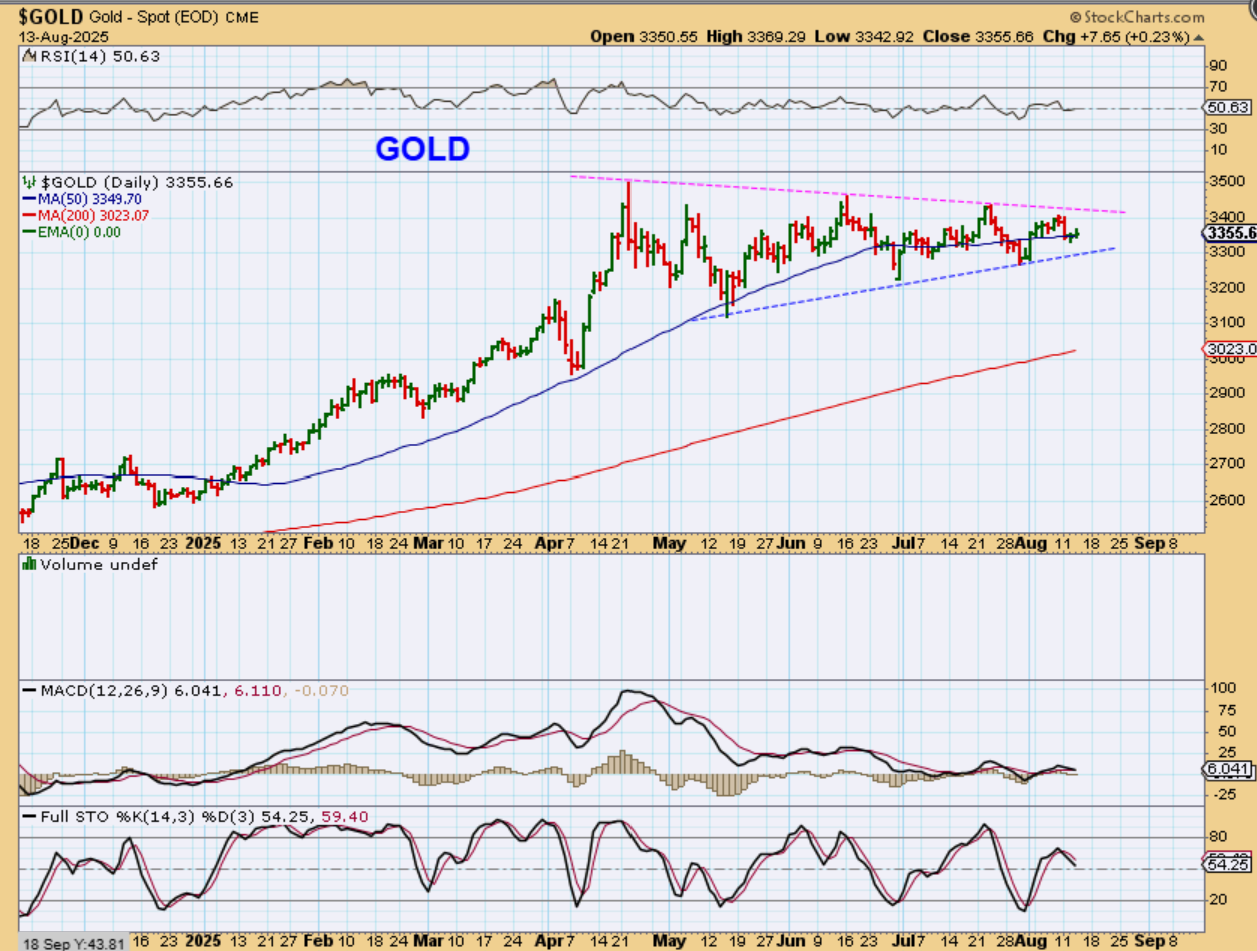
GOLD remains in a very large consolidation. The last 2 days have been very small moves, but todays inflation numbers may help to give it a push in 1 direction or the other.
.
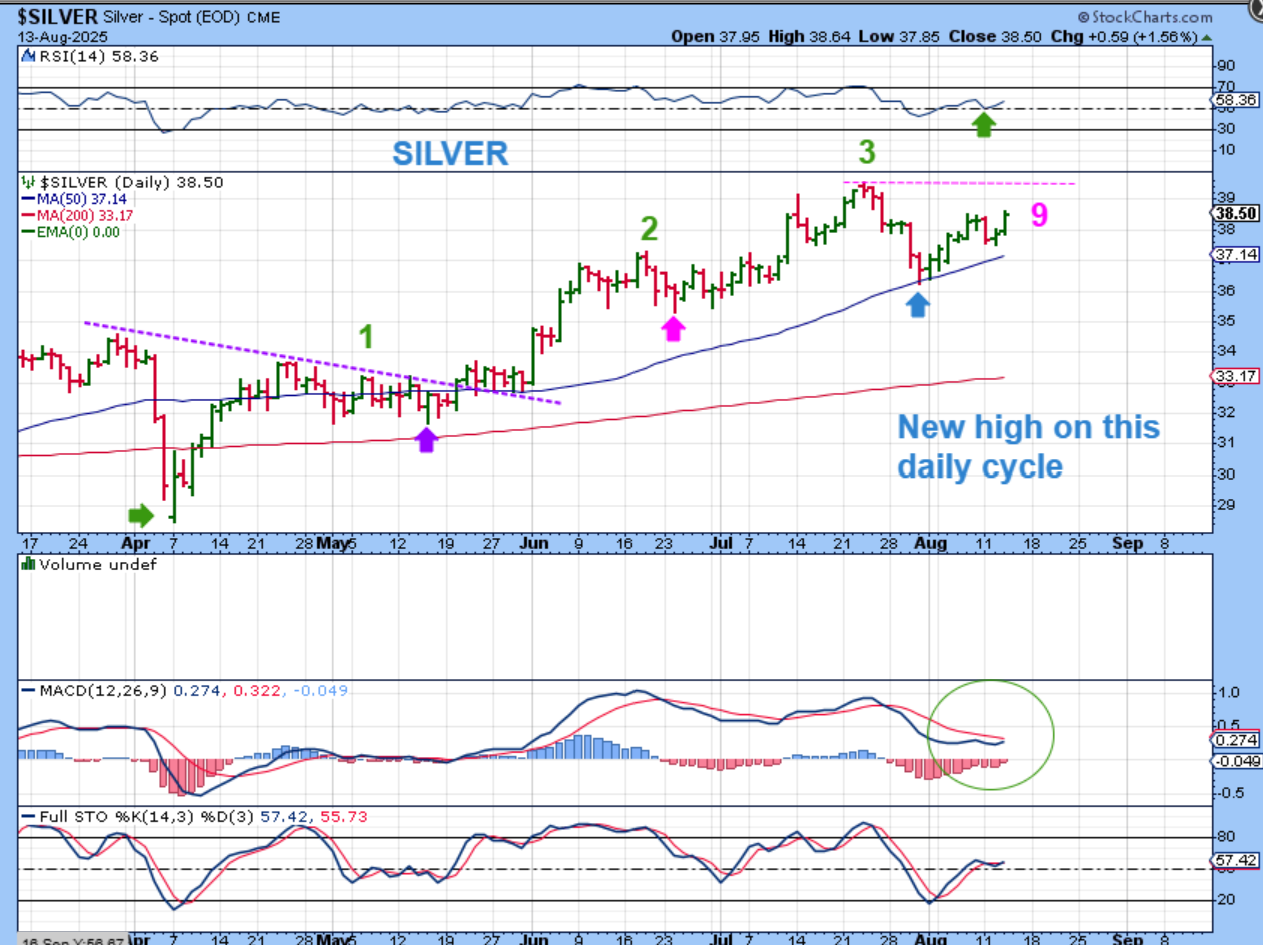
SILVER actually made a new daily cycle high on day 9. If it crosses daily cycle #3’s high, that would be a big sign of strength. Even though we are 4 months out of the ICL, I see bullishness and strength when I look at the MACD curling up and the RSI bouncing at the 50% line, this really looks bullish to me.
.
IMPORTANT TO ME:
I always look for similarities and differences to gauge strength, weakness,’ odd happenings’, etc. We are already seeing a very long triangle consolidation with Gold, because it refuses to sell off. Now let me show you something with Silver now.
.
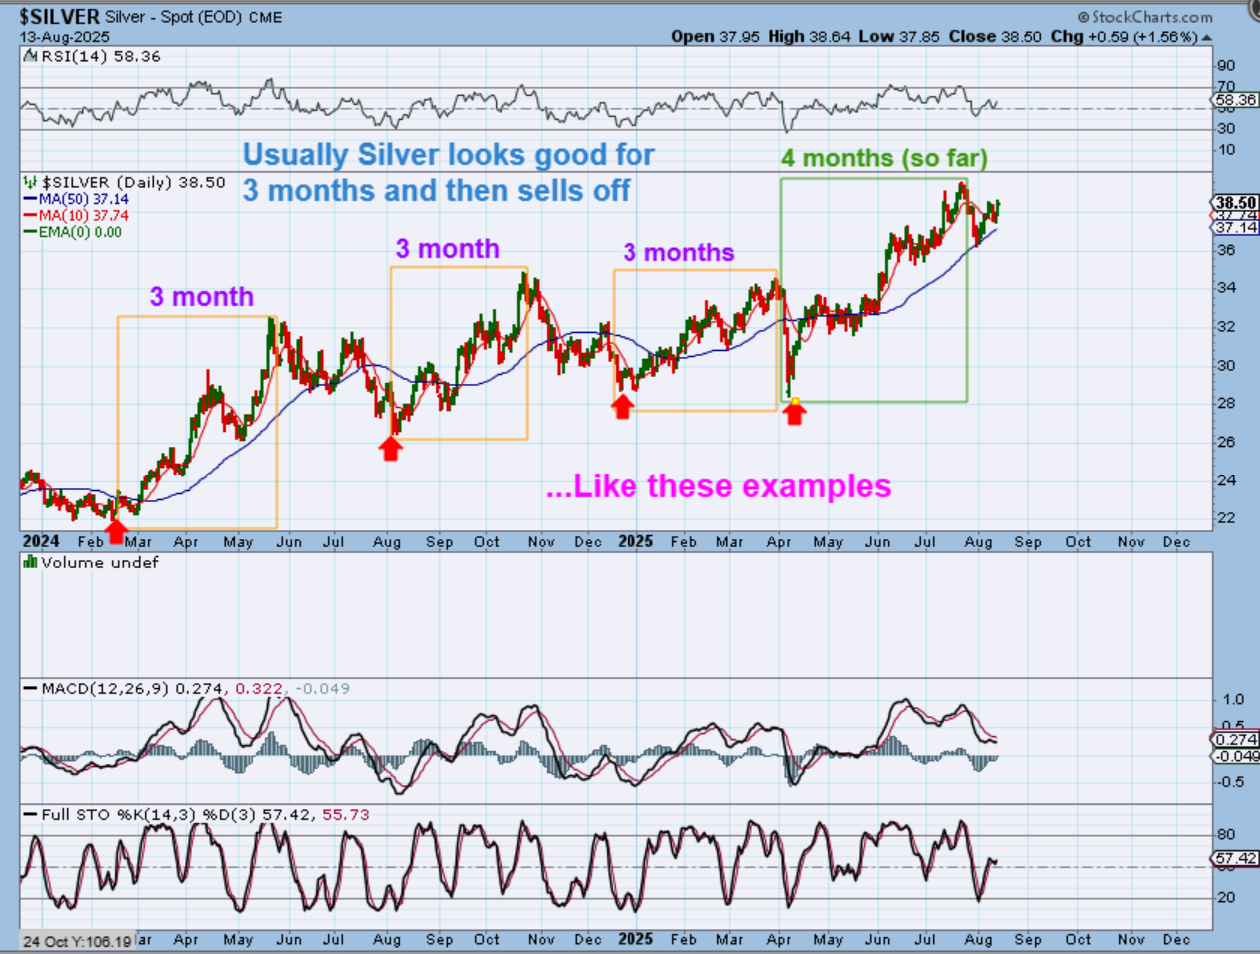
SILVER – Using Cycles, we see 3 strong daily cycles higher or 3 months higher ICL to the ‘peak’. Silver then weakens and starts to drop into an ICL from there. See the chart. We also see a ‘double top’ in the MACD at those peaks. We do have that MACD double top, but we also now already have a peak on month 4 and that is strength. Running higher now would really be different if that ‘peak’ is taken out. This is why I would have to anticipate a drop in Silver vs a rally, but we’ll see how this plays out.
.
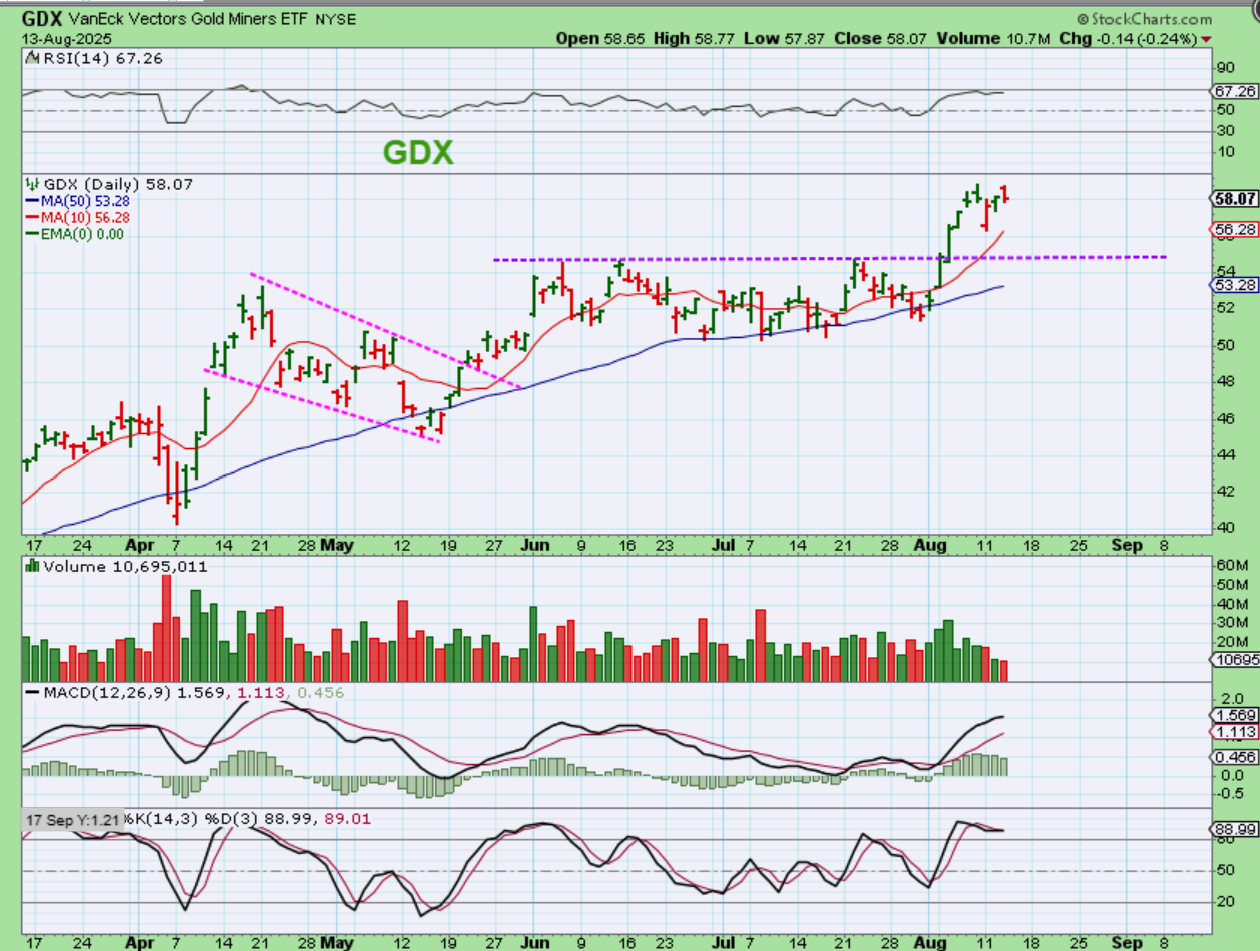
GDX -And the Miners have been strong following that long consolidation too, so this sector is seeing additional strength in 2025, but it seems likely that we’d see a dip sooner than later. If we don’t, then we have seen a big change going forward.
.
So todays morning data is inflationary, it often is viewed as a gauge as to whether or not we will see a rate cut soon, and THAT moves the markets. We’ll see what happens pre-market at 8:30 a.m. to the futures. Enjoy your Thursday trading.
.
~ALEX
.
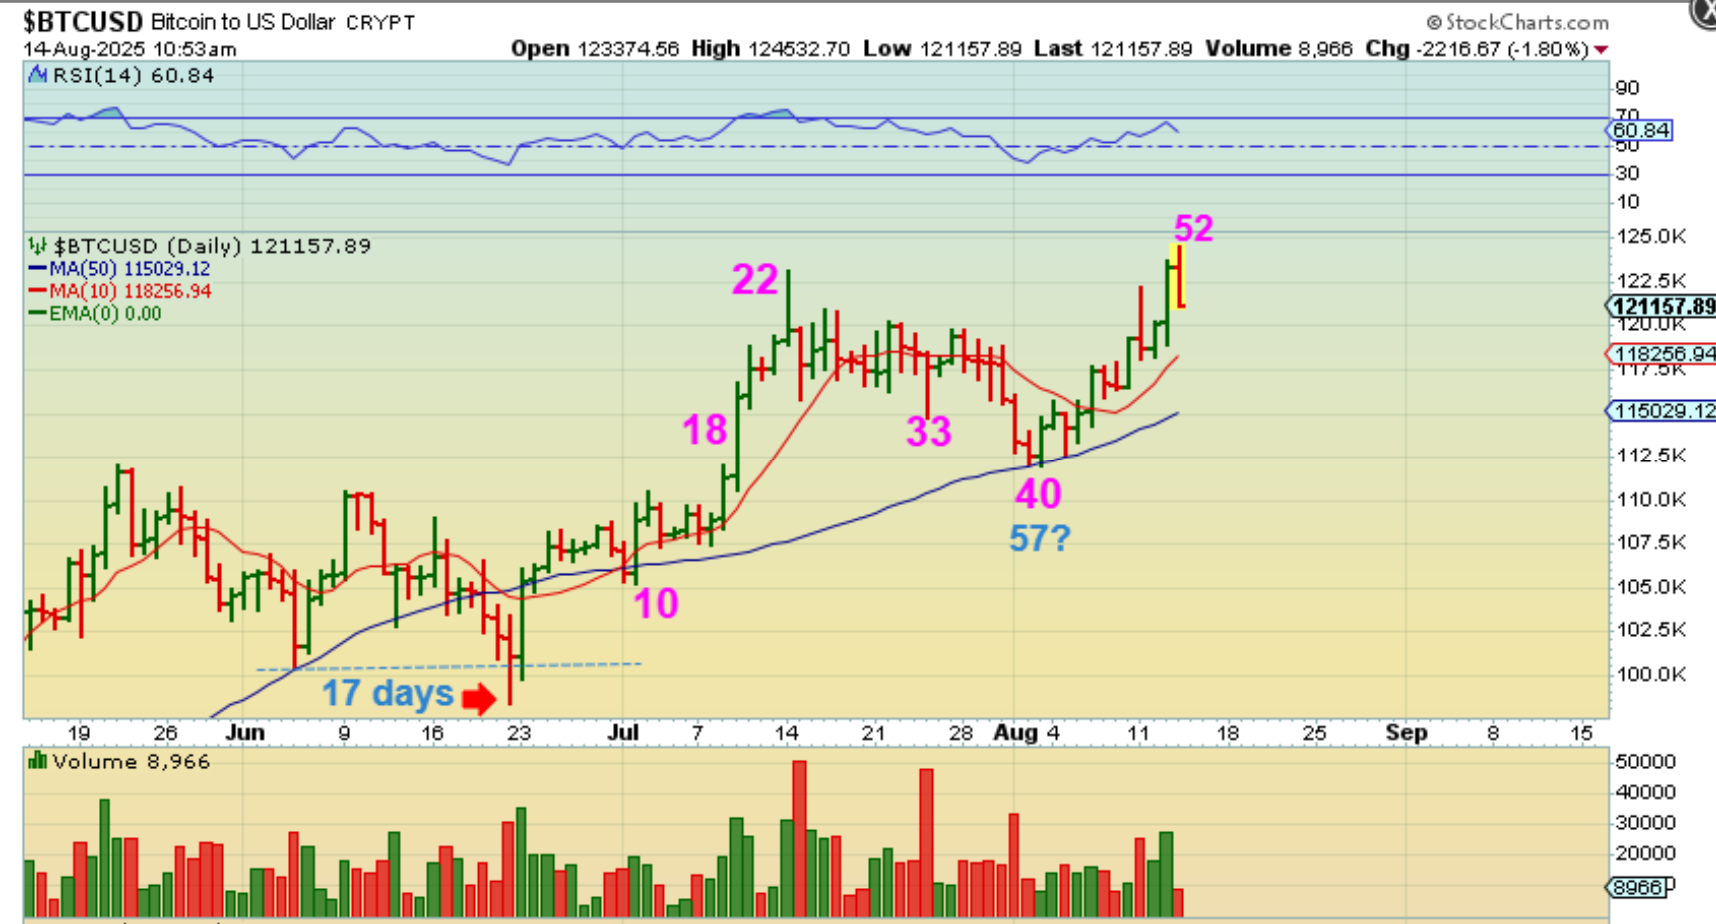
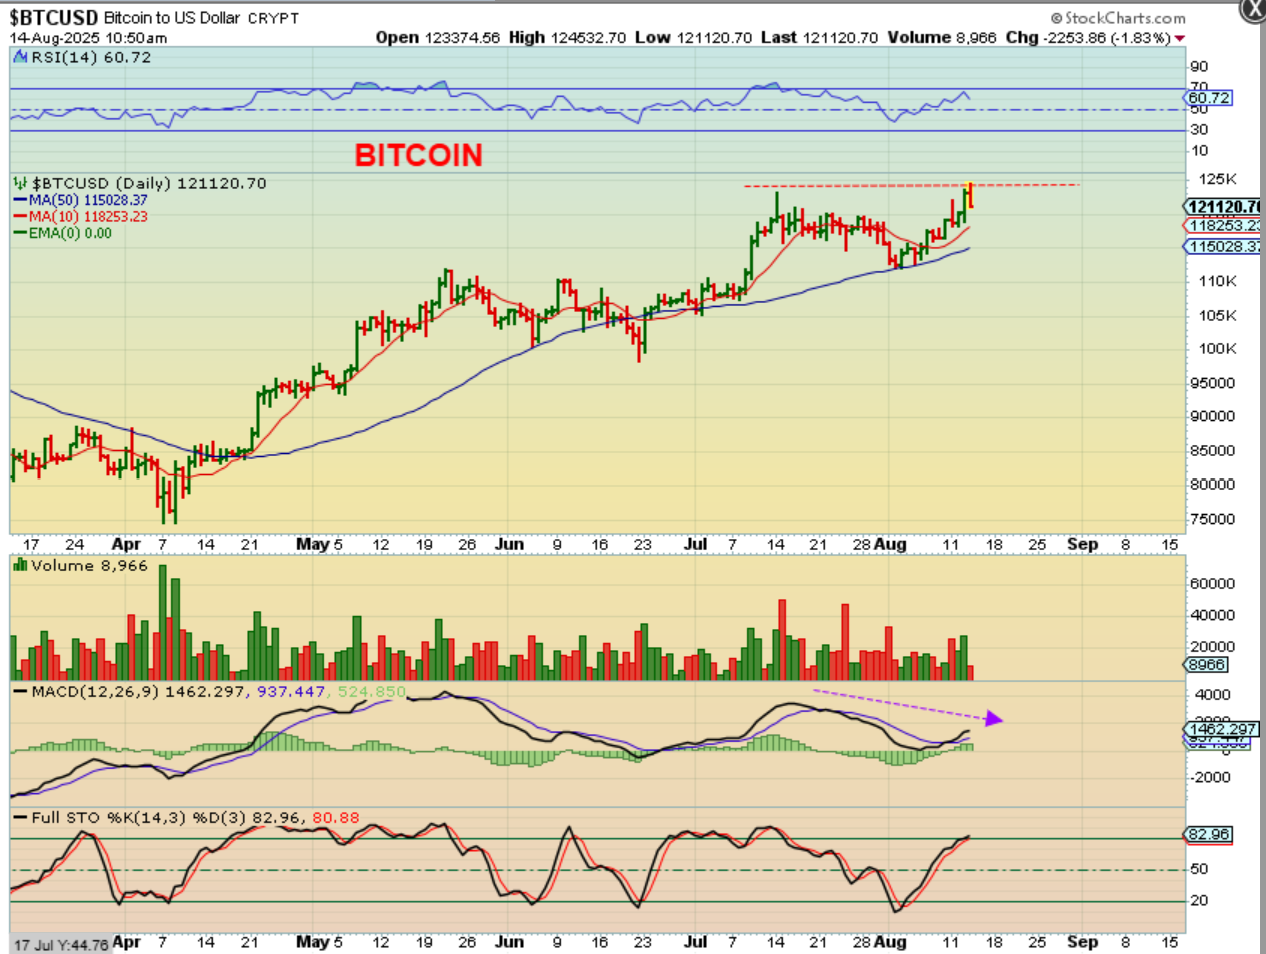
Bitcoin Live: Bitcoin is dropping this morning after making a slight new high.
.
Bitcoin Cycle Counts: You may recall that the low in early June was day 59 and seemed like the dcl. It was then quickly undercut 17 days later, so do we start the count for the low there? Or was it a shakeout fluke? Well,
1. If we count from the early June low, we bottomed on day 57 and this would only be a new high on day 12.
2. If we count from that undercut low as The Low, we would be on day 52 and due for dip into day 60, so todays reversal dip would have some follow through as a short term double top.