
August 2 Weekend Report
As we start the weekend report I’ll just say that in this bull run, we have seen many Knee jerk reactions followed by bullish buying in the past. The Fridays jobs report sent the markets lower, but I had just posted a report BEFORE THAT calling for a possible dip into a dcl, so this may just be that dip into a dcl, and a knee-jerk reaction. Let’s go to the charts…
.
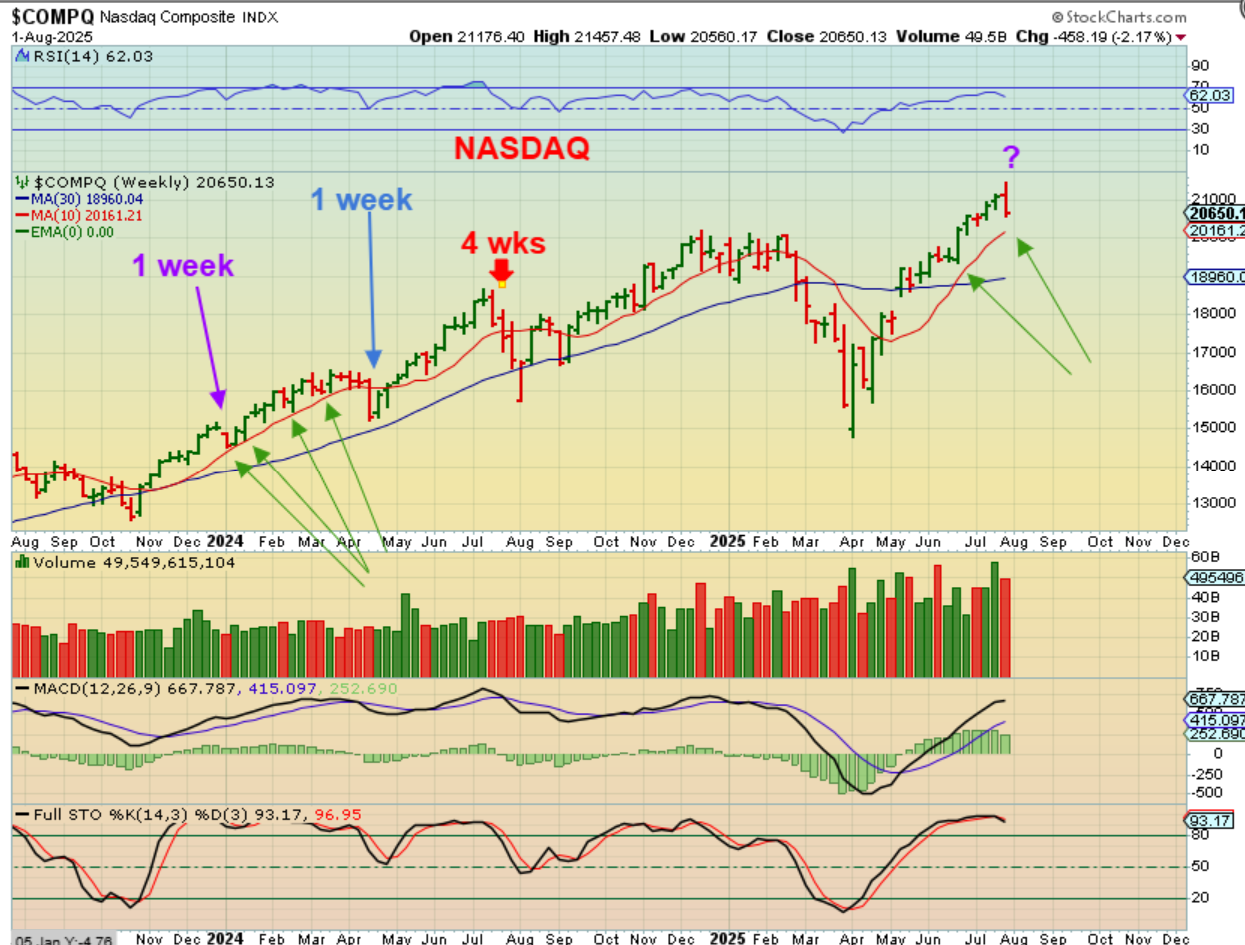
NASDAQ WEEKLY – Starting with a weekly chart we see a new high was made earlier in the week, and then a reversal lower (jobs report Friday) dropped the price to down 2.17% for the week. Look at the chart and notice that we have seen sharp 1 week drops in the past too, so this may just be a dip into a dcl and then bulls resume control. We’ll just have to watch and see how things play out. The prior run tagged the red 10 week ma, so we may even drop further…
.
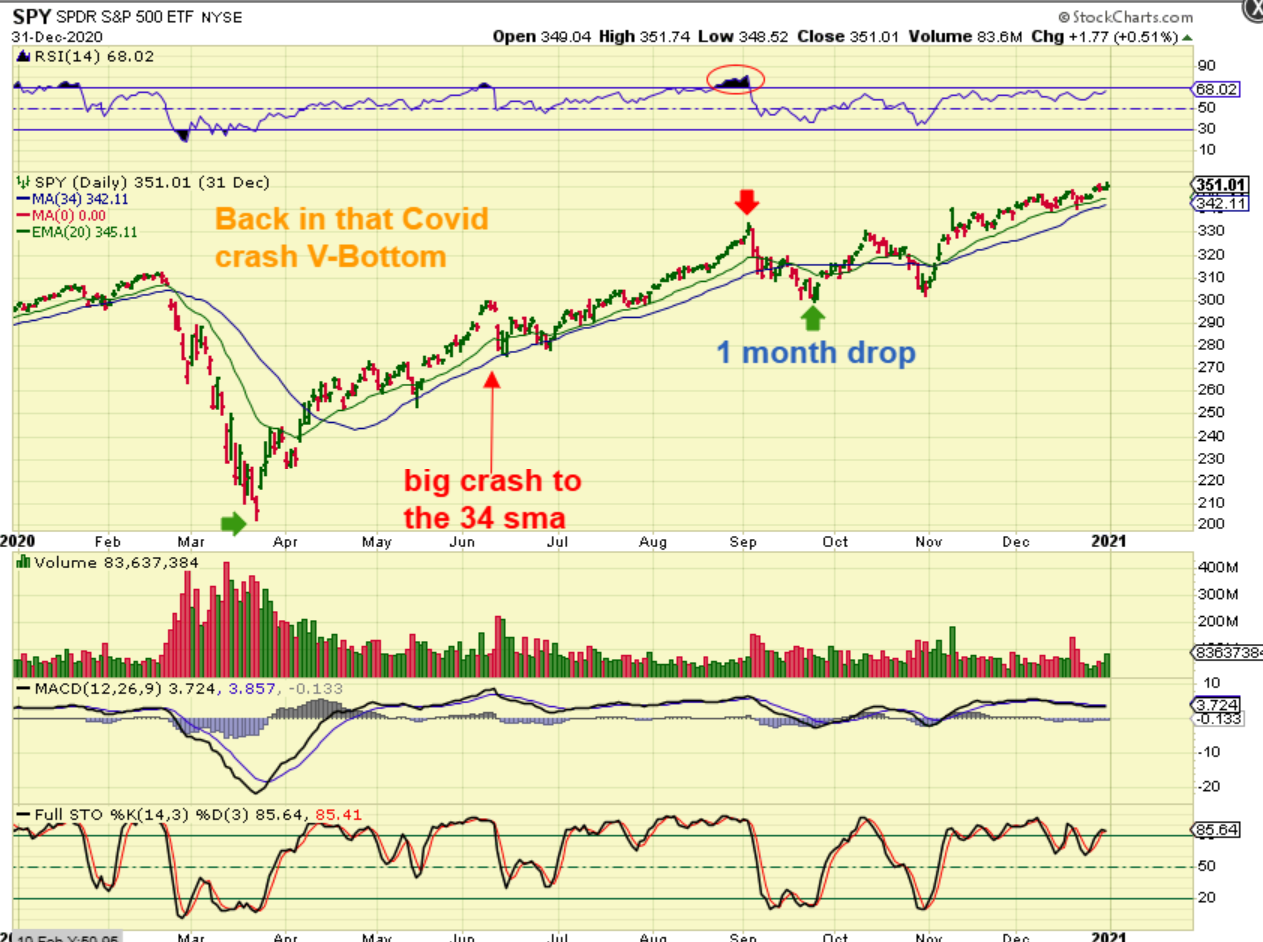
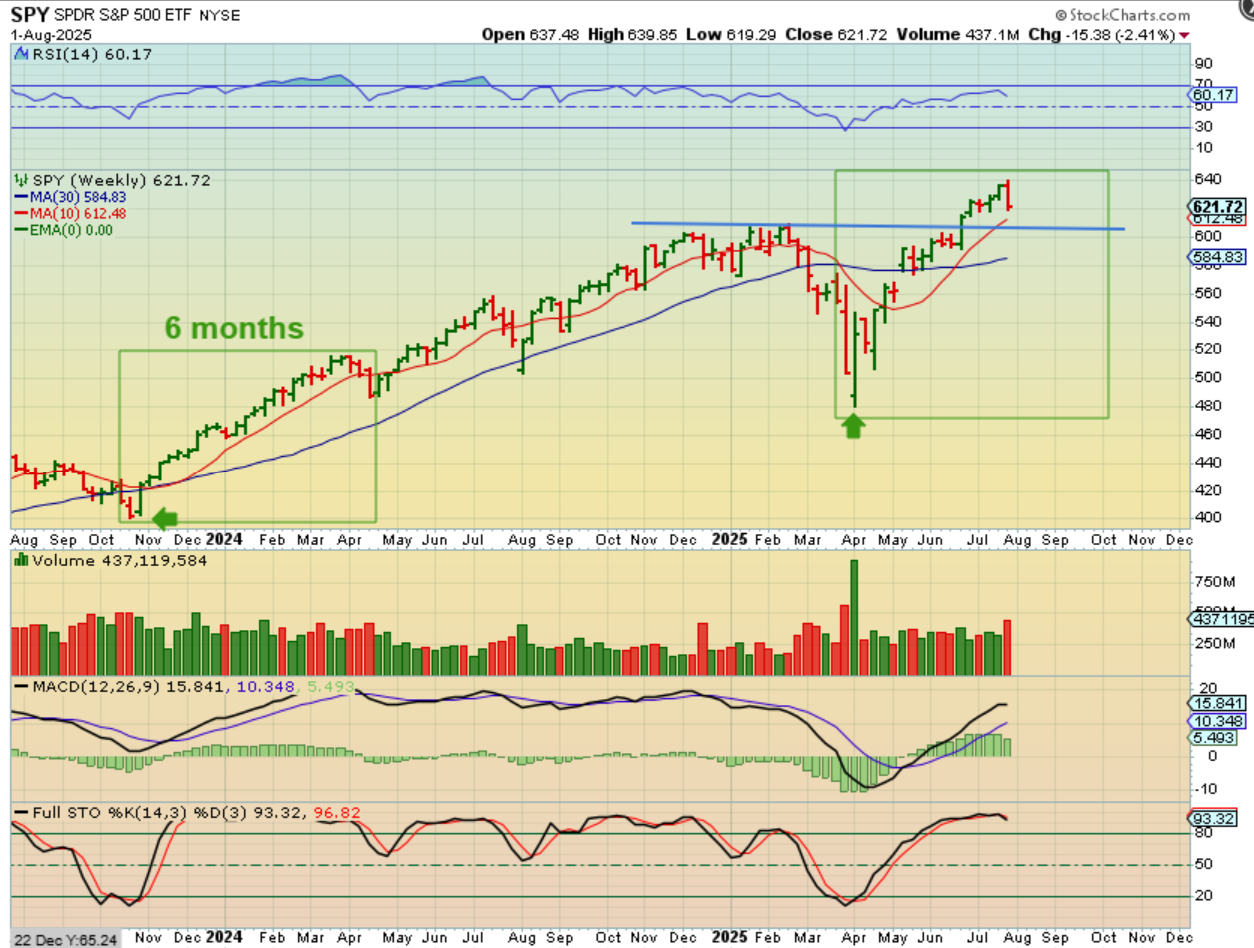
2020 Covid crash & Recovery: This is the SPY Daily Chart – We had big slam downs on the way higher in 2020 too, but shortly after that drop the bulls came in and bought the dips. Notice that 1 big crash to the 34 sma, 3 months after the ICL.
.
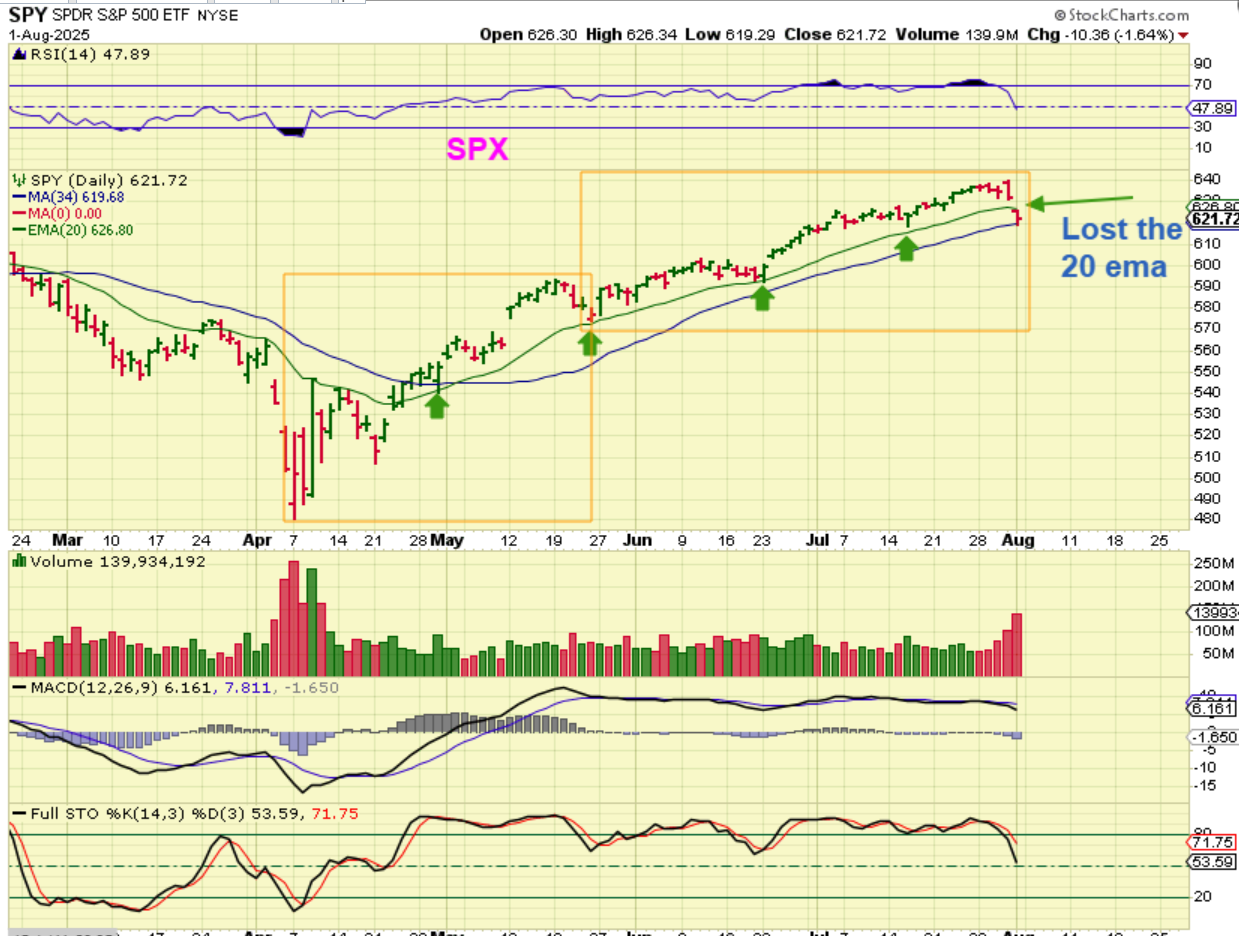
SPY DAILY -Here we are roughly 3 months out of the ICL and we also have a drop to the 34 sma. We just need to see what next week brings to know if the selling is reacting fearfully to an economic pullback or just a knee jerk reaction.
.
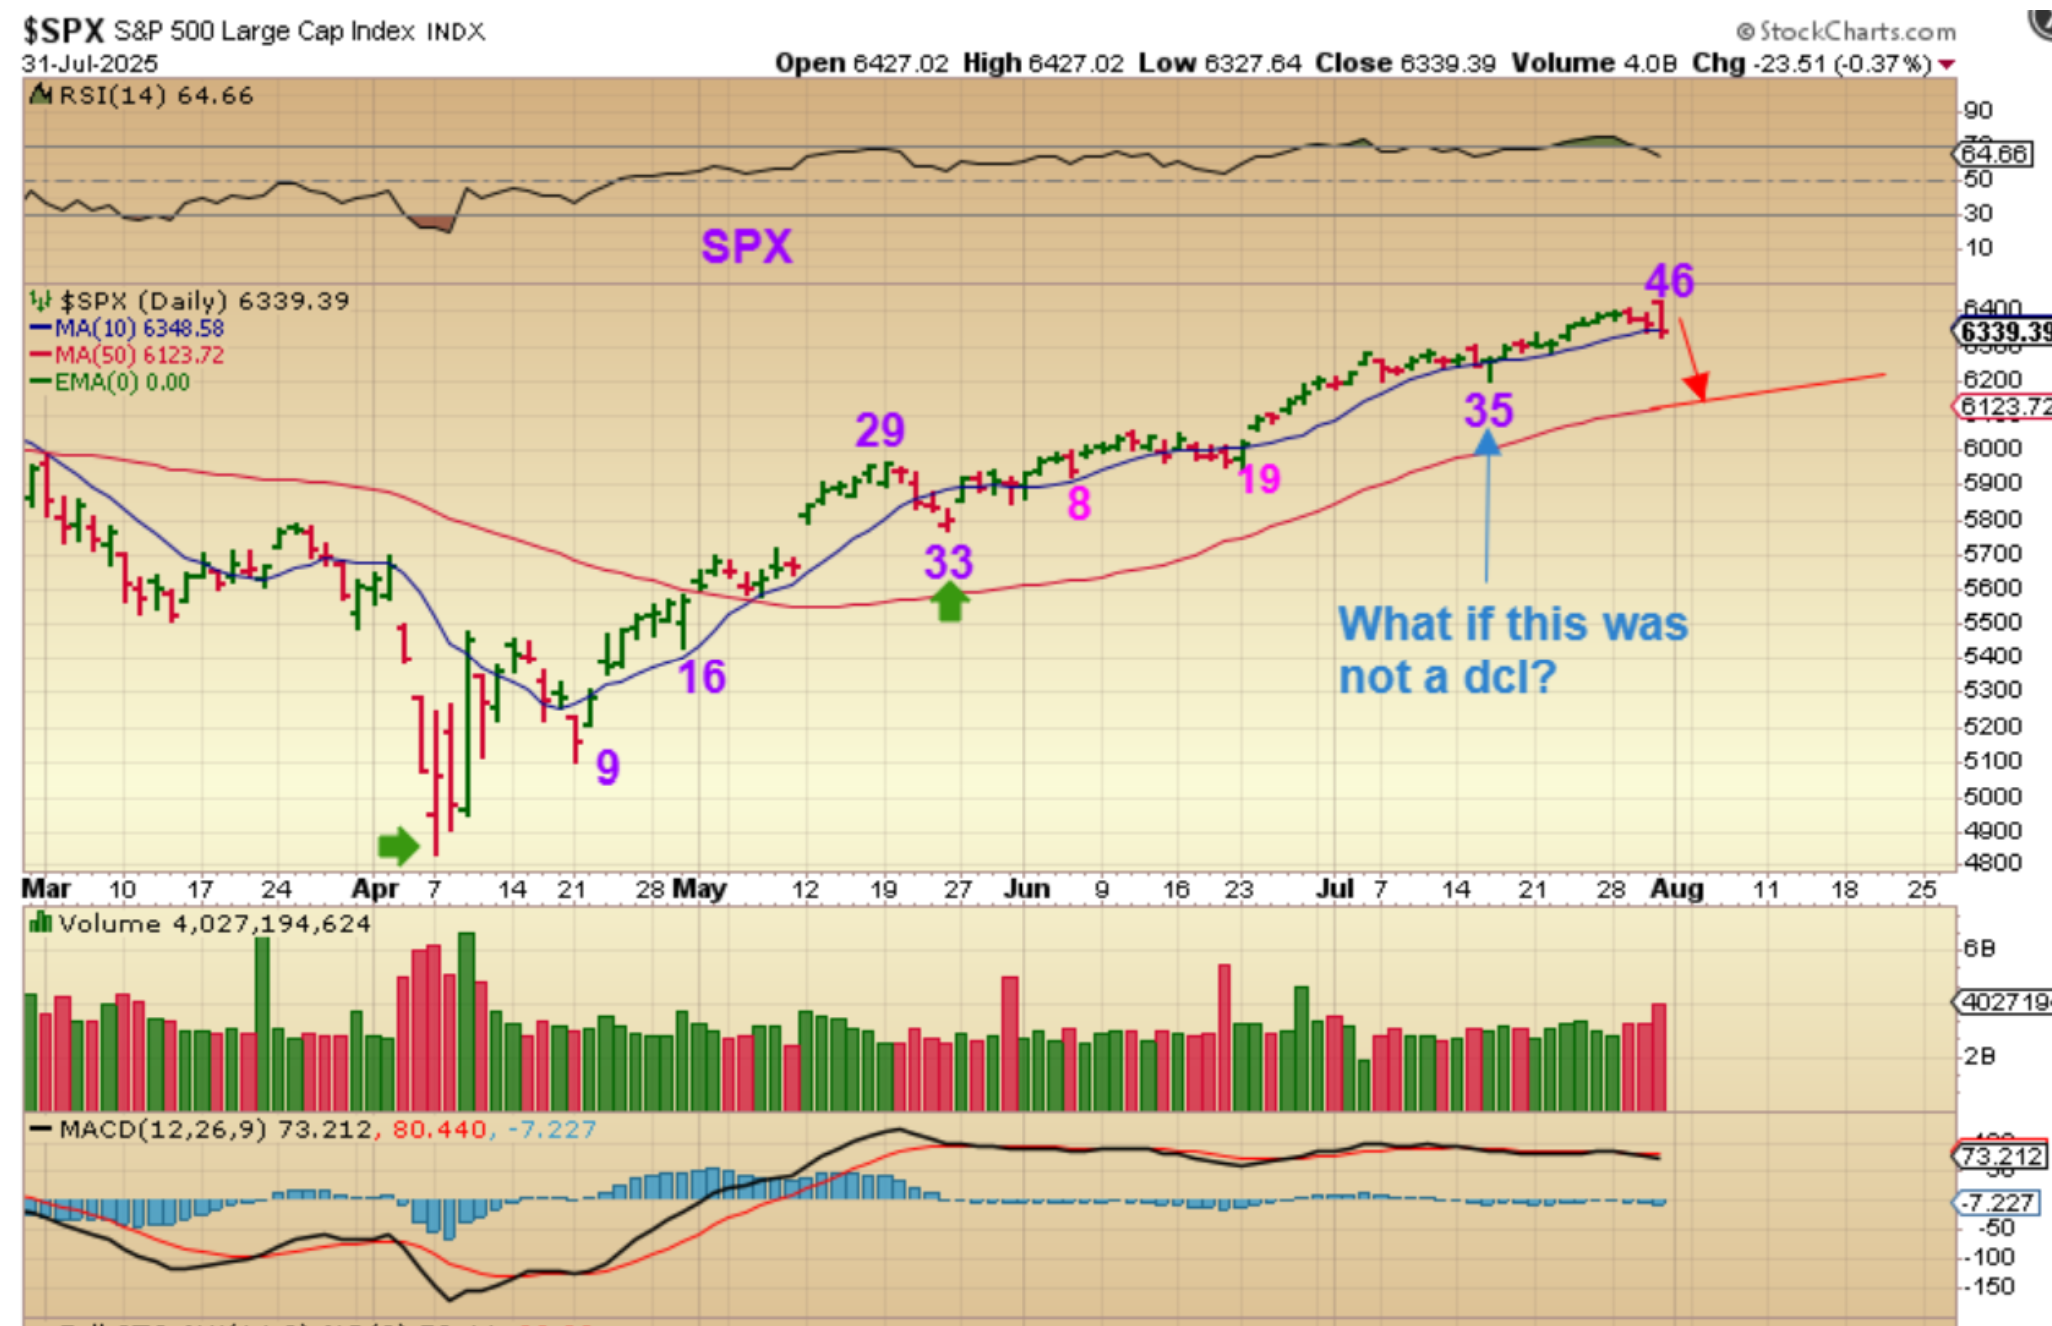
SPX DAILY – In Fridays report I mentioned that we could drop further to fulfill a longer daily cycle, so Friday could be day 47 and we have had 50+ day ‘daily cycles’ in the past too.
..
What about the 2023-2024 Bull Run? What can we learn from that time period?
.
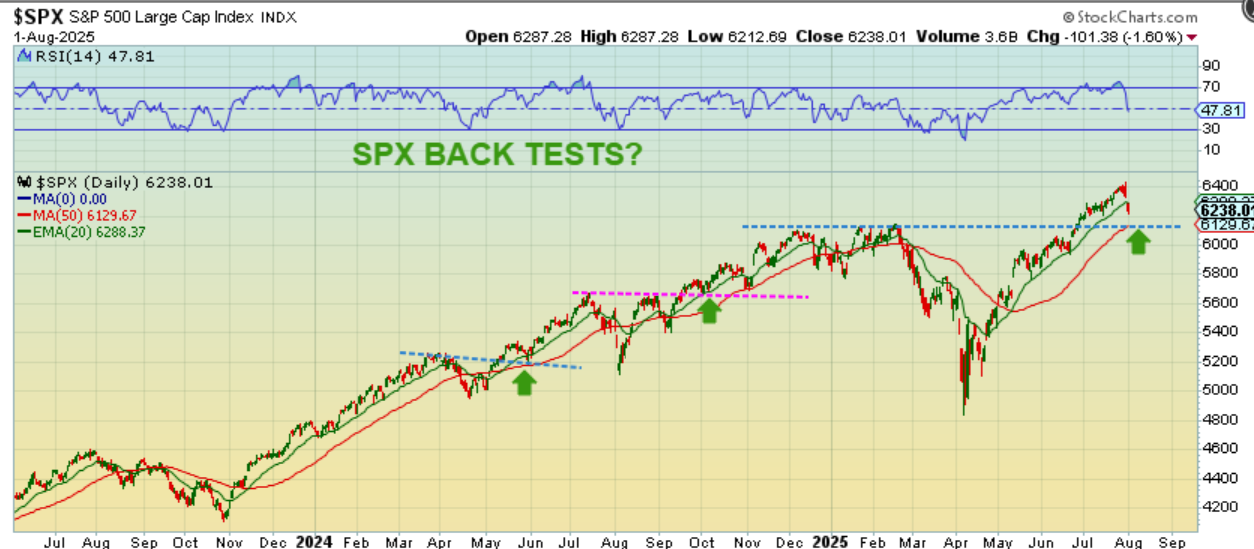
SPX DAILY – We see a new breakout to new highs that often eventually dropped and back tested that breakout. I have even called for that in past reports and now we are almost at the breakout/back-test area, which lines up with the red 50sma. That is another area to keep an eye on if we continue to sell off lower.
.
SAME CHART: I just want us to glance at this chart again and see that this looks very similar to past rallies that back tested the breakout. They often landed on the red 50sma too. This doesn’t look out of the ordinary at this point.
.
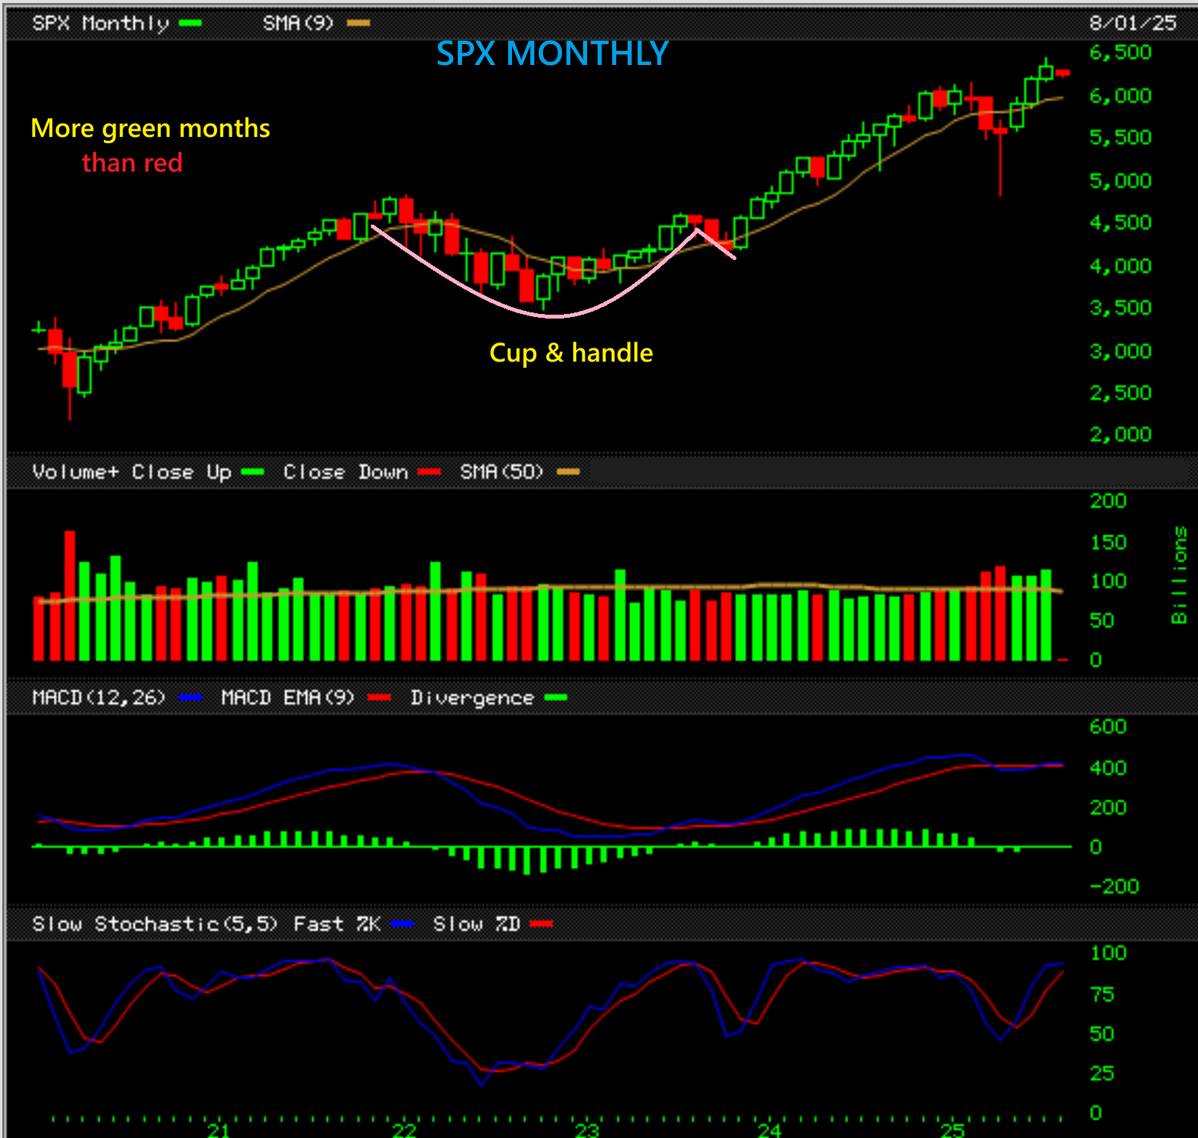
SPX MONTHLY – What can we say about the Monthly chart other than I see more green months following an ICL than I do red. We are starting to see a red August candle, but by the end of the month we might put in a dcl and turn this one to Green too, we just don’t know at this point.
.
SPX WEEKLY – The weekly hasn’t even tagged the 10 week ma, and that is often viewed as bullish price action in a bull run when it does, so at this point we may be dipping into a dcl and then continue higher.
..
Conclusion: Fridays sharp drop MIGHT be a peak for this daily cycle, but that doesn’t mean that we just crash from here. We could chop around, and we could even still make another peak in the next daily cycle-we just don’t know, because in the past, we have had a 1,2, or 3 day drop and then the rally resumes. That was seen in the COVID charts above and the 2023 charts too.
.
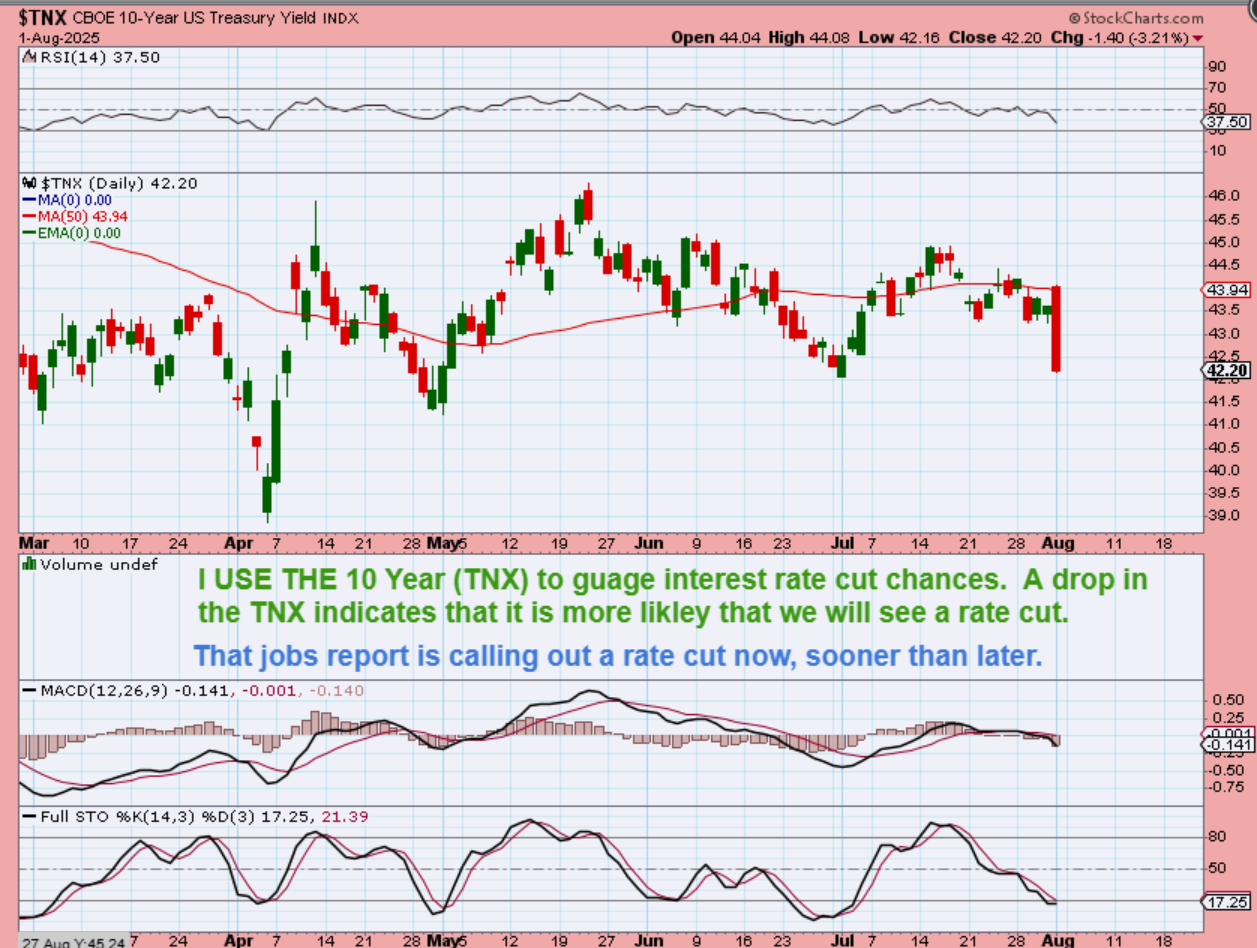
TNX 10 yr treasury: I don’t usually post this chart, but I do follow it every week and sometimes more often. That was a fast drop after the Jobs Report was released. Please read the implications on the chart.
..
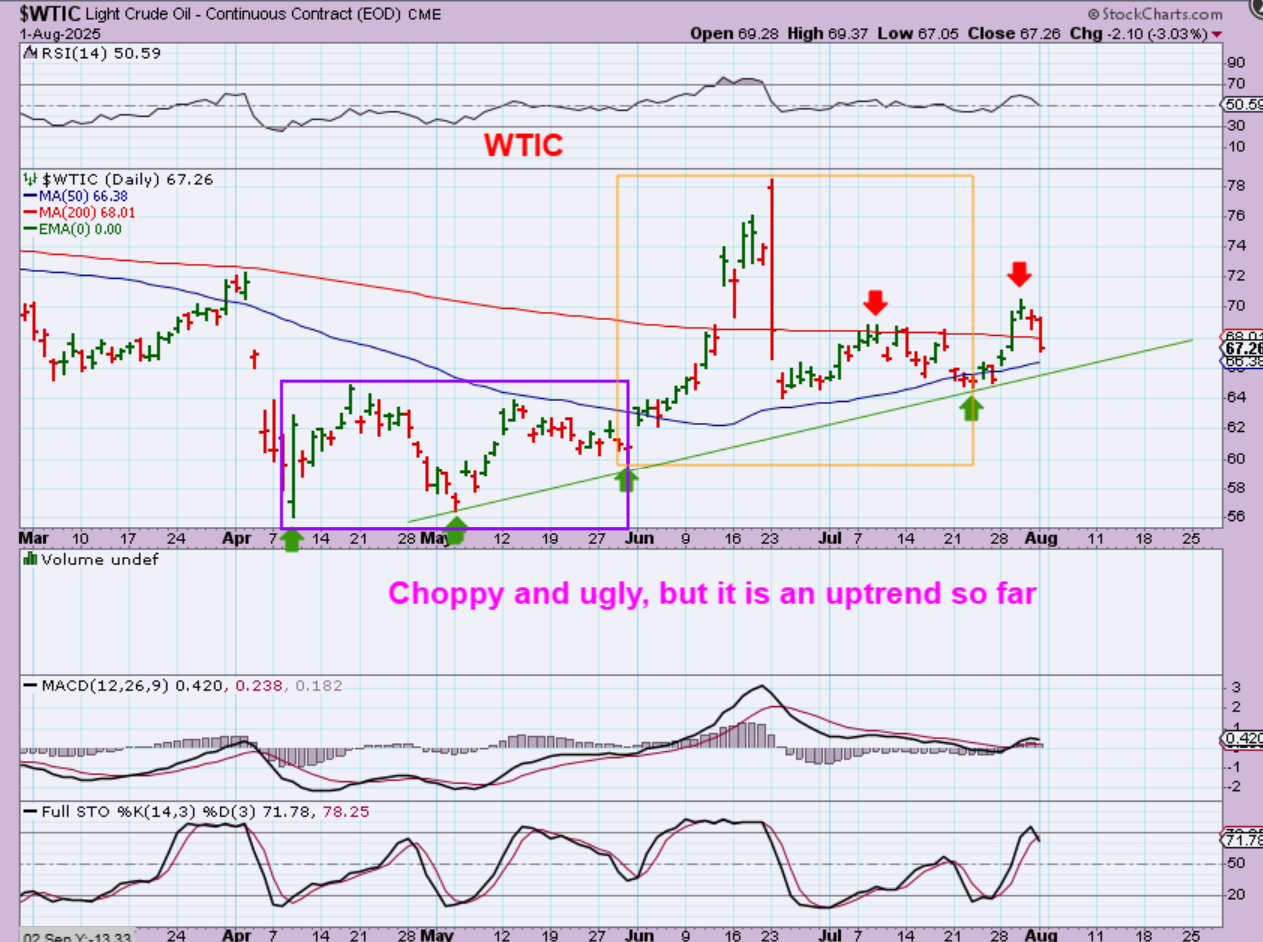
OIL DAILY – Oil sold off and Oil remains choppy. It has a bullish set up, but it is so choppy that it makes it unpleasant to trade. Notice the green uptrend line though.
.
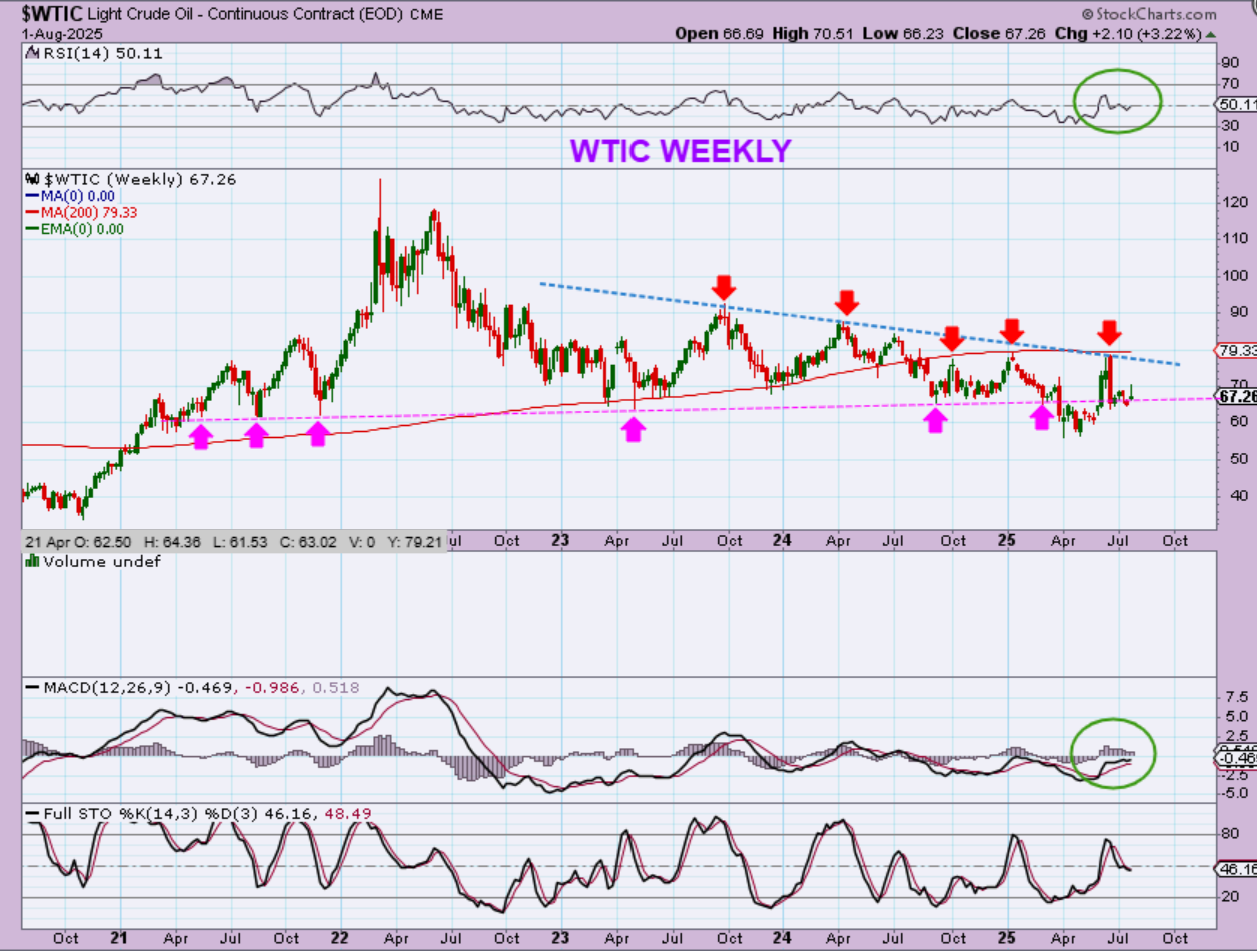
WTIC WEEKLY – We revisit the breakdown of years of support, the sideways chop, and then the sharp recovery when the war with IRAN escalated. At this point that recovery is holding on, but it is barely holding on. Oil need more upside price action to continue the bullish recovery (shakeout).
.
I thought that it is interesting to see where the POP Higher stopped in the big picture too, right? That blue downtrend line lines up with the 200 week ma, and price was capped there for now. I’m still amazed when I see how well the charts capture price movement. Oil is pinched between support and resistance again.
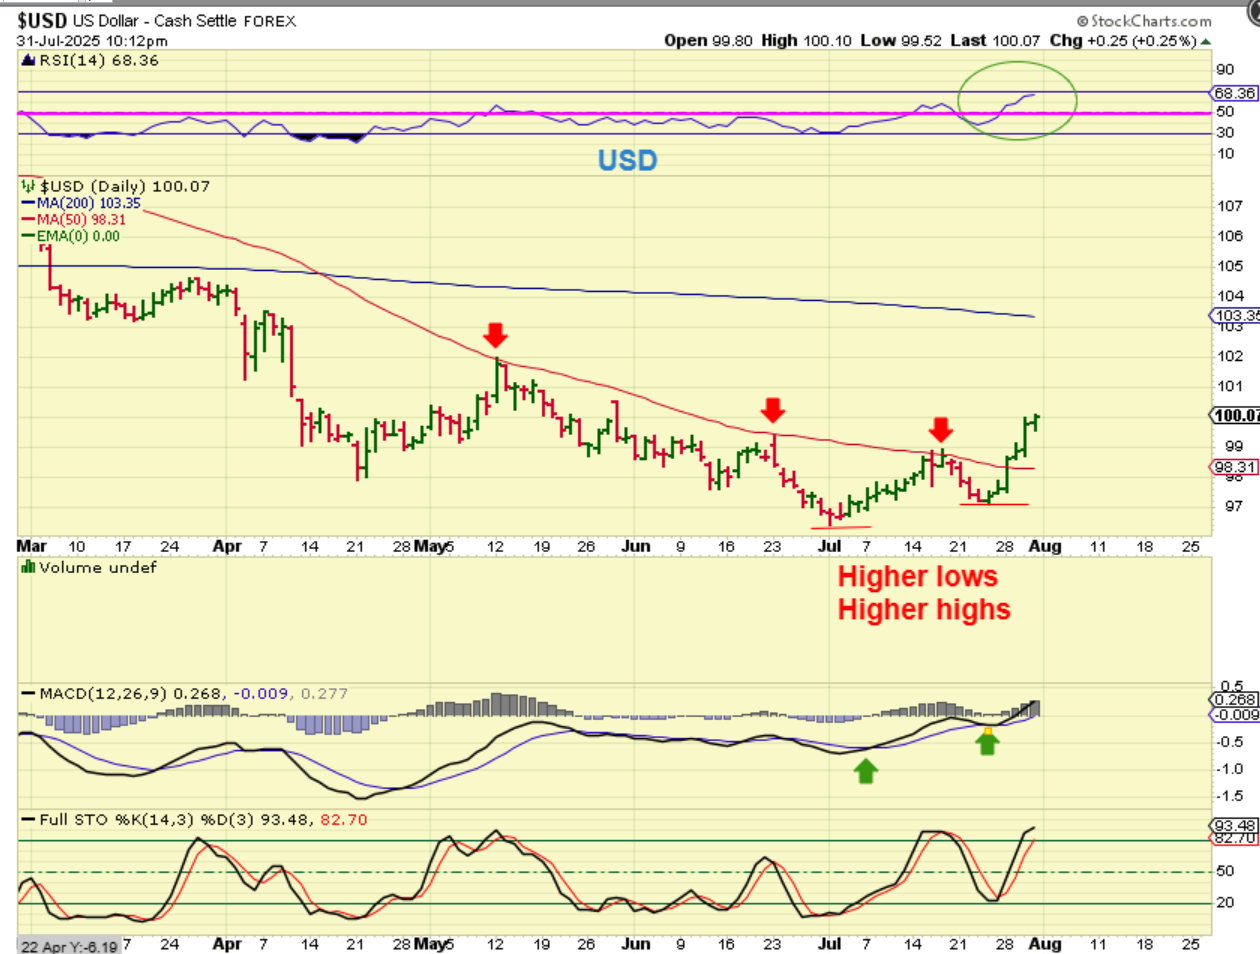
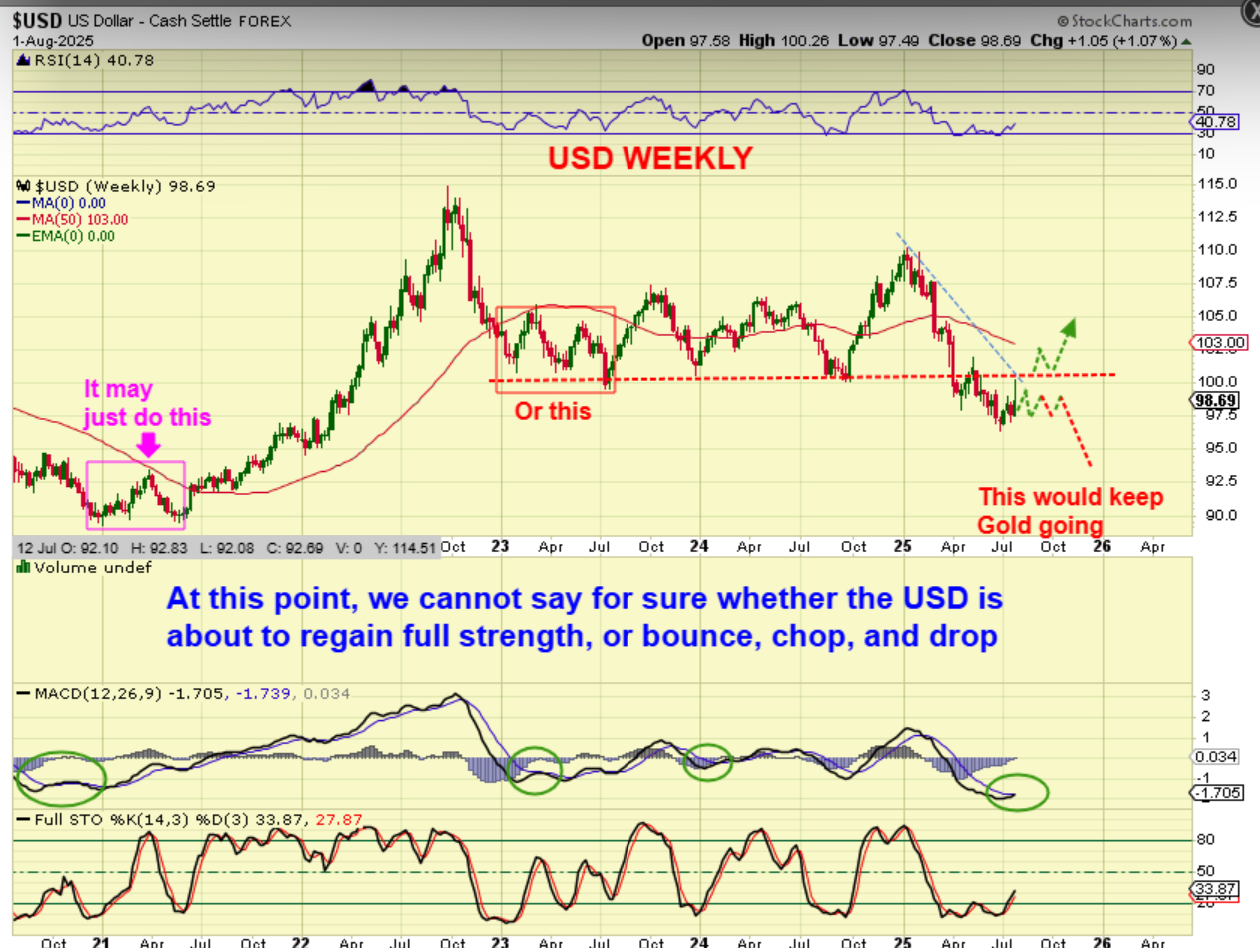
USD From Fridays report: I pointed out the bullish “Higher lows & higher highs’, but the time out of that low makes it due for a dcl or pull back too. I thought that maybe we’d get a dcl at the red 50sma…
.
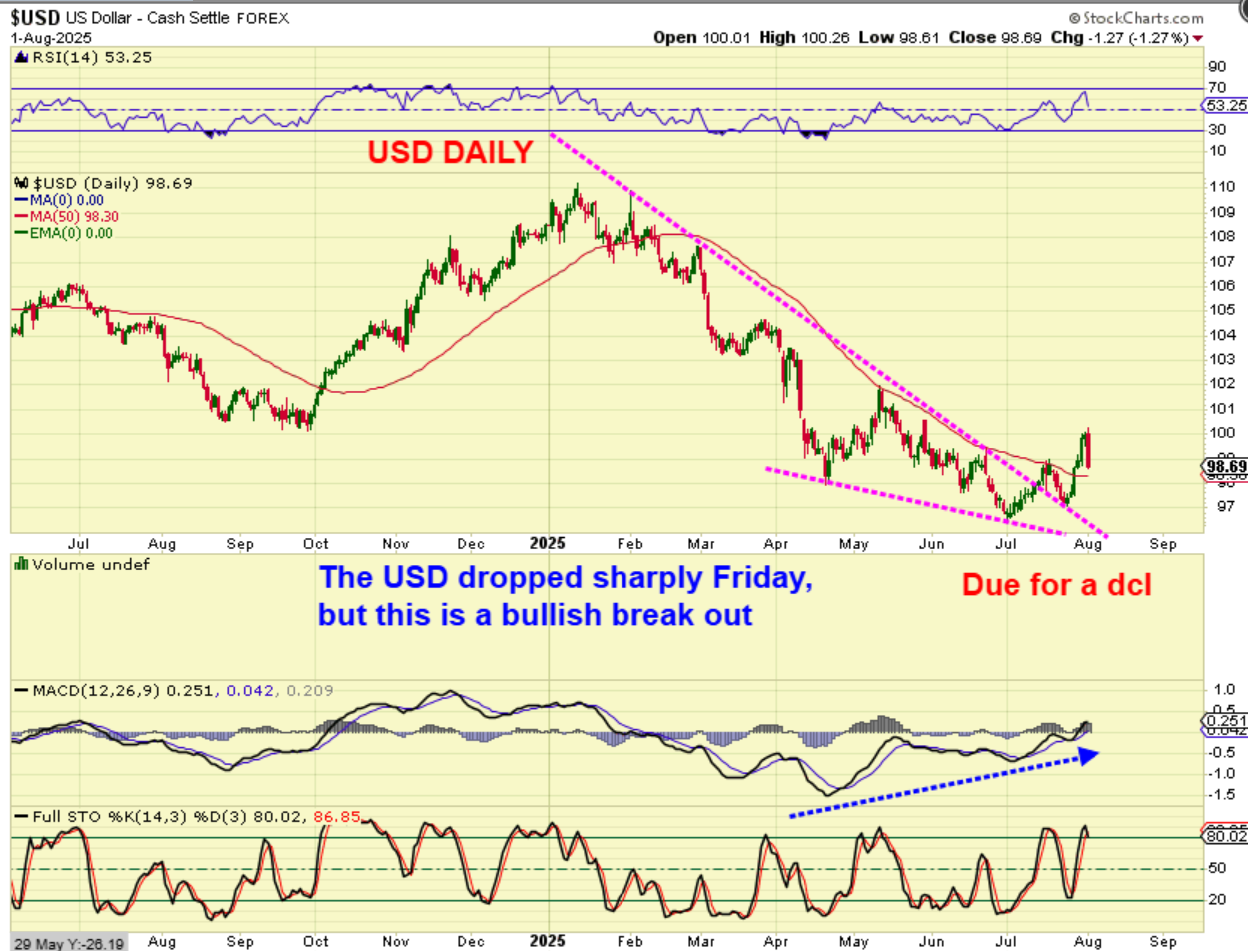
USD: Well, we certainly got that dip lower on Friday after the jobs report, but this remains a bullish set up and that may just be an overreaction in time for a dcl. This could drop lower to the 50sma and then stabilize there, since the breakout has already back-tested. Please read the chart.
.
USD WEEKLY: Looking at the Bigger Picture we can see that the USD lost long term support in 2025, and it has not yet recovered. The current bullishness gives it a chance to recover like Oil did, but it doesn’t mean that it will recover.
I have drawn 2 possibilities with the current bullish set up, and one favors Gold putting in a milder ICL as the USD chops sideways, and then Gold would continue to rally higher as the US continued to sell off.
.
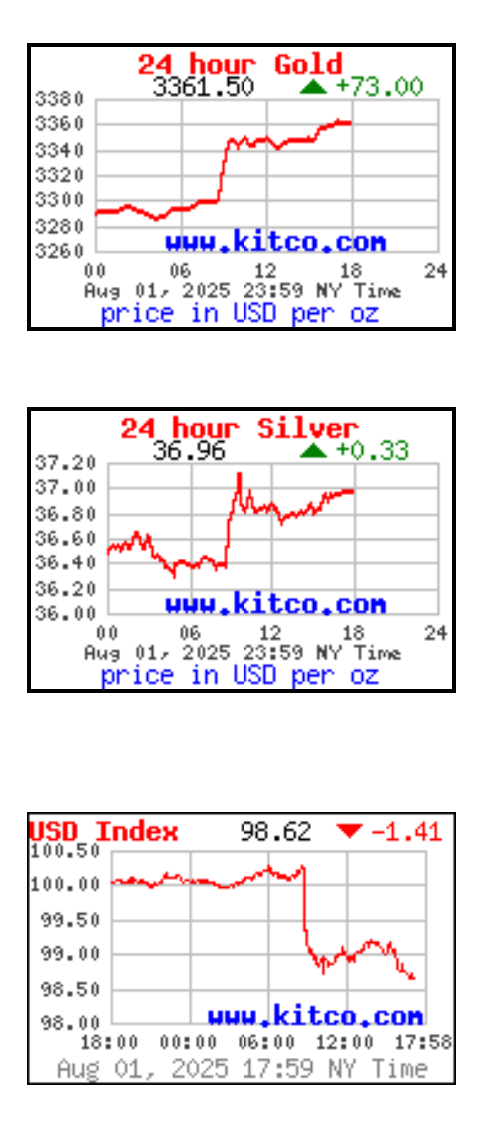
GOLD, SILVER, & THE USD FRIDAY – That was a big reaction to the jobless claims report. Gold, Silver, and The USD may be sensing that increased possibility of a rate cut too.
.
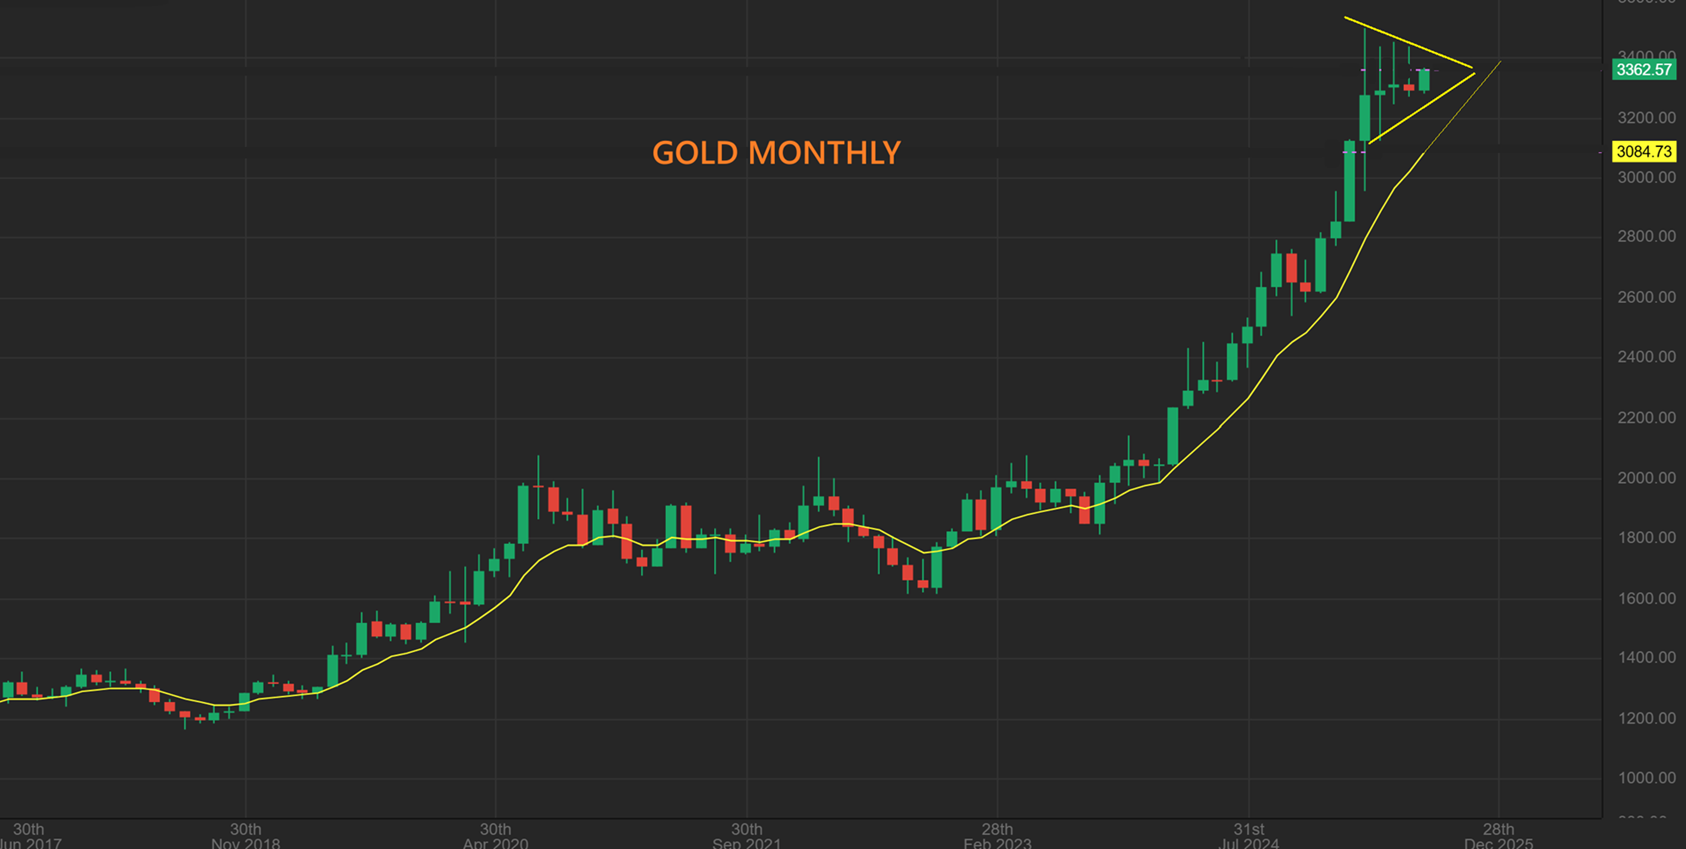
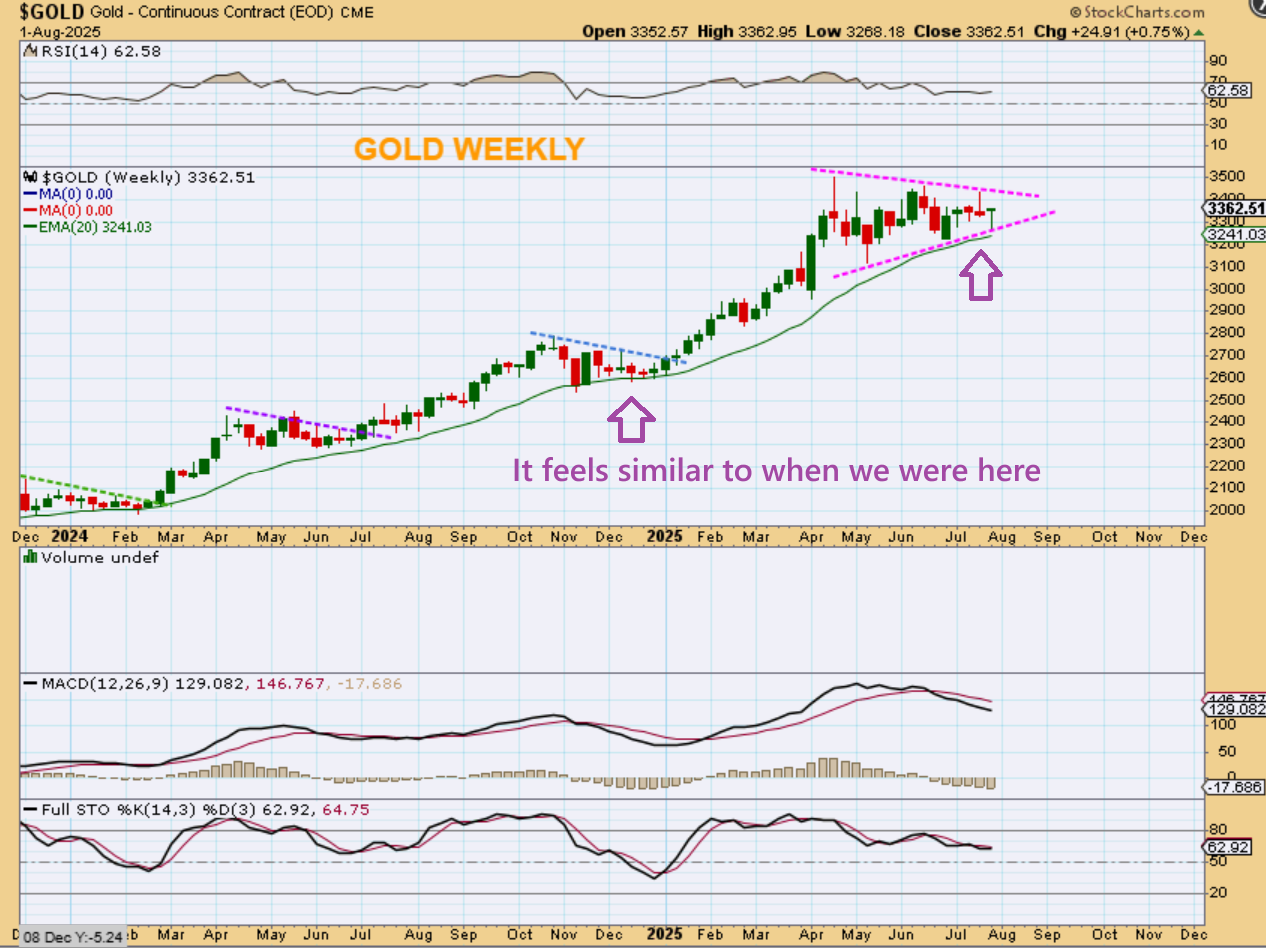
THE GOLD MONTHLY CHART is honestly a very bullish beautiful chart as it stands. The recent chop is forming a pennant or triangle and even if Gold dips down to the yellow 10-month ma line, this would still be a very bullish consolidation so far.
.
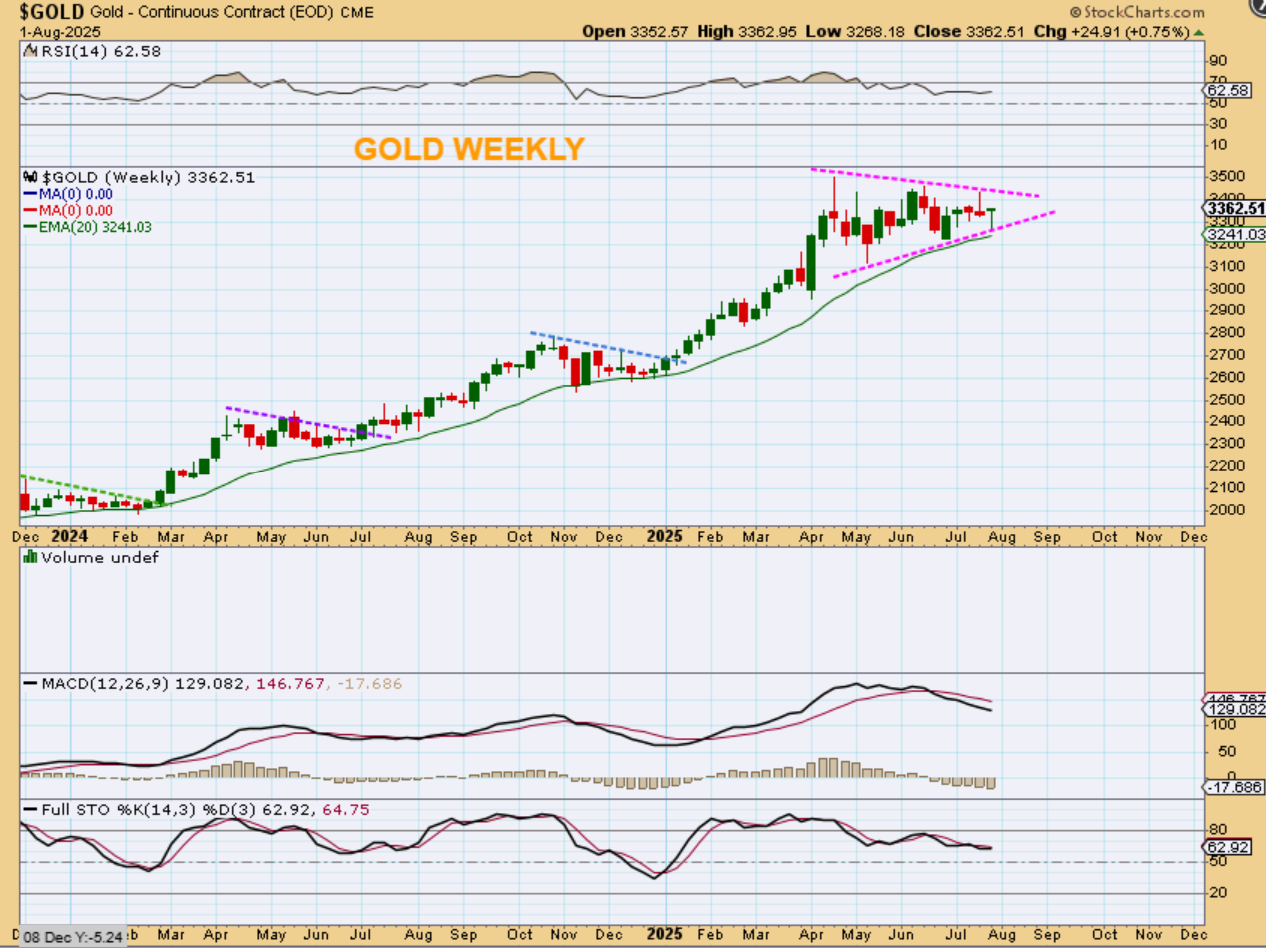
THE GOLD WEEKLY CHART is also a pretty looking chart. This chart seems to indicate that Gold wants to go higher, not lower. We sometimes see a triangle form a stealth ICL higher than we expect, and that may happen here.
.
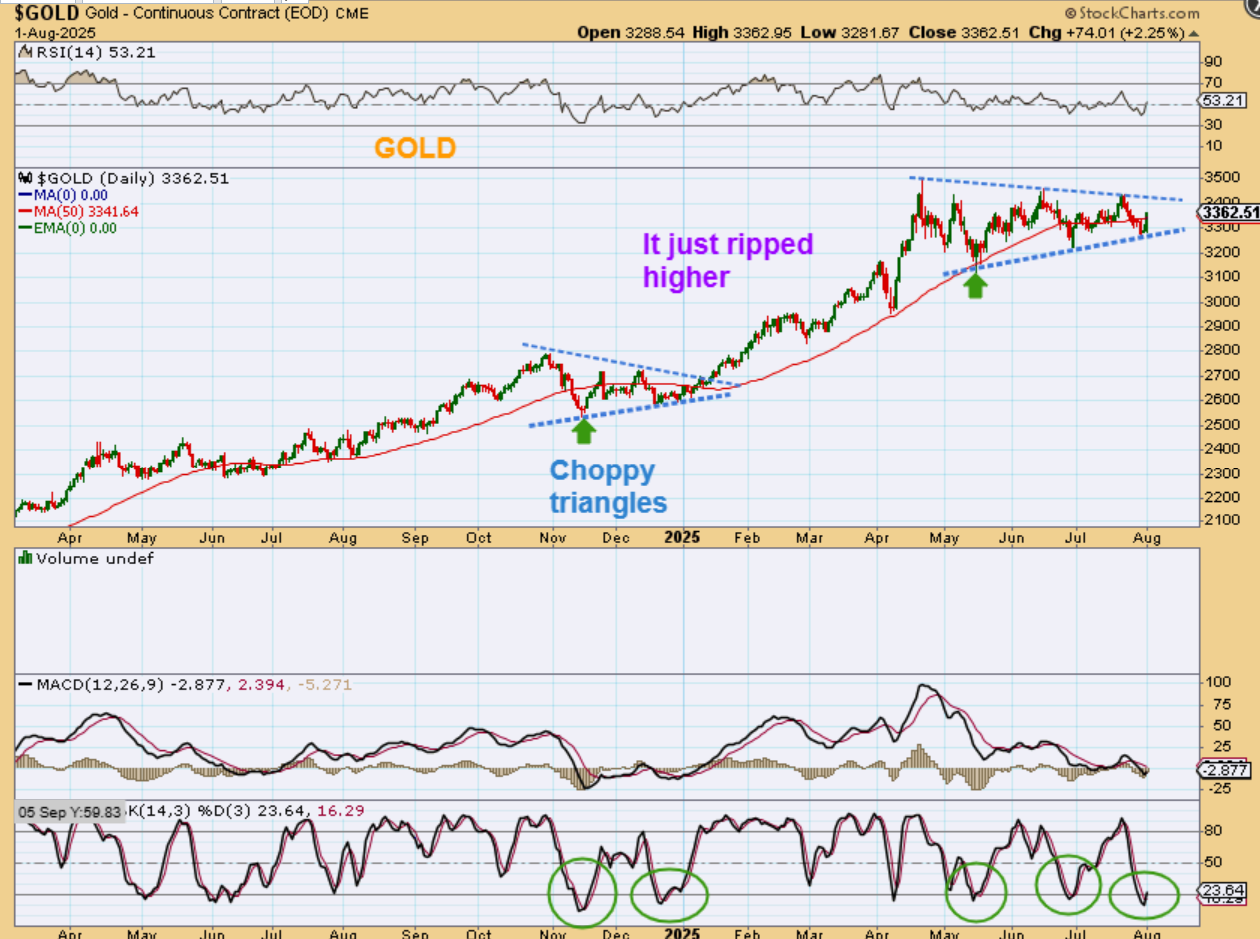
THE GOLD WEEKLY CHART is actually shaping up to look very similar to what it did in late 2024. Do you see the similarities? A choppy triangle along the green support. That was followed by a 6 month rally, so let’s stay frosty my friends! In fact…
.
In fact, let me show you something:
I use cycles as a ‘timing guide’, but after a long consolidation that forms a tringle, a wedge, or a pennant, I lean toward technical analysis.
/
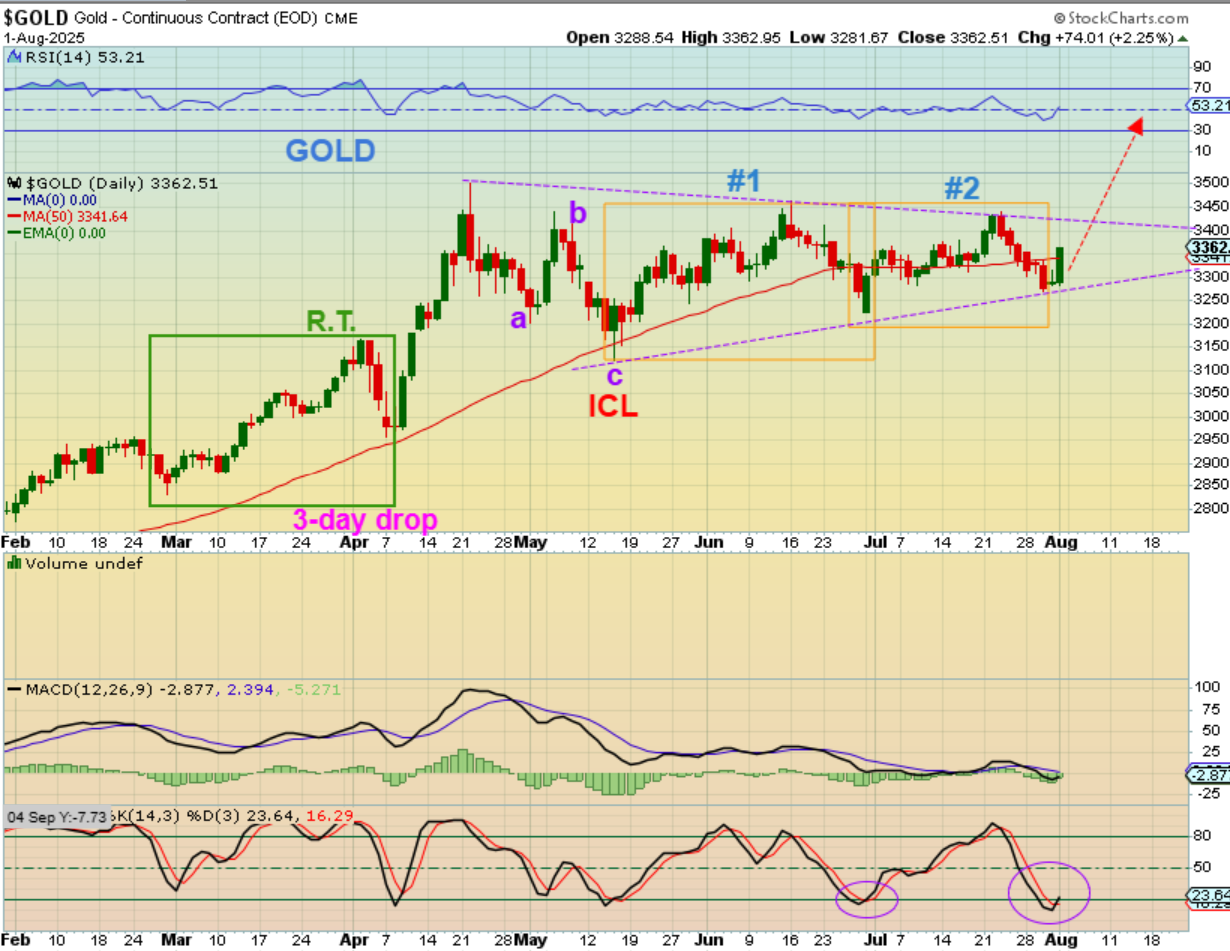
THE GOLD DAILY CHART is starting to look very similar to the late 2024 triangle, and we are running out of time. Remember: I did NOT mark Golds ICL in April because that was an extremely R.T. daily and it was only a 3 day drop. I know that some here think that was the ICL, but I didn’t think so and now we have a triangle. Those often obscure cycle counts too. I looked at the next rally as the peak, and said that an A-B-C down into a low that I then marked as an ICL. Why does that matter?
/
THE GOLD DAILY CHART : In harmony with what I have been saying about that a-b-c being the ICL drop, this may be the start of a very strong 3rd daily cycle. That is the opposite of a weak 4th like some may think, if they counted April as the ICL. And now we have a triangle with price near the apex.
.
Silver does not match my thoughts on Gold though.
.
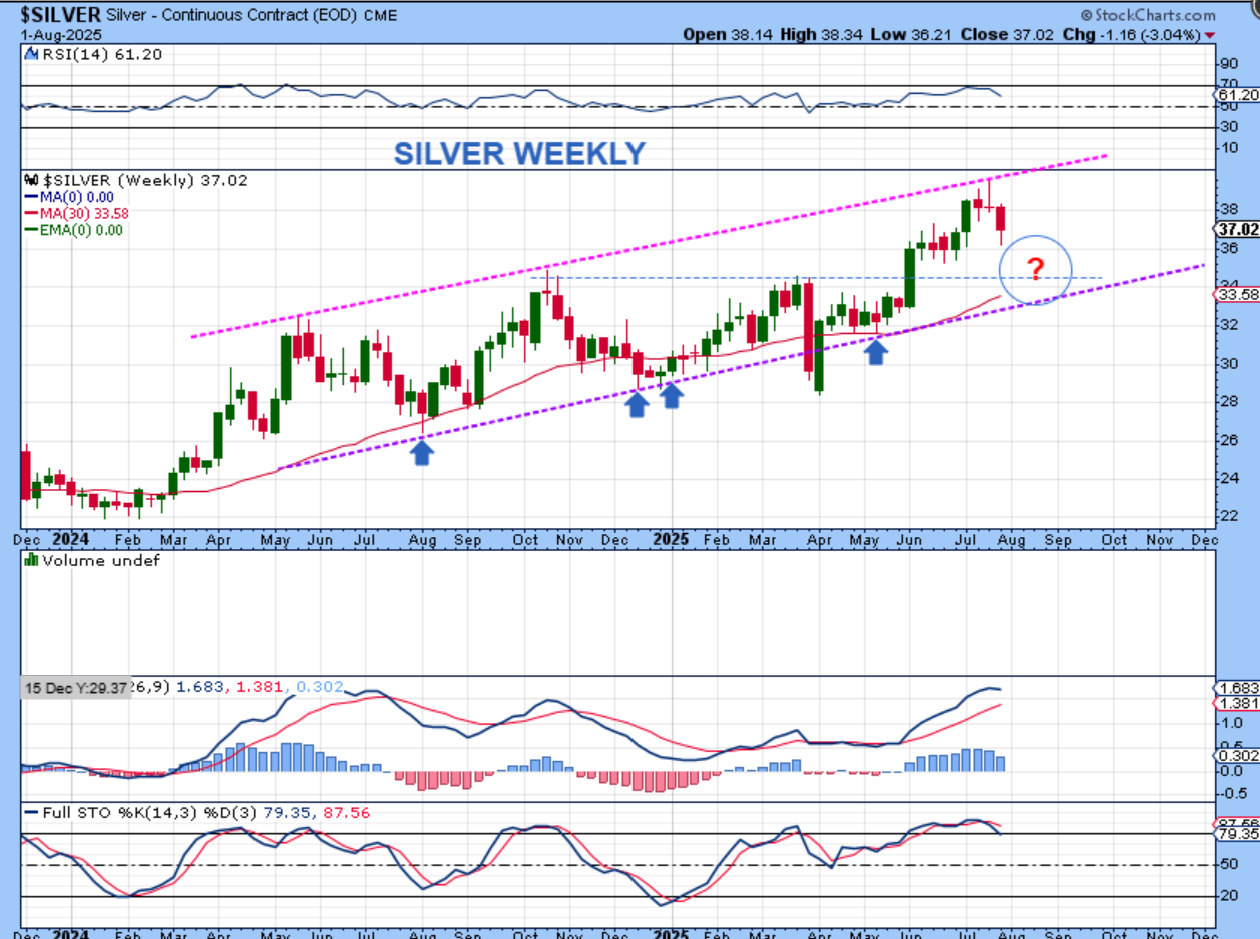
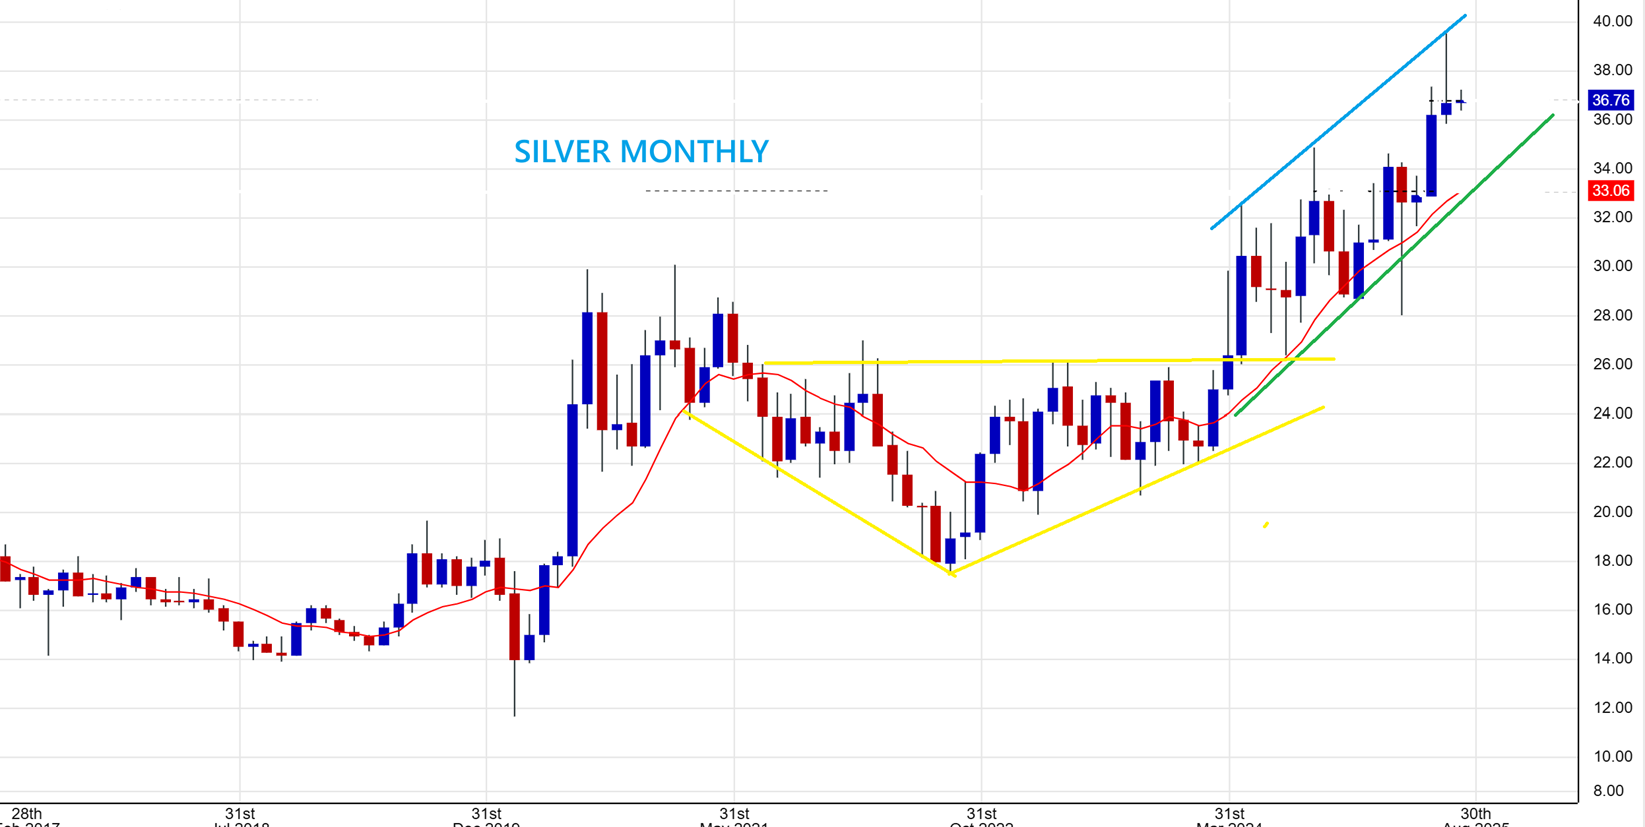
SILVER WEEKLY– Silver lost 3% last week. I have it inside of a large weekly channel. If it drops further, following the general markets with a bit more downside, it could drop to the blue circle.
.
SILVER MONTHLY – Unfortunately this shows us a monthly reversal and what is normally a bearish shooting star candle. This obviously doesn’t match what I am seeing with Gold, so that is confusing. Let me zoom in…
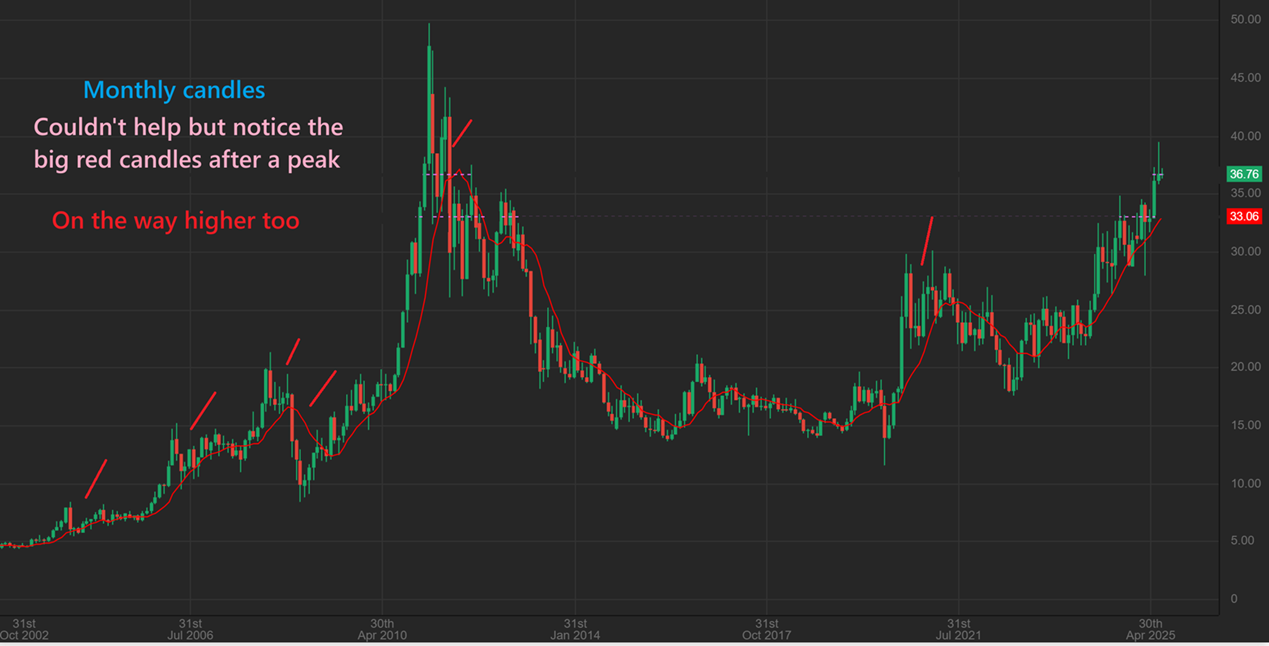
.
The SILVER MONTHLY gave us a shooting star to help form an upper channel line. Usually from here we chop sideways or drop, so again, this doesn’t match what I am seeing with Gold and we may need more time to see how these 2 areas want to play out.
.
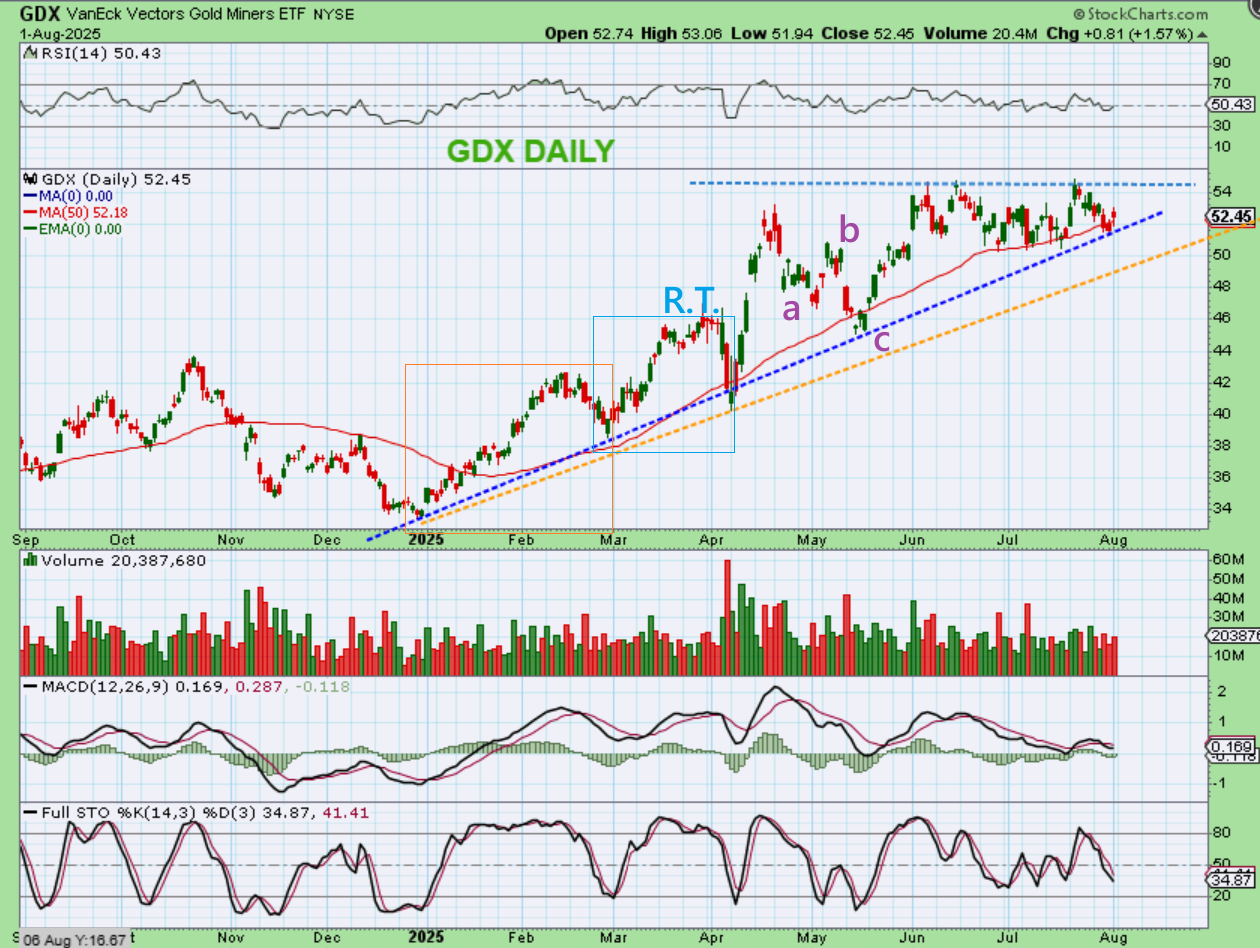
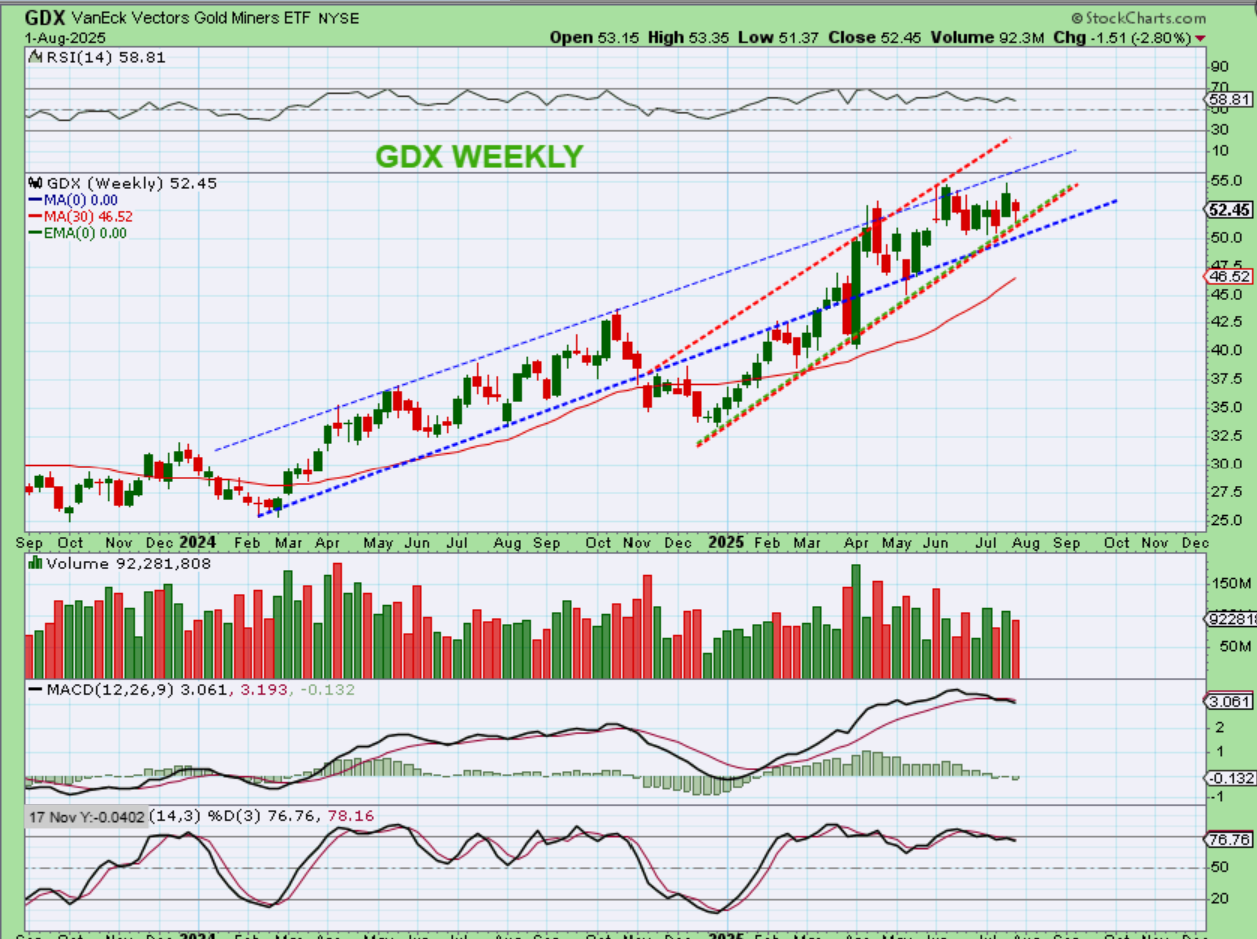
THE GDX has been choppy like Gold and it is riding up (very choppy) along an uptrend line in the big picture or 2025 too. This weeks drop would put the GDX at that lower line and 50sma. To me this does resemble Gold with an a-b-c down into May, and 2 daily cycles that followed. GDX is now at support.
.
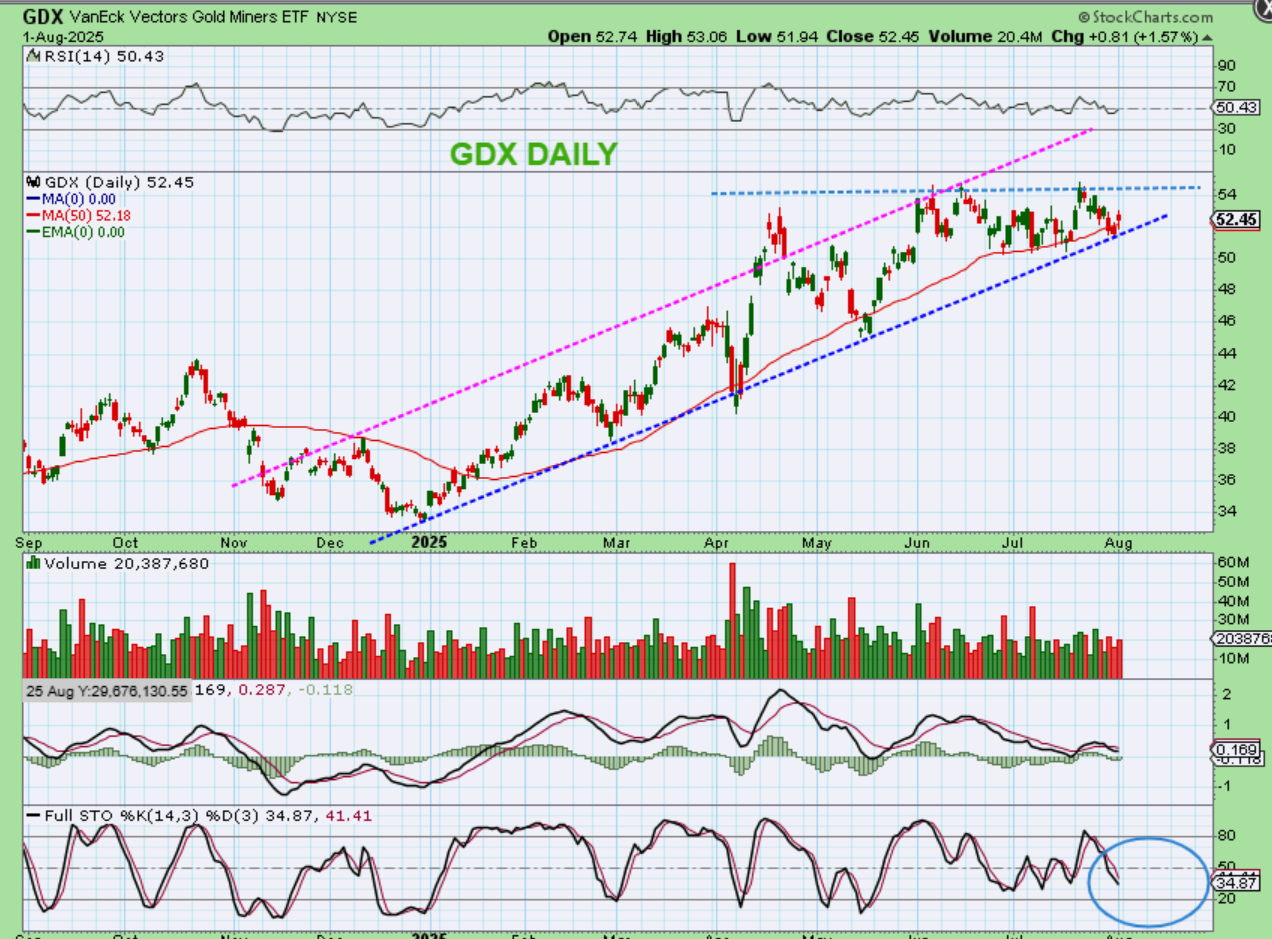
Another way to look at it is to draw an upward sloping channel and price has now chopped over to the lower end of the channel, so it would run to the higher end again, if Gold was to resume that bull run.
.
The Weekly Chart is a mess, with some very large drops and pops, but this is what I came up with.
It was in the blue channel for 2024, until a deep selling ICL came into play for Dec 2024. It then rallied back into that blue channel and has actually bounced around inside of that area again (it became very sloppy though). I drew an orange channel that is steeper, because I see that the Miners may have become stronger or steeper in their run for 2025 vs 2024.
.
So, it was an interesting review of the weekly charts for me, with some changes that may be resulting from a coming interest rate cut, or a slowing economy due to tariffs, and other external interference like wars and uncertainty. We do need a little more time to pass to be able to gain some additional clarity, but right now I’m not seeing anything outwardly bearish for the general markets and I’m also not seeing very much downside potential for Gold and the Miners. Silver is tricky, but it’s possible that it drops for a while and then reverses higher.’ Time will tell’ on the Precious Metals set ups, but I wanted us to be alert to any buying with Gold and the Miners.
.
Enjoy your weekend (Long weekend in Canada?), and let’s look forward to seeing how next week plays out after an odd reaction on Friday. And as always, Thank You for being a chartfreak with me! 🙂
.
~ALEX
.
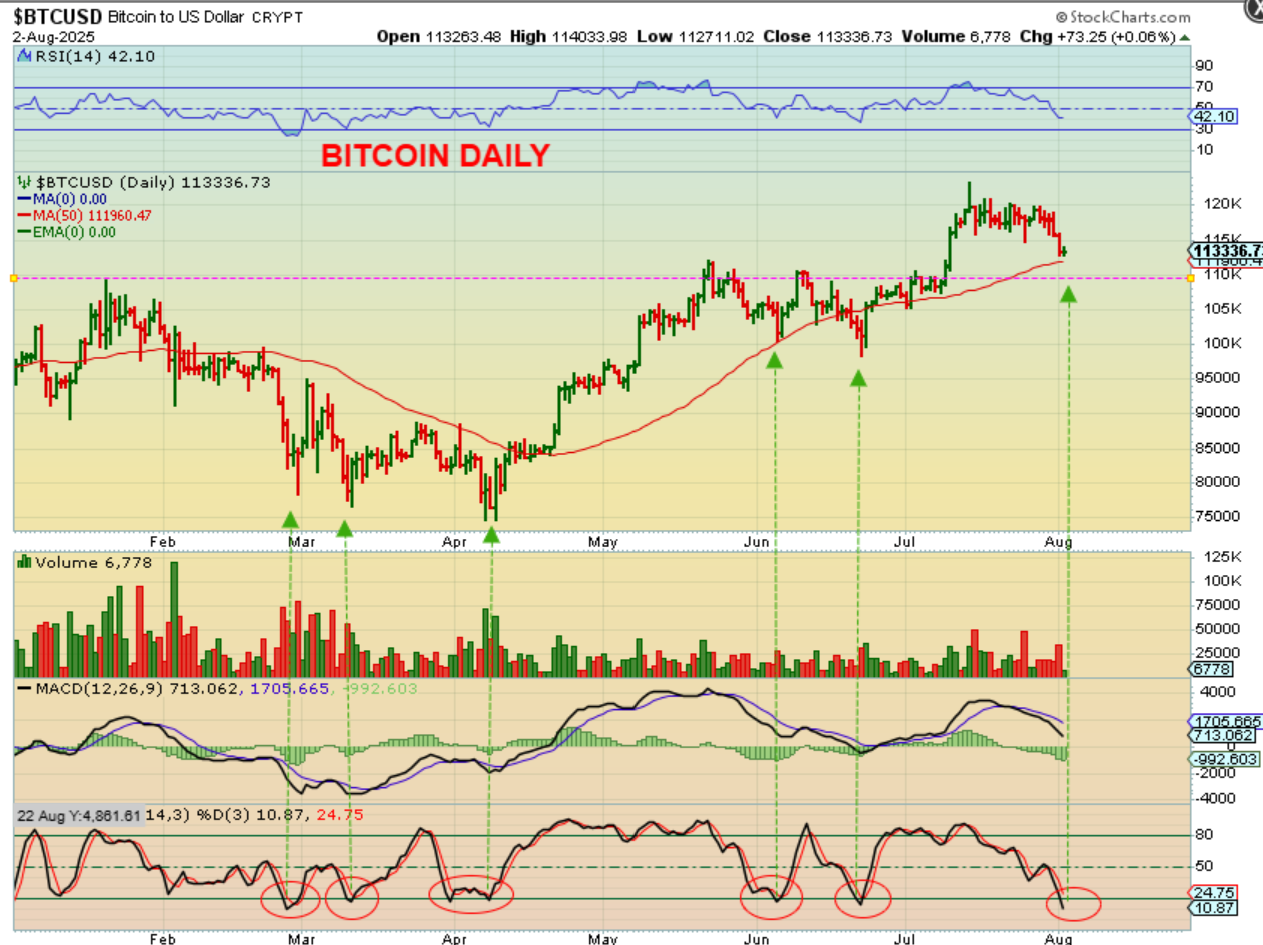
BITCOIN is continuing to drop this weekend, but it may be closing in on the support of the 50sma. It also may drop down to the horizontal line as support as a back-test. We are now oversold enough to bounce too (see green arrows). This set up is really tricky, because…
.
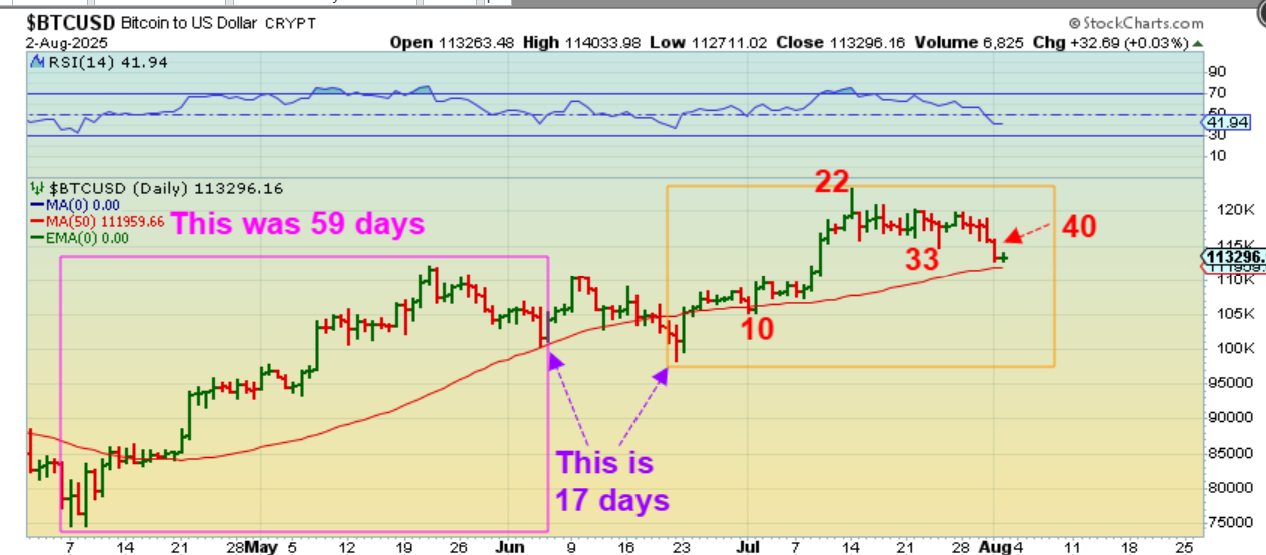
BITCOIN …
1. Had what looked to be a completed daily cycle at day 59 (of 60). 17 days later the low was taken out. Failure? or dcl?
2. When we got a 17 day break lower, it was hard to know if it was a 76 day daily cycle low? That is very long if so.
3. Was it just a quick ‘false break down’ & recovery? A shakeout on day 17 of the new daily cycle?
4. So now it was either a 76 day daily cycle low, and Counting from that lowest low, we are at day 41 of 60 on Saturday. OR
5. That day 40 low is really a day 57 low (40+17 = 57). THAT MAKES BITCOIN VERY TRICKY IF IT BOUNCES HERE AT THE 50SMA.
.
So:
THAT MAKES BITCOIN VERY TRICKY IF IT BOUNCES HERE AT THE 50 sma, because
1. we said that we could be at a day 57 dcl, or
2. We said that it may bounce at day 41 and then come back down to the real dcl on a support area. All you can do at this point is play what you see. I will monitor Bitcoin daily in the weekday charts, and we’ll also look to see how the crypto stocks react to any bounce from here. .
.
BITCOIN WEEKLY: The view from the weekly chart shows that often price falls to the Green Line or a deeper dip drops to the Red Line. This chart seems to indicate that Bitcoin can drop to the red horizontal line as the Green Line rises up to it. That seems to also indicate that we are in day 41 and may bounce and come back down to the green line in a week or two.
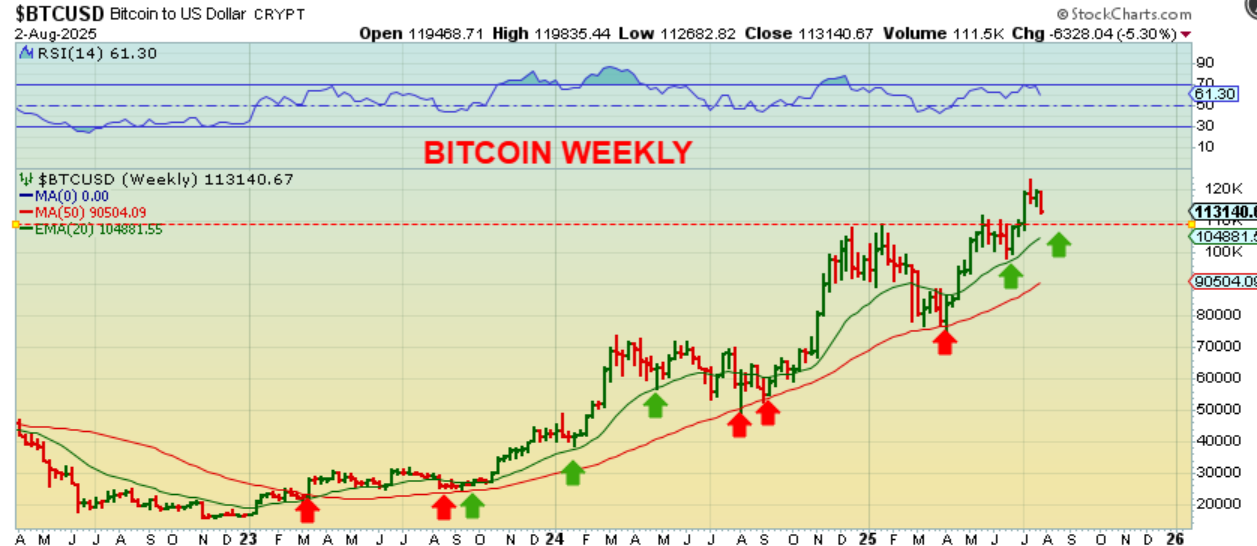
Final thought:
We are in year 3 of a 4 year cycle and bitcoin often peaks in year 3, so time is slowly running out for one more rally higher to maybe the $130,000-$150,000 area.

