
July 5th Weekend Report
.
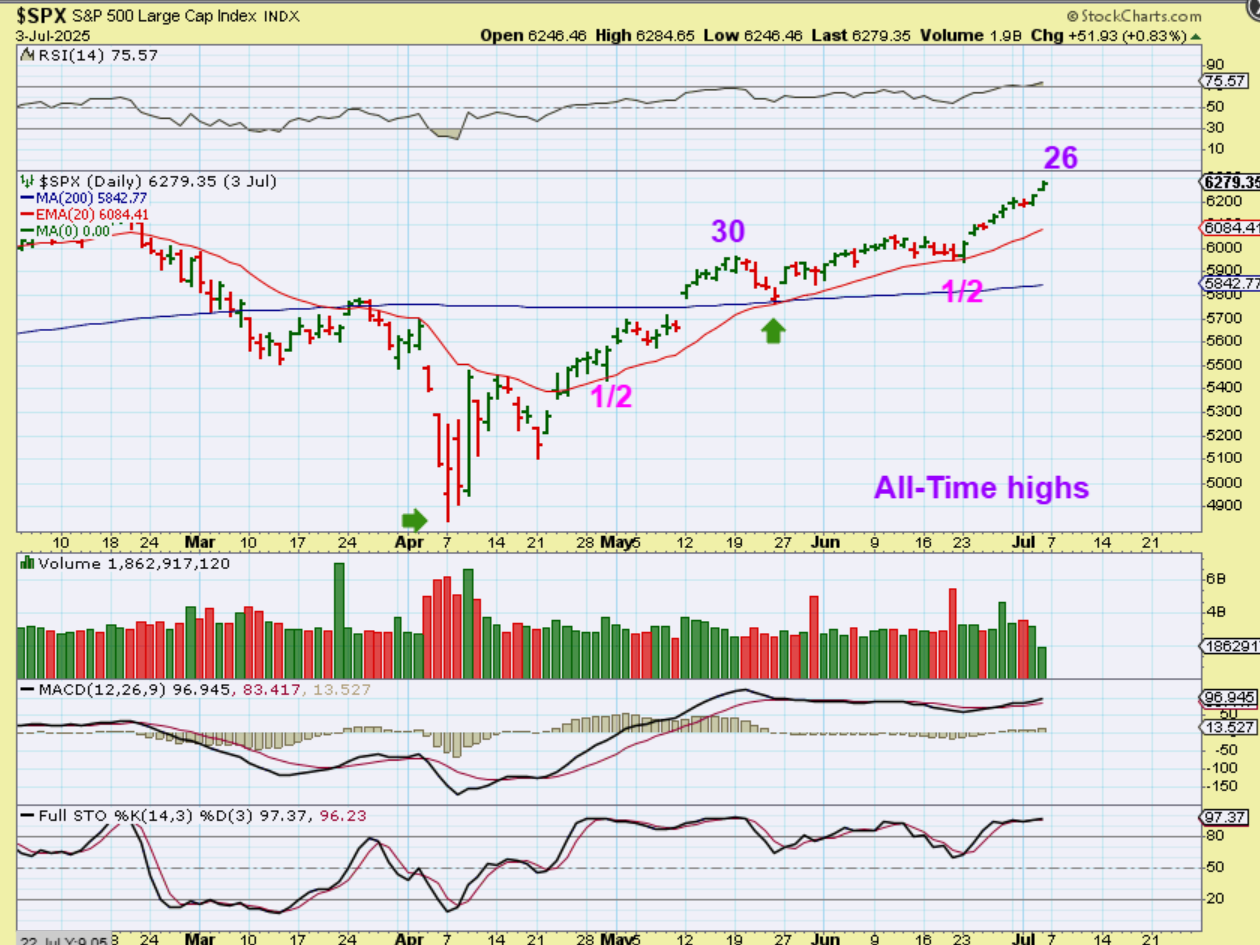
SPX DAILY – We had a really nice run out of the half cycle low and the gains have been good for 2 weeks. In a bullish market you can just ride out the dips into 1/2 cycle lows and even DCLs or you can try to trade around them. You can see that the last dcl was only a 4 day dip to the 20ema /200sma. This can run higher, and we are in a bull market with surprises to the upside.
.
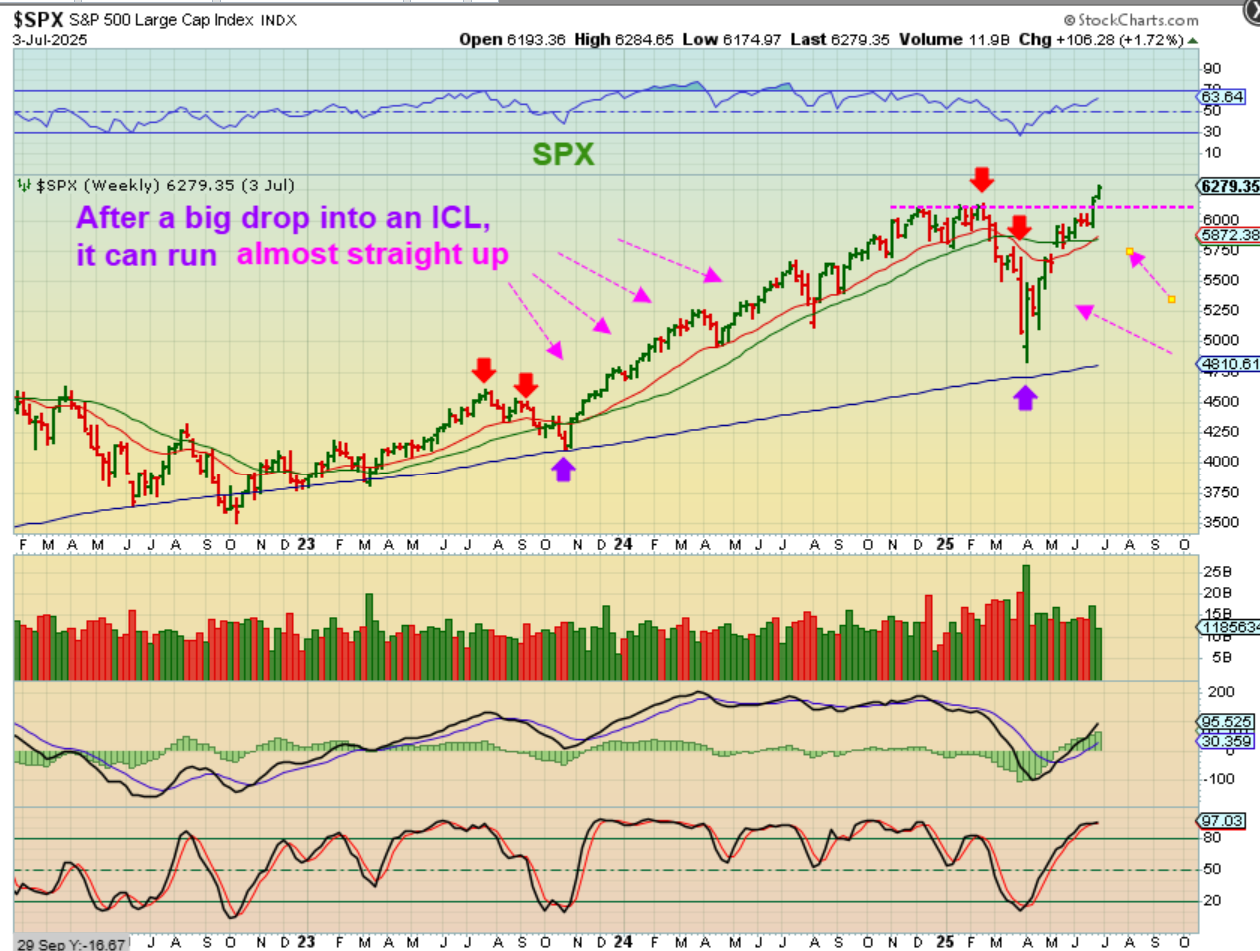
SPX WEEKLY – Take a look at the run out of the deeper ICL in 2023. On a weekly chart the run is vertical, and we do see something similar taking place now too, as the Markets went on to break to new all-time highs.
.
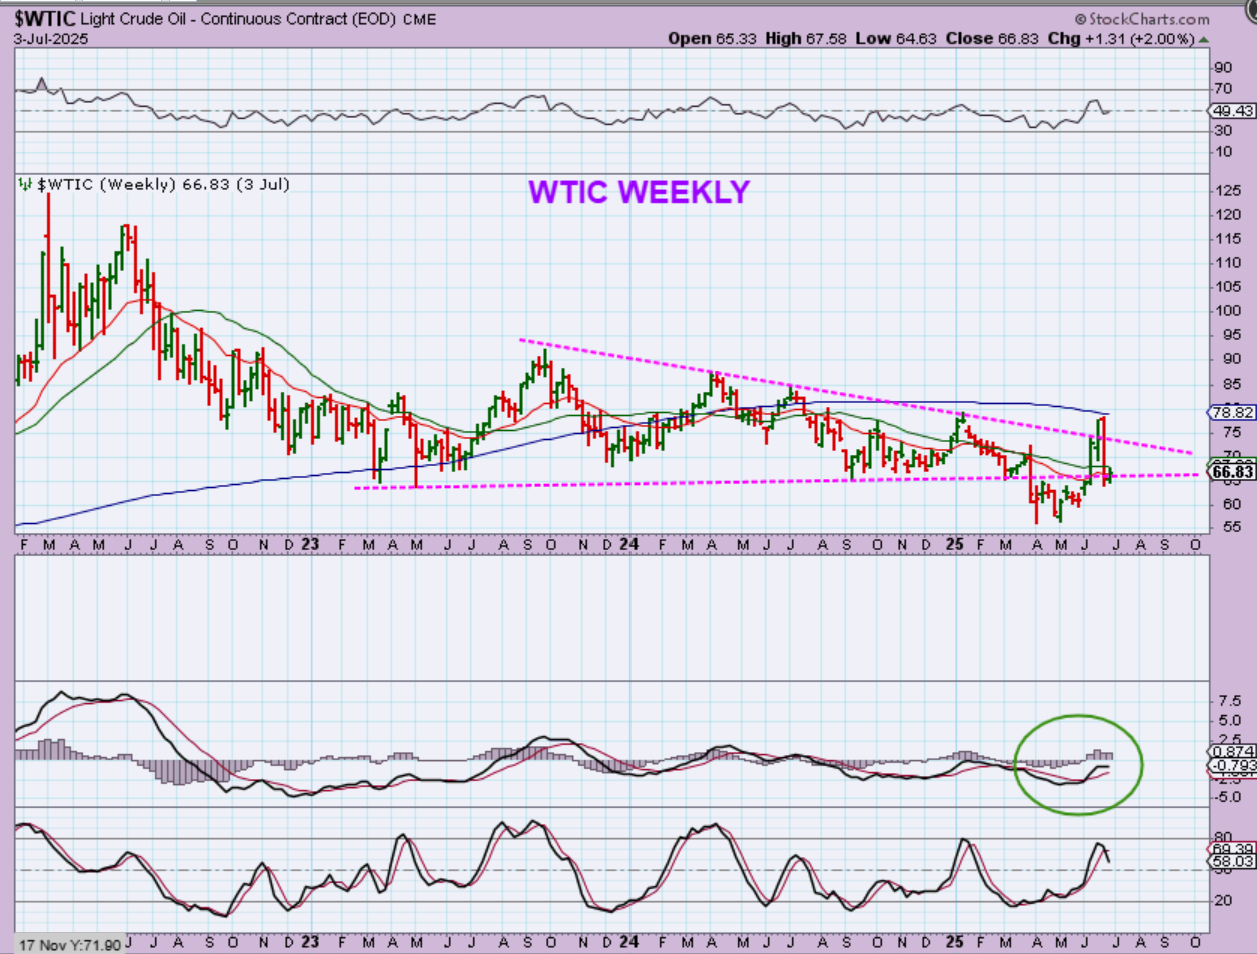
WTIC – Oil is interesting.
1. Oil broke down and was selling off steadily, even breaking below long-term support.
2. With the breakout of the war between Israel and Iran, we saw Oil Surge in a rapid climb and that then looked to be a shake out and recovery. Oil even left the top of the wedge or downtrend line.
3. Now Oil plunged back to the lows of that same long-term support. This weekly chart has a bullish RSI & MACD now, but the daily chart looks like a bear flag, so to be honest, this could go either way.
4. It has been a geopolitical move, so going forward the next direction for Oil may depend on the tensions in the MidEast. Cycle timing allows for weakness or strength at this point.
.
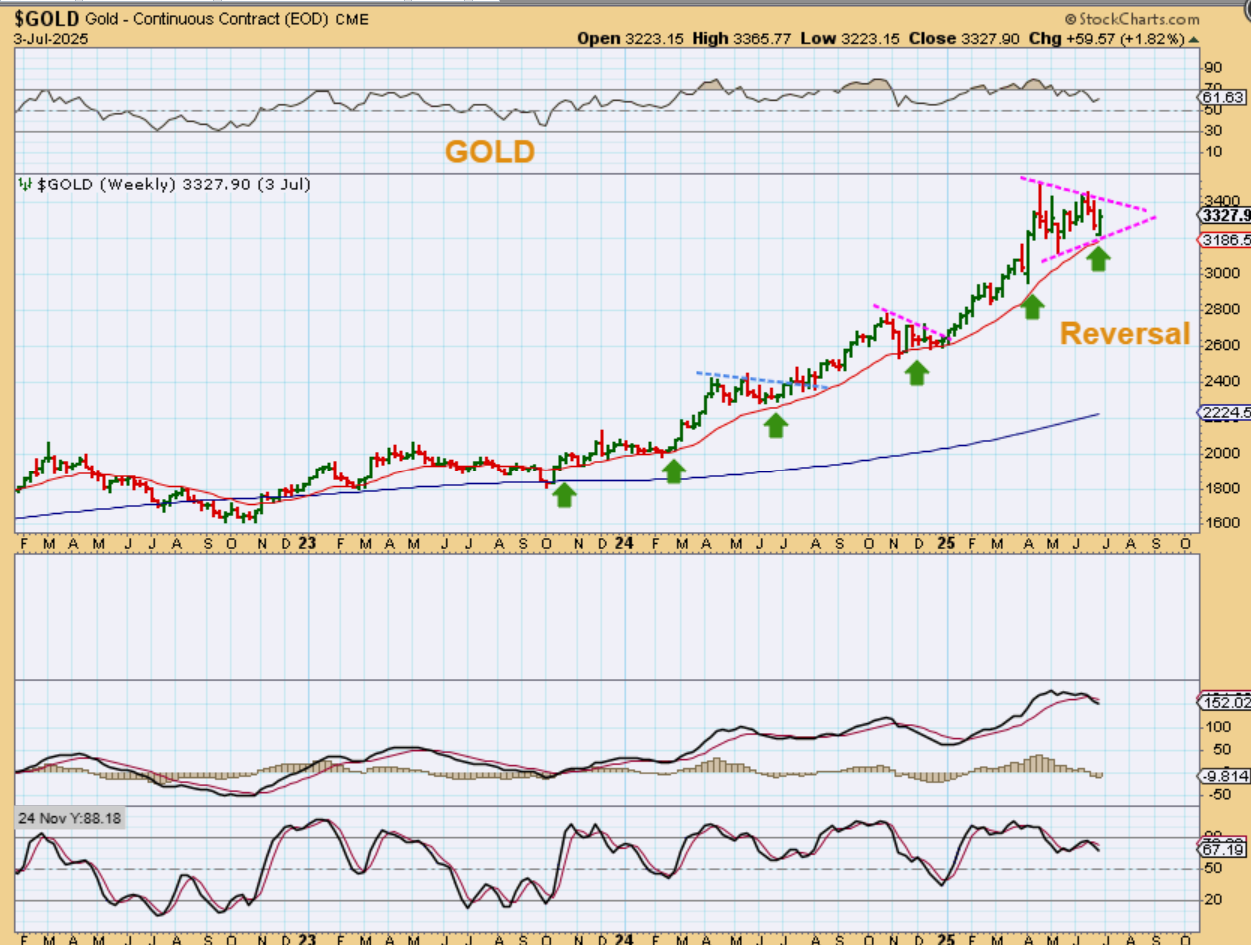
GOLD has been running in a nice steady bullish manner since the end of 2023 and 2024, when it broke from that giant cup and handle. The red line is the weekly 20 ema, and Gold has found support above that line repeatedly. Gold also just reversed there again last week. Gold looks set to move higher, but I did report in my daily charts / daily reports that Gold also looks like it may be choppy and higher too.
.
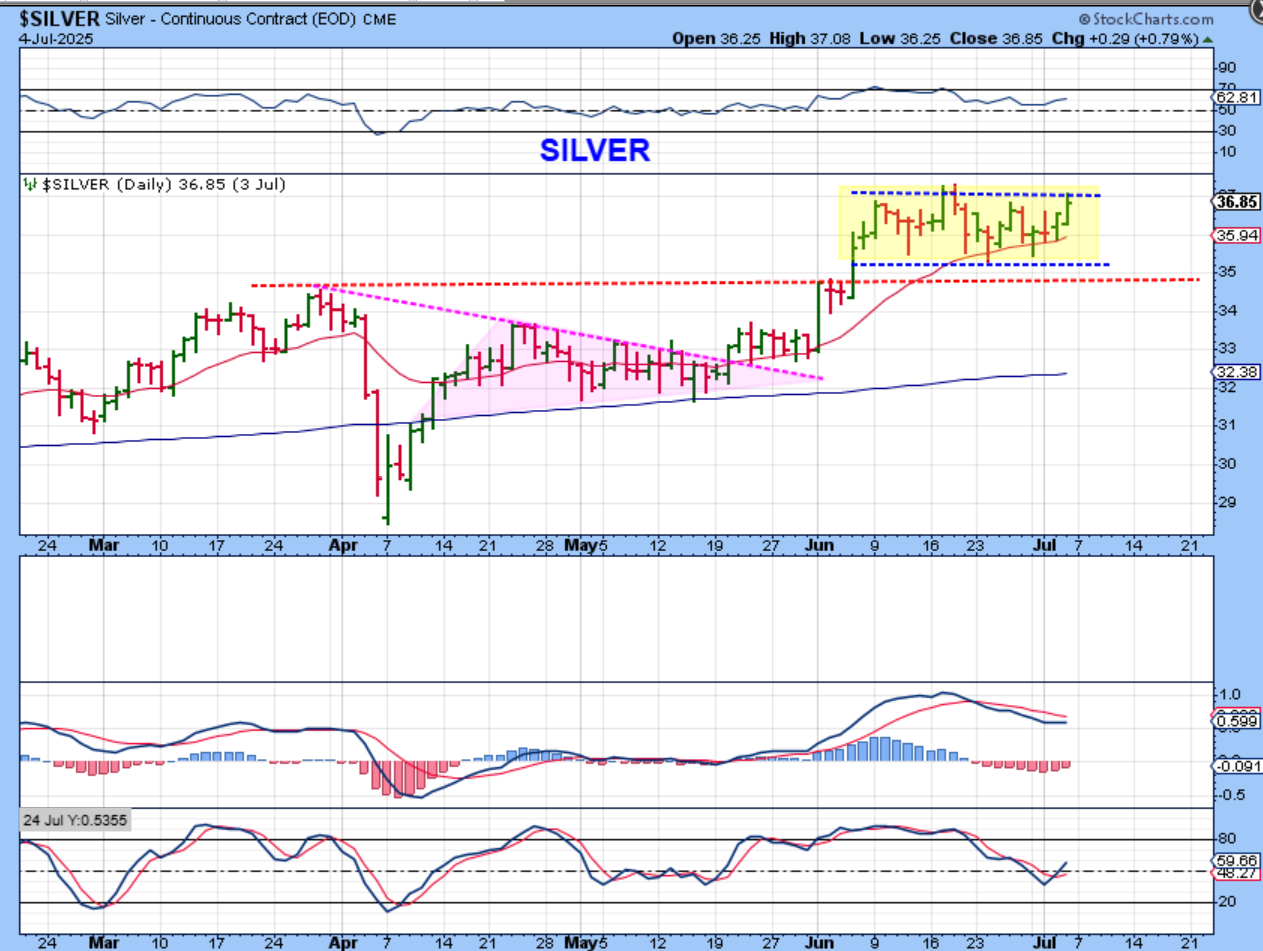
SILVER put in an ICL in April and then broke out to new 10+year highs in early June. Since then, it has consolidated sideways and held up well (it was very close, but it didn’t quite drop and back test the $34.70 area as I had expected). Last week gave us a reversal higher …
.
Last week gave us a reversal higher and Silver looks to have a dcl in place and wants to move higher too. As you can see though, Silver also likes to chop sideways, as seen in April and May and June, so we either get a break higher now or a little more chop.
.
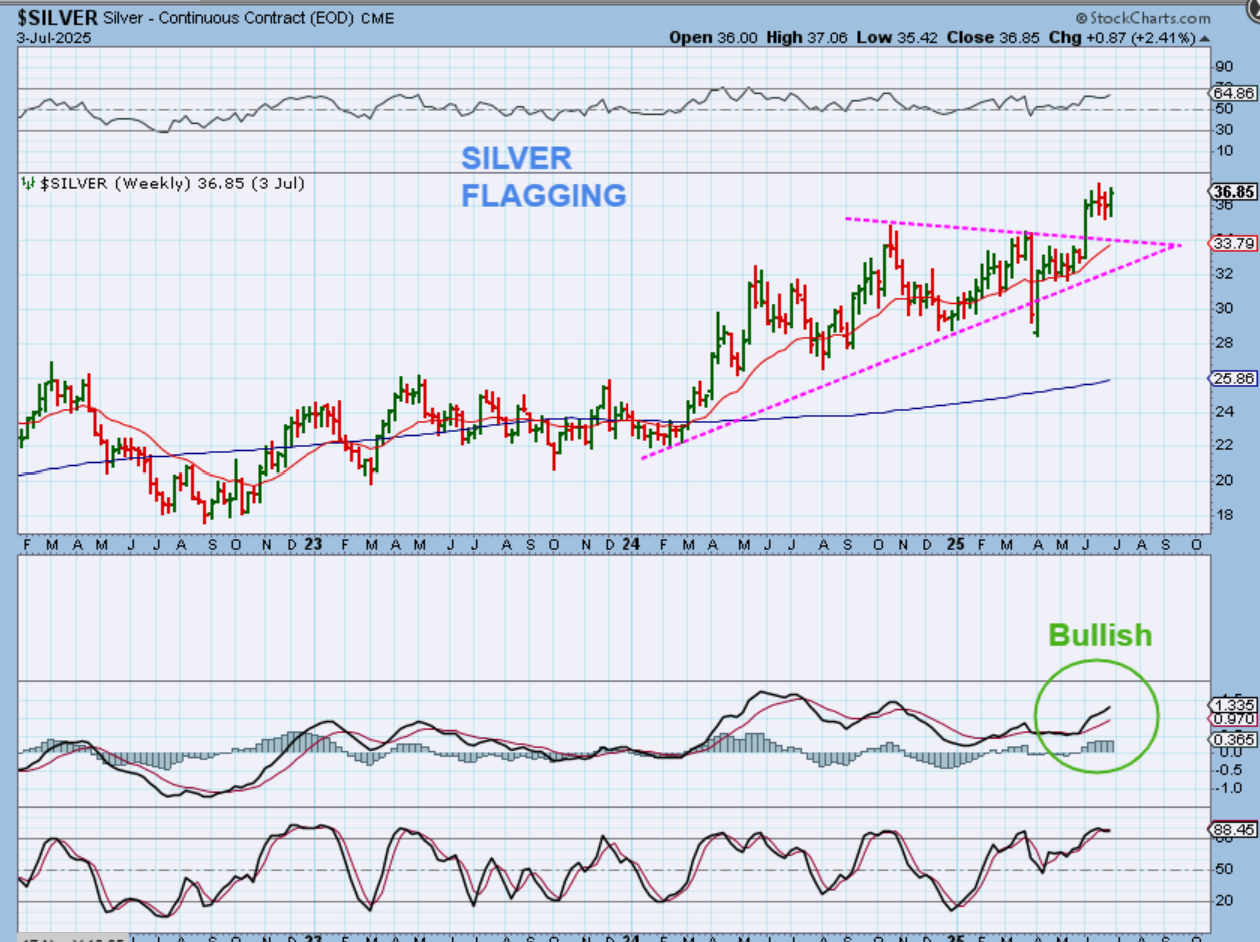
SILVER WEEKLY has a reversal higher last week, so we’re hoping that it can just breakout and continue higher, with a dcl behind us, rather than remain choppy.
.
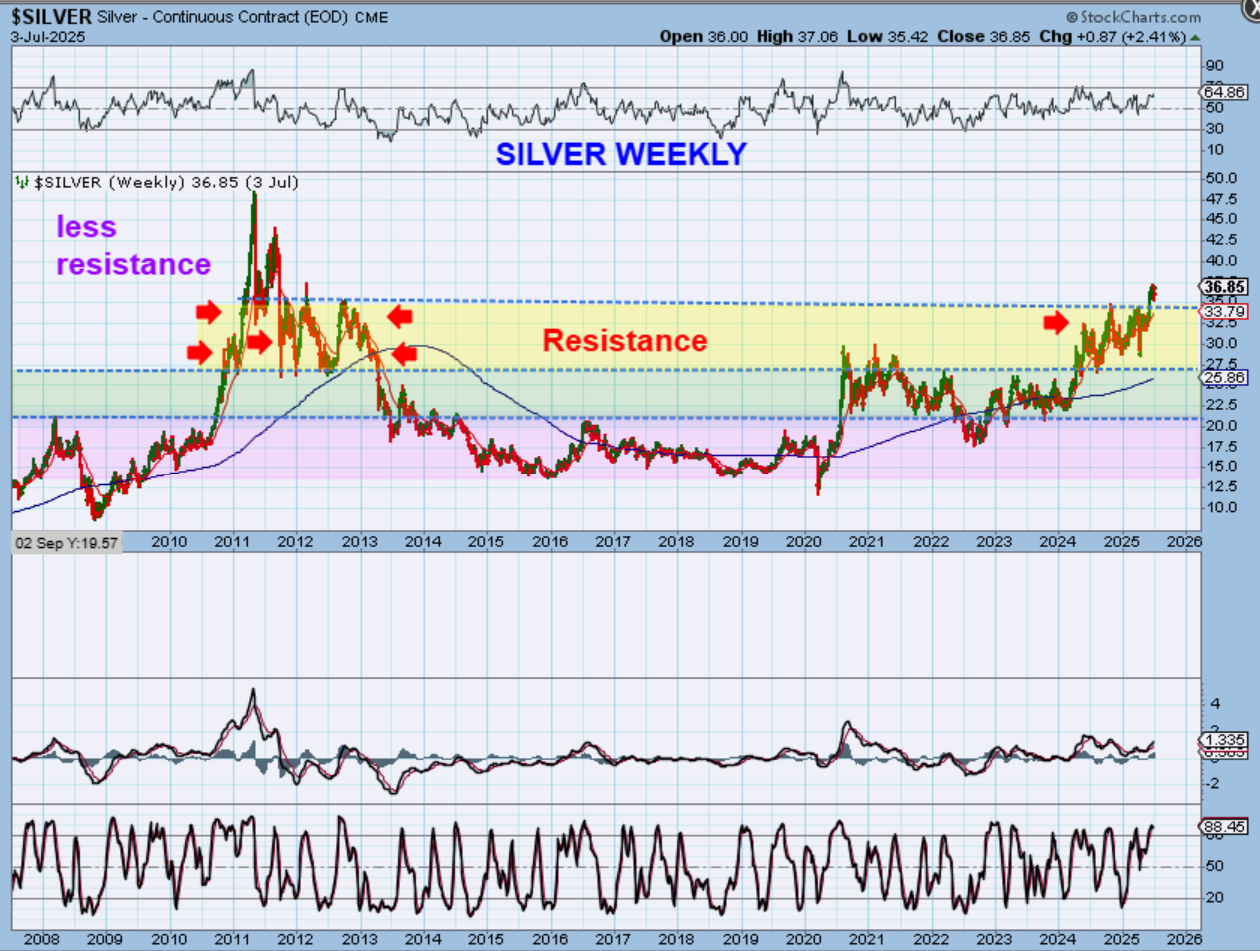
SILVER had to work its way through resistance and that was one reason why it was so choppy over the last year or so. At this point in the run, we are seeing less resistance to the left, so it may be able to rally easier going forward.
.
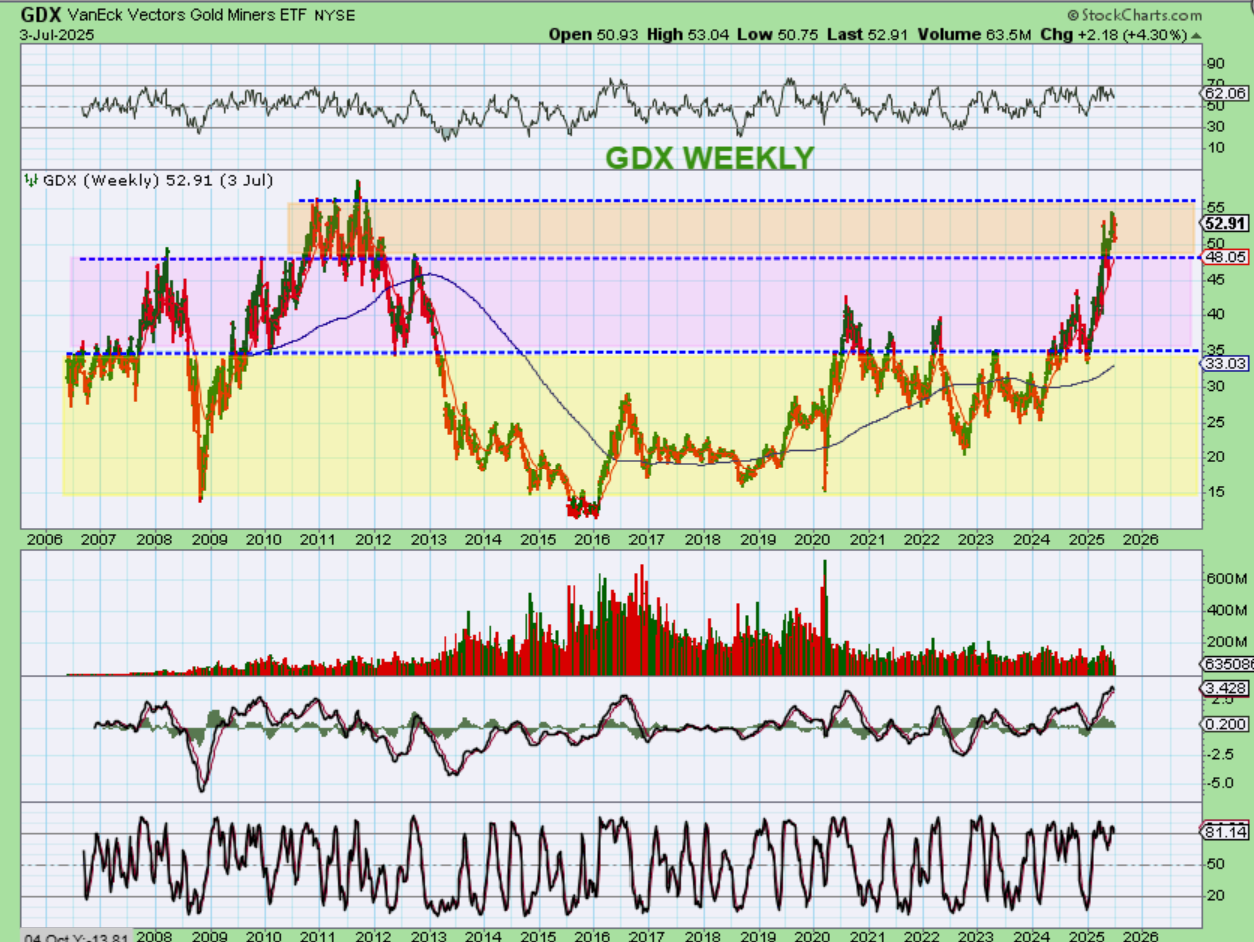
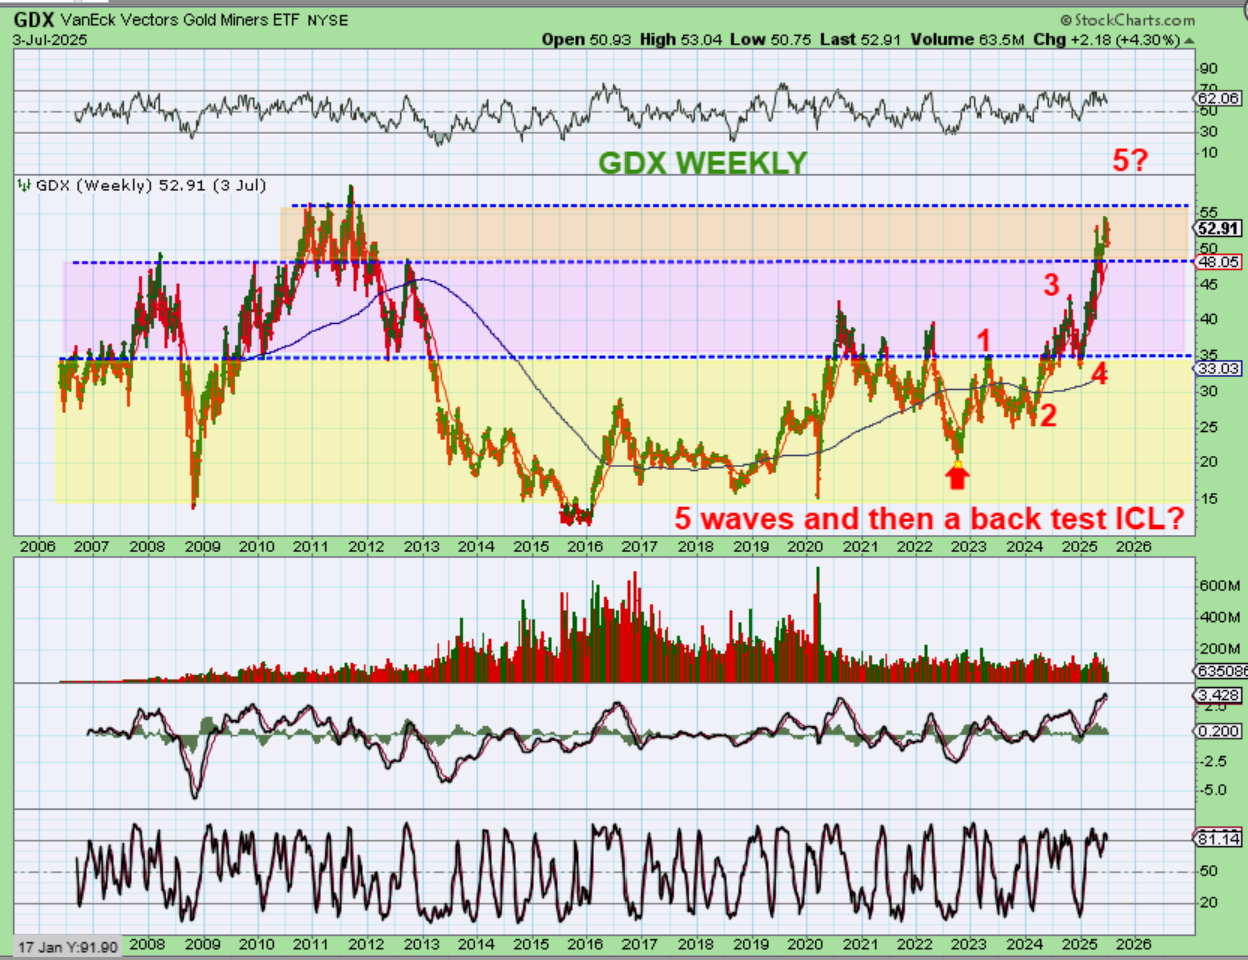
GDX also has been working through resistance, but it is almost at all-time highs. Once it gets above that level, buyers may really start to pile in.
.
GDX WEEKLY – This probably isn’t a normal 5 wave run, but I’m just picturing a possible breakout and back test over time (a-b-c into an ICL) as something that seems reasonable.
.
There is not much more to say after seeing those weekly charts, except that the Bulls clearly remain in control. Enjoy your weekend!
.
~ALEX
.
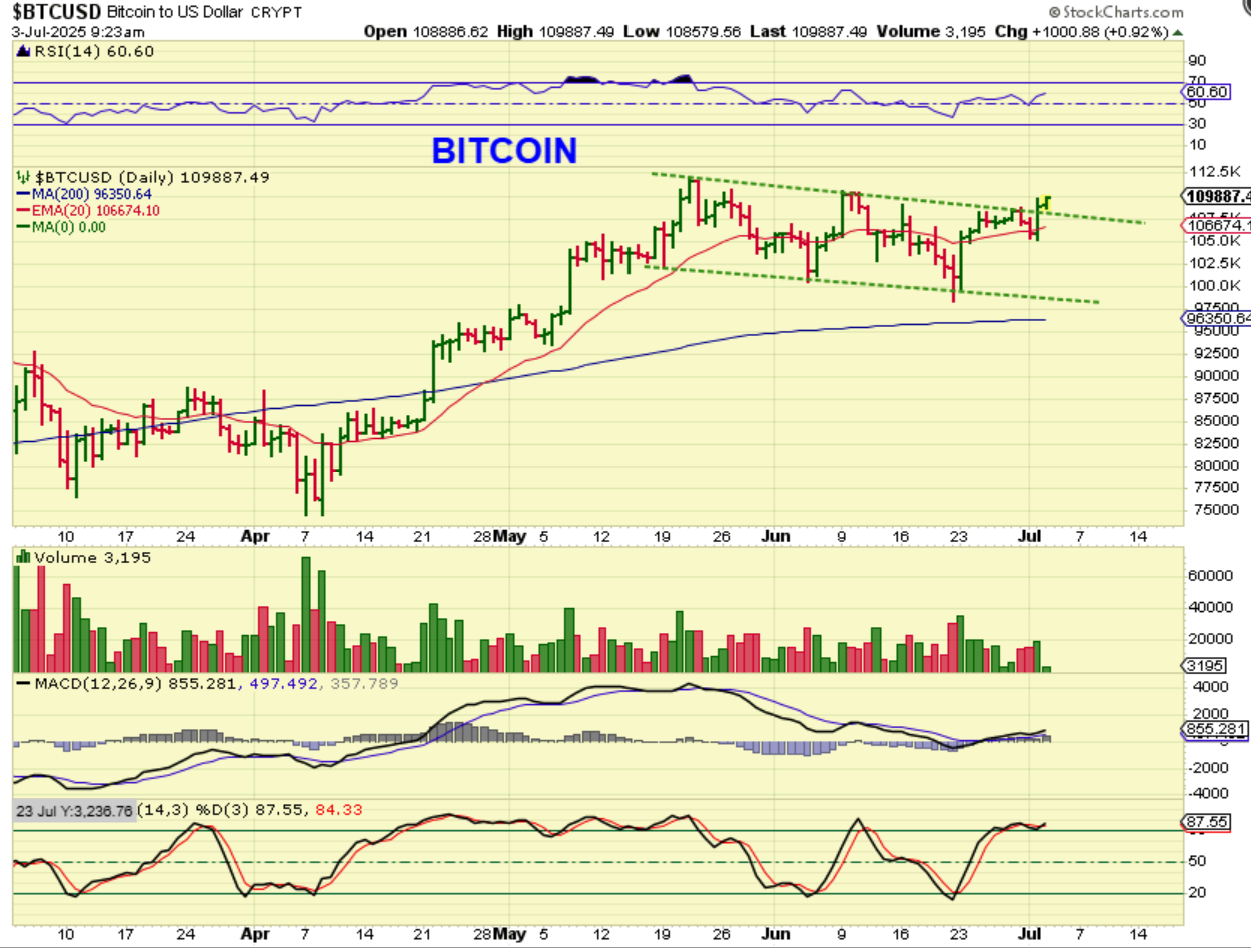
From Wednesdays report, I mentioned that with Crypto stocks being so bullish, we could expect that Bitcoin may reverse early and, rather than chop to the lows of the channel, it might reverse higher instead.
.
BITCOIN did exactly that. It reversed on that drop to the 20 ema and started to breakout above the trendline. Crypto stocks were leading and now the laggers were joining the part, so I discussed that & will address Crypto stocks again in this report.
.
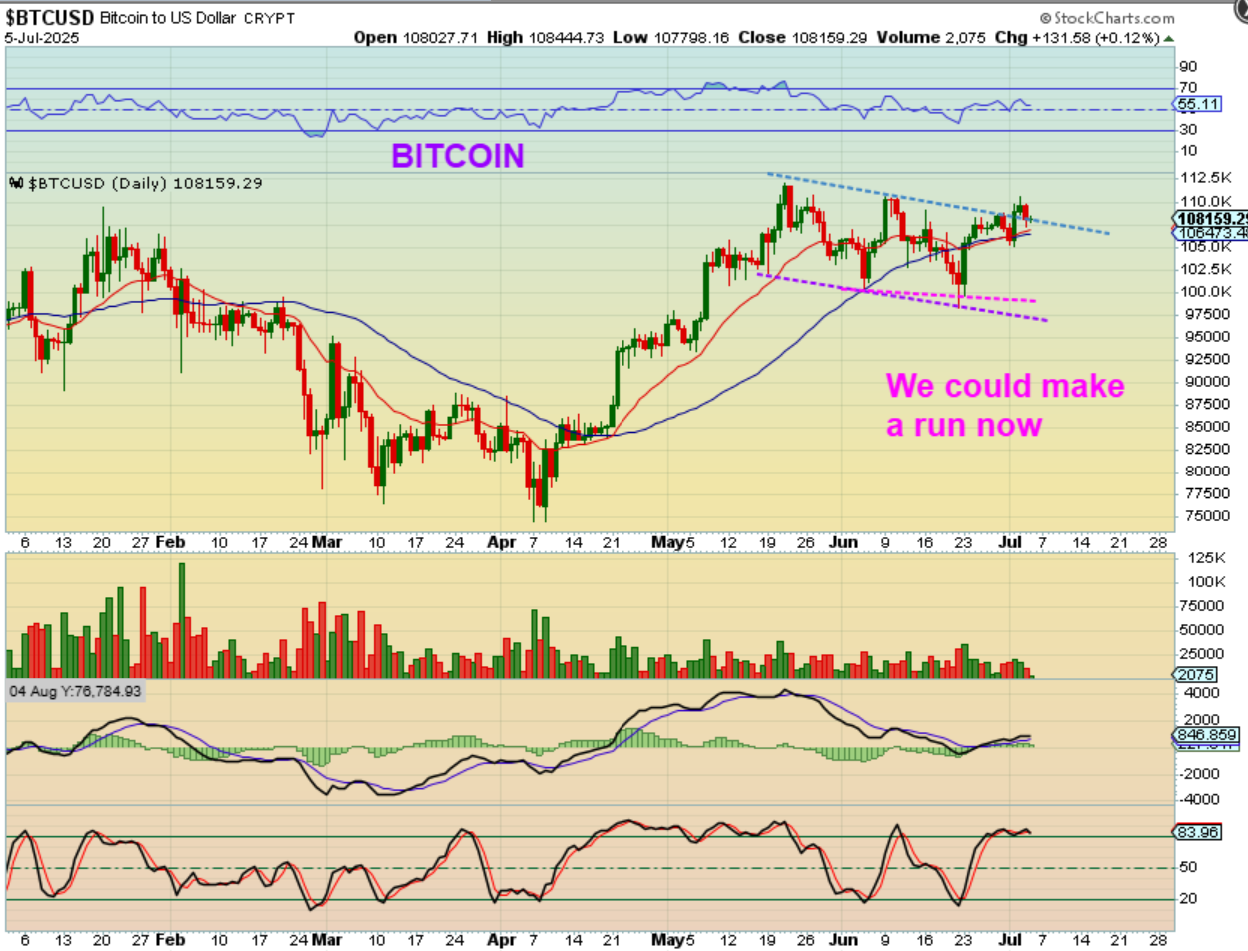
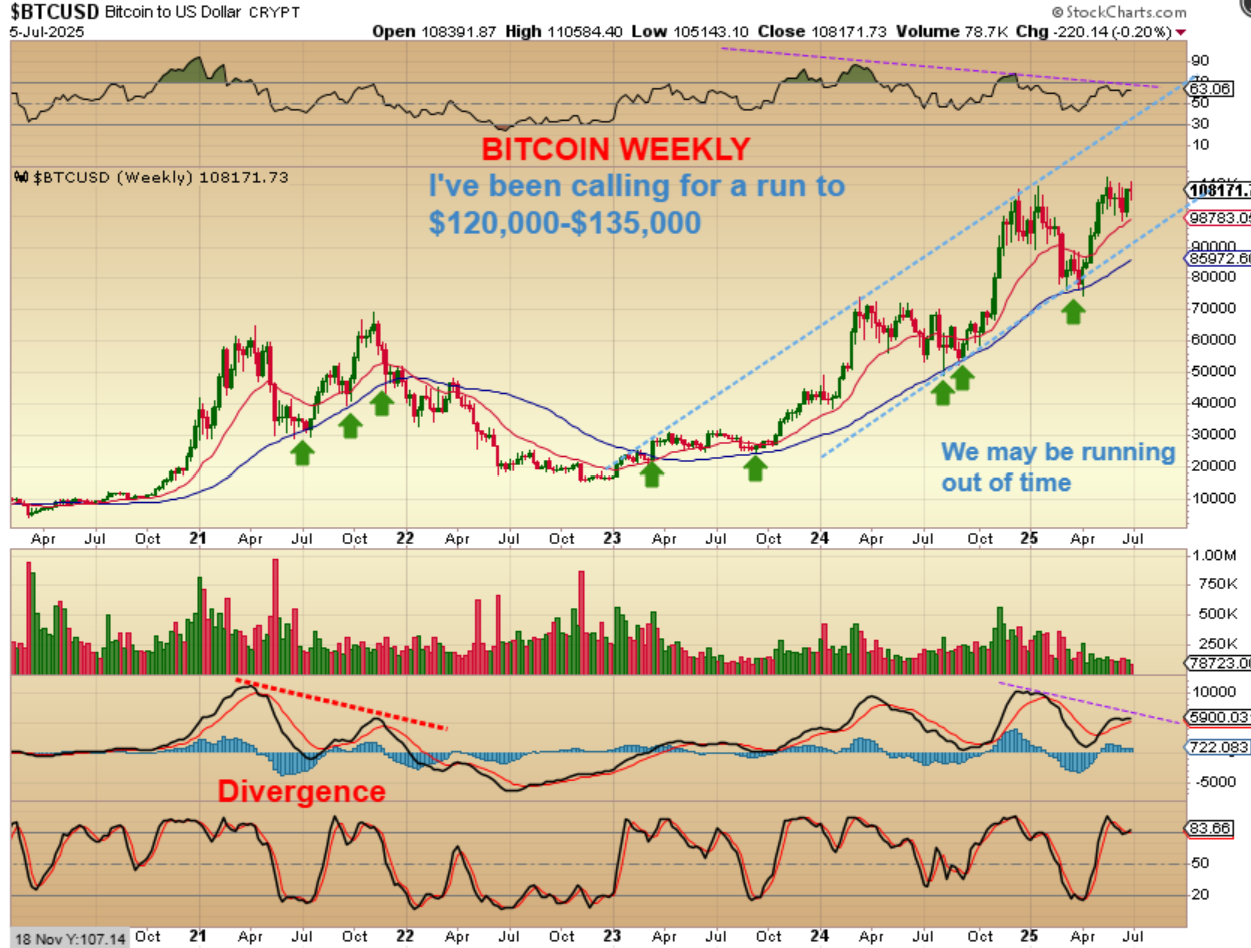
BITCOIN dropped over the holiday weekend and is starting to bounce. I have called for a run to $120,000- $135.000 for many months, but if too much time goes by, that hope will gradually fade. So we need another rally in 2025. I’ll explain…
.
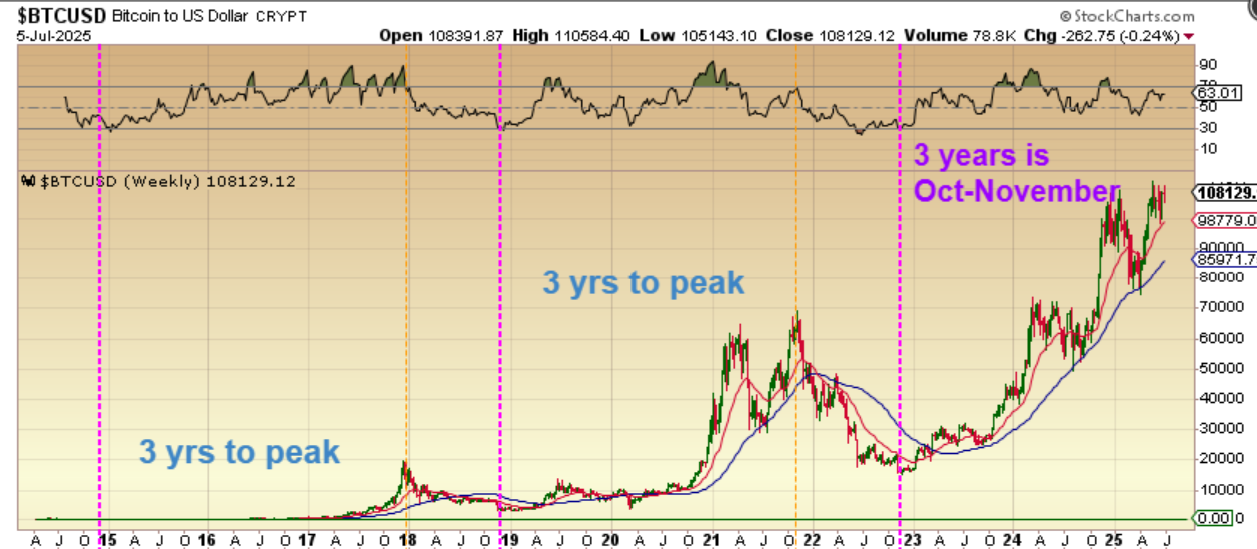
Using a 4 year cycle, you see the best gains in the first 3 years and often a crash lower in the 4th year. A lesson that I learned the hard way is that Bitcoin always looks VERY BULLISH at the 3 yr peak as it is at new all-time highs. It is often running to new highs and you can’t tell exactly when it wants to top, except that there is divergence at the new highs. Next: I have already said…
.
1. I have already said that our current double top is divergent, and it strongly resembles the last 3 yr cycle high. That does concern me deep down inside.
2. That said, we do have more ‘time’ in this 3rd year and the Crypto Miners are really perking up, so we may run to that $120,000+ and then top.
3. I repeat: Deep down inside, as a technical analyst, this chart does bother me, but I’ll just continue to keep an eye on it over time. We could still rally and peak in November. Crypto Miners look very bullish.
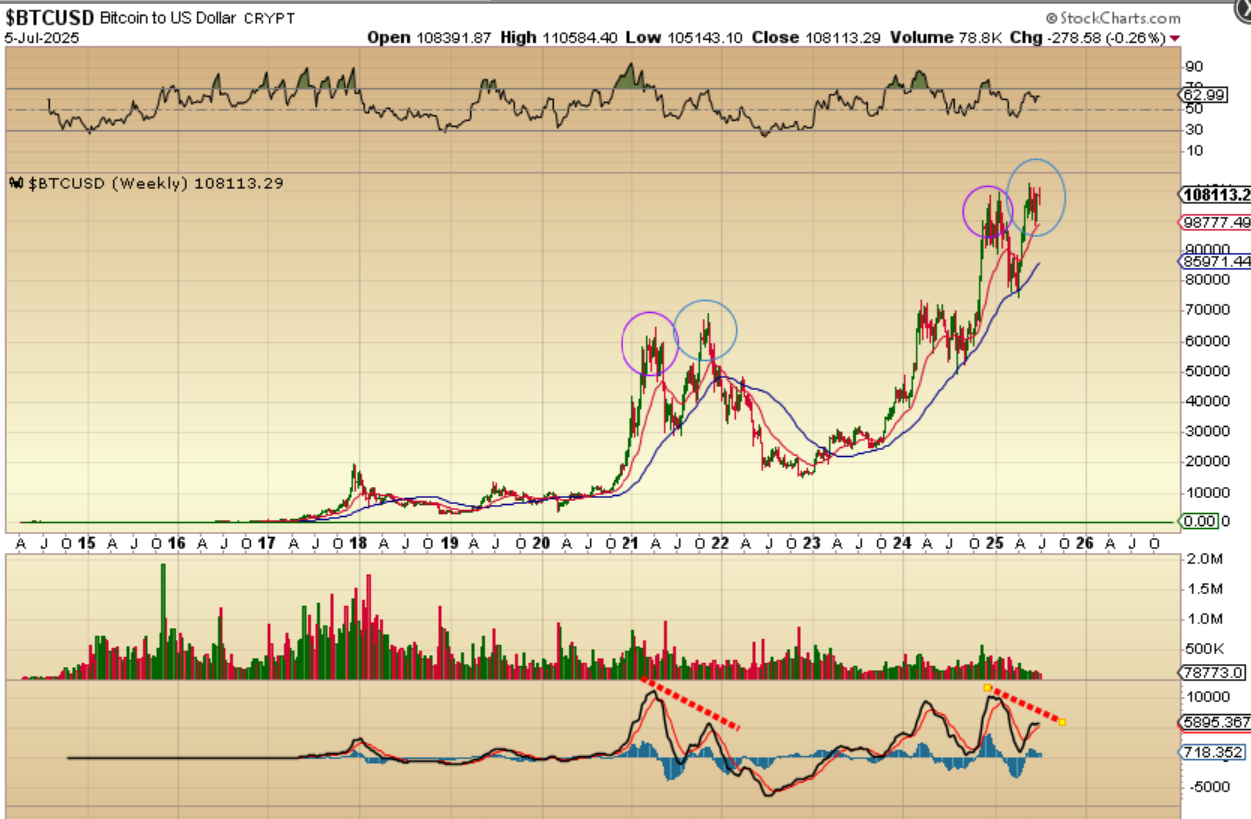
So the above chart shows the reason why I am saying that we are running out of time. 3 yrs ends in 2025. We did NOT run out of time yet, but we are in the 3rd year of 4 and I see possible warning signs in the RSI & MACD. BITCOIN needs to rally soon or it risks becoming another double top (like 2021).
.
NEXT I JUST WANT TO PUT ALL THE CHARTS THAT I HAD IN THURSDAYS REPORT IN THIS WEEKEND REPORT TOO. We discussed that Crypto Stocks really started to accelerate (IREN was having a great run & CIFR showed similar volume & potential) while some laggers were still in a buy position, so I’m just going to re-post this and you can choose to re-read it, just skim the charts, or just skip it.
.
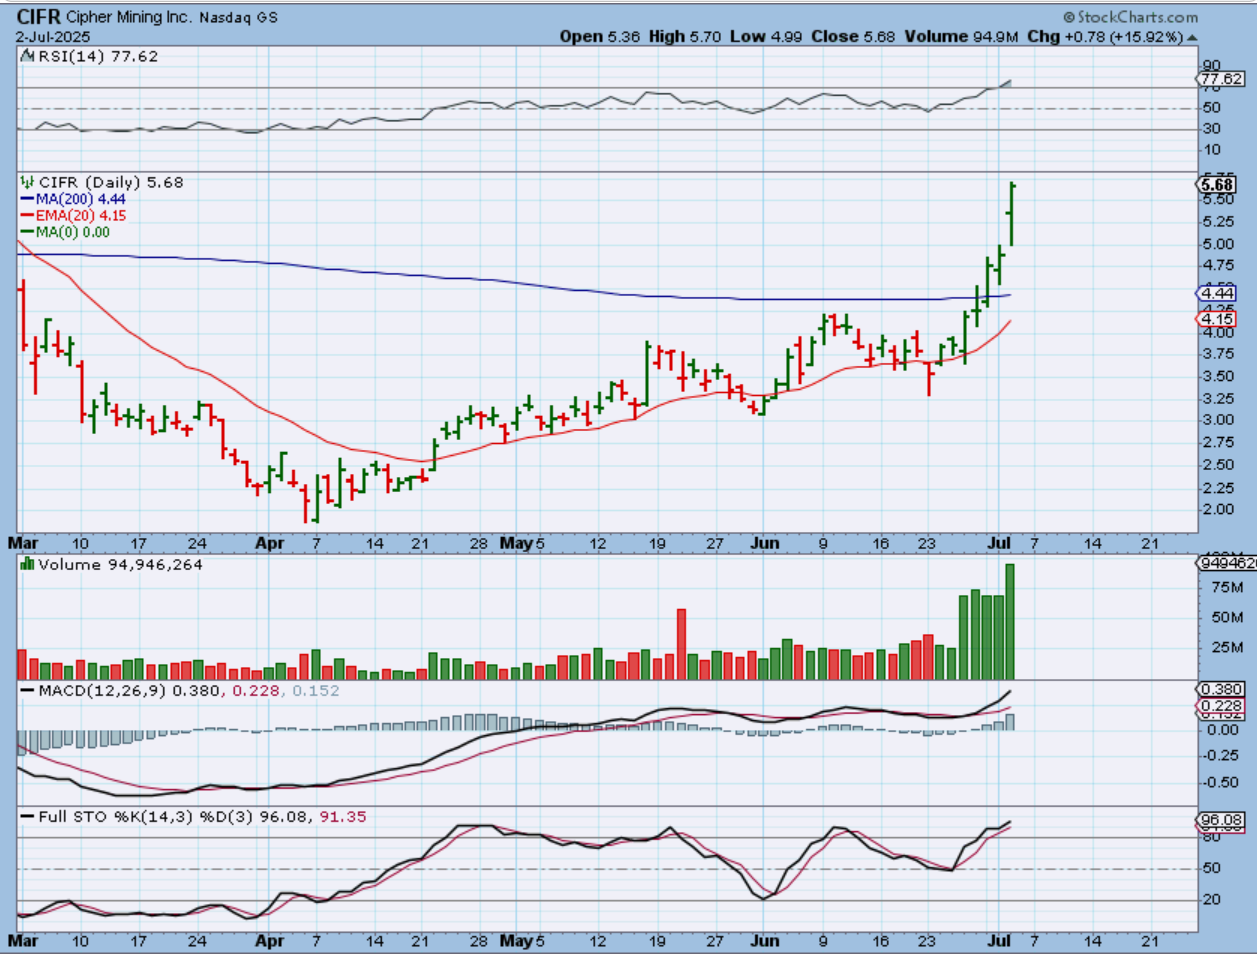
WEDNESDAY I POINTED OUT THE BULLISH RUN IN IREN (with huge volume) and said that I saw volume in CIFR, WULF, etc too. Look at this amazing run! I mentioned that others could follow, let’s discuss that again…
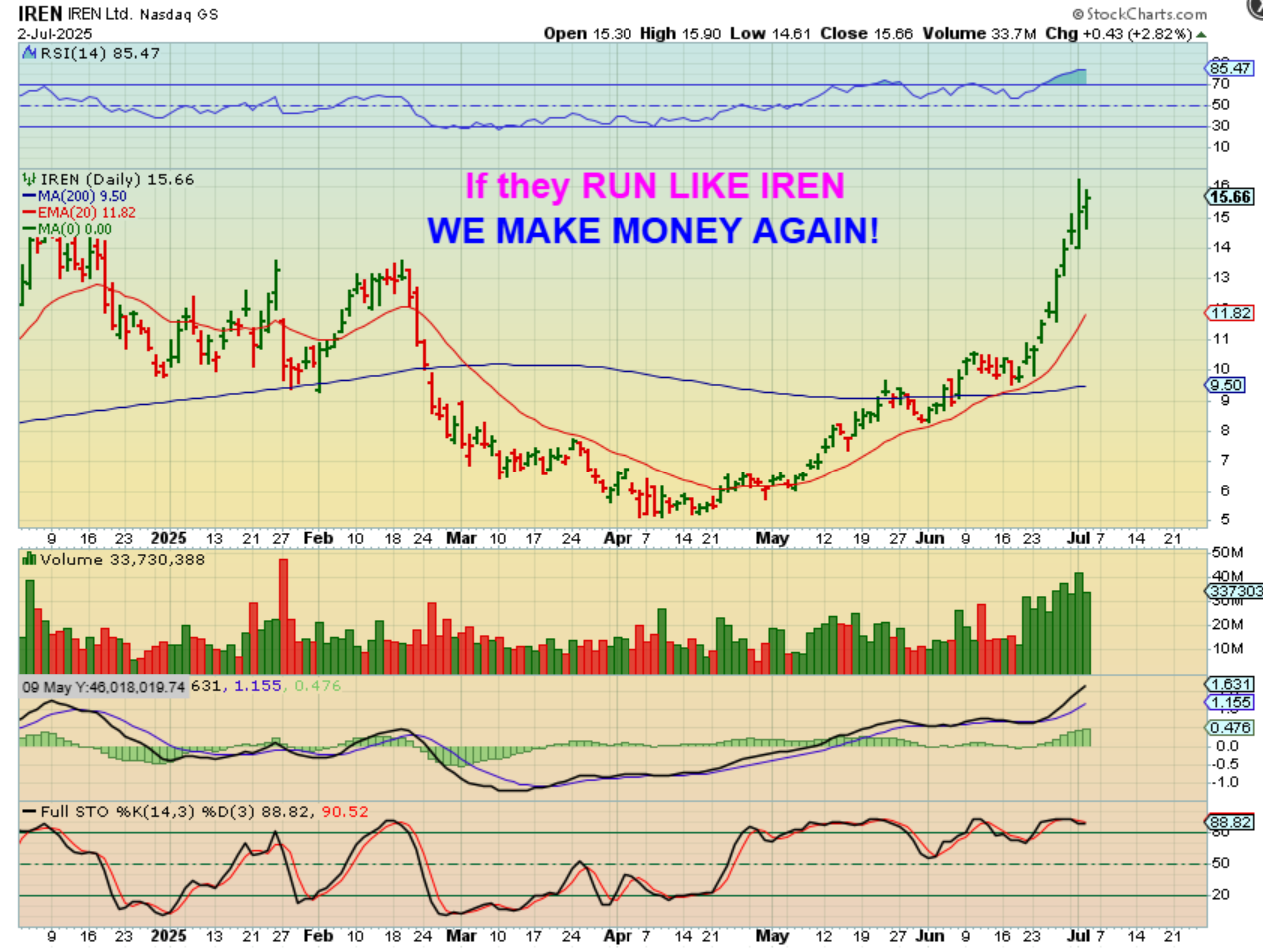
IREN gapped open 10%, and sold down, so I wrote in the comments…
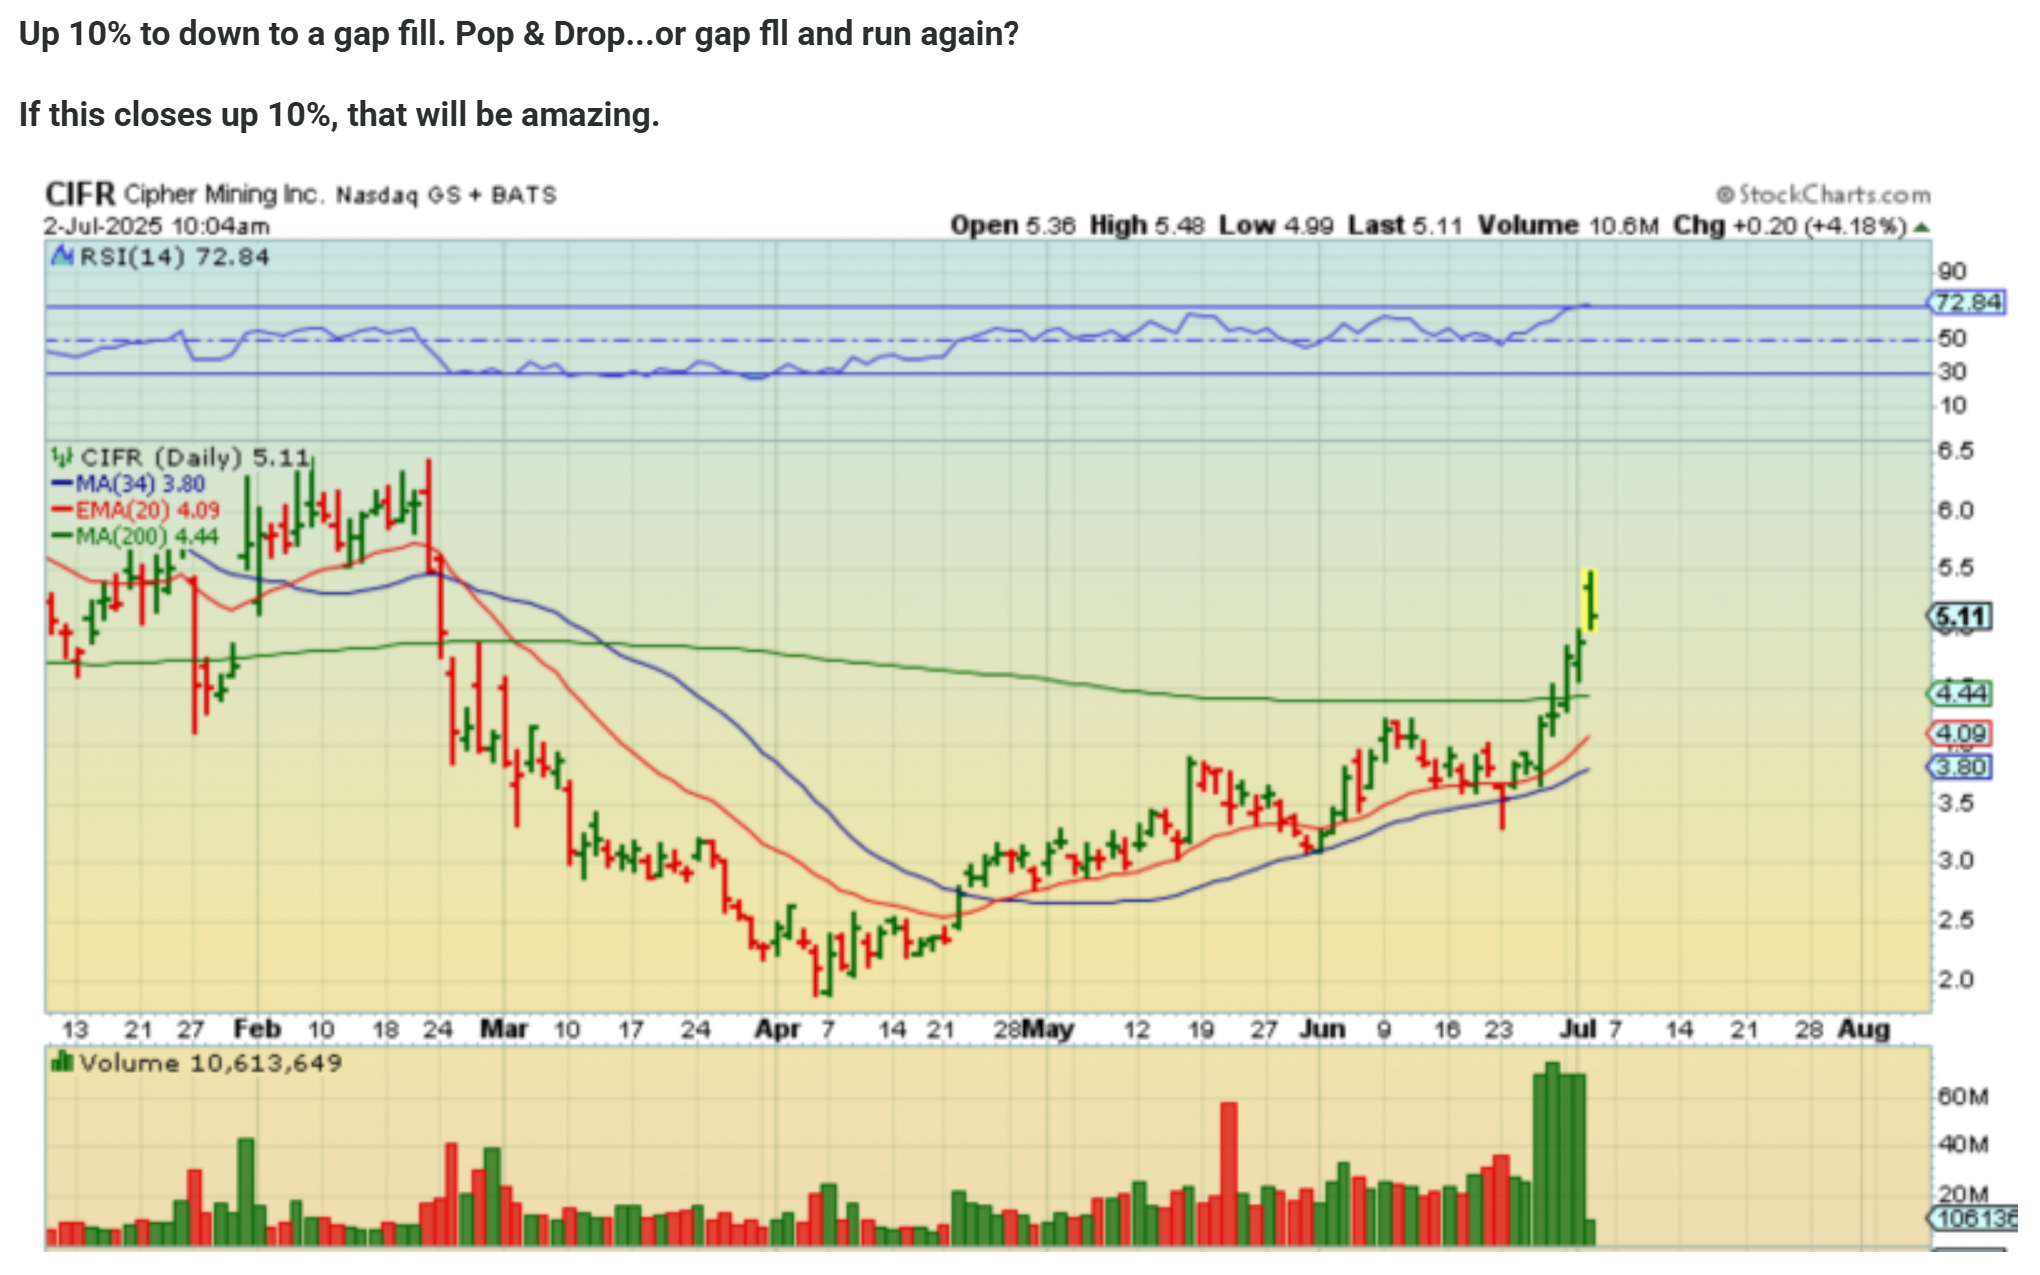
CIFR filled that gap and closed up 16%. MORE Than amazing 🙂 THIS GAP & REVERSAL WAS A GIFT OF A TRADE if you were paying attention. CIFR is starting to look like IREN, with the volume!
.
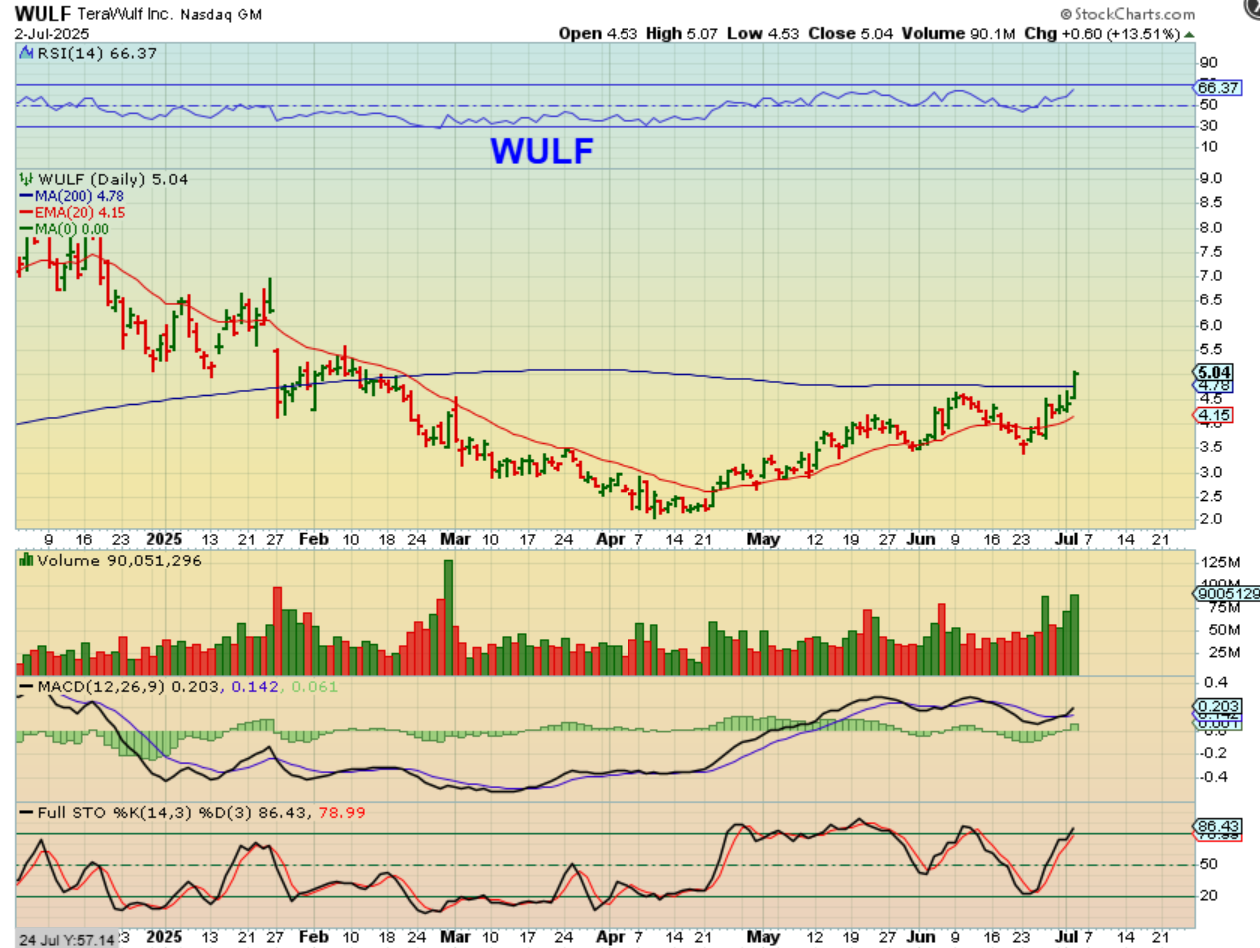
WULF was pointed out in yesterdays report as having volume spikes and a break of the 200sma is bullish. It broke out & closed up almost 14%. Congrats if you grabbed it at the open. This can run to prior highs like IREN too.
.
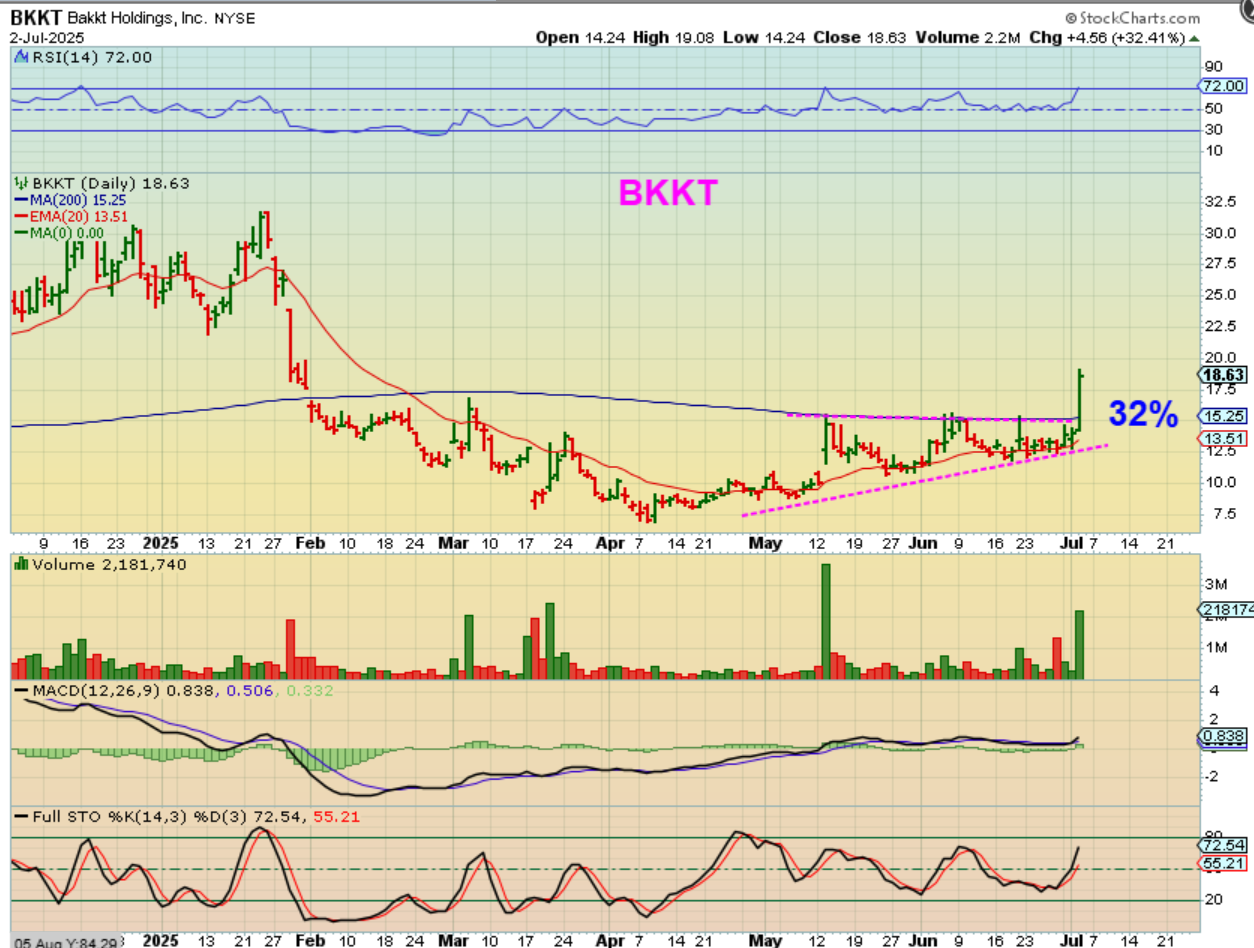
BKKT was a lagger that popped a meager 32% yesterday! That choppy difficult trading formed a bullish pattern – a wedge under the 200sma.
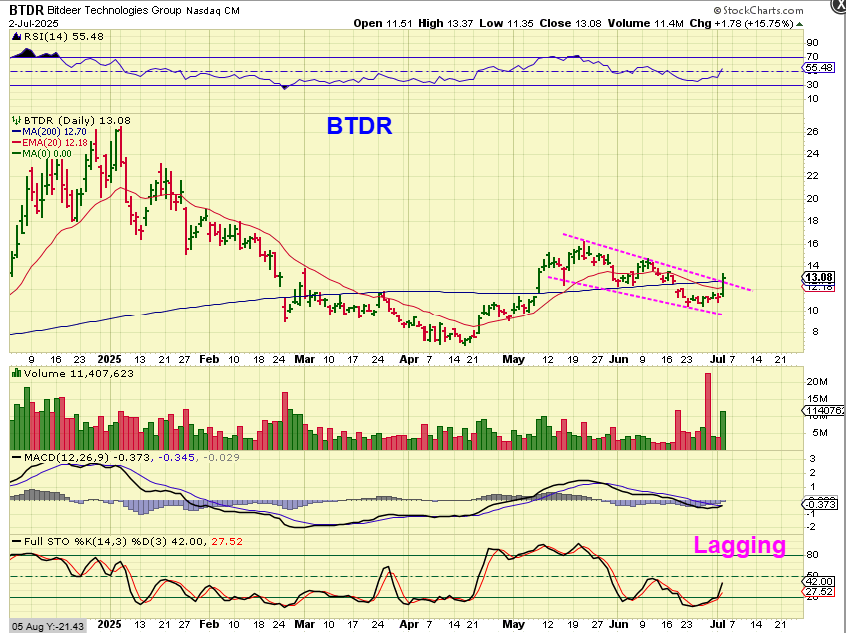
BTDR had a great run in April to May, but then dropped and was also a real lagger, but it just started to go yesterday. It was also up 15.75%
.
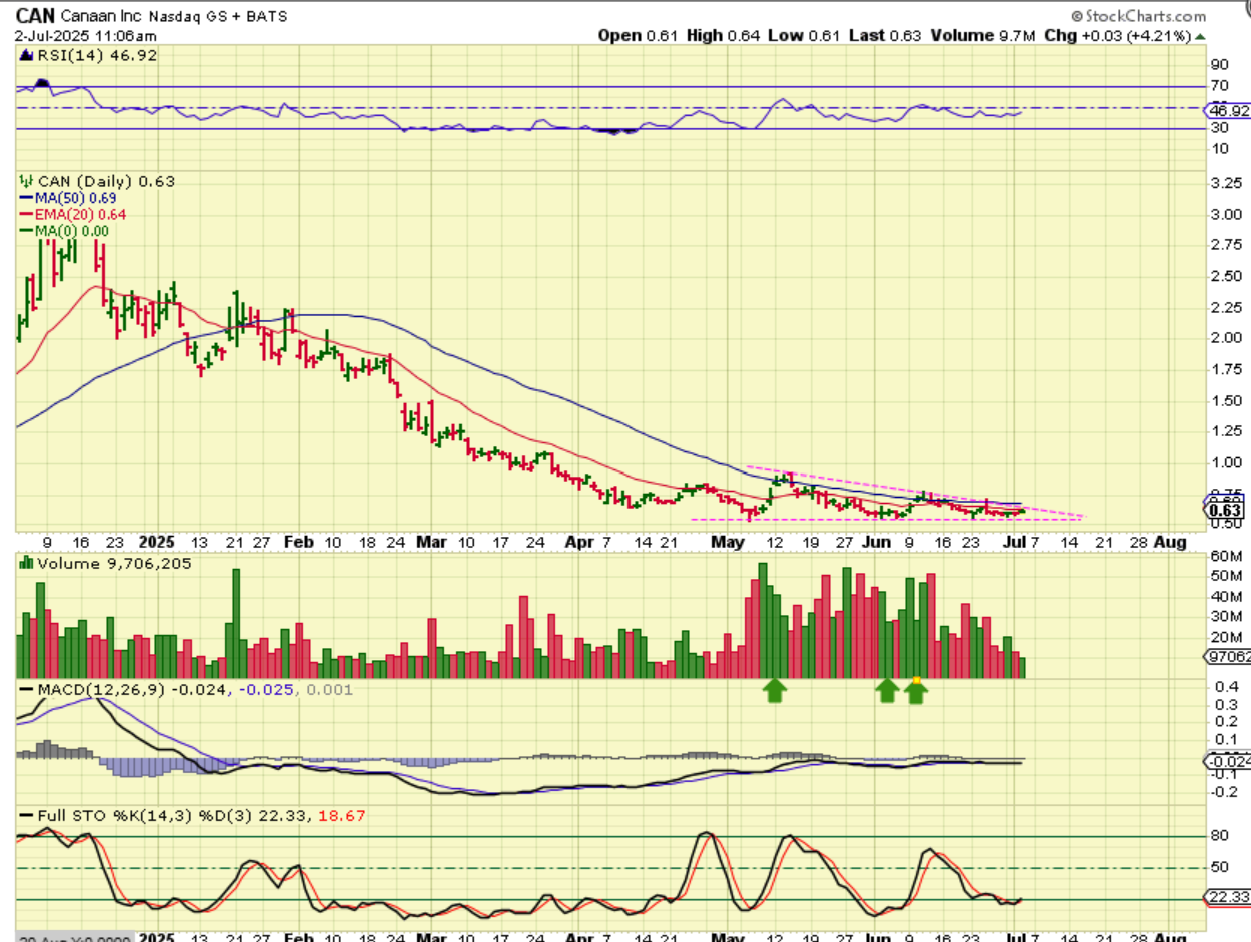
CAN has formed what I think could be a very bullish wedge. This could easily double or triple over time. Take a look at that volume! I think there could be risk, but I think there could be very strong reward. Buy here and wait or buy a breakout over the 50sma .
.
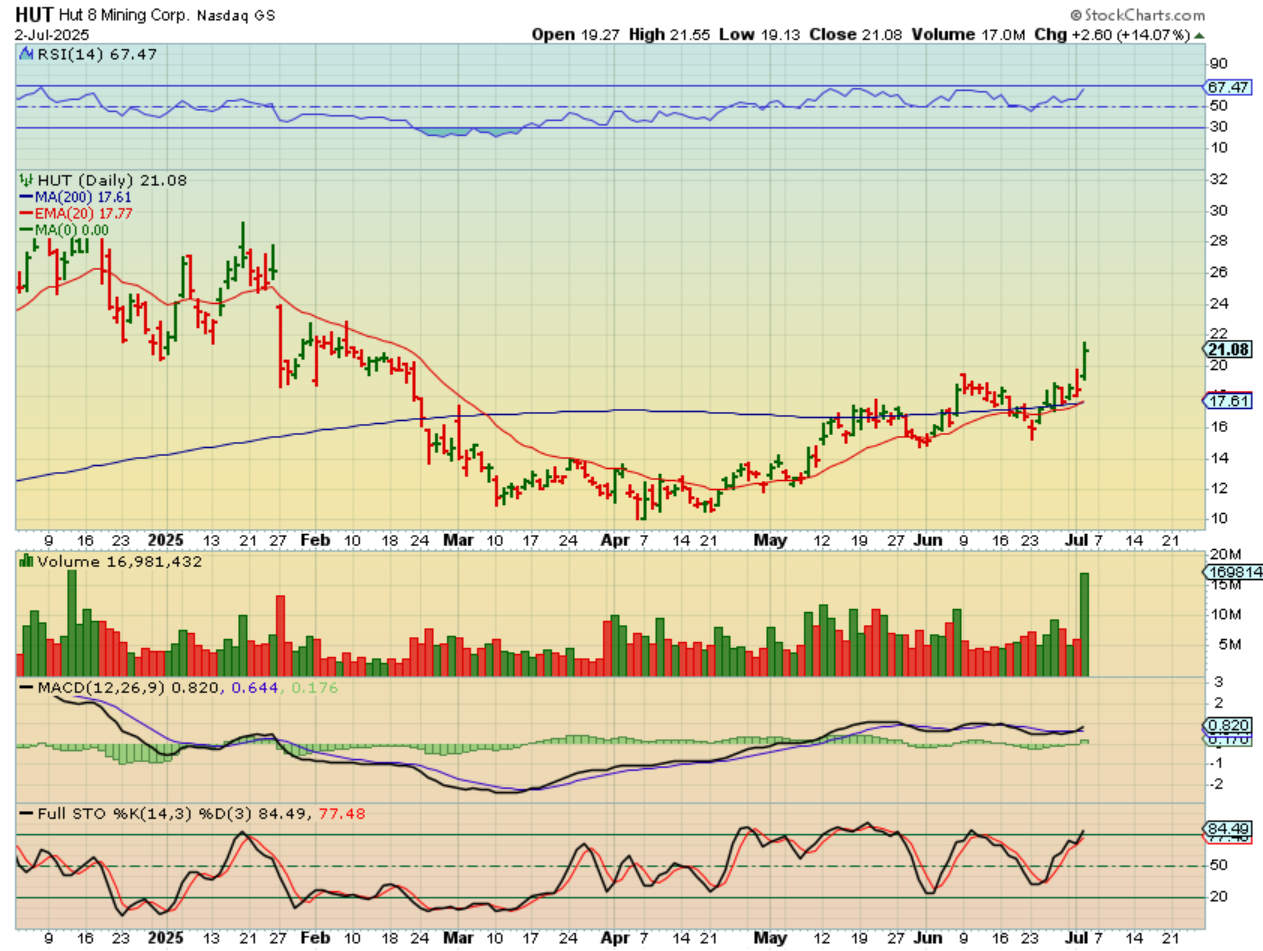
HUT popped 14% with very strong volume too. This volume in all of these has always been a good sign to me that this is a real move developing.
.
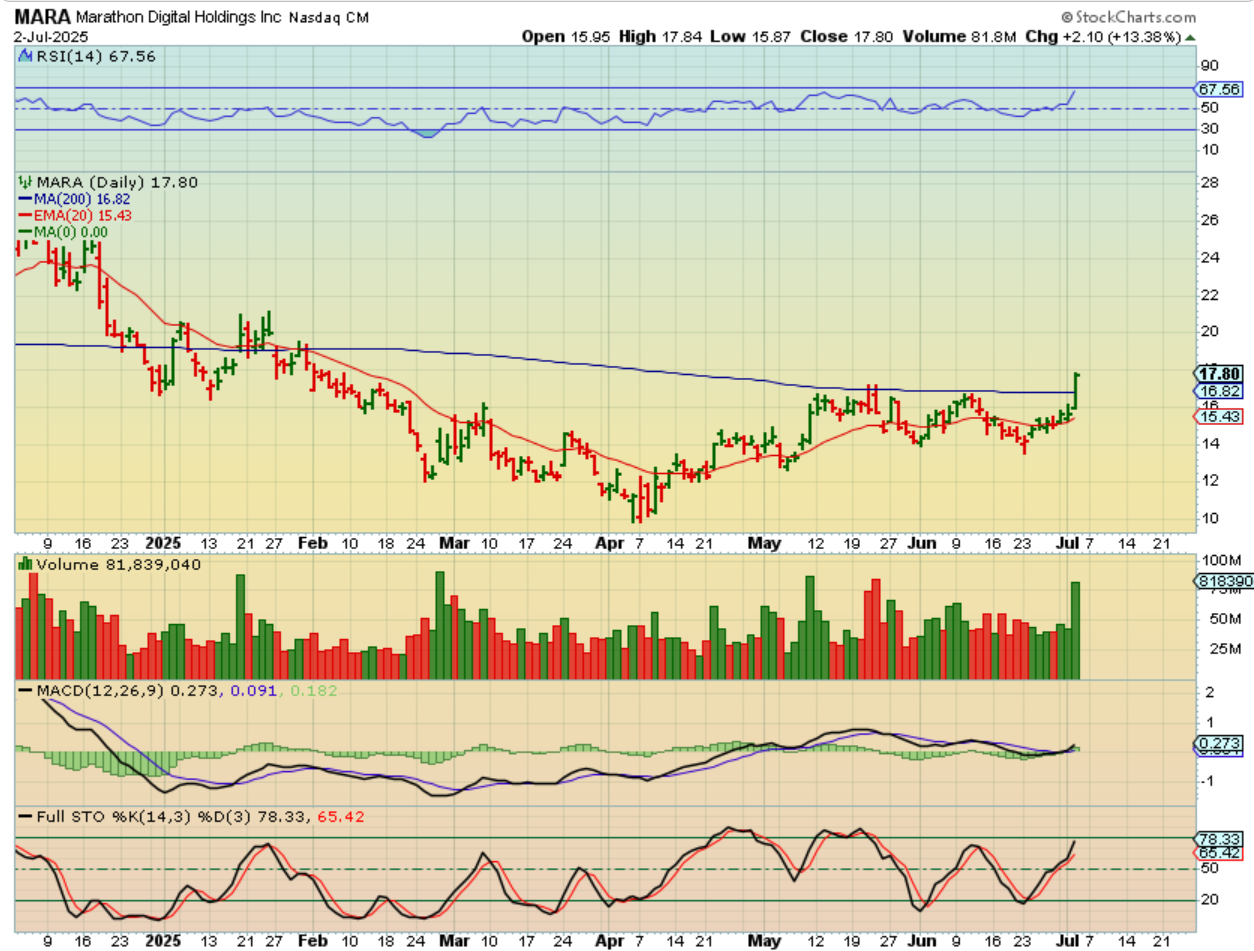
MARA broke out with strong volume too, closing up 13%.
.
So the Crypto Miners are acting bullishly and perking up at this time, possibly indicating that Bitcoin is ready to breakout and continue to run higher in this daily cycle.

