May 31st Weekend Report
.
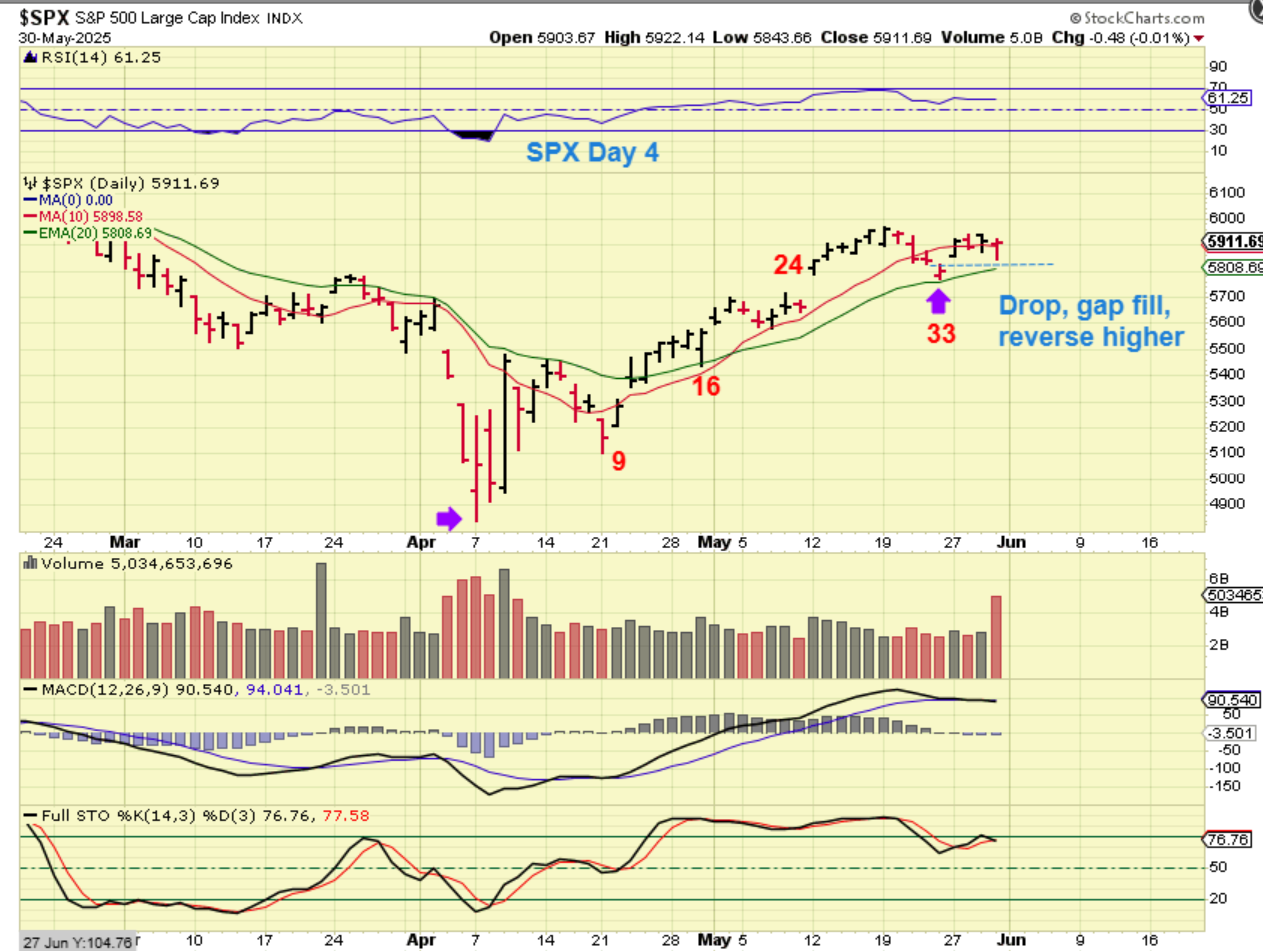
On Friday The SPX sold off in the morning and then buyers stepped in and it made its way back above the opening price. I still think that we have a mild day 33 dcl at the 20 ema and that was just a gap fill. I would expect the markets to move higher next week. Let’s take a look at the weekly charts…
.
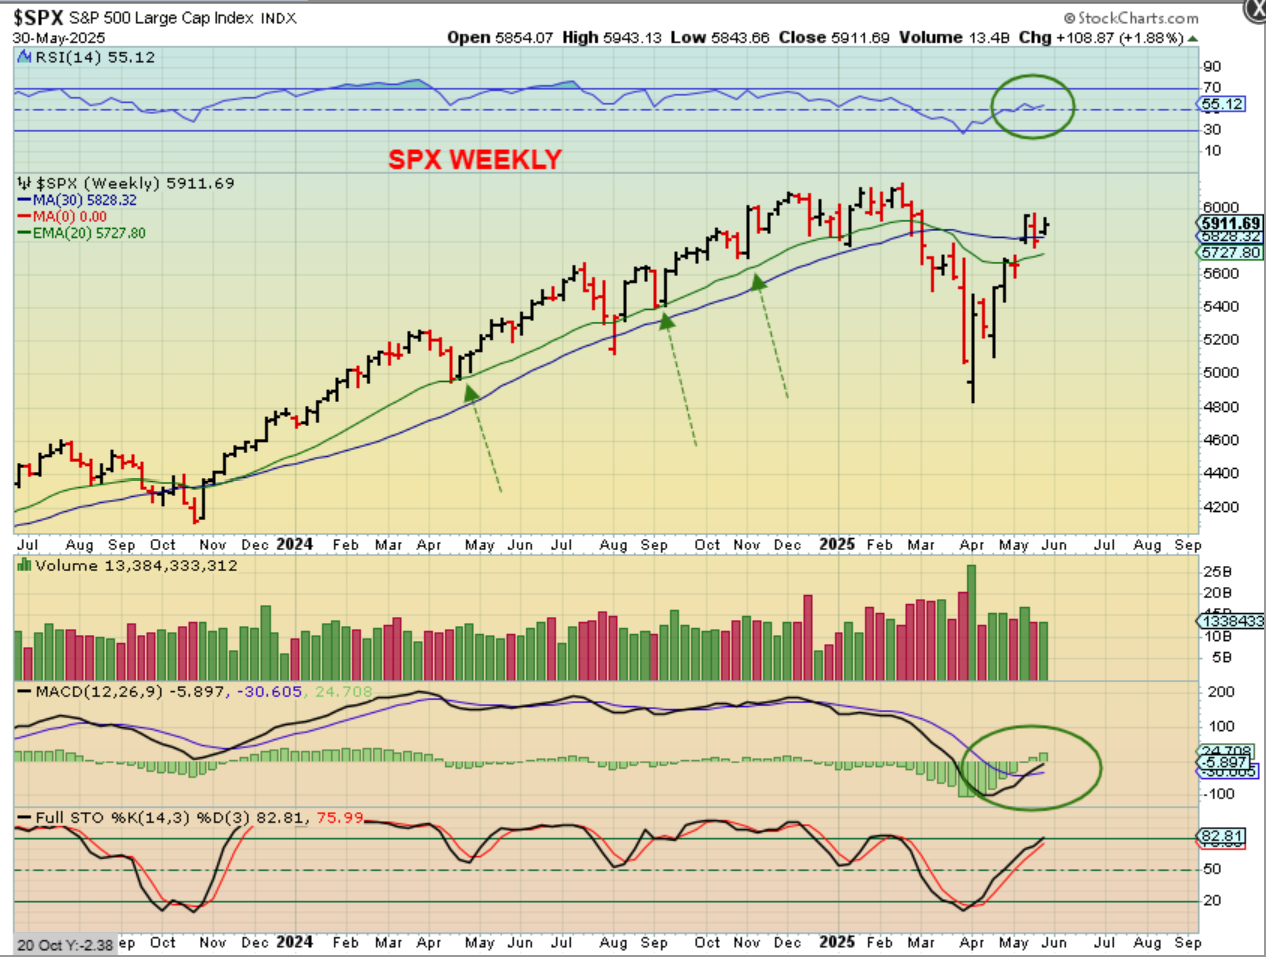
THE SPX WEEKLY – Price held above the blue 30 week ma. It could have fallen to the green line and been perfectly fine too, in fact, it still can drop there because that would be the 50sma, but I think we just had a milder dip and the markets should move higher from here.
.
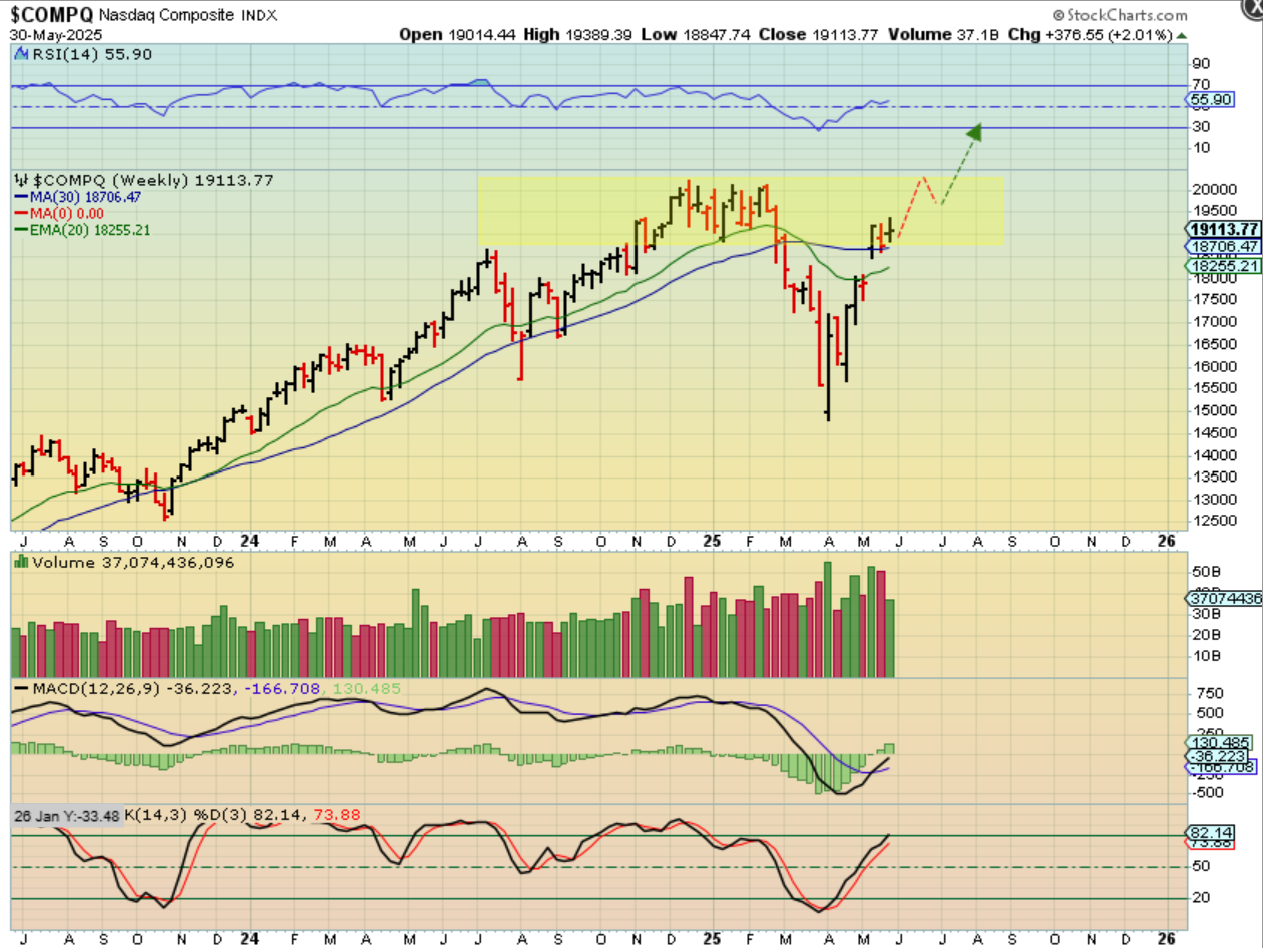
THE NASDAQ and Tech area looks a bit stronger to me. We sold off Friday and bounced back so that the weekly chart was actually up 2% or almost 400 points for the week. This makes me feel that buyers are accumulating or buying the dips.
.
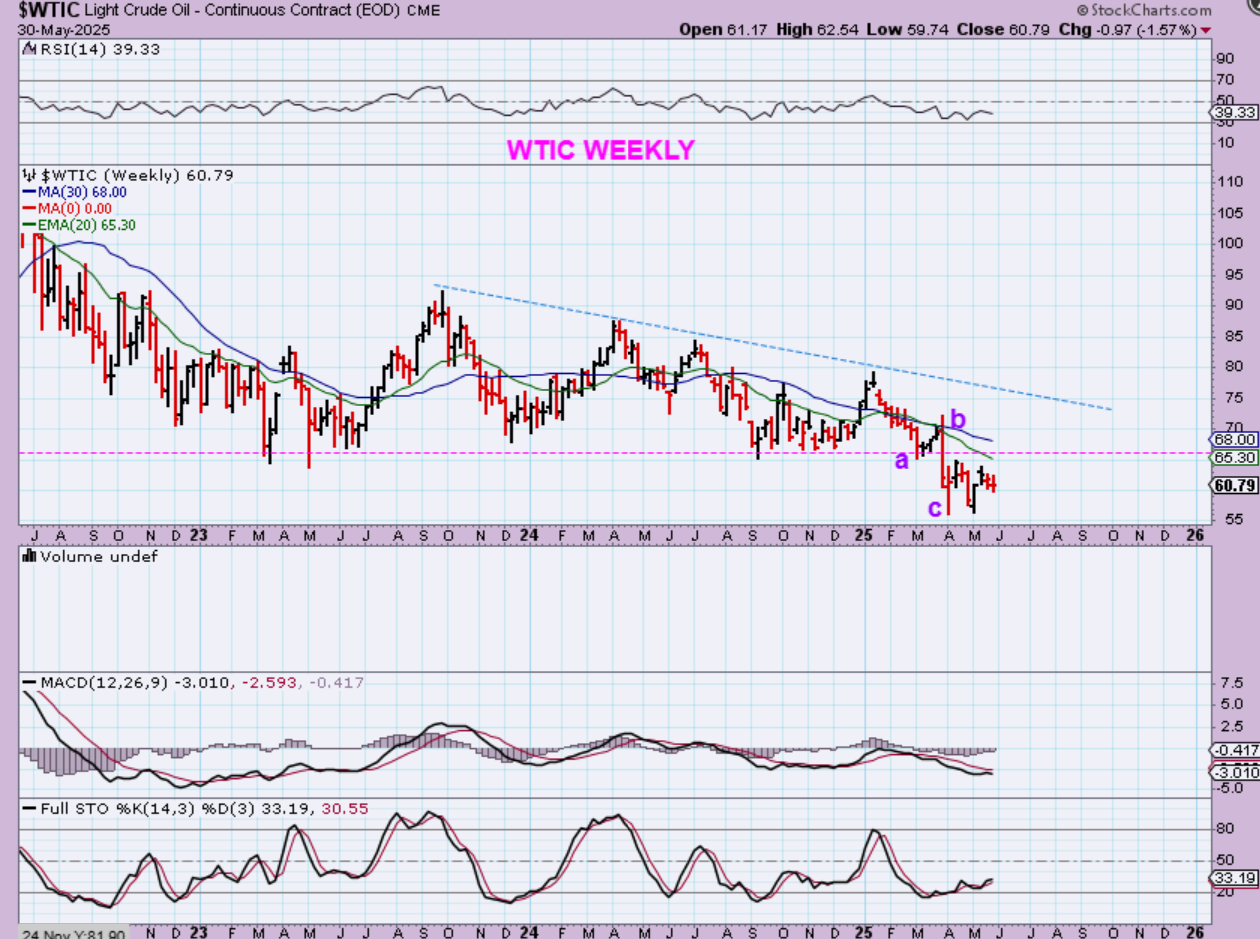
WTIC WEEKLY #1 – Oil dropped in a-b-c fashion from January into April, so that is an ICL. The first daily cycle has been choppy and unable to break back above the former support level.
.
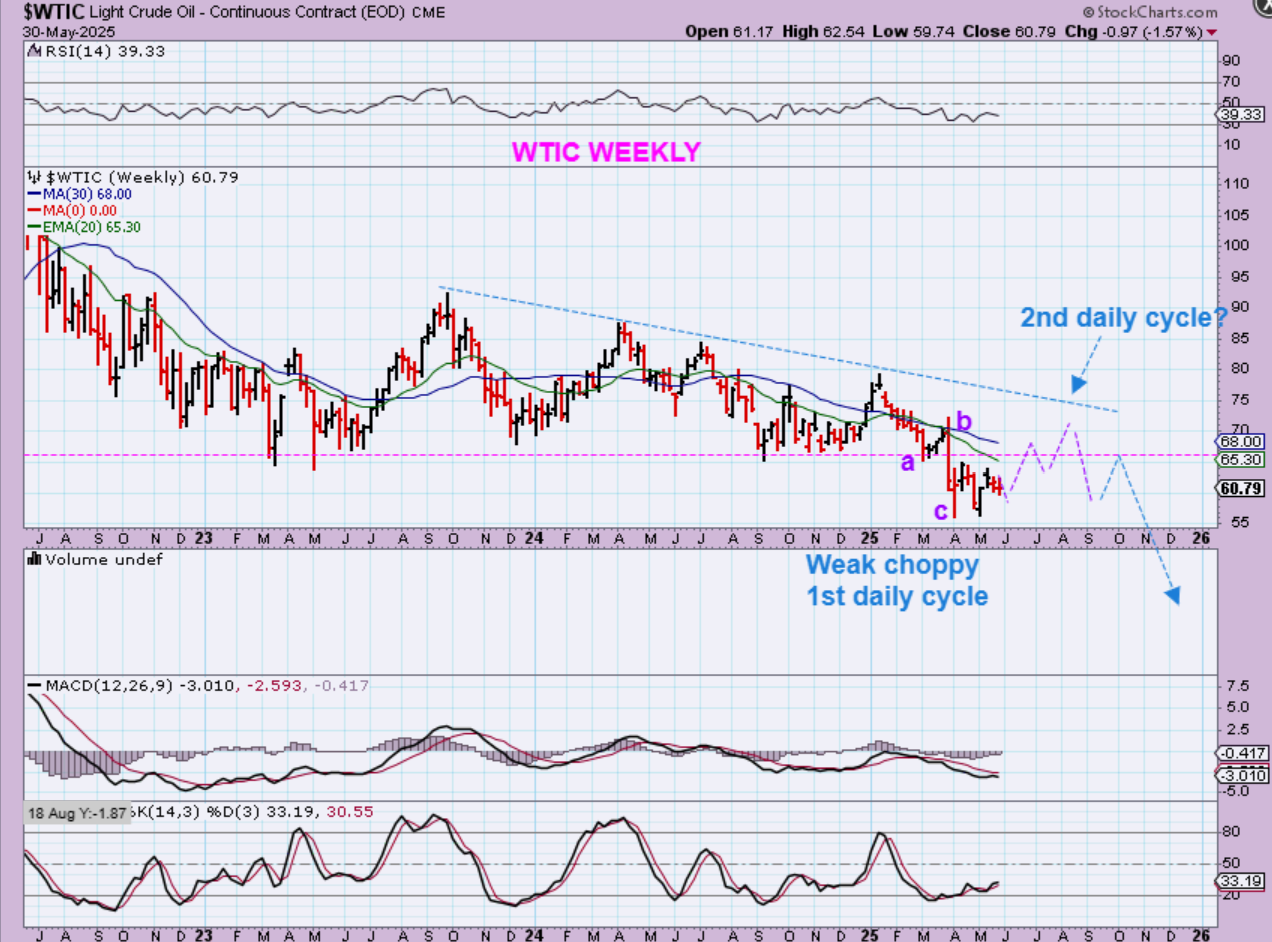
WTIC WEEKLY #2 – t is possible that the 2nd daily cycle shows some strength, but I still think that Oil will chop around and drop lower eventually. I drew that possibility here.
.
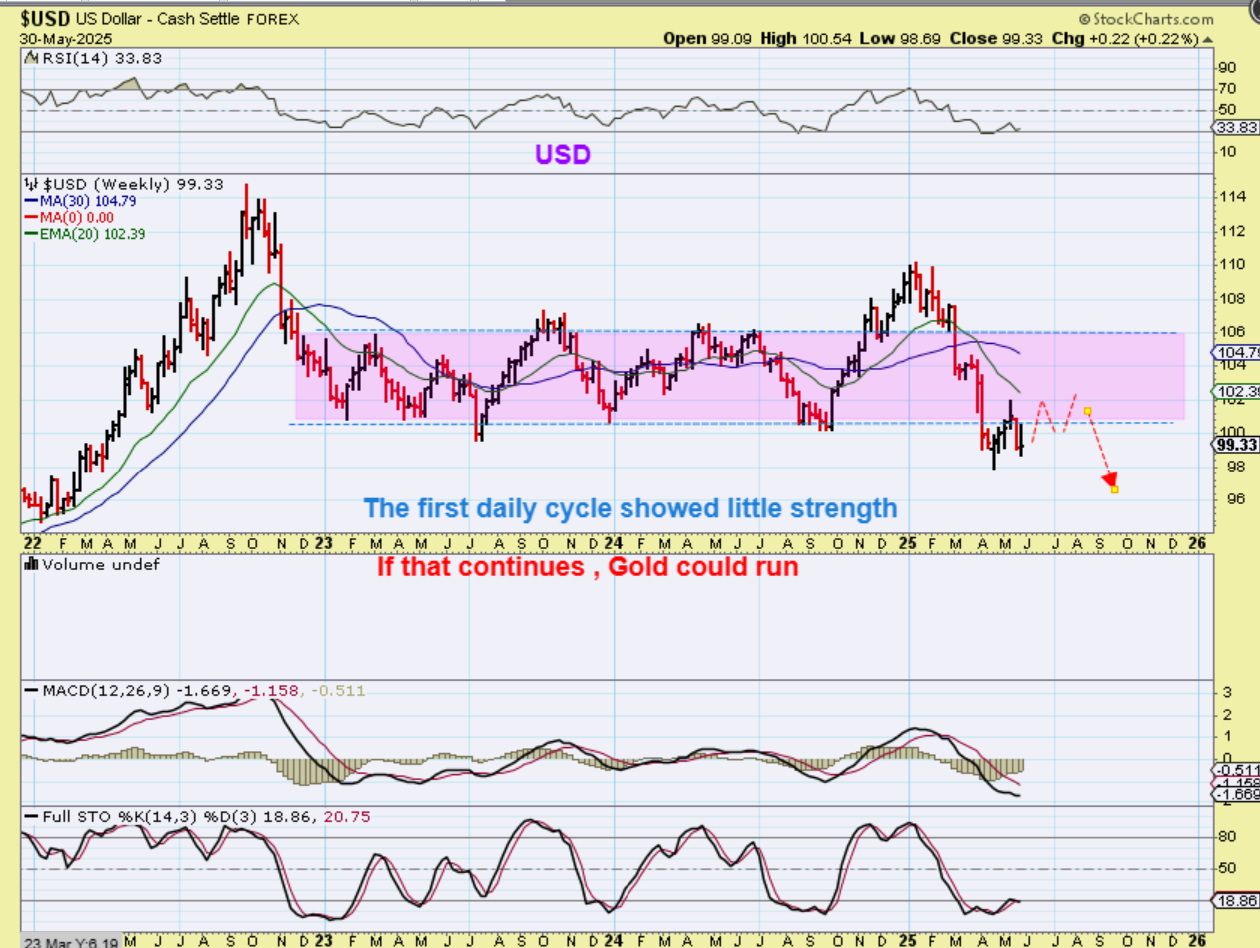
The USD sold off from January to April too, while Gold rallied from January into April.
It is hard to say whether The USD will strengthen like it has coming out of the past ICLs, or will it just chop around and roll over, but rolling over would allow Gold to rally even higher. Let’s take a look at that idea as a possibility…
.
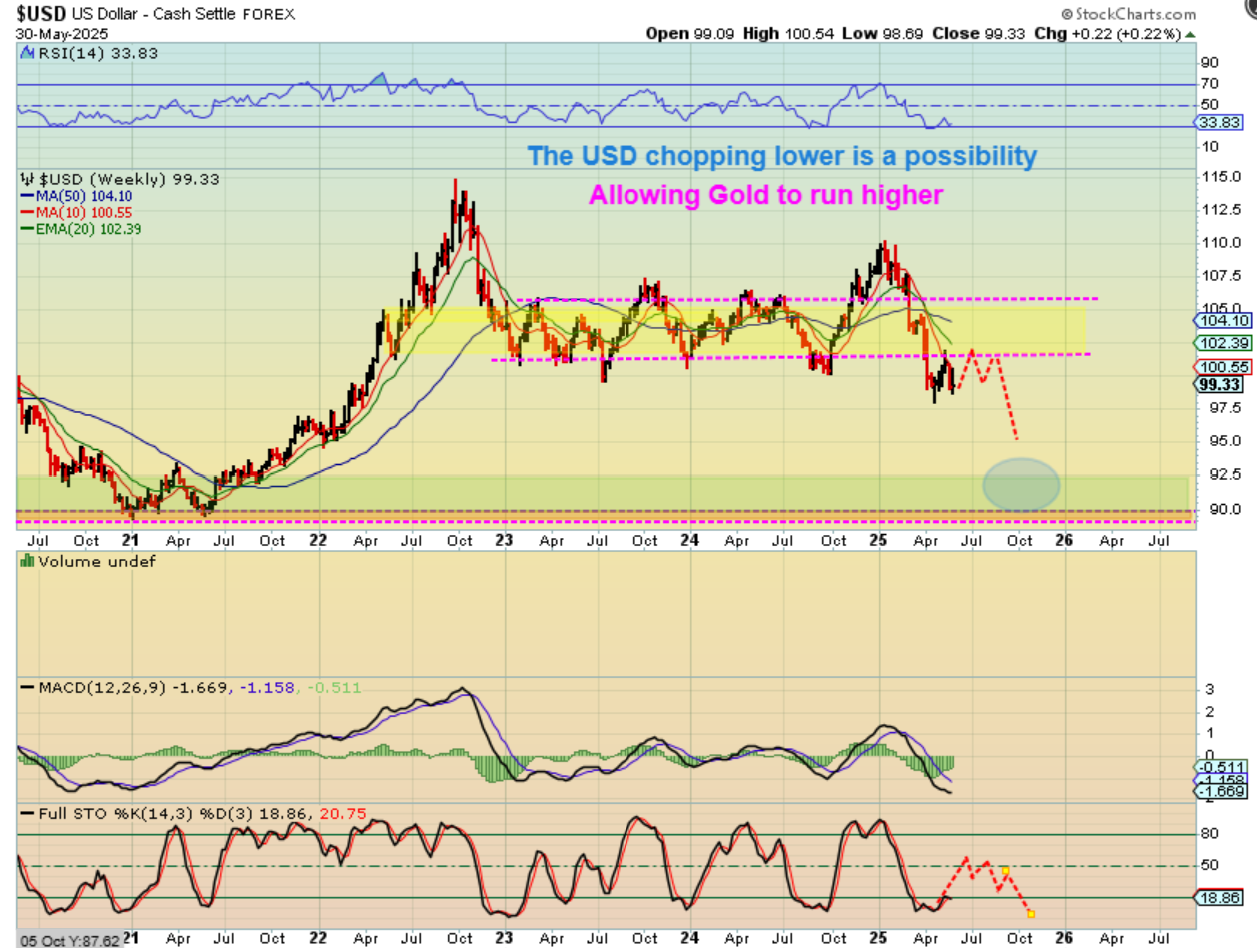
The USD is oversold and can chop higher from here, but it may be held back by the strong line of resistance. It could then roll over as drawn here. This is obviously possible, since the USD was down at 90 in 2021. This could allow Gold to run to $4000 or even $5000 over time.
.
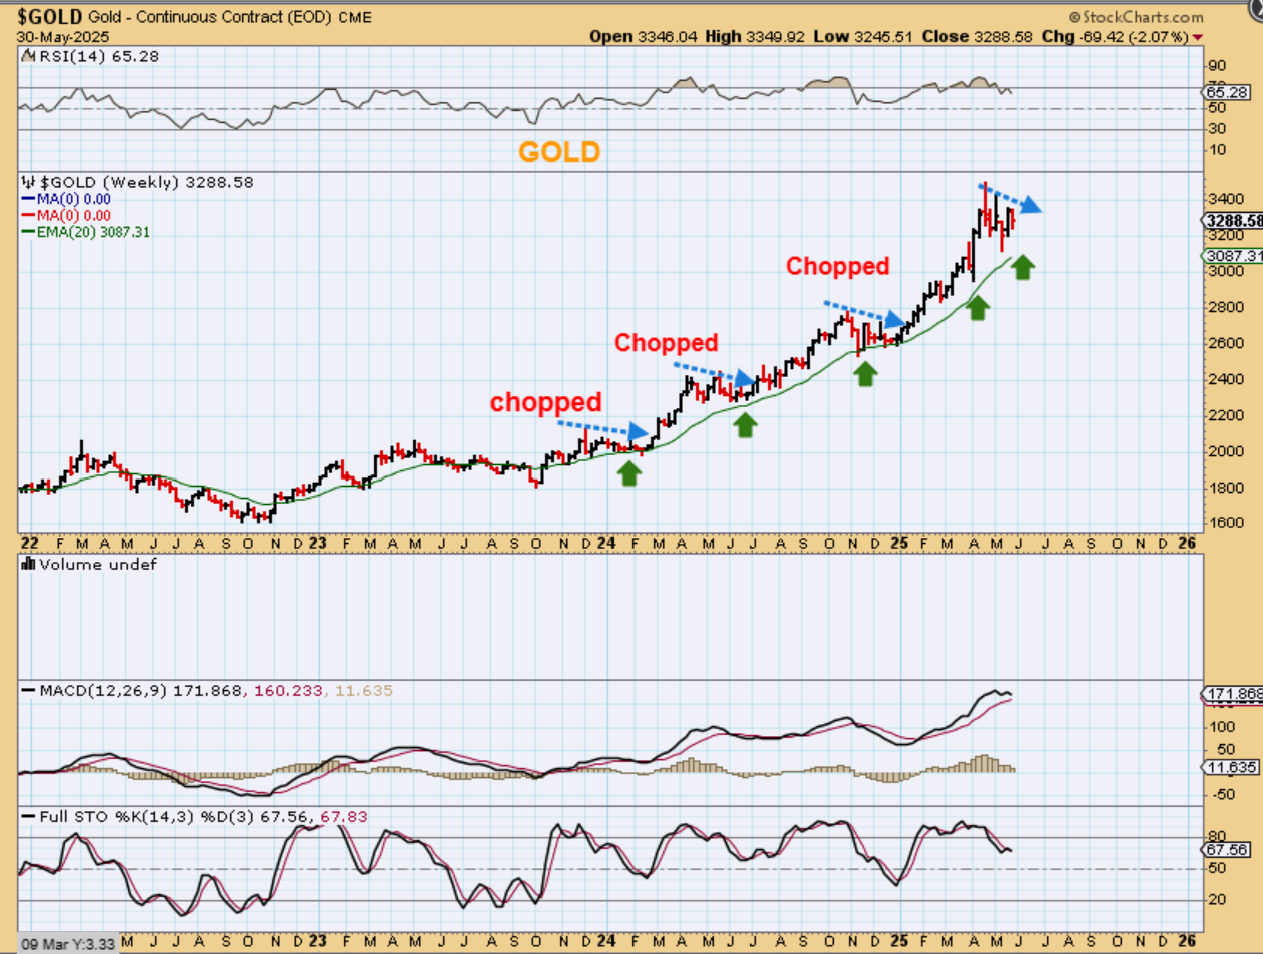
So then we have our Big Picture of GOLD:
Notice that instead of deep sell offs into ICLs, Gold has chopped sideways, moved over toward the weekly 20 ema, and then rallied higher. I also noticed that the last 2 spike lows down toward the 20 ema did not quite tag it, so it is possible that the current spike low of May could be the current short-term low in place. In fact, both of those spikes were down to the 50sma and then they reversed.
.
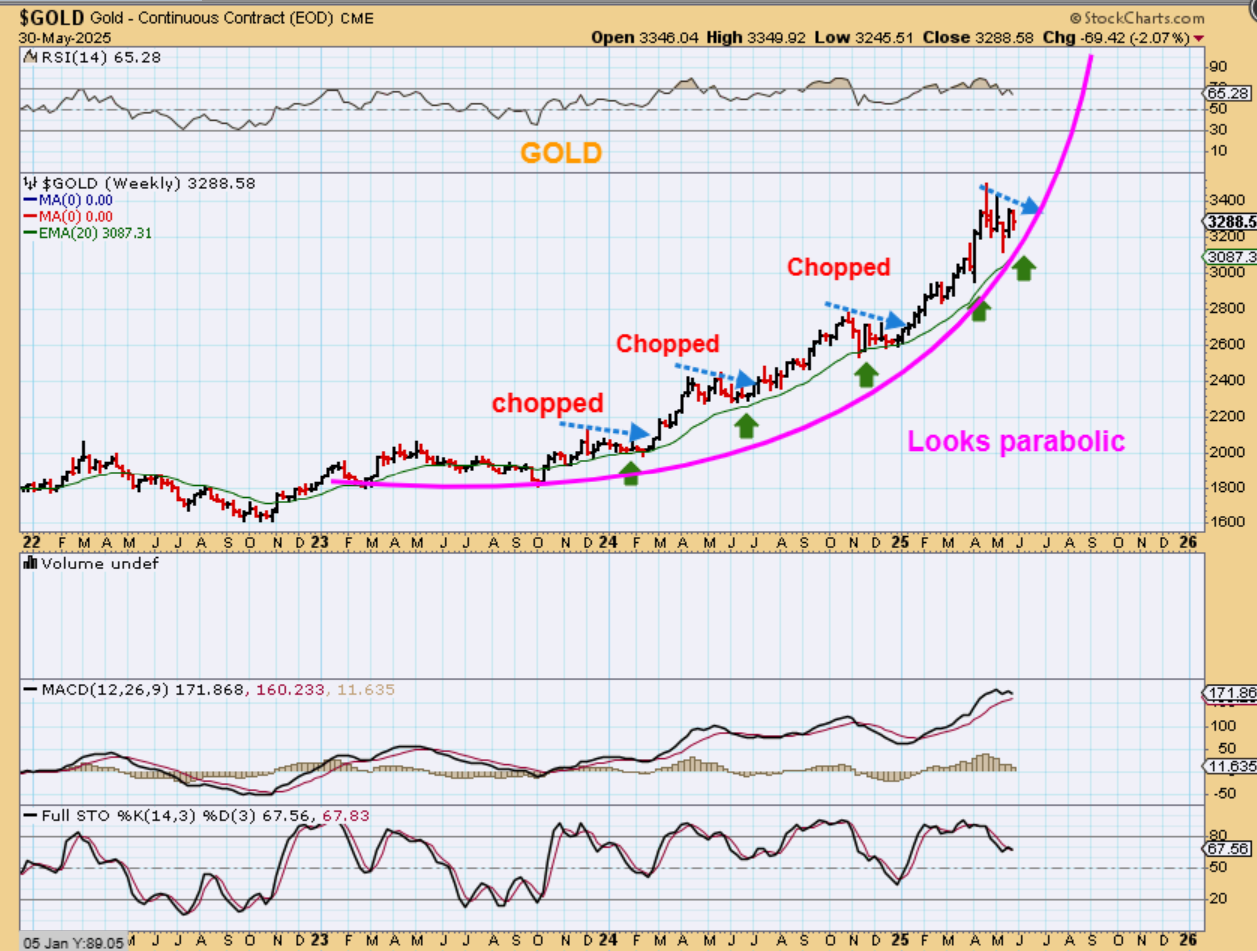
We also have been discussing the parabolic nature of the rally in GOLD.
This can cause the dips to be milder as the curve becomes more steeply inclined. So when I look at this chart, I do see that Gold still has room to move sideways or lower to the green 20 ema and remain very bullish. That said, Gold may remain choppy for a bit longer, but it can accelerate at any time too, in a parabolic run higher.
.
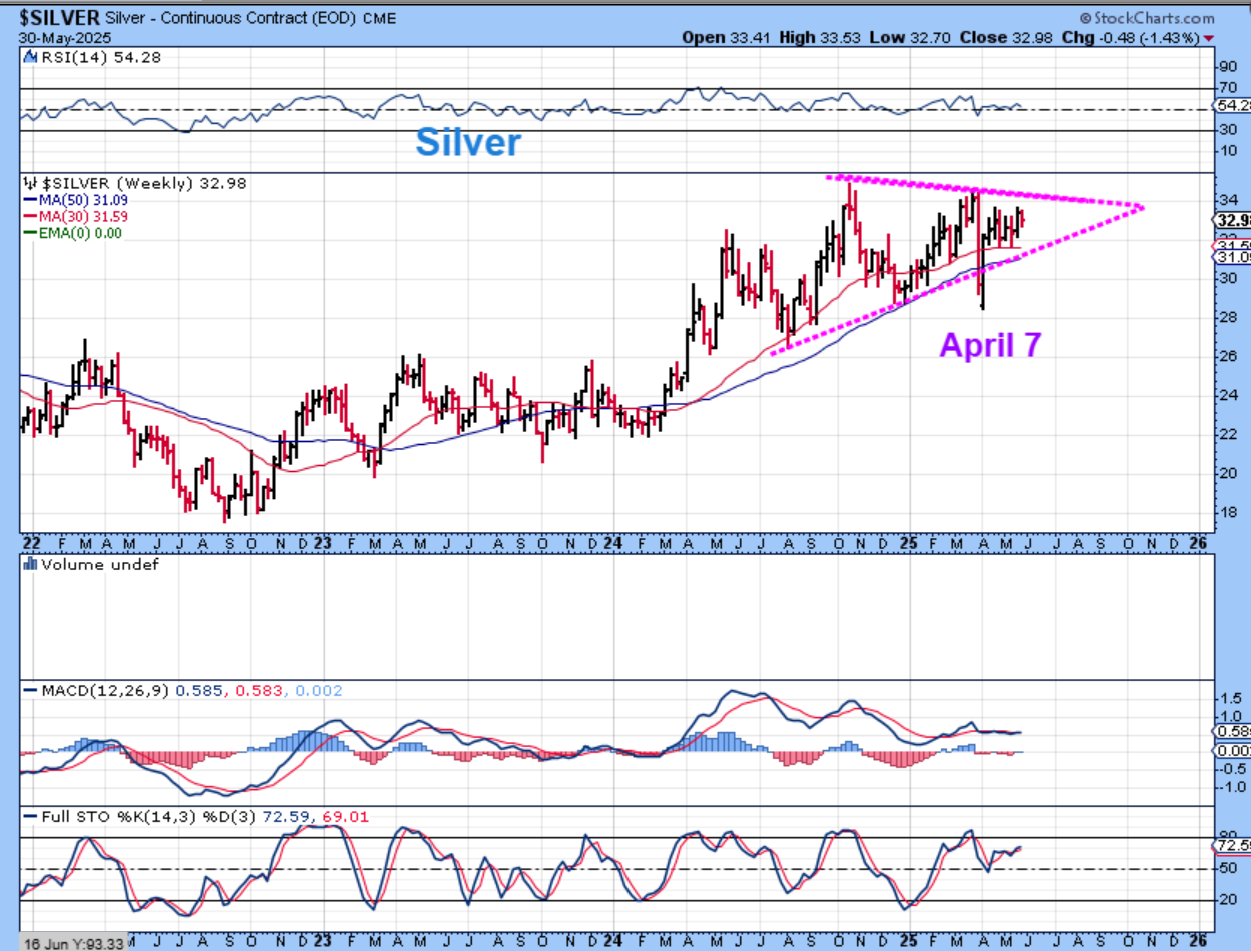
SILVER has been very choppy, and that is frustrating when we see Gold ramping up to new highs repeatedly, but this also can be a constructive tightening consolidation or a triangle formation that is developing. April 7 also may be the ICL, as pointed out in the daily reports, when discussing the Platinum set up. Also, another thing to consider when it comes to Silvers choppy consolidation is…
.
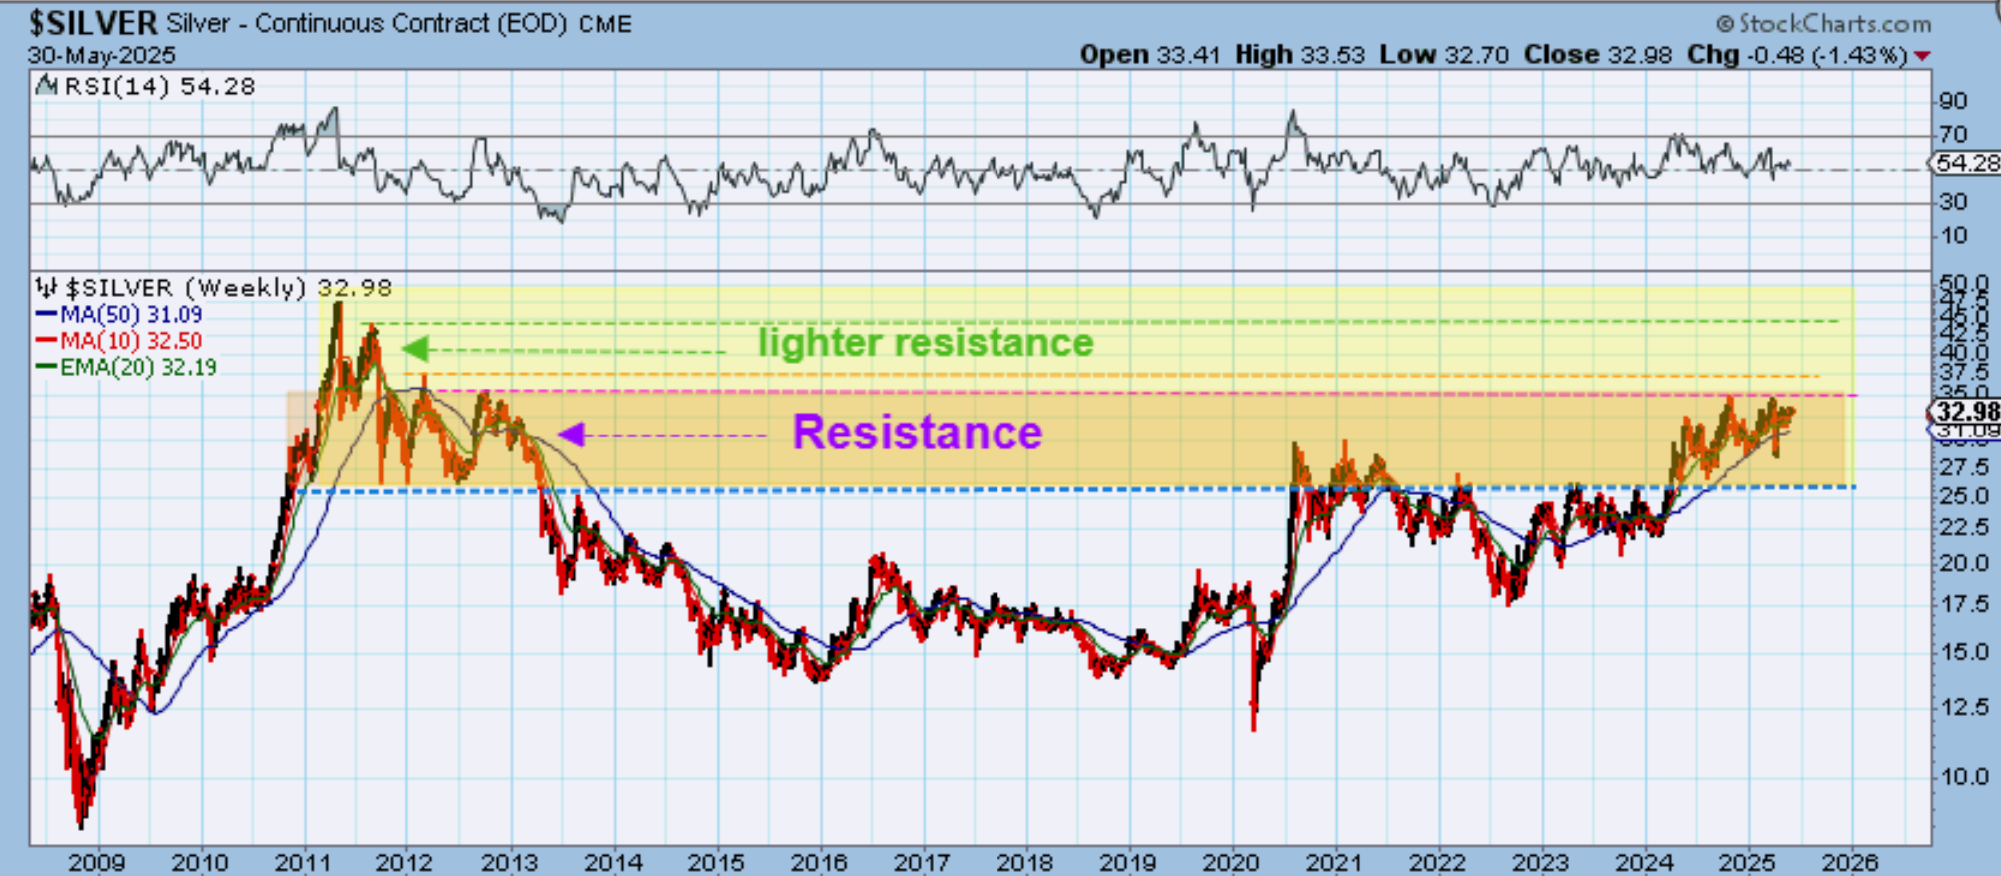
Also, another thing to consider when it comes to Silvers choppy consolidation is that it has been working its way through a heavy consolidation area. Once it breaks out from here, the resistance should actually lighten up and make it easier for Silver to run to all-time highs (& likely even beyond that over time).
.
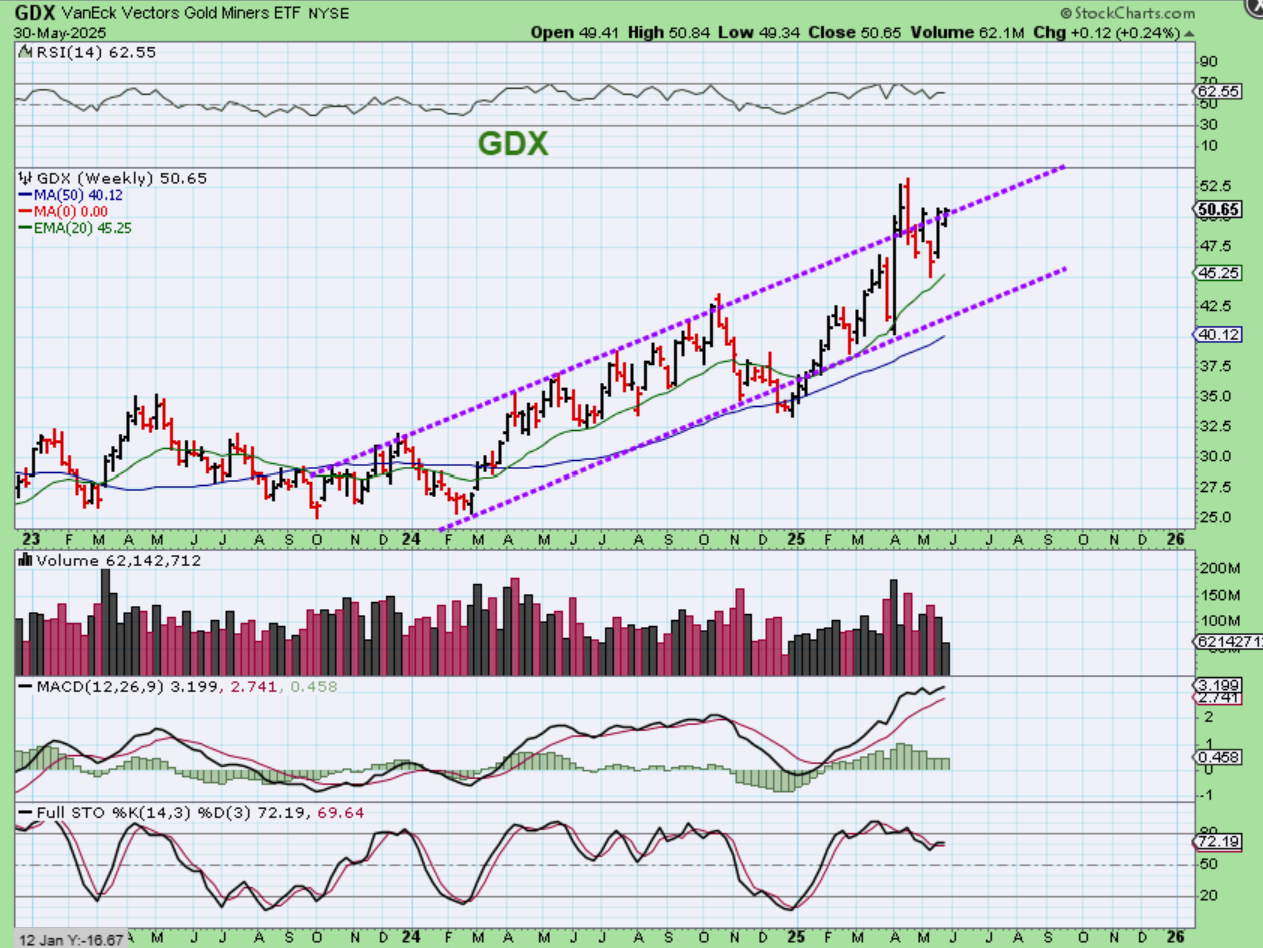
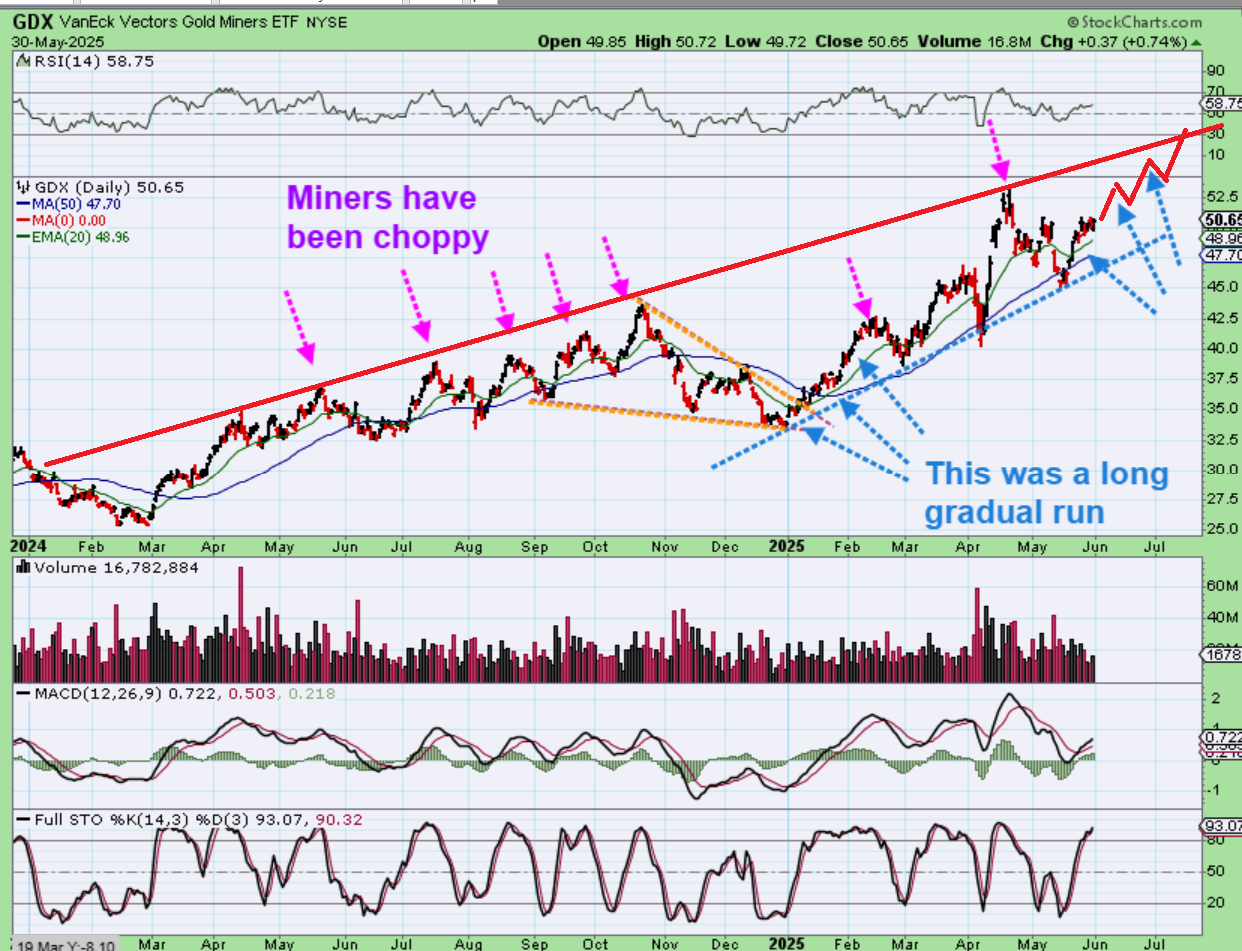
When we take a look at The GDX Weekly chart, we see that the move higher was a very choppy move higher in 2024, earlier in this channel. More recently, the move has been steepening. In 2025, The GDX chart shows price still choppy, but it has moved from about $33 to $52.50 in 4 months. The volume looks like it dropped this week, but remember that Monday was a U.S. holiday, so this is only representing 4 days of trading.
.
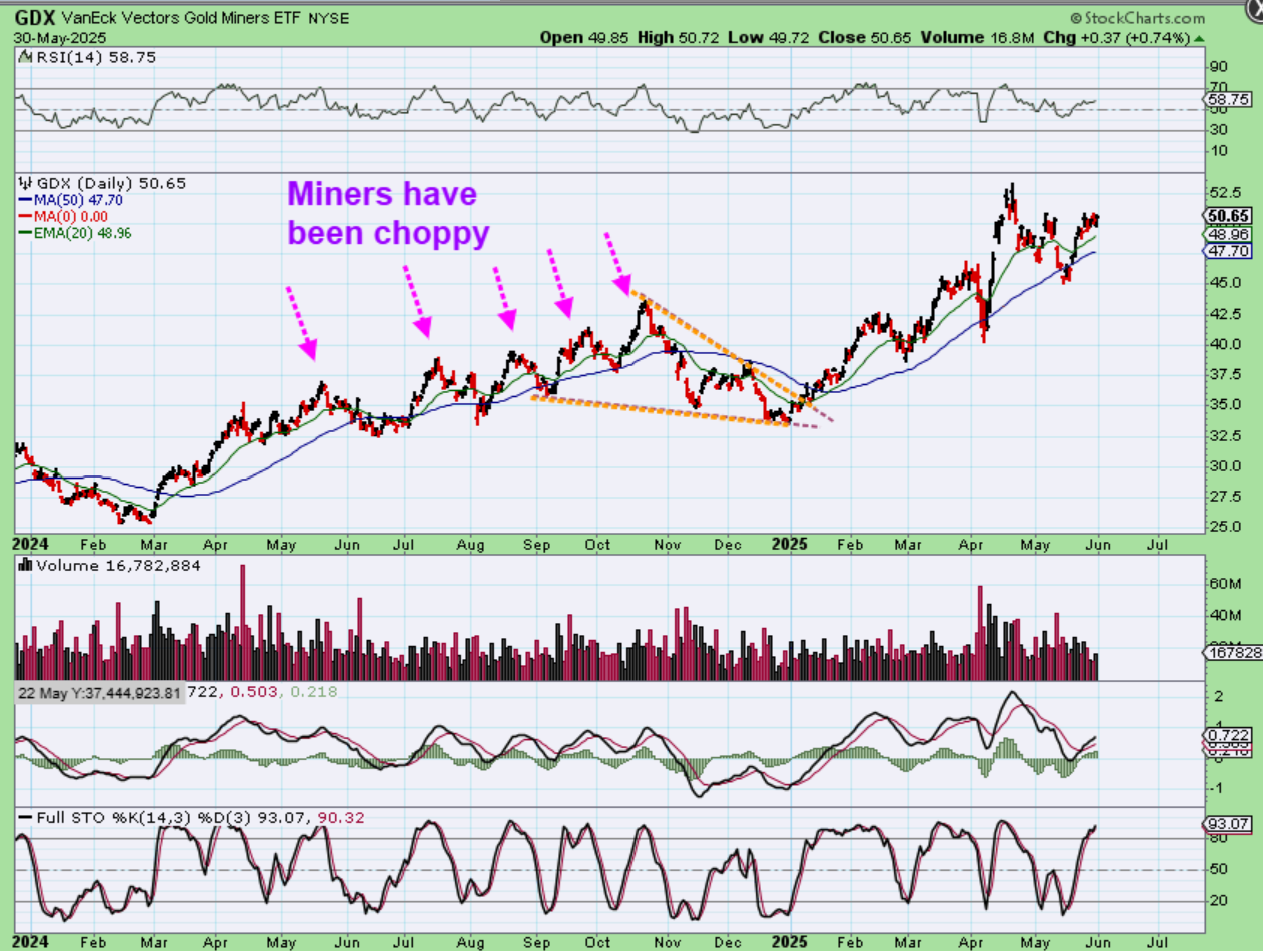
So on the daily charts, The GDX was really choppy, but it was chopping higher and bouncing off of the 50sma. Actually, it was selling off below it and recovering it, so we saw shakeout after shakeout, since many people use the 50sma to place their stops there. After the big sell off from October to December, the rally out of that ICL became steeper…
.
.
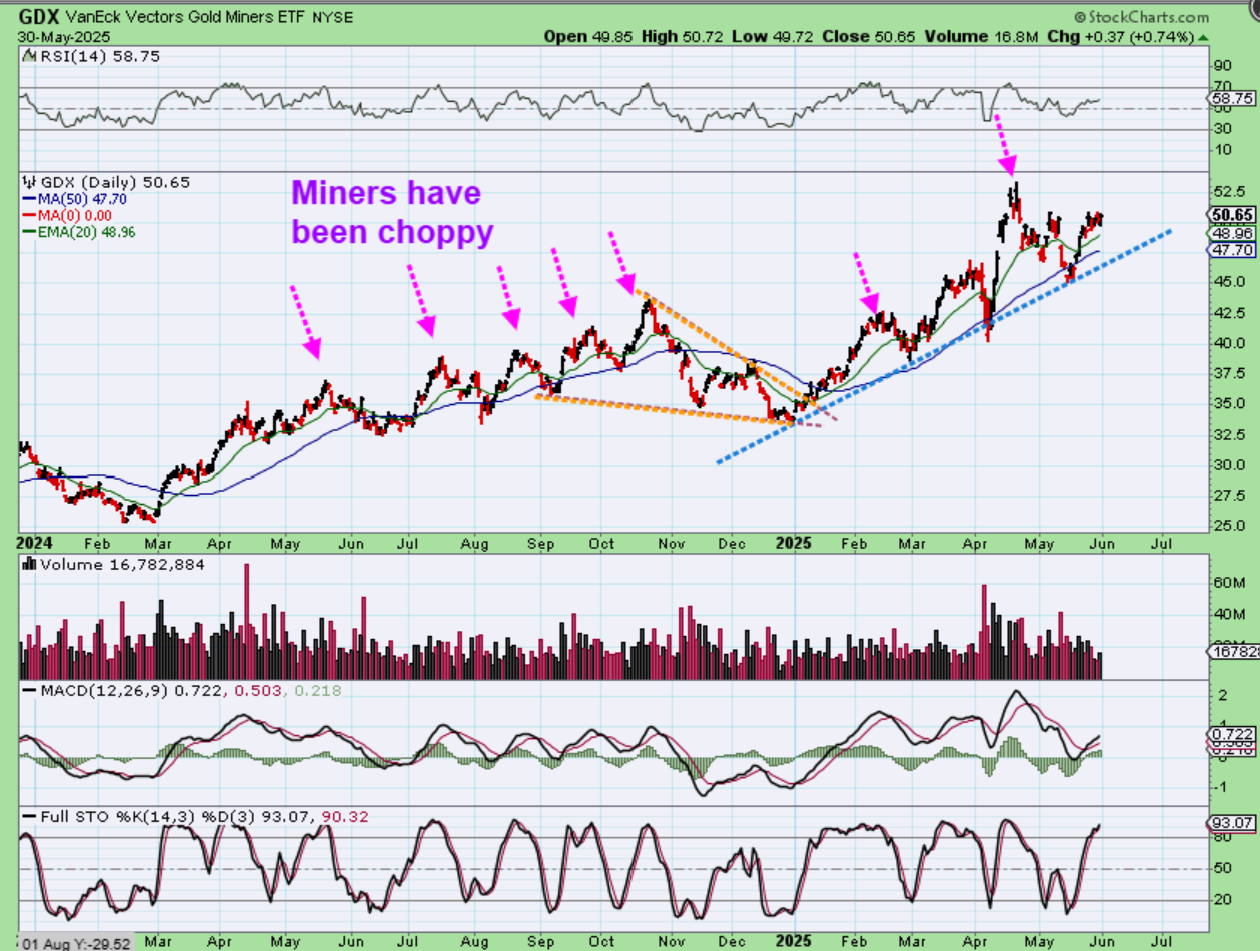
GDX – The 2025 rally has given us higher highs and then dropped to the blue 50sma again, just like in 2024. We have a trendline higher now in 2025…
.
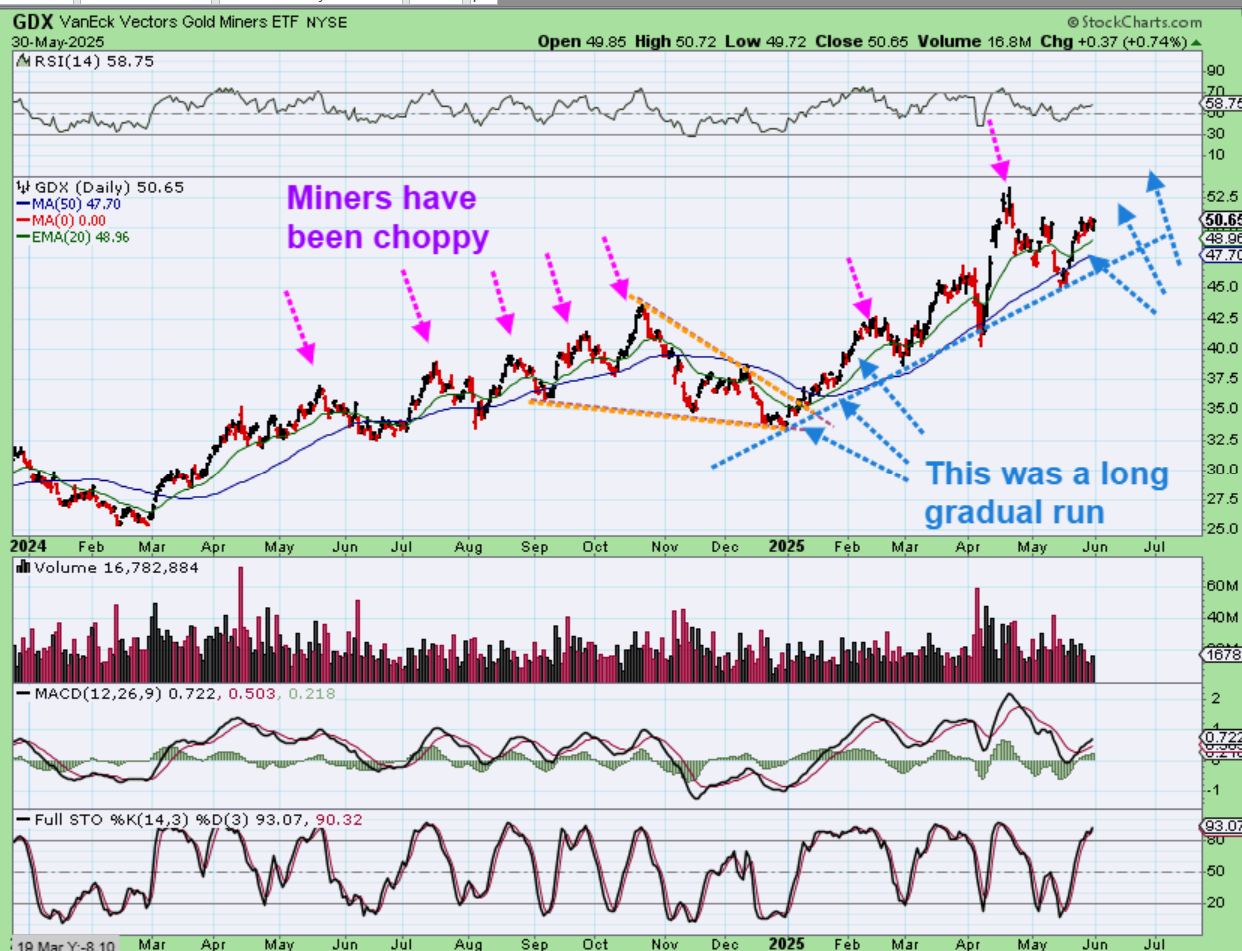
GDX – I noticed that the run out of the Dec/Jan ICL was a slow steady that may have had a stealth dcl with that pause, but really it looked like a slow & steady 2 month run higher. Right now we also have a slow steady run higher.
.
GDX – This is just an idea of how things could unfold if Gold chops higher and sideways, and the miners continue higher too. If Gold and Silver just take off higher despite the USD climbing higher, then this could run at a steeper incline too.
The bulls remain in control and the dips seem to be finding buyers along the way. Bitcoin is a bullish set up too, and I’ll discuss that below, enjoy your weekend and thanks for being here at Chartfreak!
.
~ALEX
.
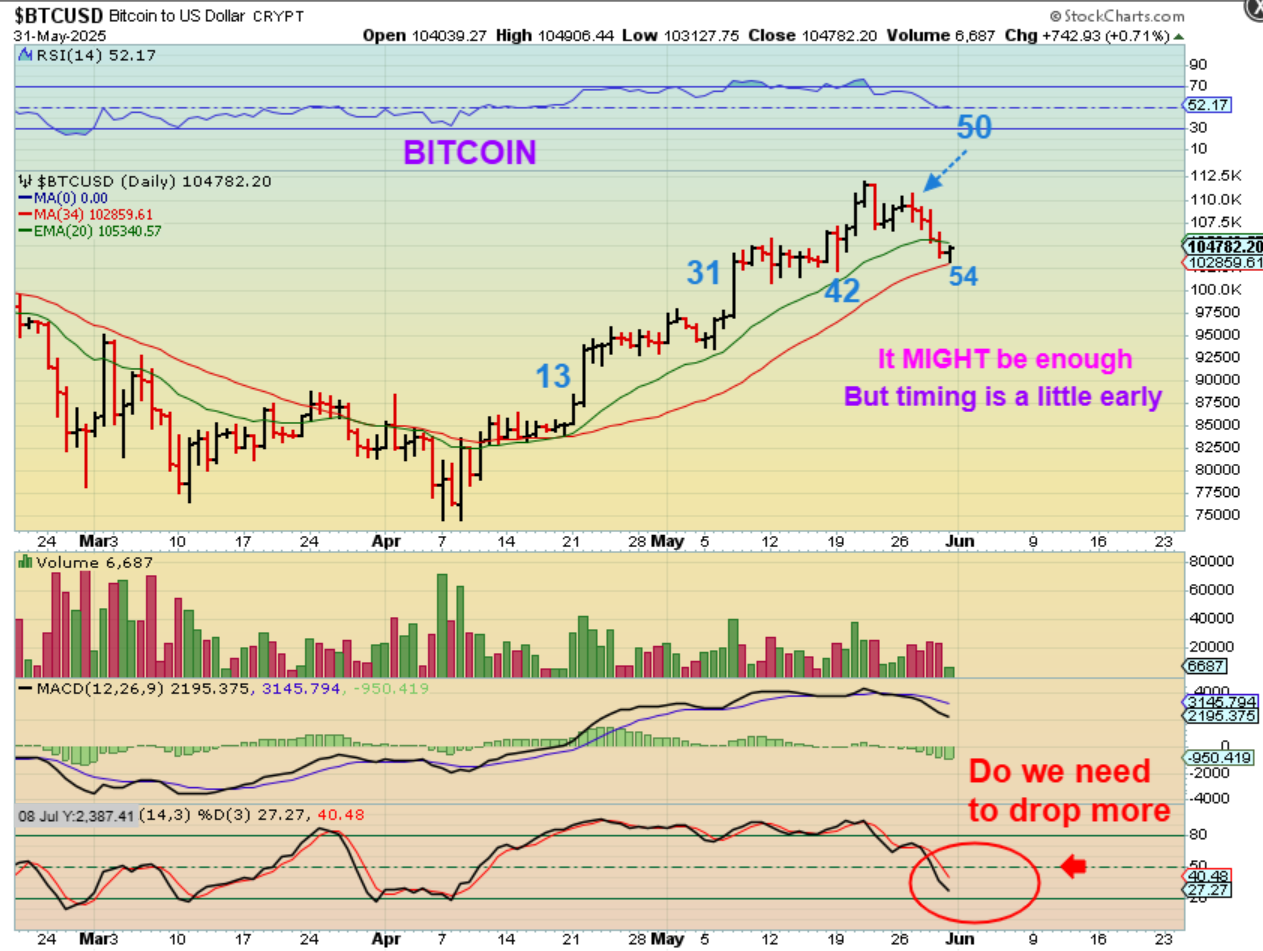
BITCOIN usually has a very reliable 60 day cycle (roughly) and here we see that Saturday is day 54 and price reversed right at the 34 sma. I discussed this earlier in the week. We have seen Bitcoin ride the 20ema and reverse at both the 34sma and the 50sma. So, this MIGHT BE the dcl forming here at day 54. Now look at the ‘stochastics’ box and you’ll see that Bitcoin really isn’t oversold yet. What might that mean?…
.
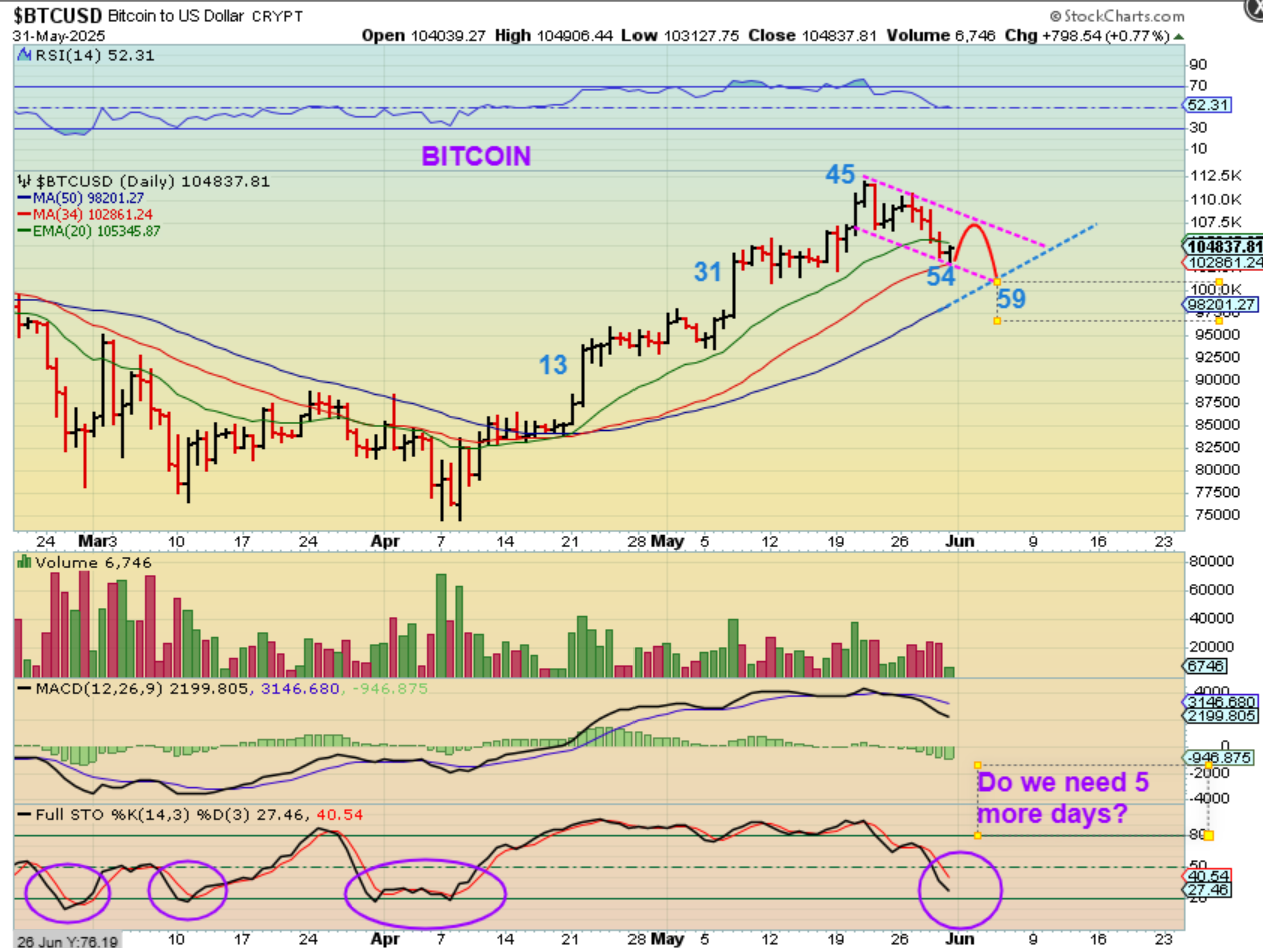
BITCOIN – So we MIGHT BE seeing the dcl forming here at day 54, but when I looked at the ‘stochastics’ box and saw that Bitcoin really isn’t oversold yet, I also can picture a bounce to the upper trend line and then a drop closer to the 50sma getting us closer to day 60. That would also bring the stochastics to oversold.
.
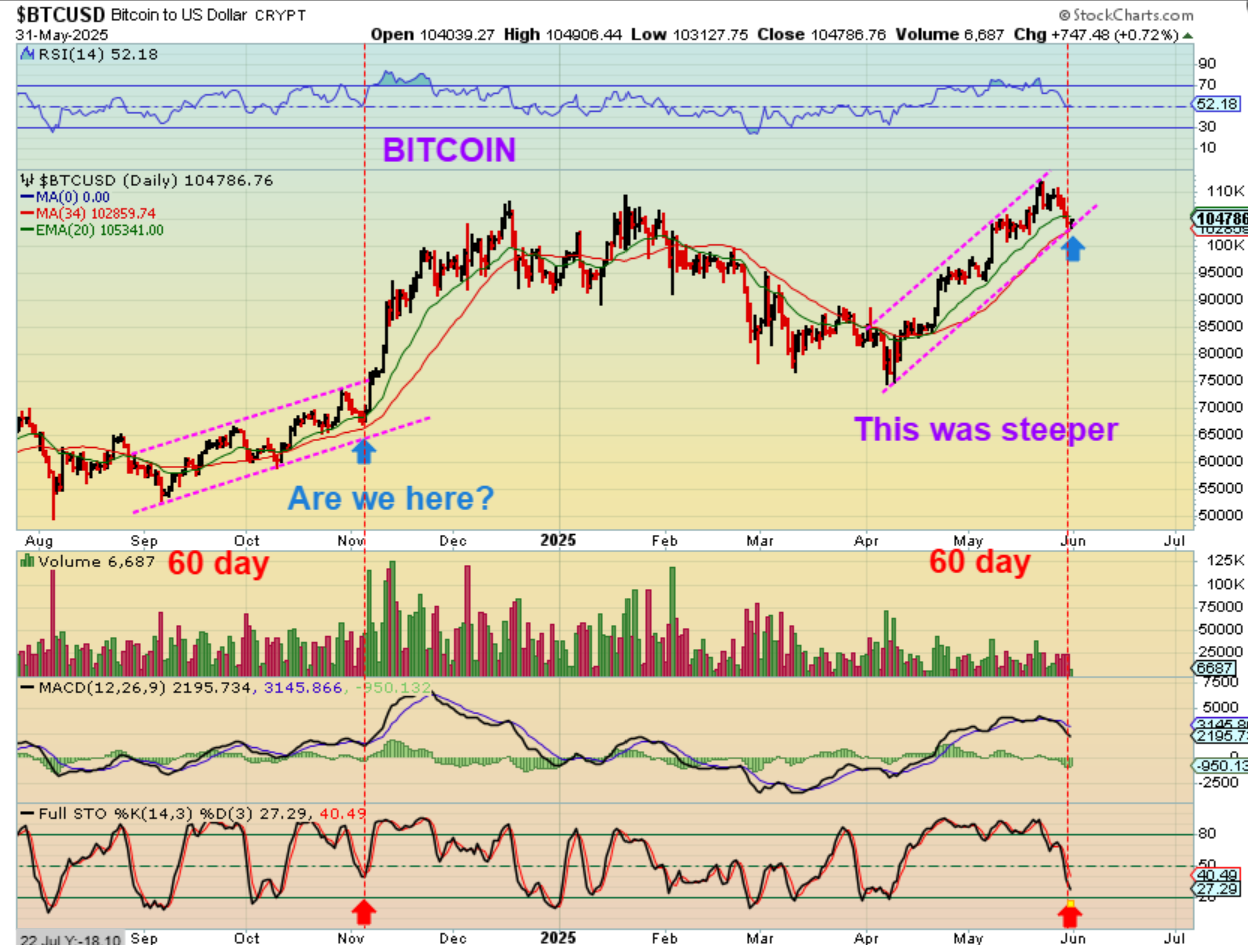
BITCOIN – I took a look back at another run out of the lows and saw a similar run and pullback that lasted 2 months (roughly 60 days long). This run was a bit steeper though.
1. Notice that the first rally did stop at the red 34 sma.
2. I also noticed that the stochastics didn’t reach oversold in that other run out of the lows. So the set up is similar and this could be the dcl, but …
.
So the set up is similar and this could be the dcl, but I think we won’t really know until that upper trend line is broken.

