Thursday May 22 – Changing Tides?
Is it time for a dcl to develop in the general markets? Possibly, since we are now beyond day 30, so let’s just discuss what happened yesterday and then today we have the jobs report at 8:30 am and PPI numbers at 9:45 am (inflation). So we’ll see if those reports add to the heaviness that we saw in the markets yesterday.
.
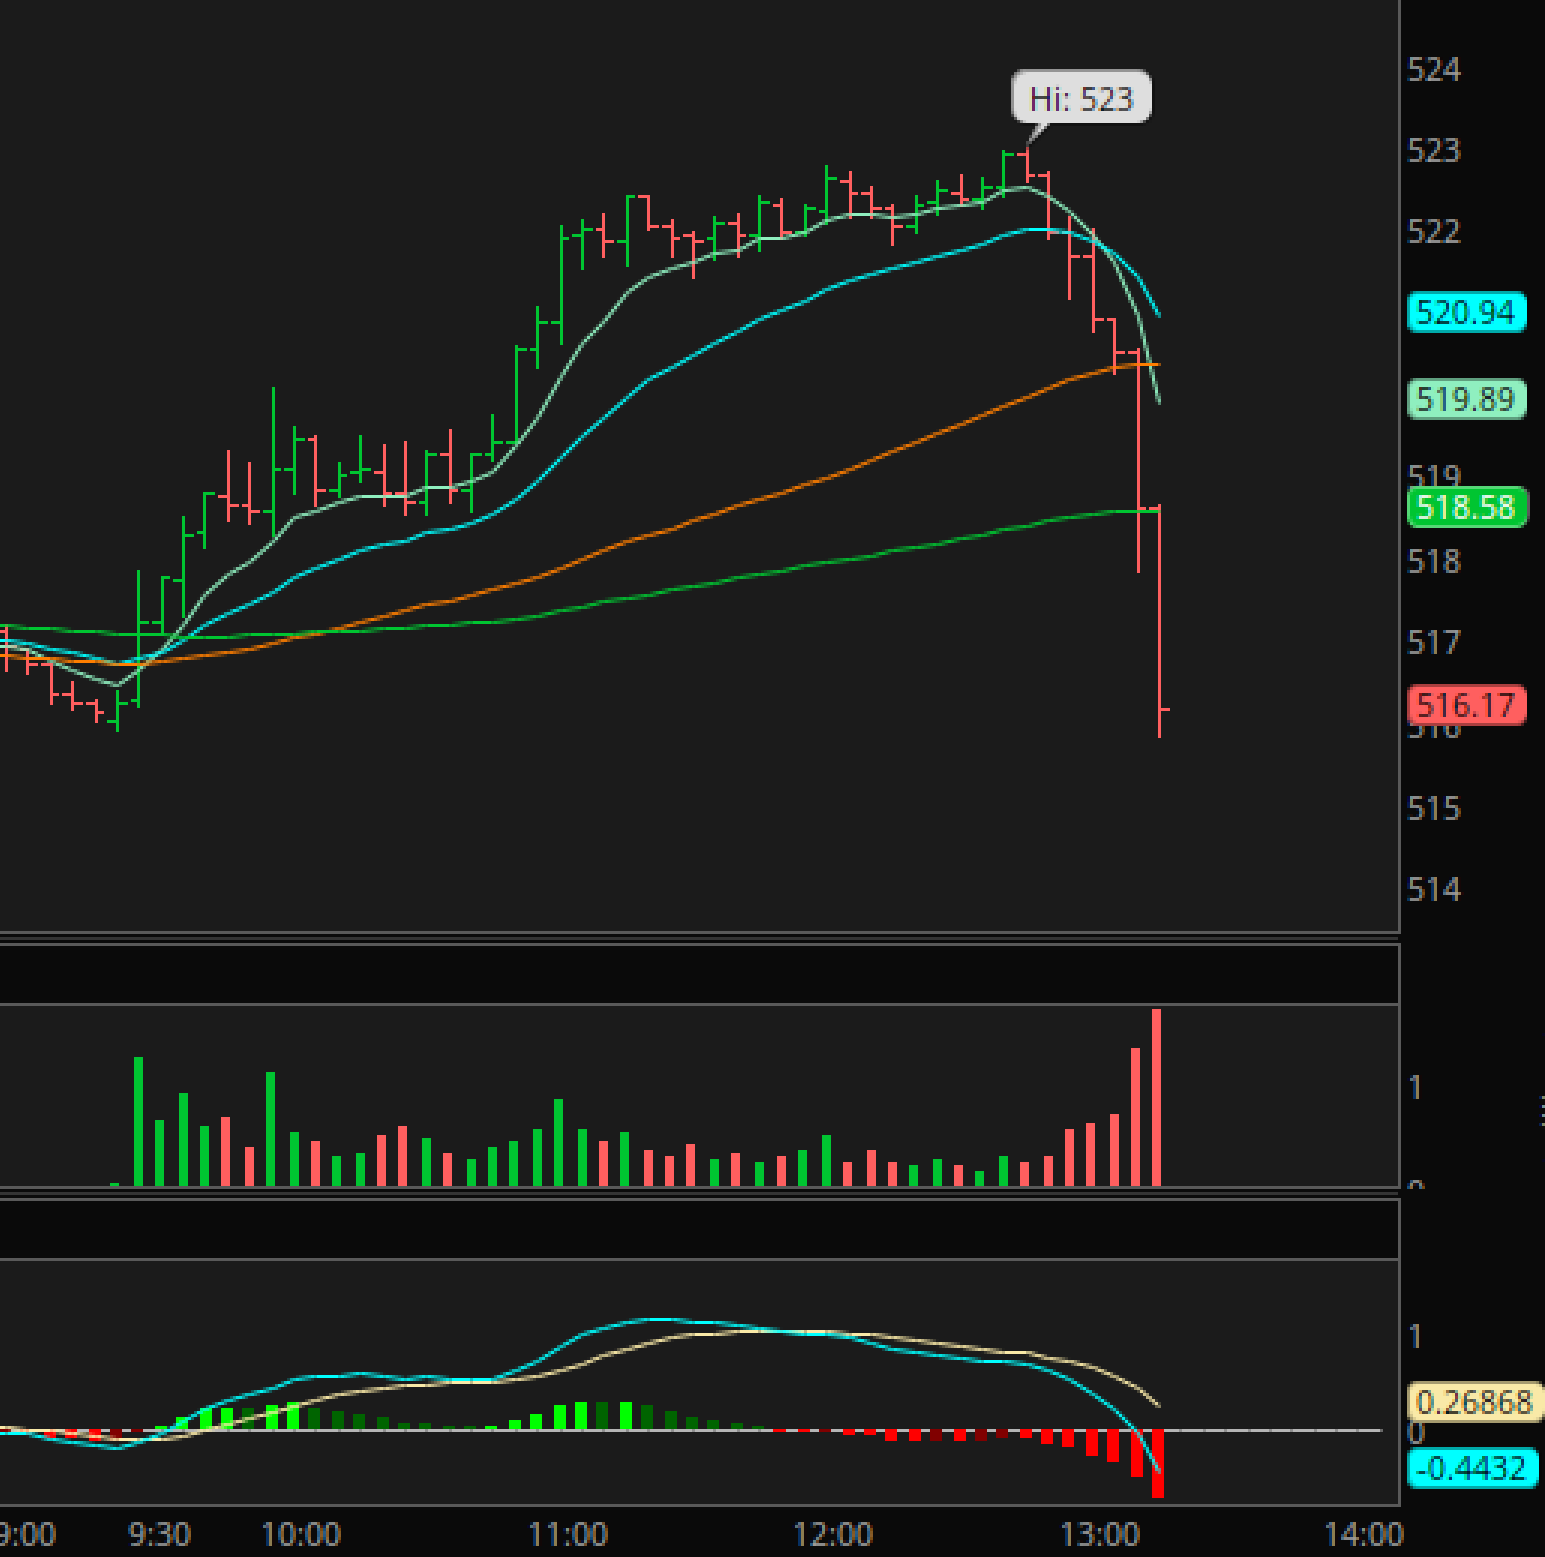
Yesterday trading started off good. Many stocks were doing well when suddenly, and seemingly out of nowhere around 2 p.m., The NASDAQ, SPX, and SOXX just tanked in a waterfall sell off seen here with the QQQ. Volume selling spiked.
.
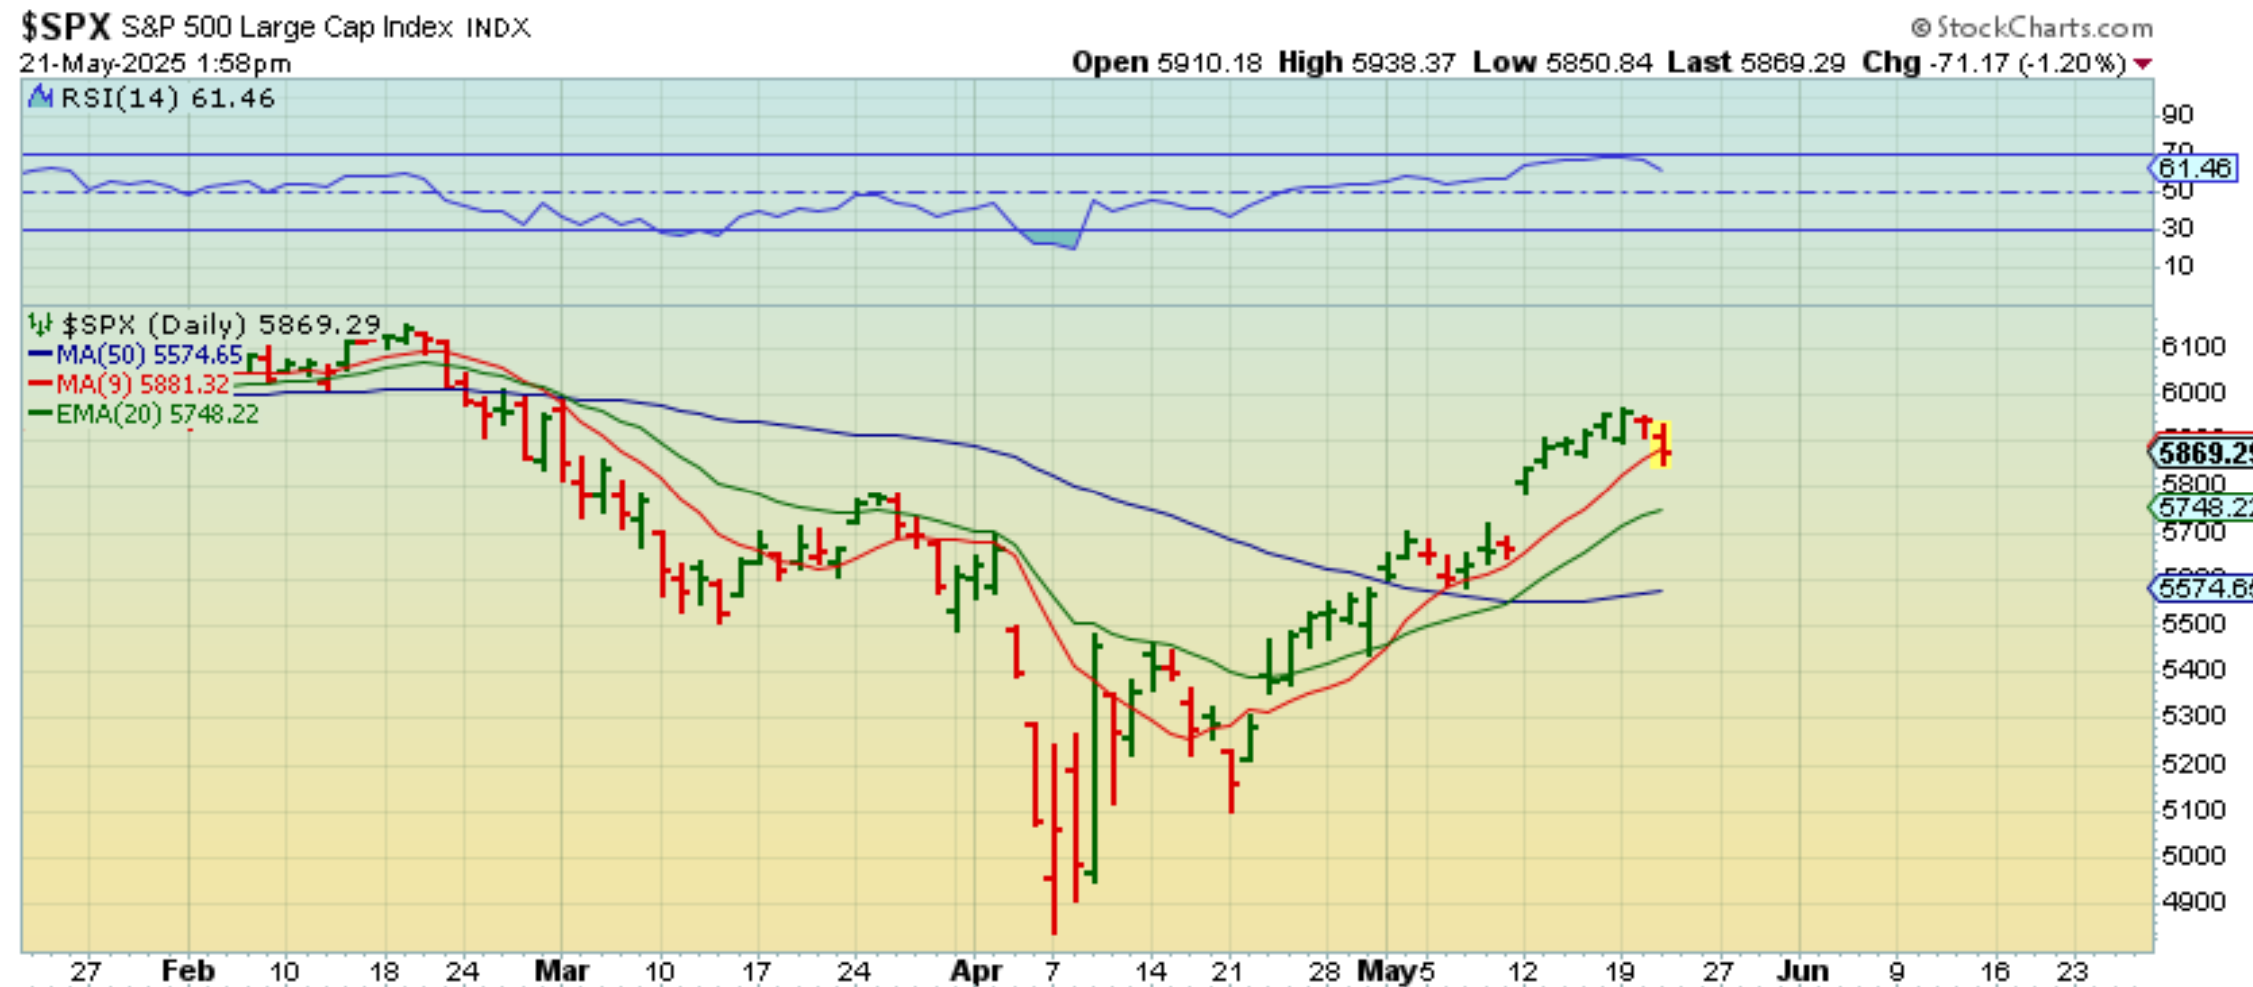
So I grabbed this chart of The SPX and saw that it was breaking below that 9 sma, which was acting as support on this bull run. Is this the start of the dip into a dcl? It could be. Since this chart was taken at 1:58 p.m., one would wonder if it was just a quick flash sell off and did it bounce back into the close?
.
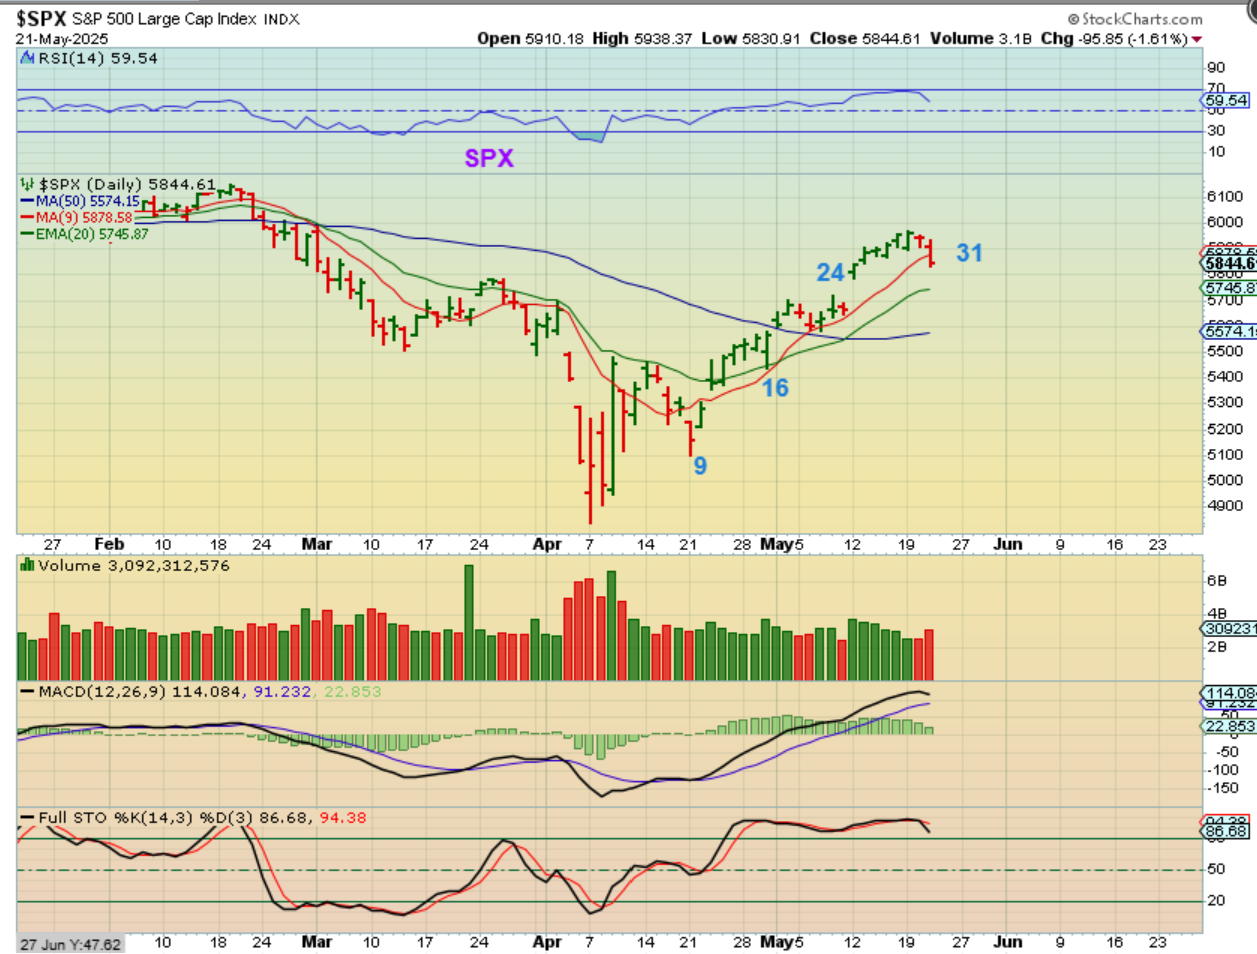
The SPX did not bounce back, it paused and sold off further in the final hour with more volume, so we do have a break of that supportive 9 sma or 10sma and volume increased. That was day 31 and we can get a dcl around day 35 or so, so this might be the tide changing direction for now. Todays JOBS report & PPI will give us a bounce or further selling.
.
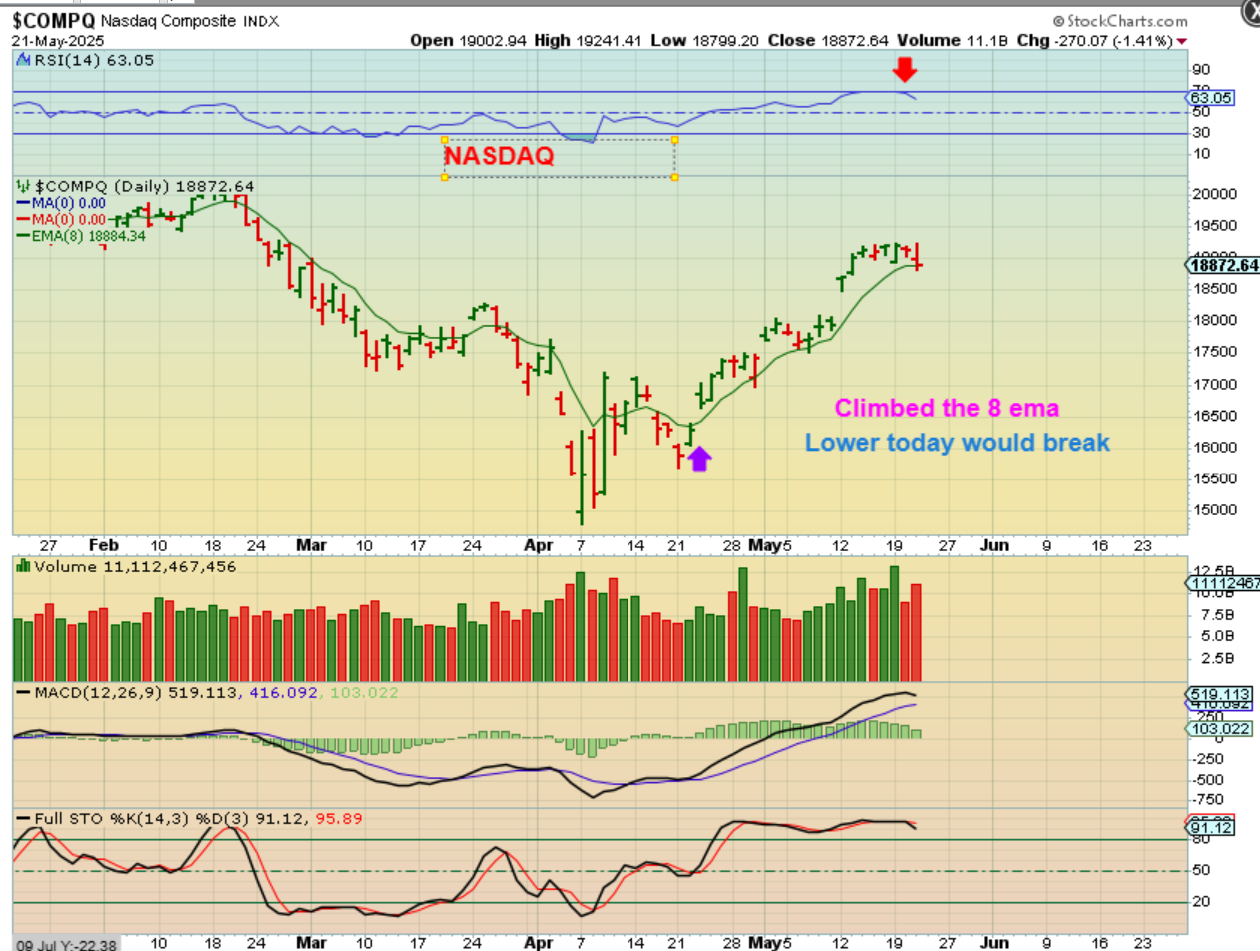
THE NASDAQ has paused & chopped sideways at the highs this week and even though it held up at the 8 ema, we do have data today. We’ll see if this is getting heavy and ready for a dip into that dcl too, with todays Jobs & PPI report.
.
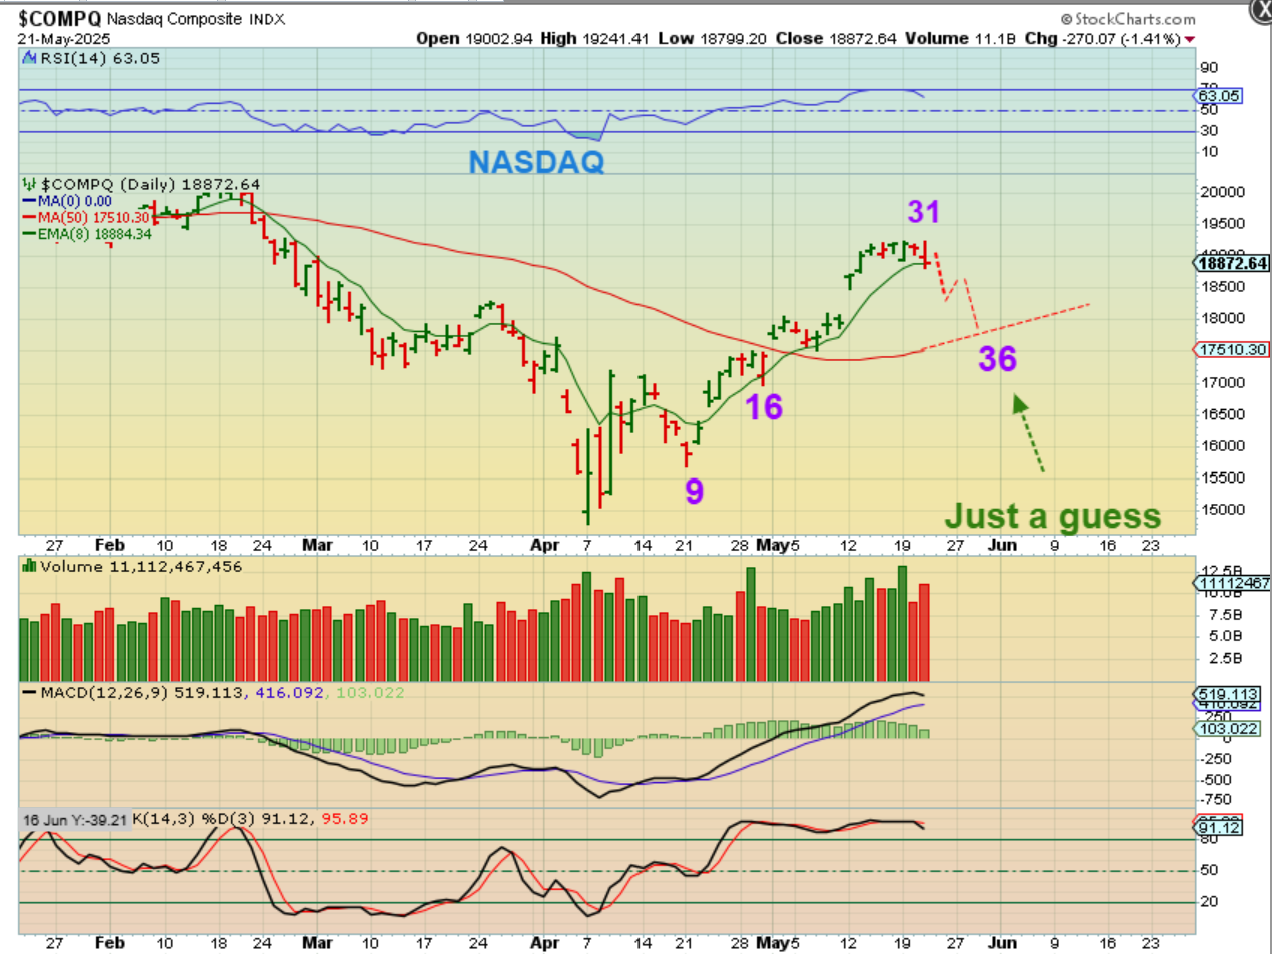
NASDAQ DCL – This is just an idea of a sell off into a dcl over the next few days. I have drawn it as an a-b-c that bounces above the 50sma, but we could also just see a 3 or 4 day drop that finishes the job.
.
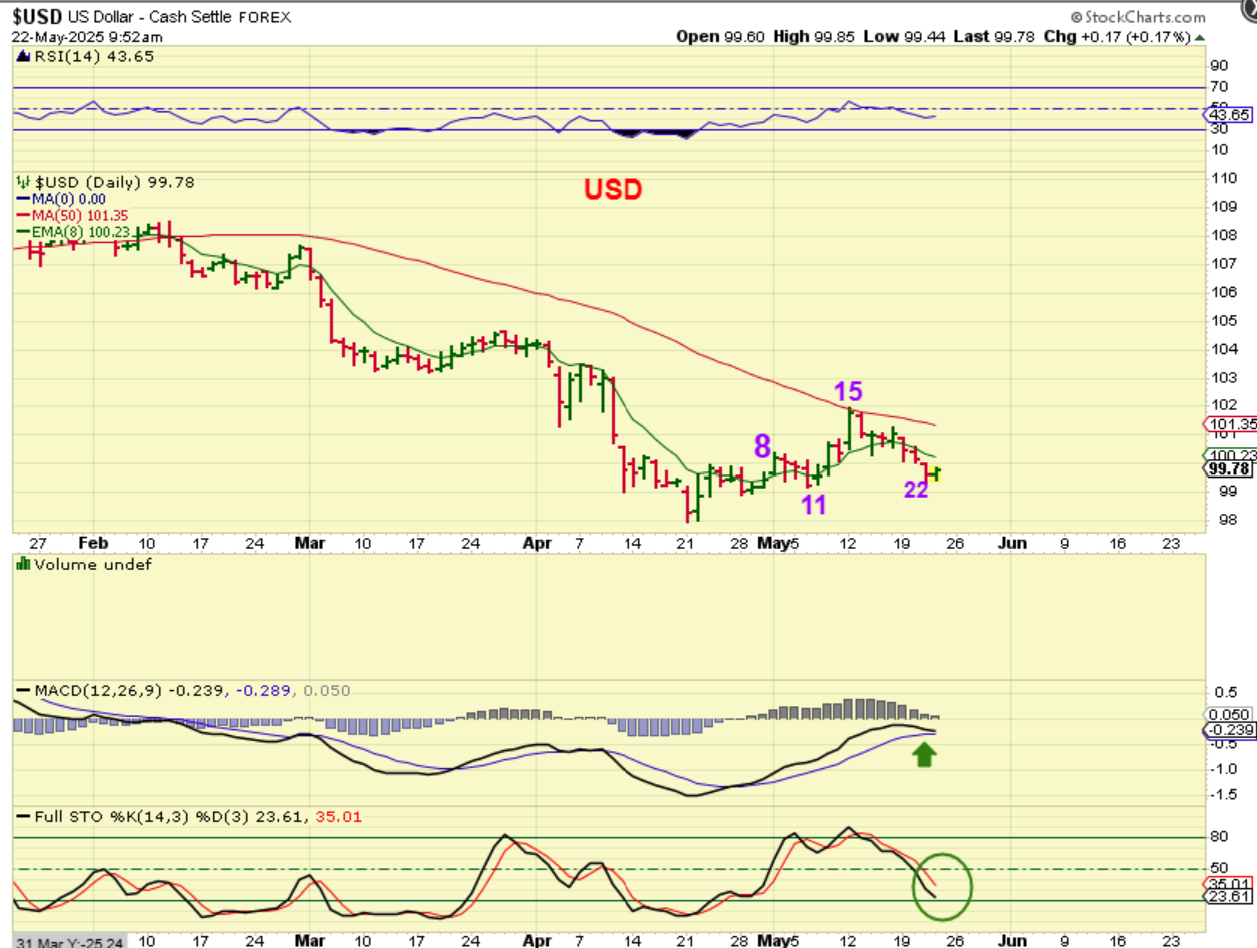
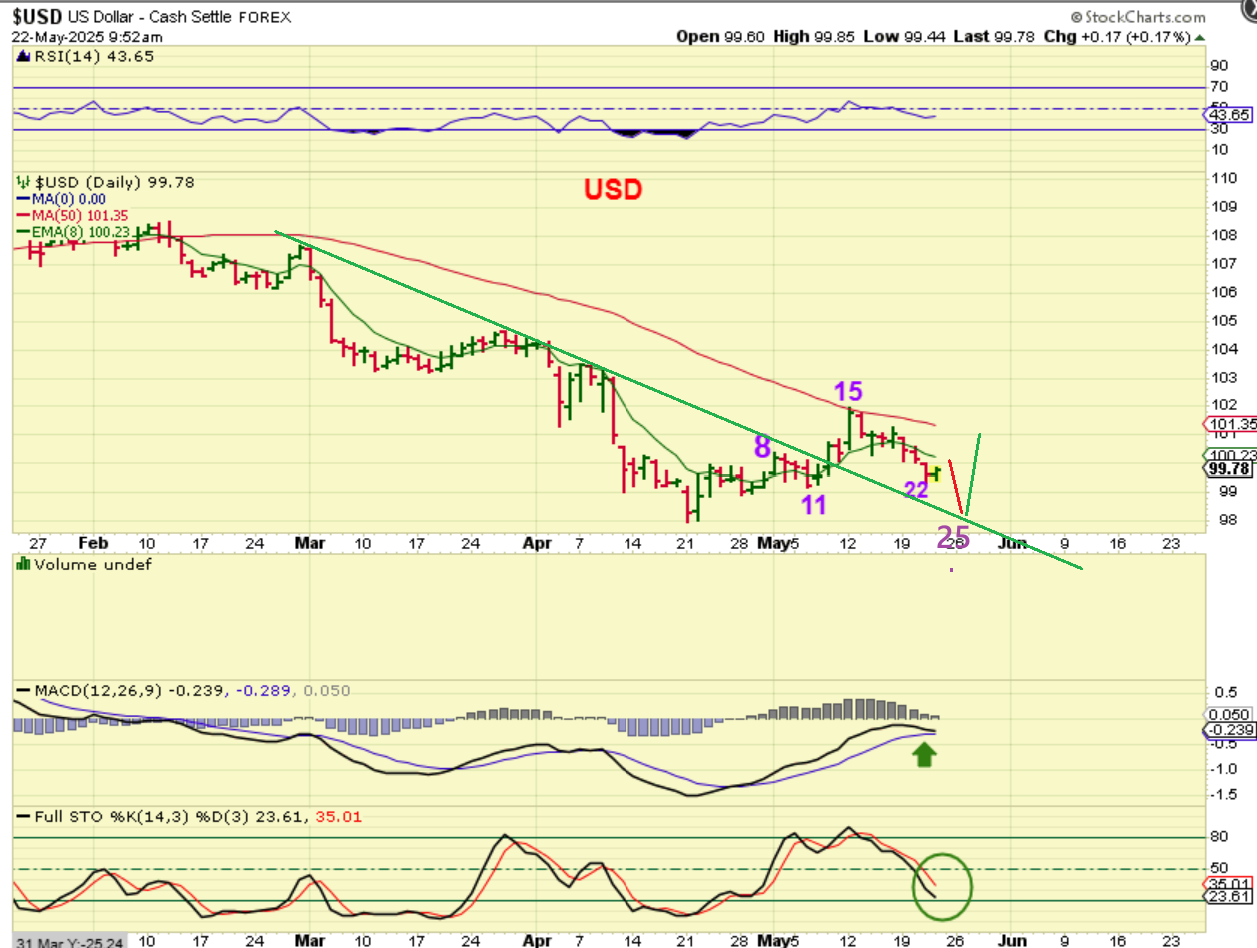
The USD is within the timing for a dcl, but they have come randomly recently with some daily cycles longer than normal. We are not fully oversold, so it may just chop and bounce before putting in the dcl. Also…
.
We are not fully oversold, so it may just chop and dip and still land on that trendline as a dcl back-test too. The inverse relationship with Gold and the USD seems to have returned, so another dip in the USD could give Gold another pop, but when the USD bottomed into a dcl, I’m expecting Gold to drop into one too.
.
GOLD is heading up to the downtrend line. Gold is on day 5 (Spot Gold has started counting Sunday evening trading as a full separate day, so it shows up here as day 6). The last daily cycle was L.T. and I would expect this one to form as L.T. too, if it is heading down into an ICL.
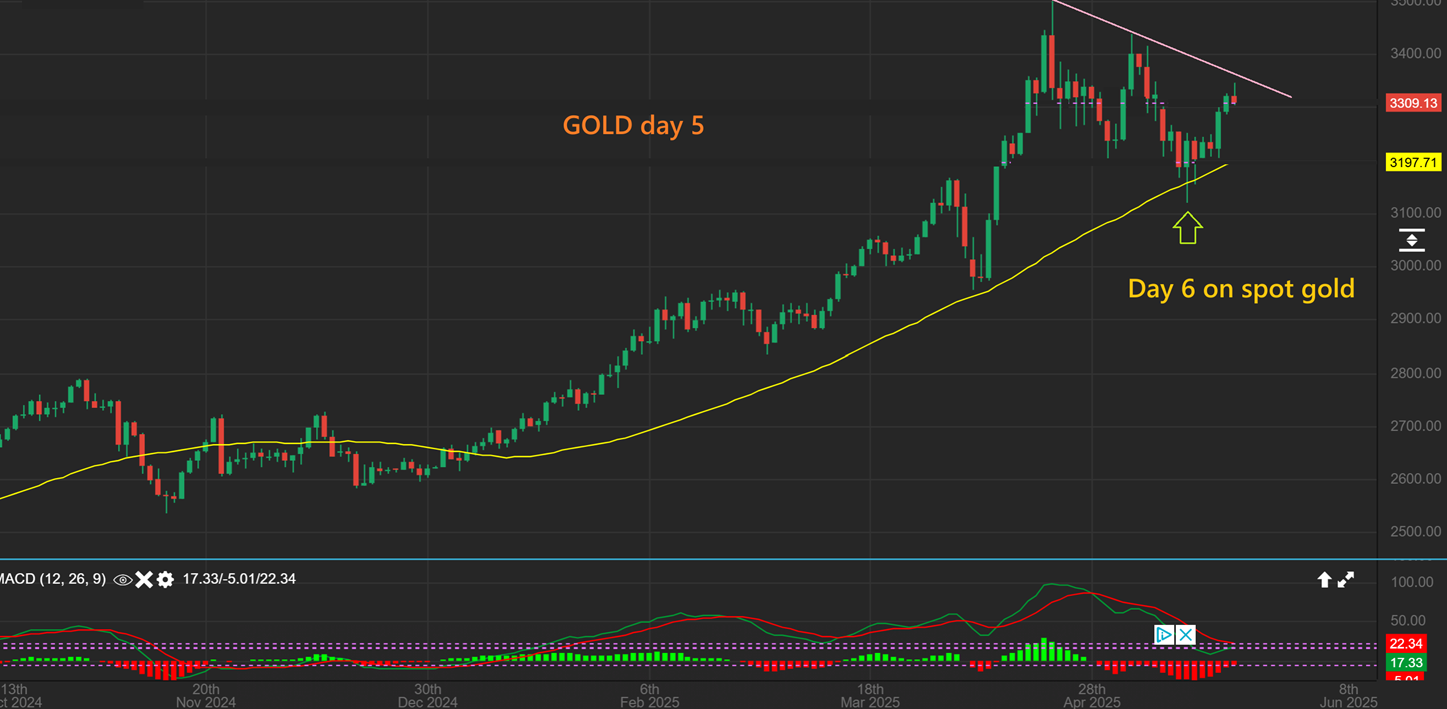
.
Yesterday I pointed out with this chart that the dip for Gold does not have to be a deep sharp drop. I said:
.
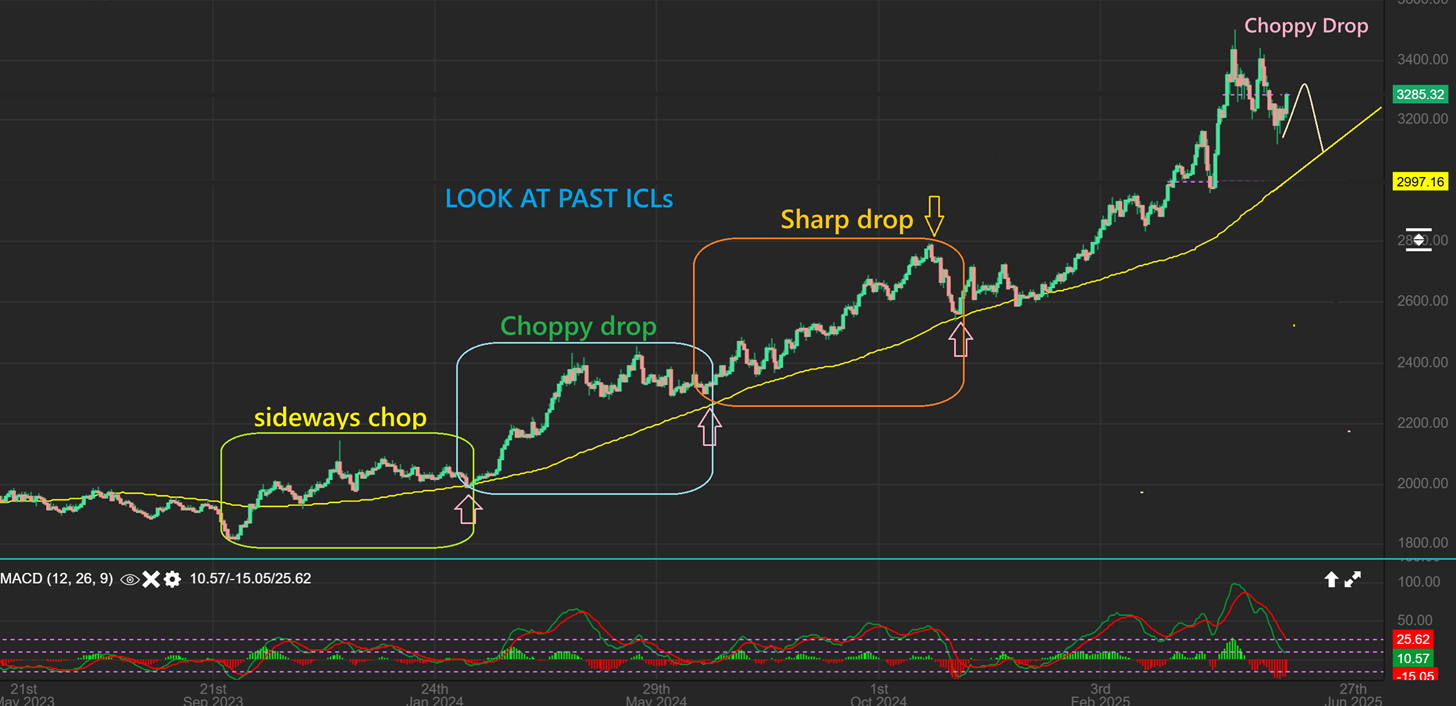
GOLD ICLs – It is always good to go back and look at recent ICLs in the Bull run. THIS IS A BULL MARKET, SO WE HAVE TO RECOGNIZE THAT GOLD USED TO CRASH, BUT NOW IT CAN MEANDER INTO AN ICL.
1. Notice that some just chopped sideways in that final daily cycle, staying somewhat close to the highs of that daily cycle
2. While others ran up and then just dropped quickly into a final low AT THE YELLOW LINE.
3. I drew in a pop and drop to that yellow line here, and that will really look normal if it plays out that way.
.
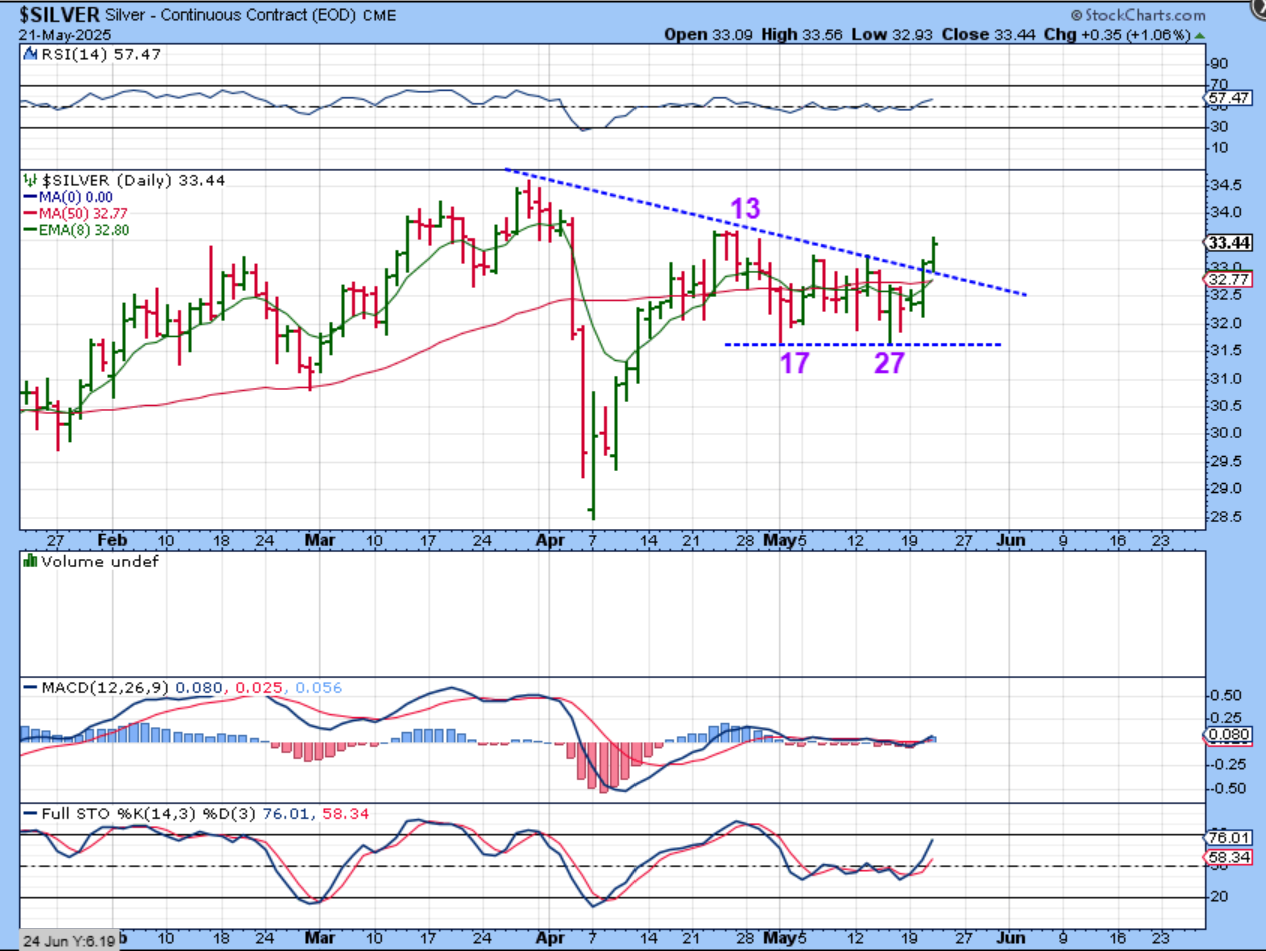
SILVER broke higher yesterday and we now need to see if it will act in harmony with Gold or will it start to show strength on its own after that April 7th slam down.
.
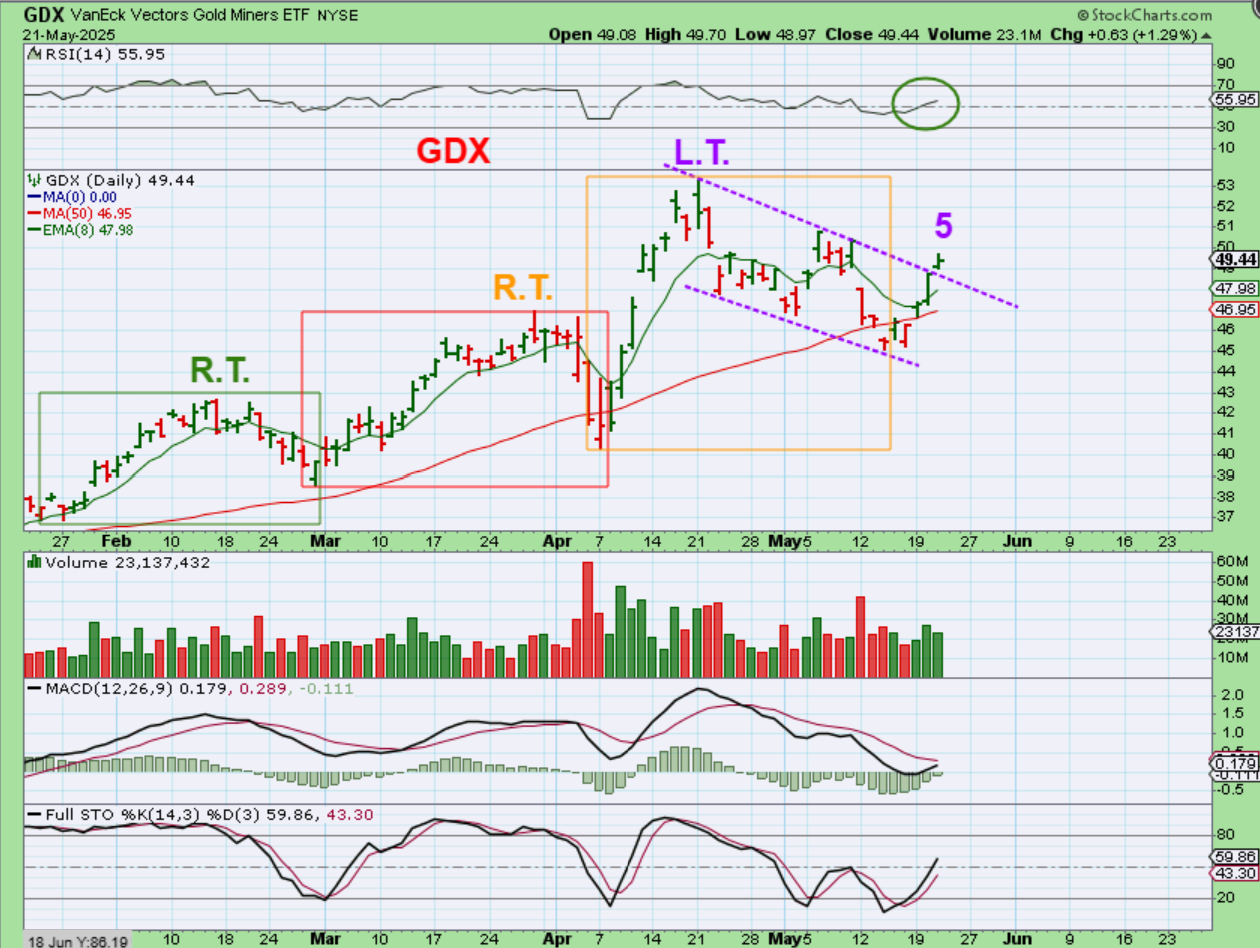
GDX closed green despite the general market selling off. Similar to Gold, the last daily cycle peaked on day 9 and was L.T., we are currently on day 5 and I expect a L.T. daily cycle here too.
.
NOTE: Yesterday I was seeing that some stocks already pulled back and gave some nice looking set ups, so these are 3 charts of those stocks BEFORE THE AFTERNOON SELL OFF. They did dip a little with that selling. This is an example of what I look for (reversals at support) after a dip into a dcl. These may hold up ok at support and go sideways, or they could dip further, with BBAI at the 200sma for example. We’ll see.
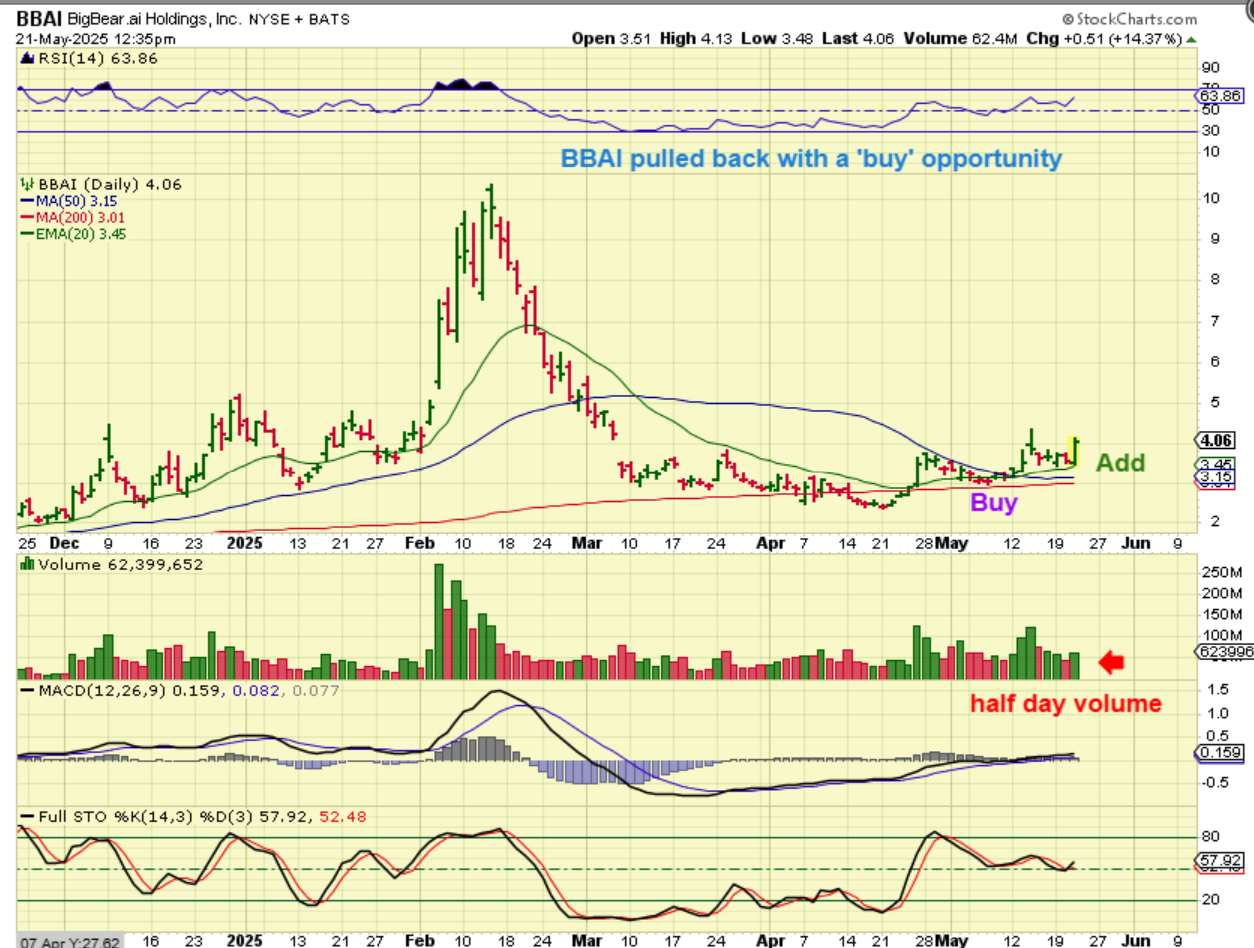
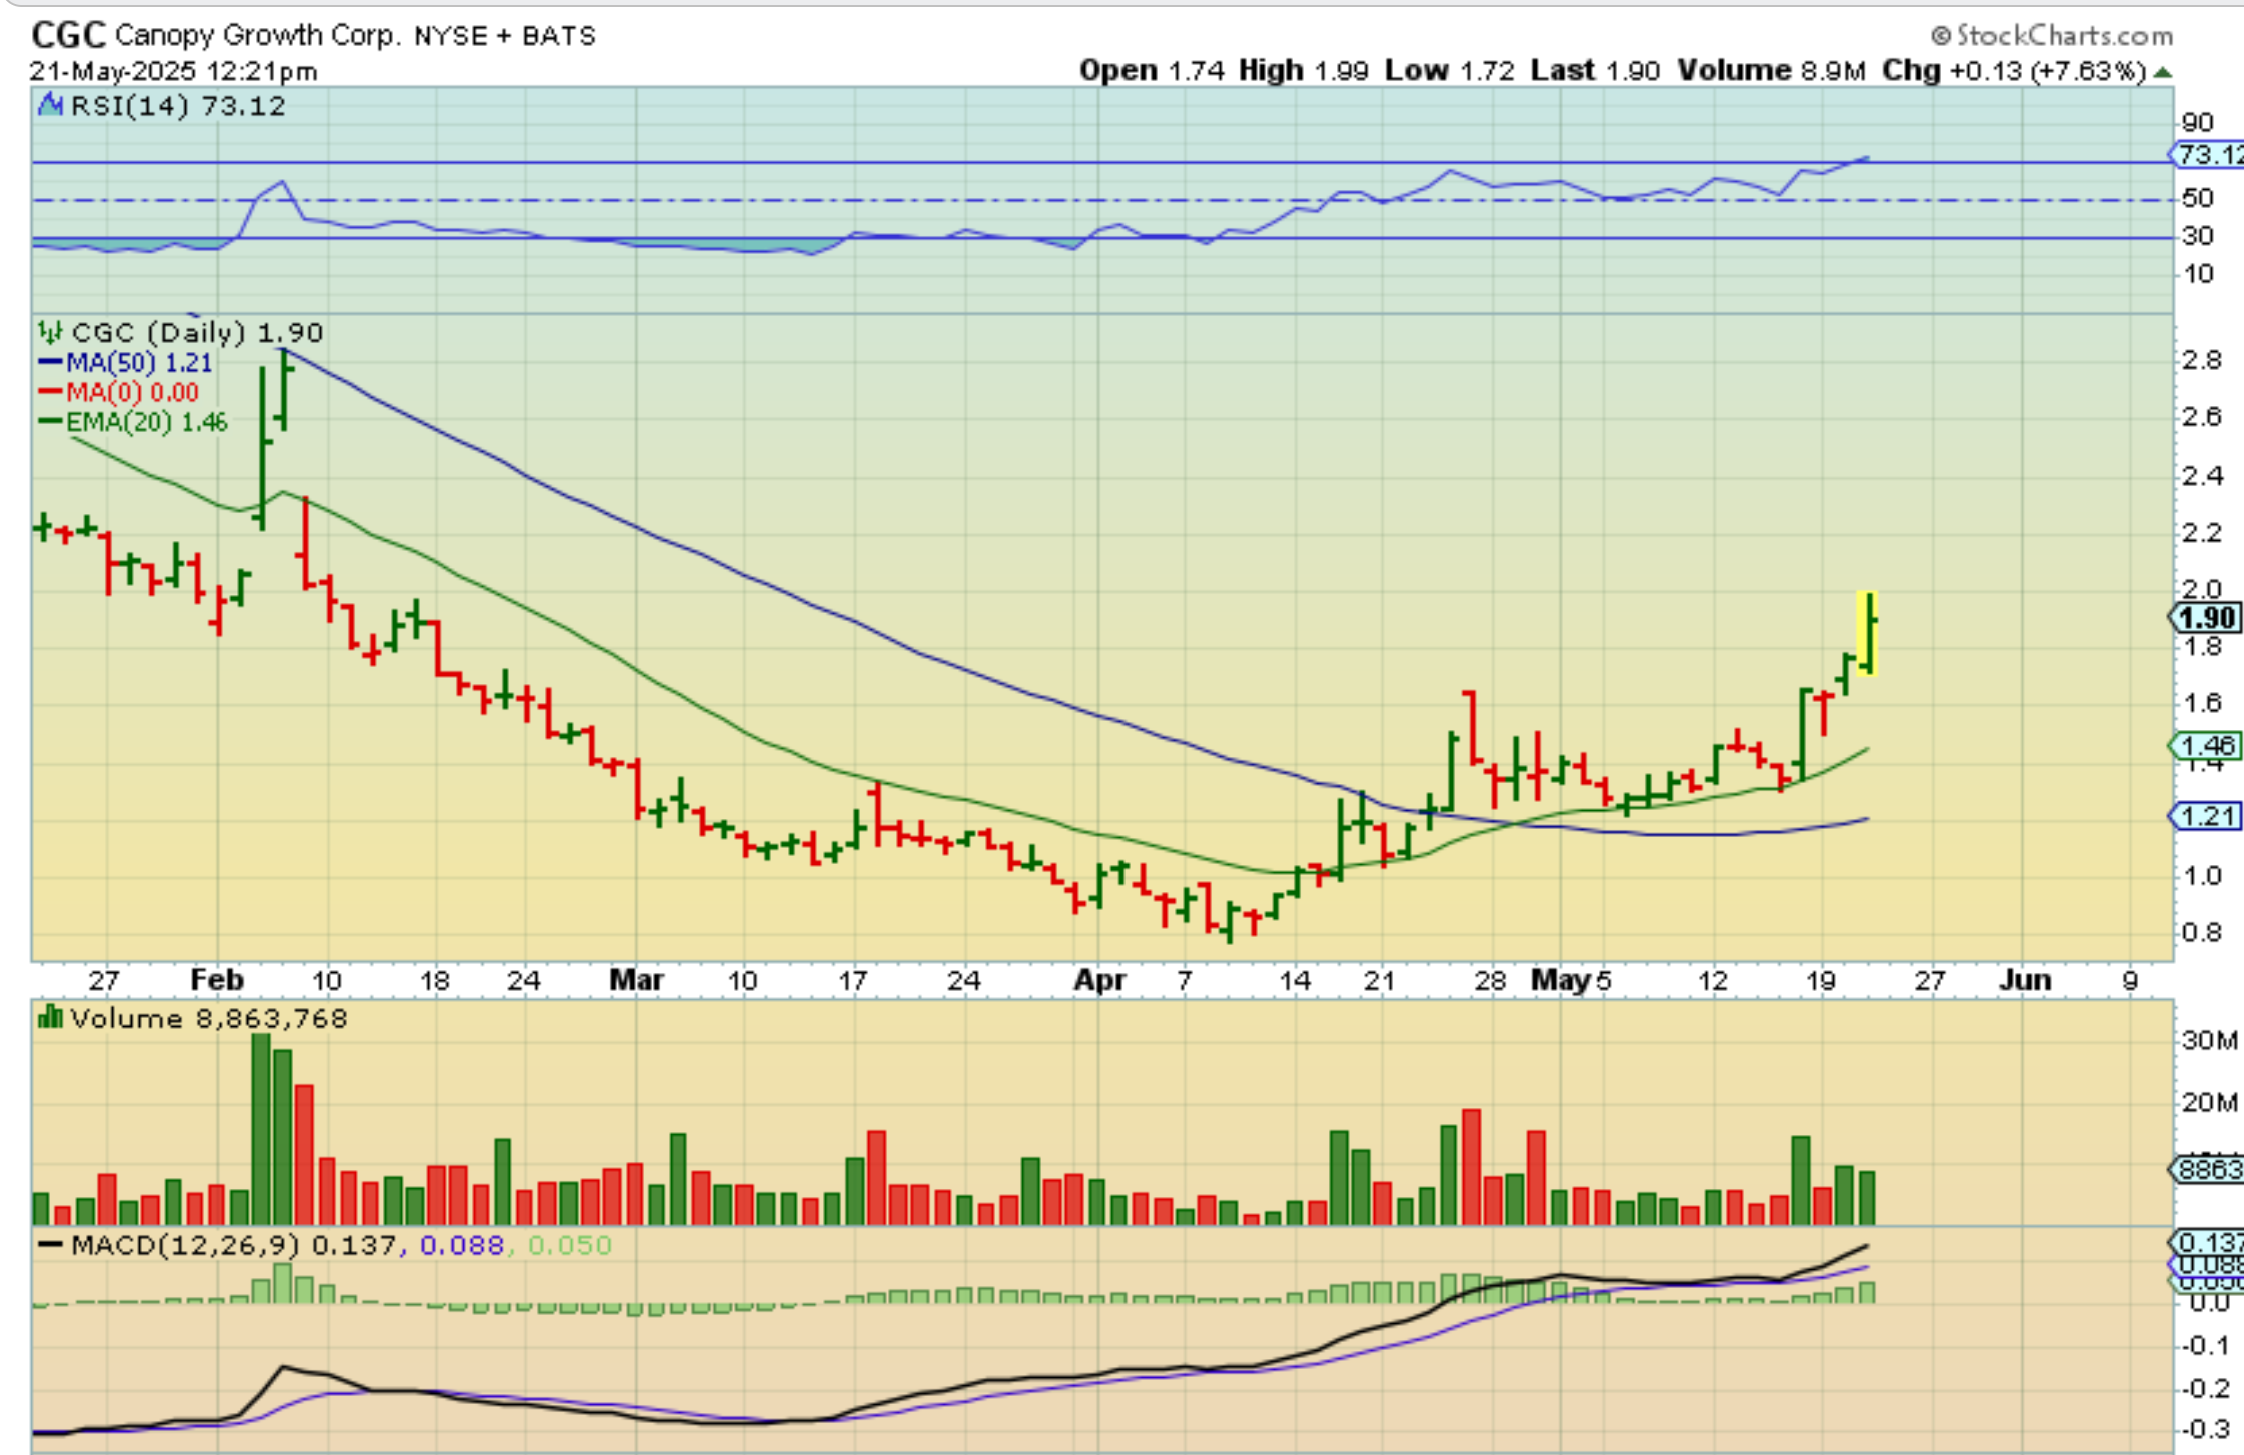
CGC, OGI, VFF, & ACB are MJ Stocks that actually really look bullish lately, so watch this sector during the selling. I already owned this and when the selling came in, this was up 8% and dropped to ‘up 2%’ near the close, so hold or sell is now the situation if a dcl dip is ready to show up. This could fall back to the 20ema or even 50sma.
.
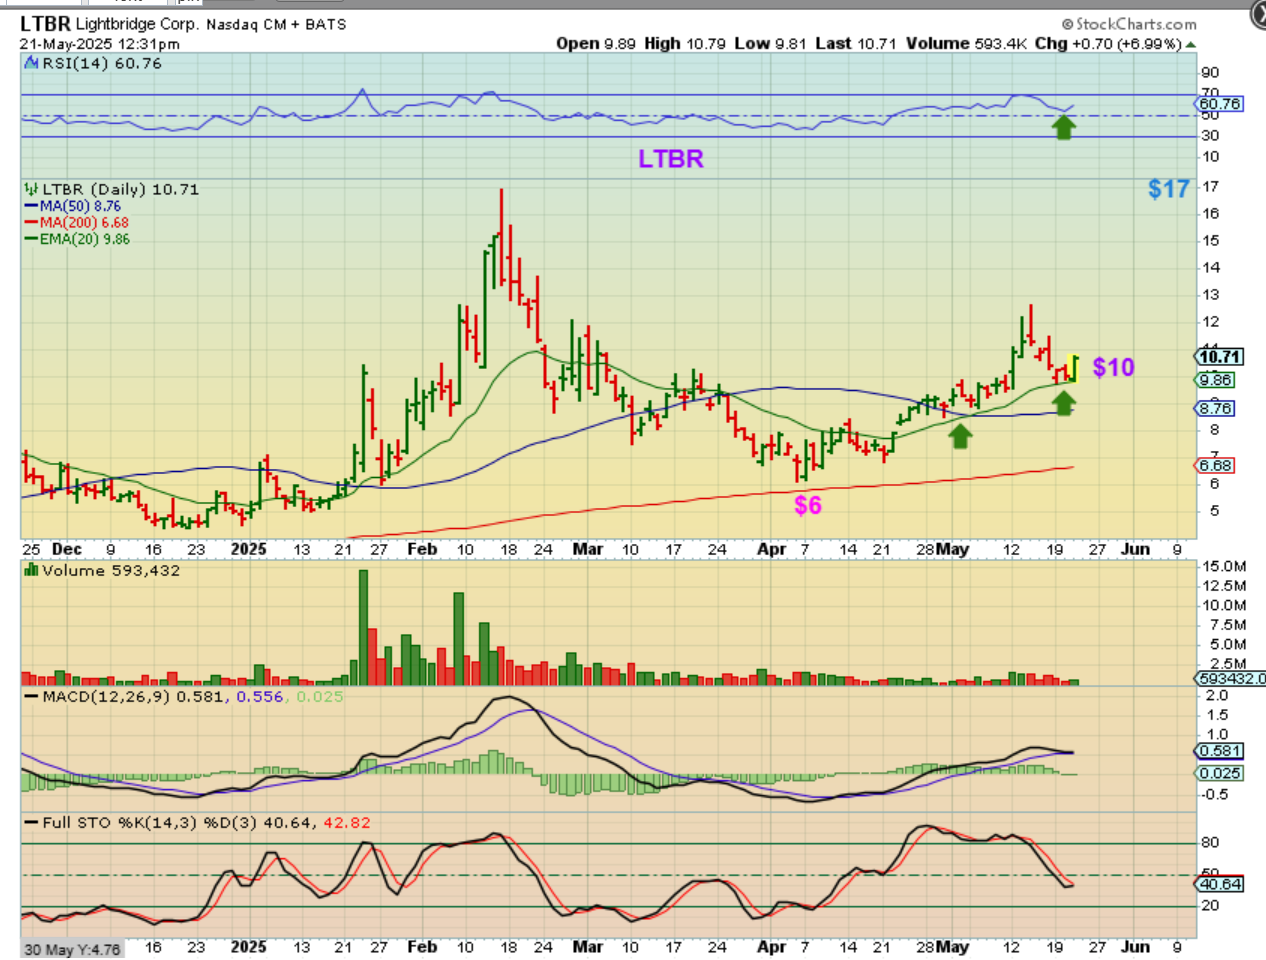
LTBR ran up, pulled back and reversed at support, so I bought this when it reversed. With market selling in the afternoon it ran higher and then sold off, only up 2%, so now I have to decide if I’ll hold or not. it might drop to the 50sma if we get a dcl sell off.
.
So in conclusion: Todays data may affect the markets more than the recent past, simply because the General Markets are now on day 32 and that is often where we start to see a dip into a dcl develop. Yesterday the markets seemed to sell off out of nowhere in the afternoon, so we’ll see what happens with todays data. If the data is viewed as positive, we could bounce and then dip, if viewed as bad, we’ll just start that dip into a dcl. I saw a lot of ‘set ups’ that looked good and I would expect some nice pull backs that will give nice entries or buying opportunities, so being patient in a sell off can pay off.
.
Enjoy your Thursday trading!
.
~ALEX
.
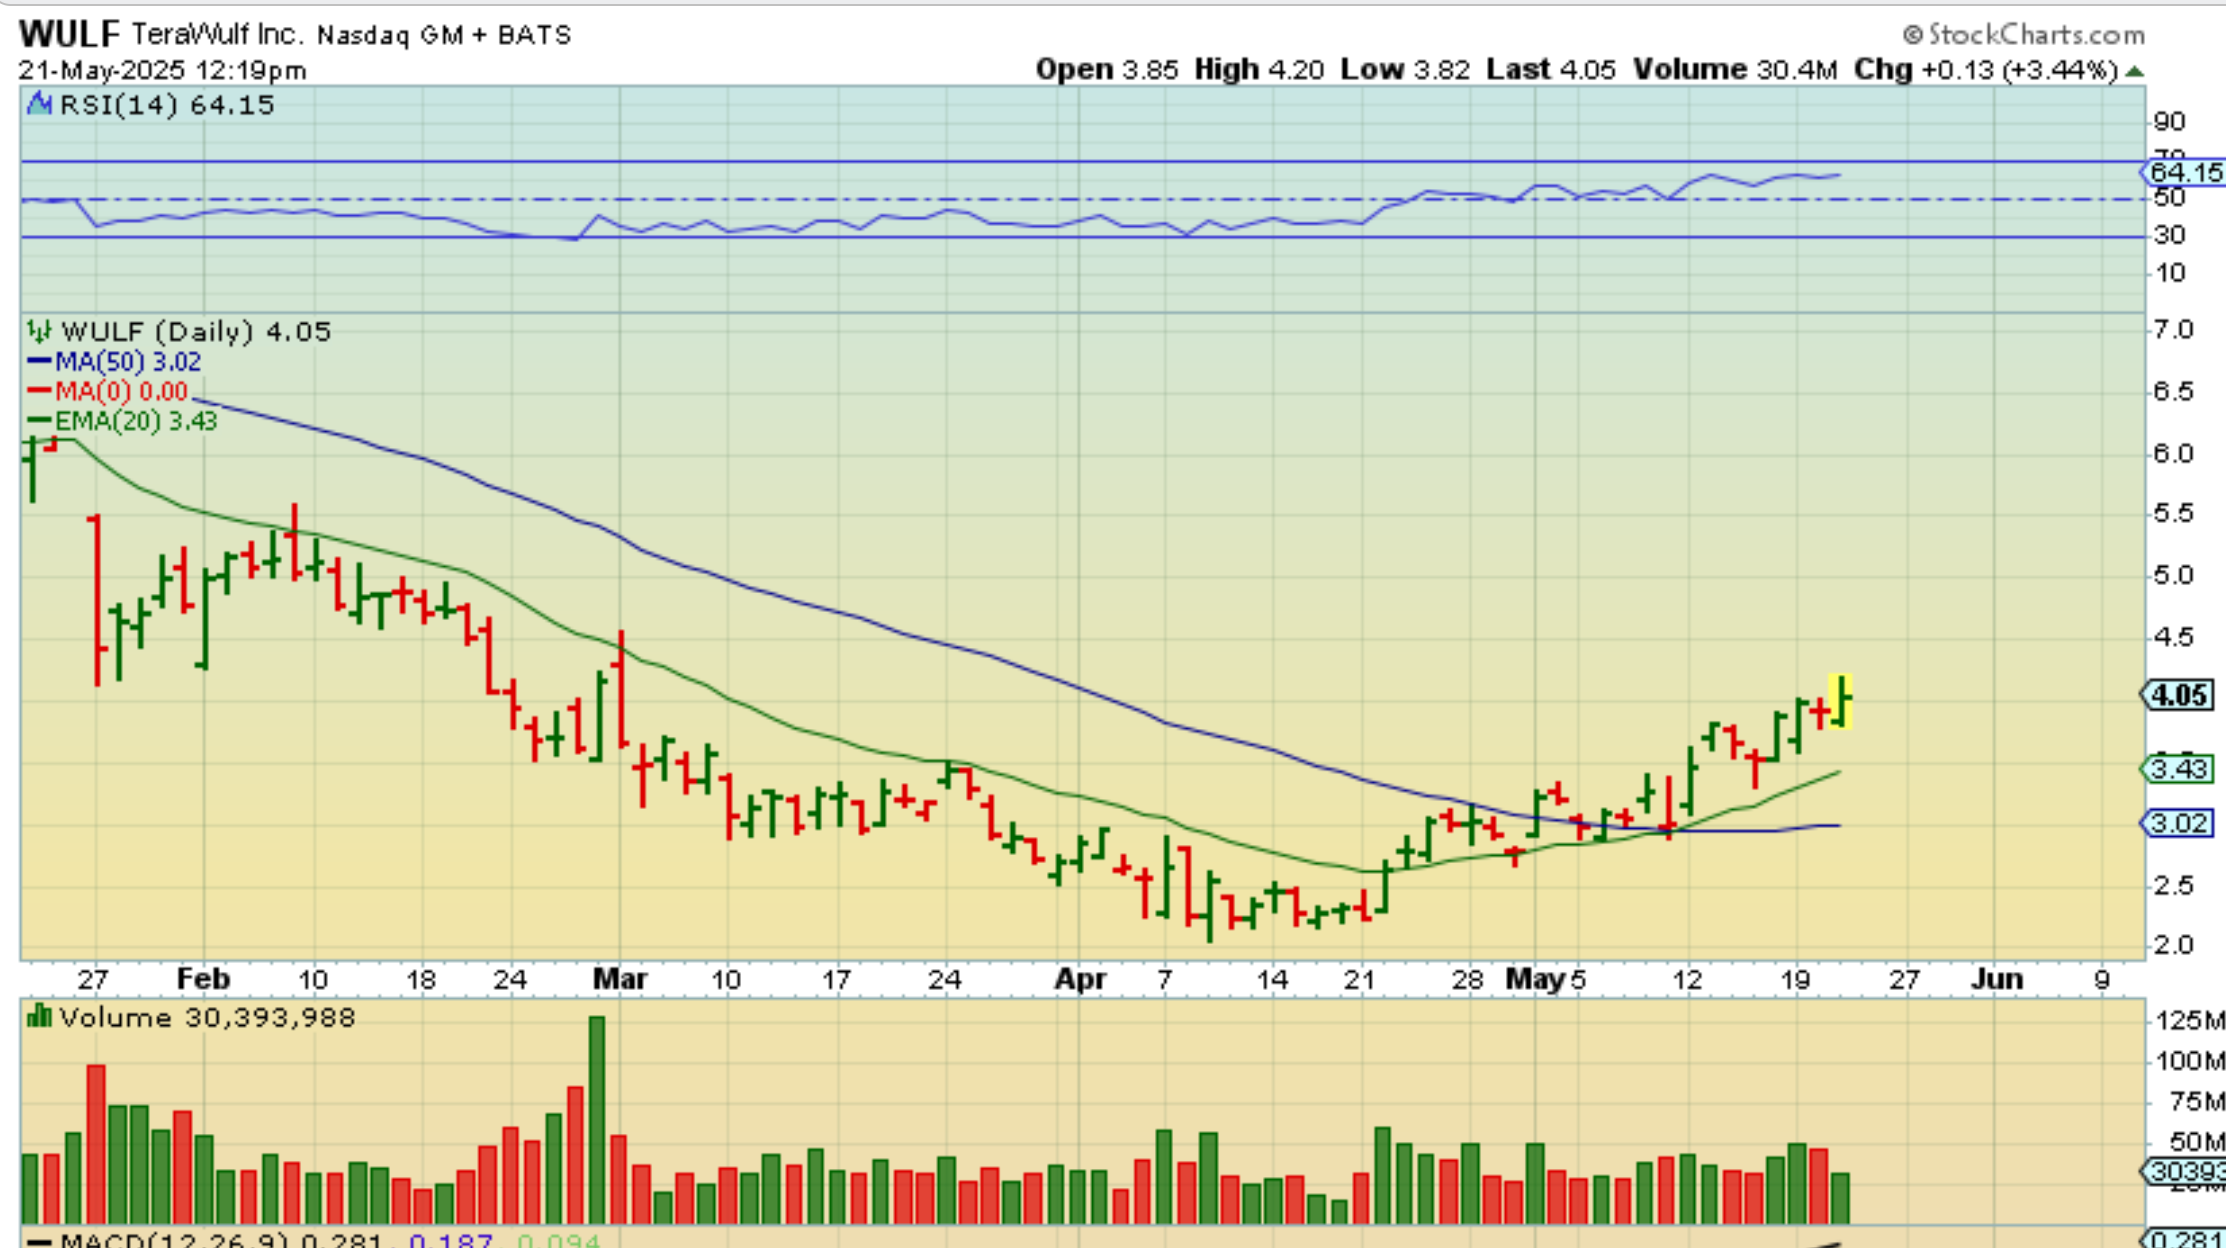
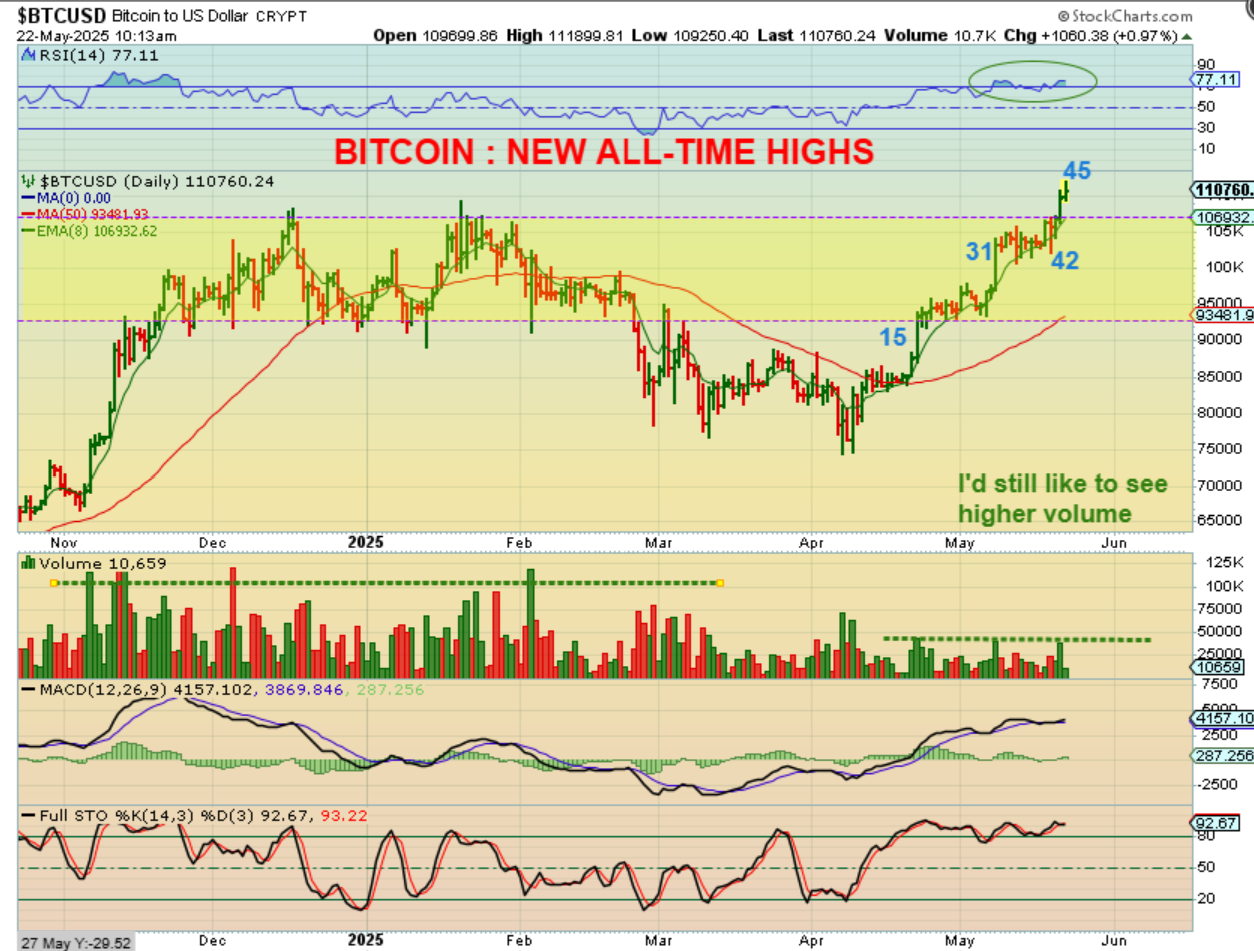
BITCOIN is breaking out to new all-time highs on day 45 (this chart is live right now). Normally I’d be thrilled, but the Crypto Stocks are a little less exciting. They are steady and making gains, but not in as quick of a manner like they used to. Last night Cason also mentioned that the ‘Alts aren’t doing well either’, so that is another factor to keep in mind when deciding ‘position size’. On day 45 we could get a pop and drop and choppiness too. We’ll see.
.
WULF is an example of that steady climb, but with Bitcoin at All-time highs and the general markets running straight up out of that ICL, I would have expected these to be running very swiftly. They are not.