Wednesday April 23rd – It’s Complicated
DATA for Wednesday may (or may not) move the markets, but it isn’t going to be released until after the markets open. Inflation numbers come out at 9:45 a.m. ET
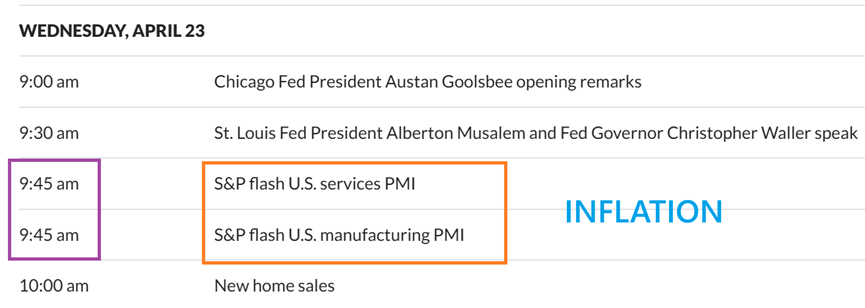
.
THE NASDAQ has a higher low and this idea was pointed out once we started to bounce out of the lows, so you can raise stops to this low whether you bought at the very lows or if you took a trade yesterday. Overhead resistance is the 20ema and a downtrend line.
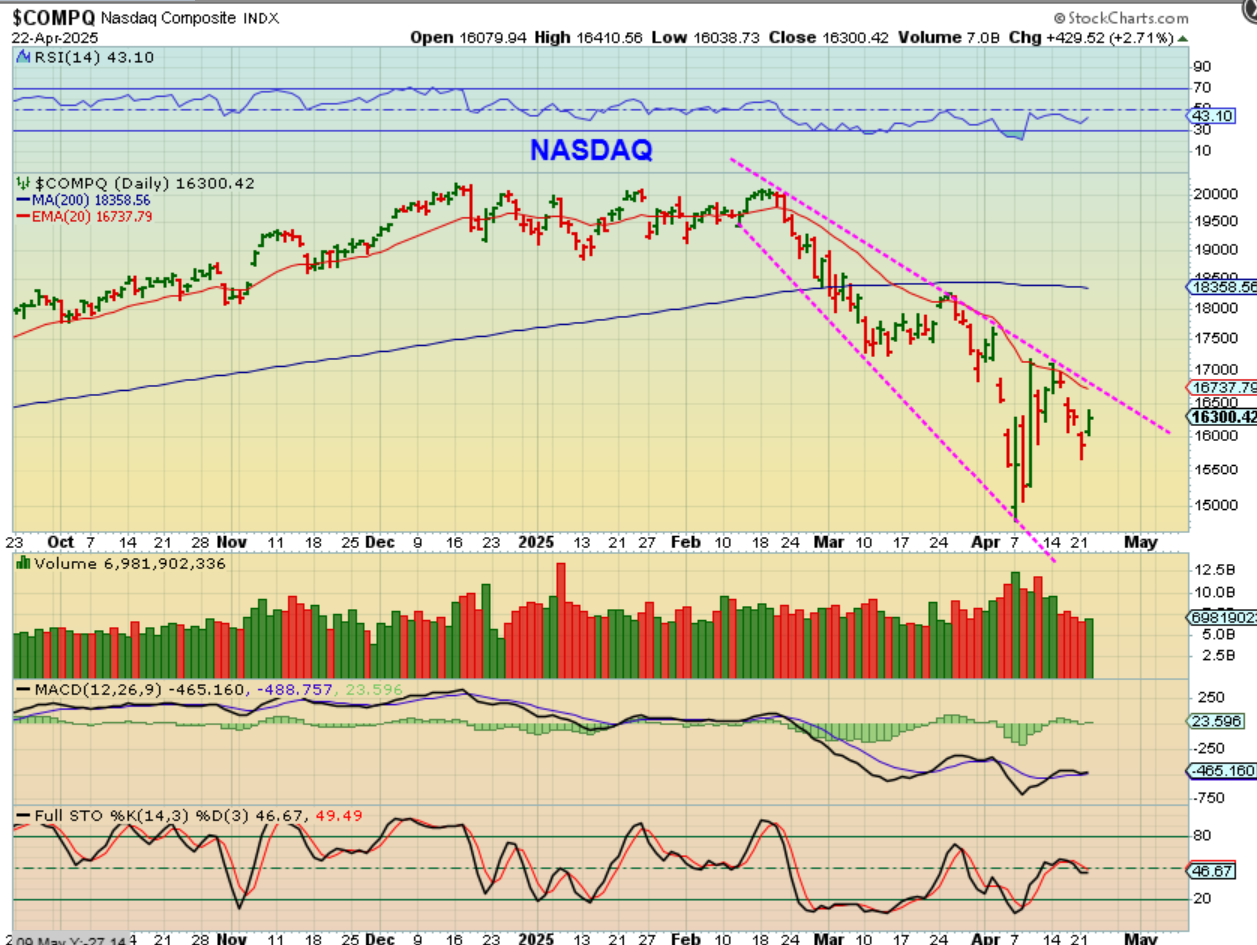
.
Here I am pointing out the resistance that has been holding price down, The SPX has been unable to get above the 20ema so far. Price may run back up there today.
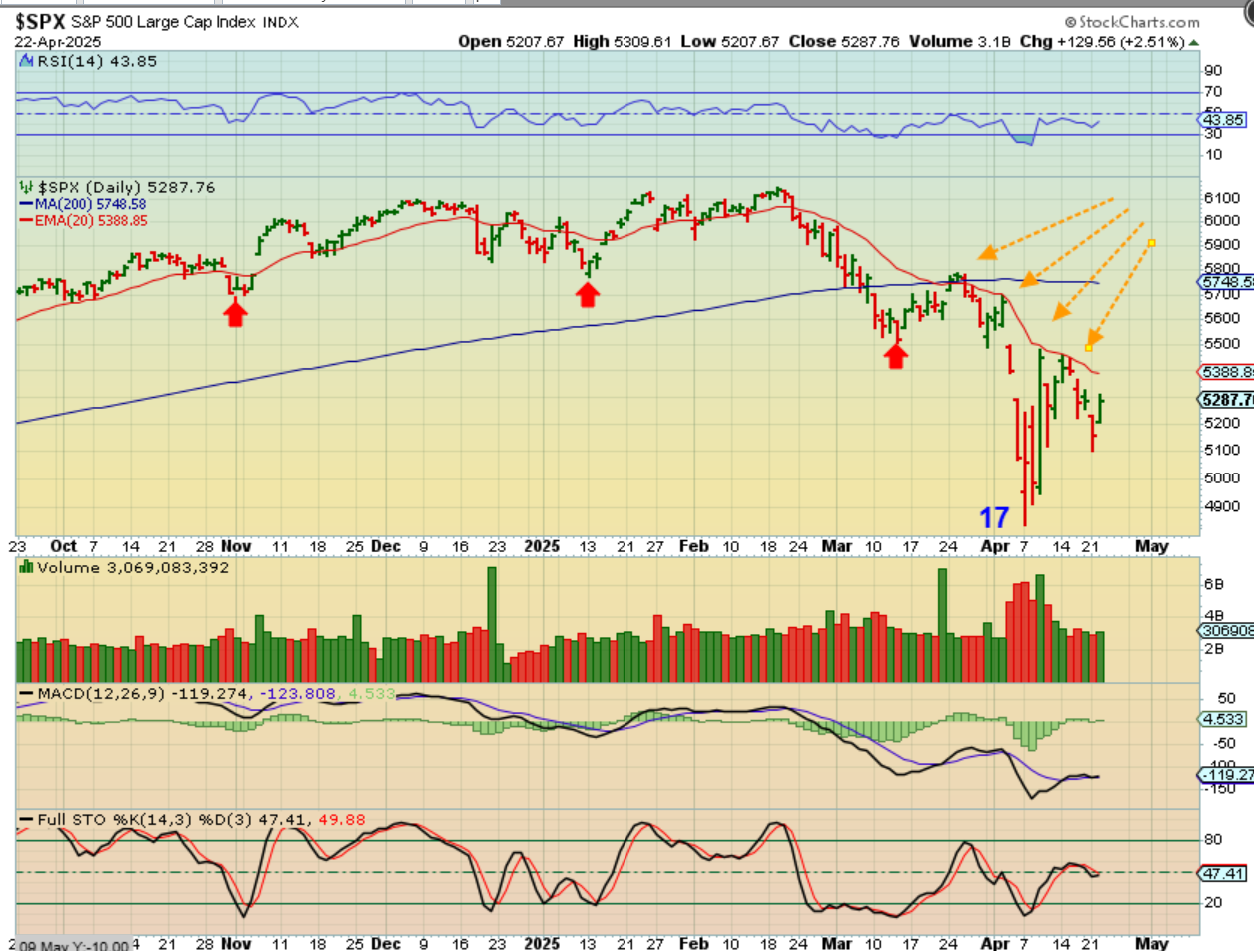
.
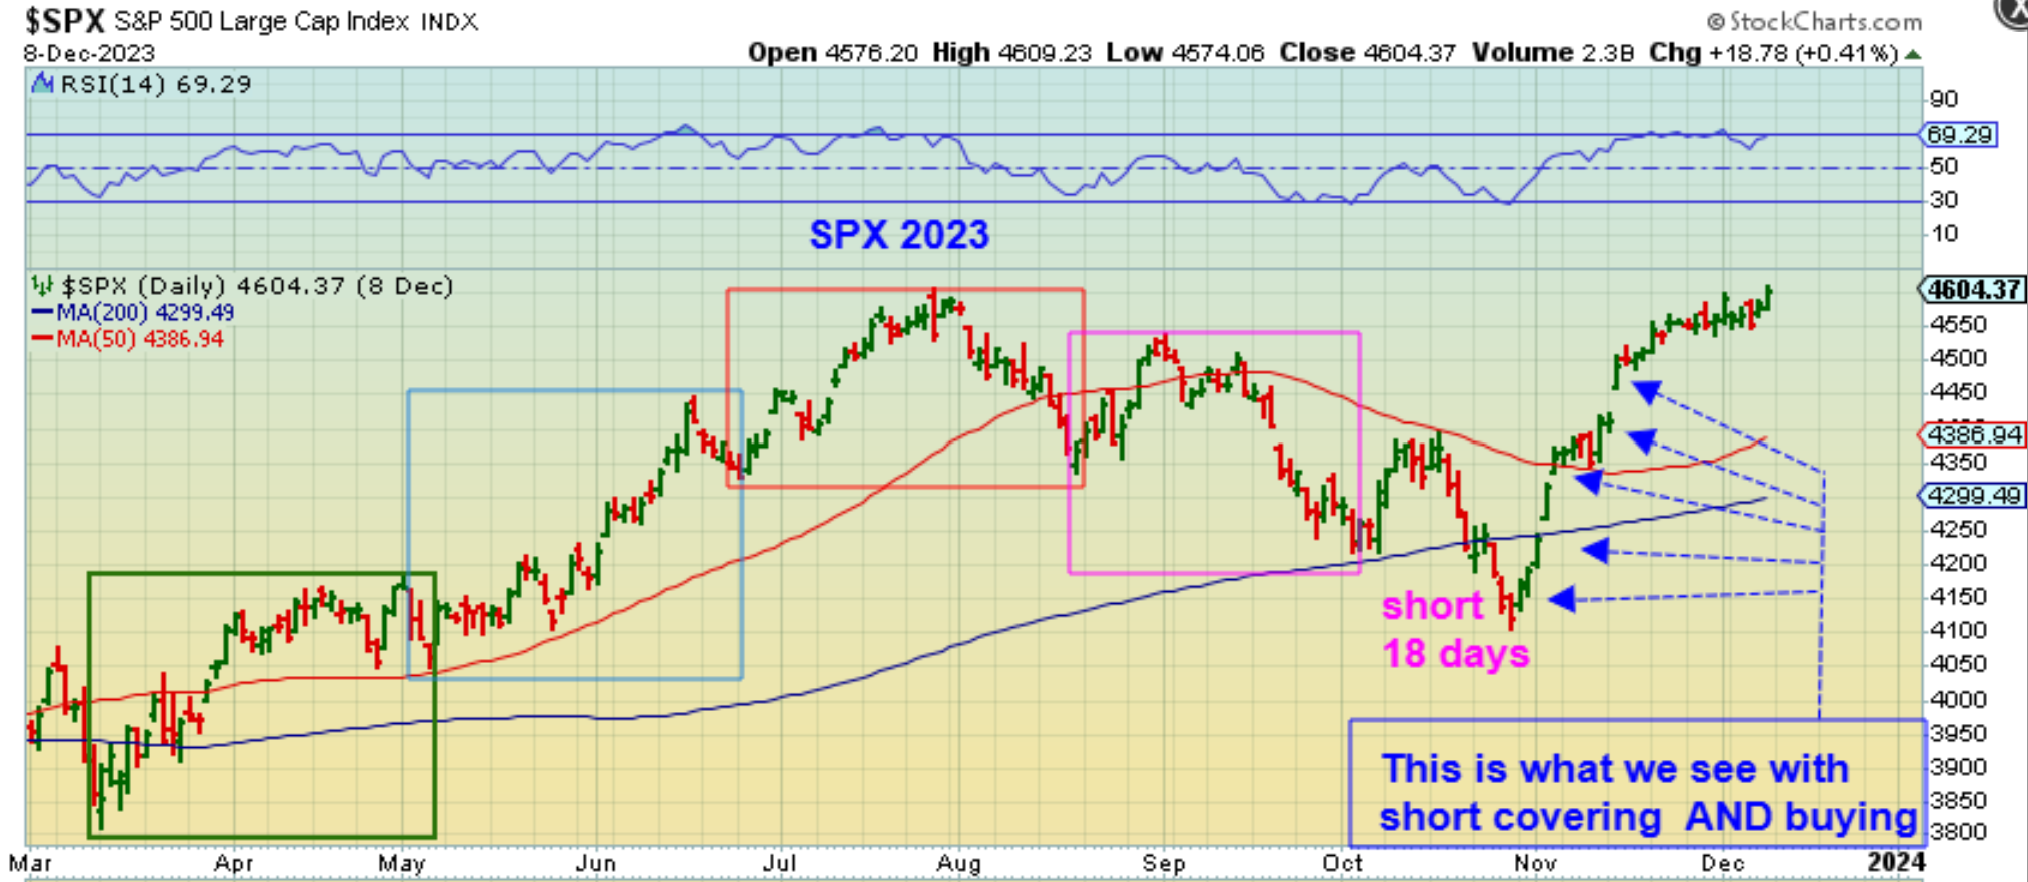
Once again, I am pointing out that final shorter drop in 2023.
I pointed this out when we saw that reversal at day 17 2 weeks ago, just to show you that we COULD, MAYBE, MIGHT get an early exhaustion low with a reversal that becomes the low. To be safe, we also keep in mind that if our current low were to become a 35 day daily cycle, the current lows will be broken and that is why we buy with a stop.
.
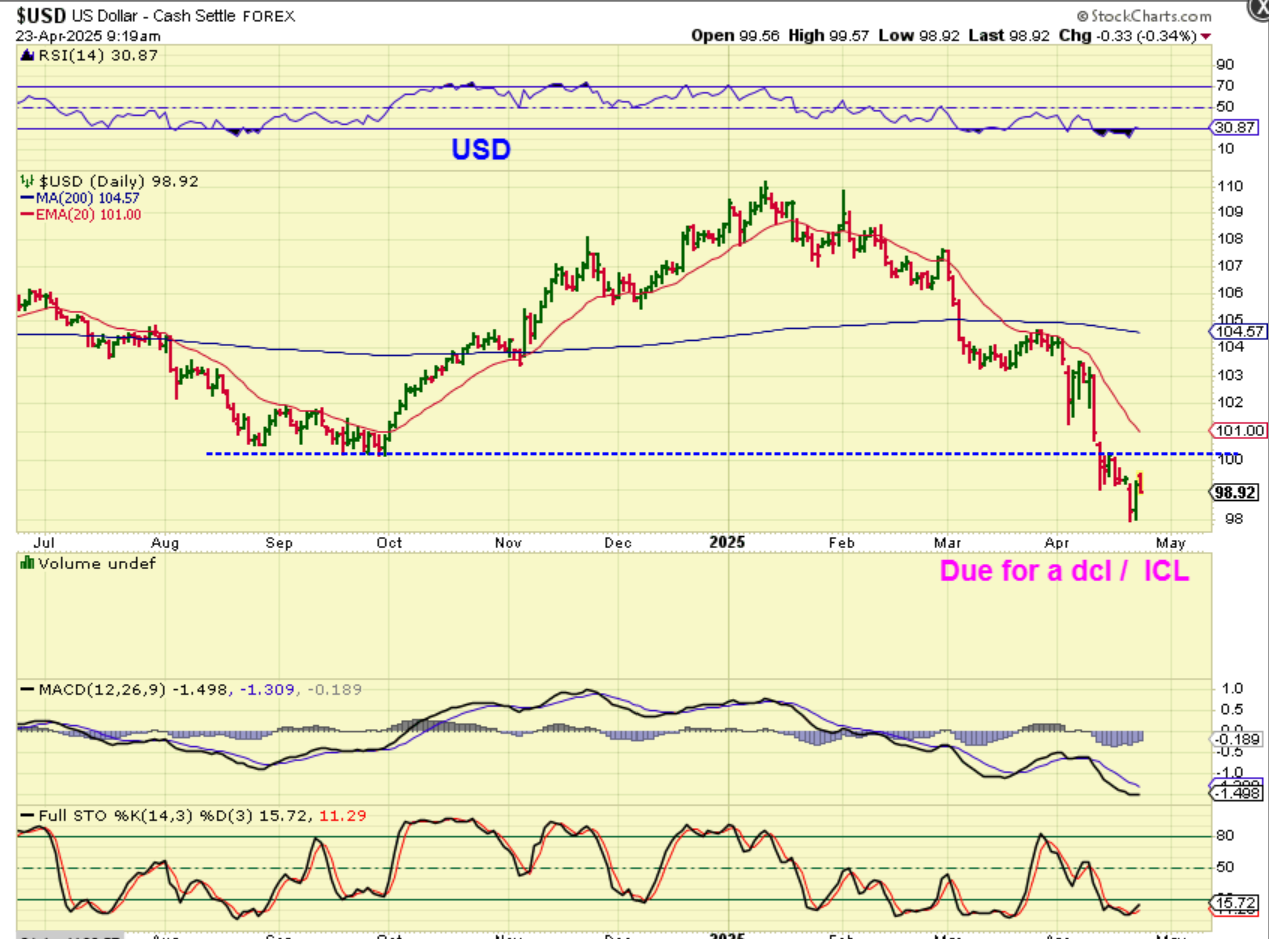
THE USD has basically plunged a few times since March and it even broke to new lows recently. It is due for a dcl or even an ICL. I had been seeing & discussed Gold and The USD move higher together in November, December, and January. That ‘opposite correlation’ that they most often have ended for a while. Now that the USD plunged and Gold ran straight up, we may see that opposite correlation starting to take place again. The USD may bounce strongly here and Gold could drop into May, as originally expected.
.
YESTERDAY I MENTIONED:
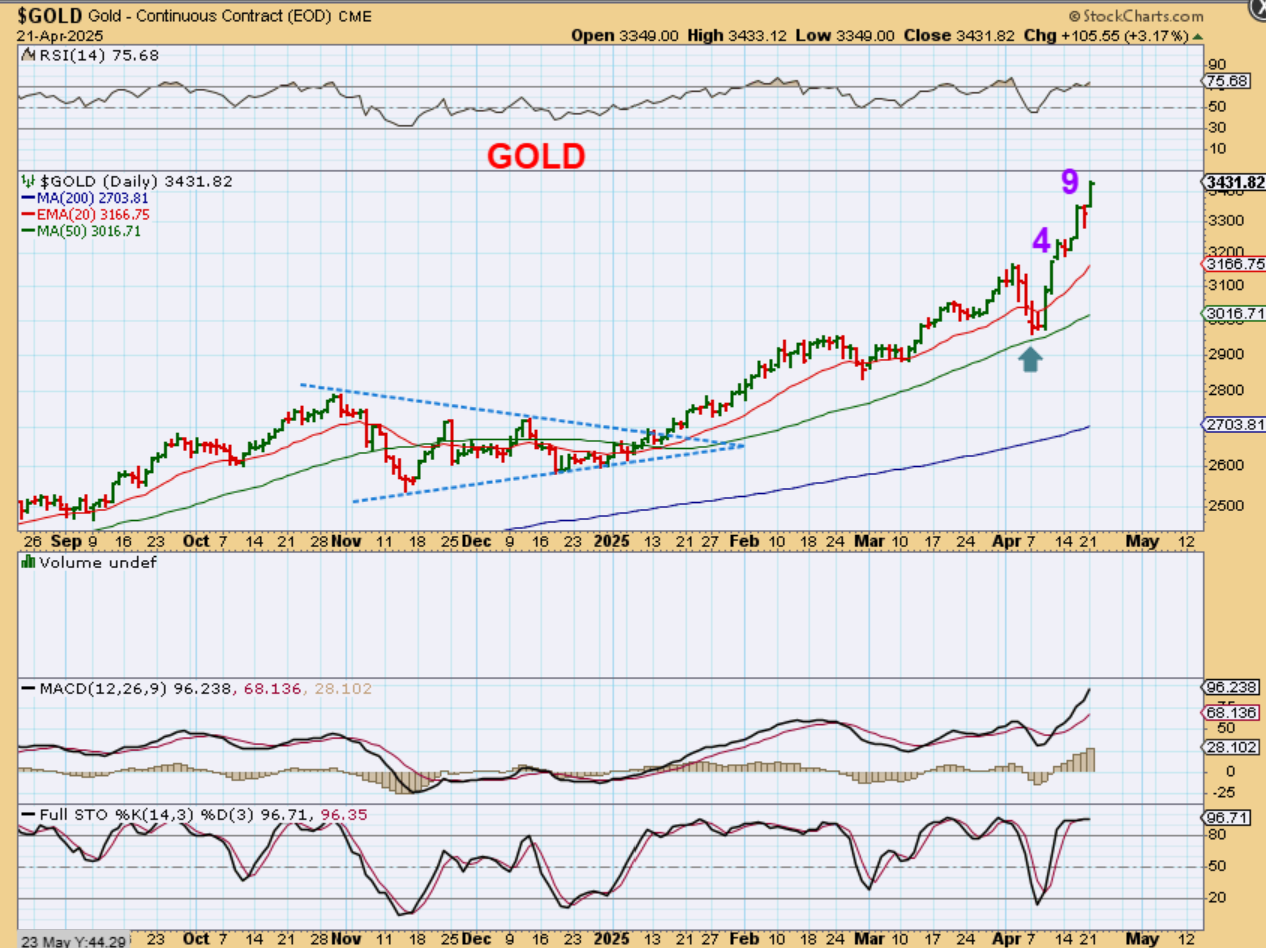
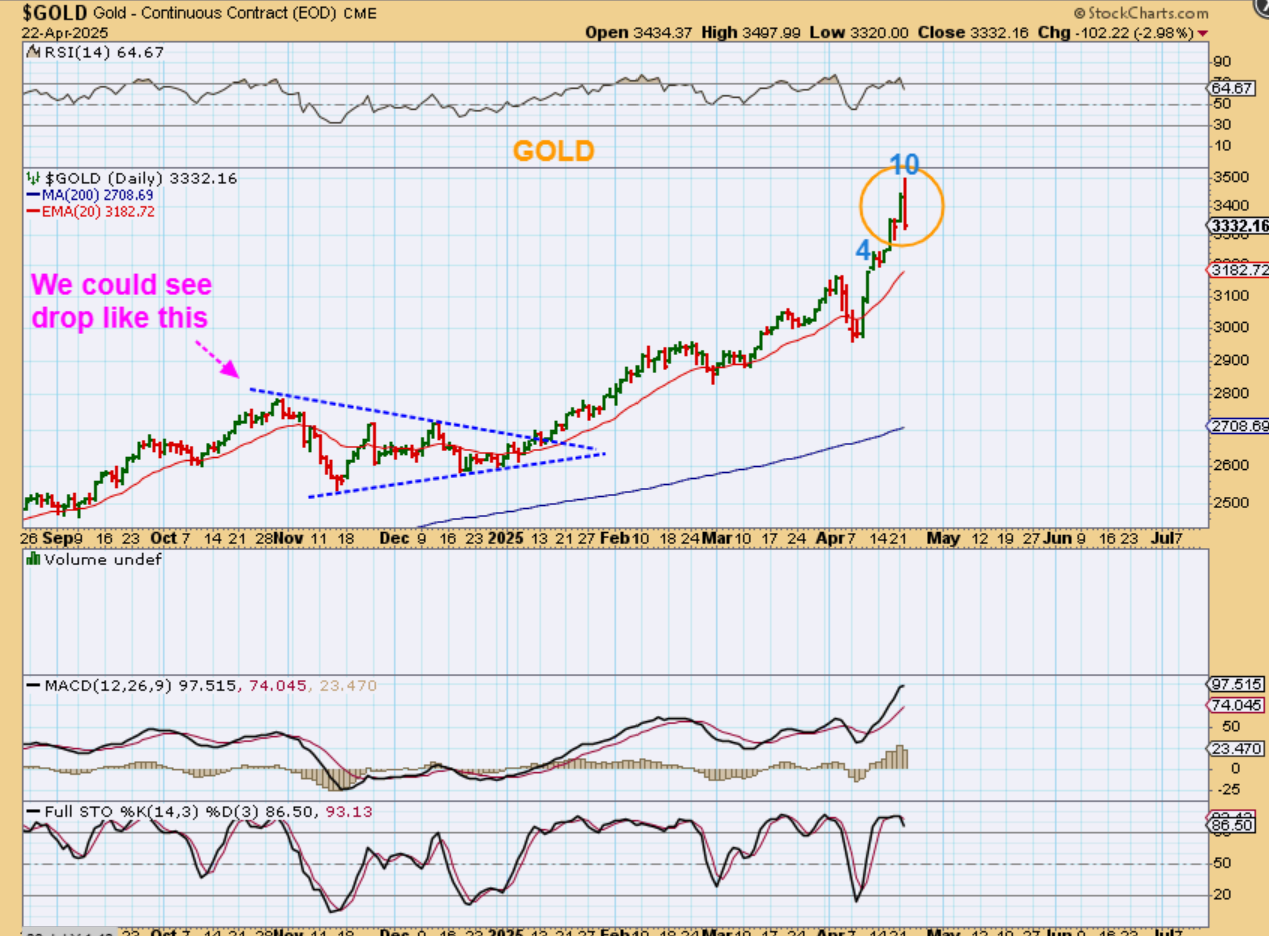
GOLD certainly did not slow down on day 9 Monday. Gold looks like it could go for the $3500 (nice round number) as the next point of interest. That $3500 is actually one of the targets on a weekly chart, but I wouldn’t doubt Gold until we see a swing high in place.
.
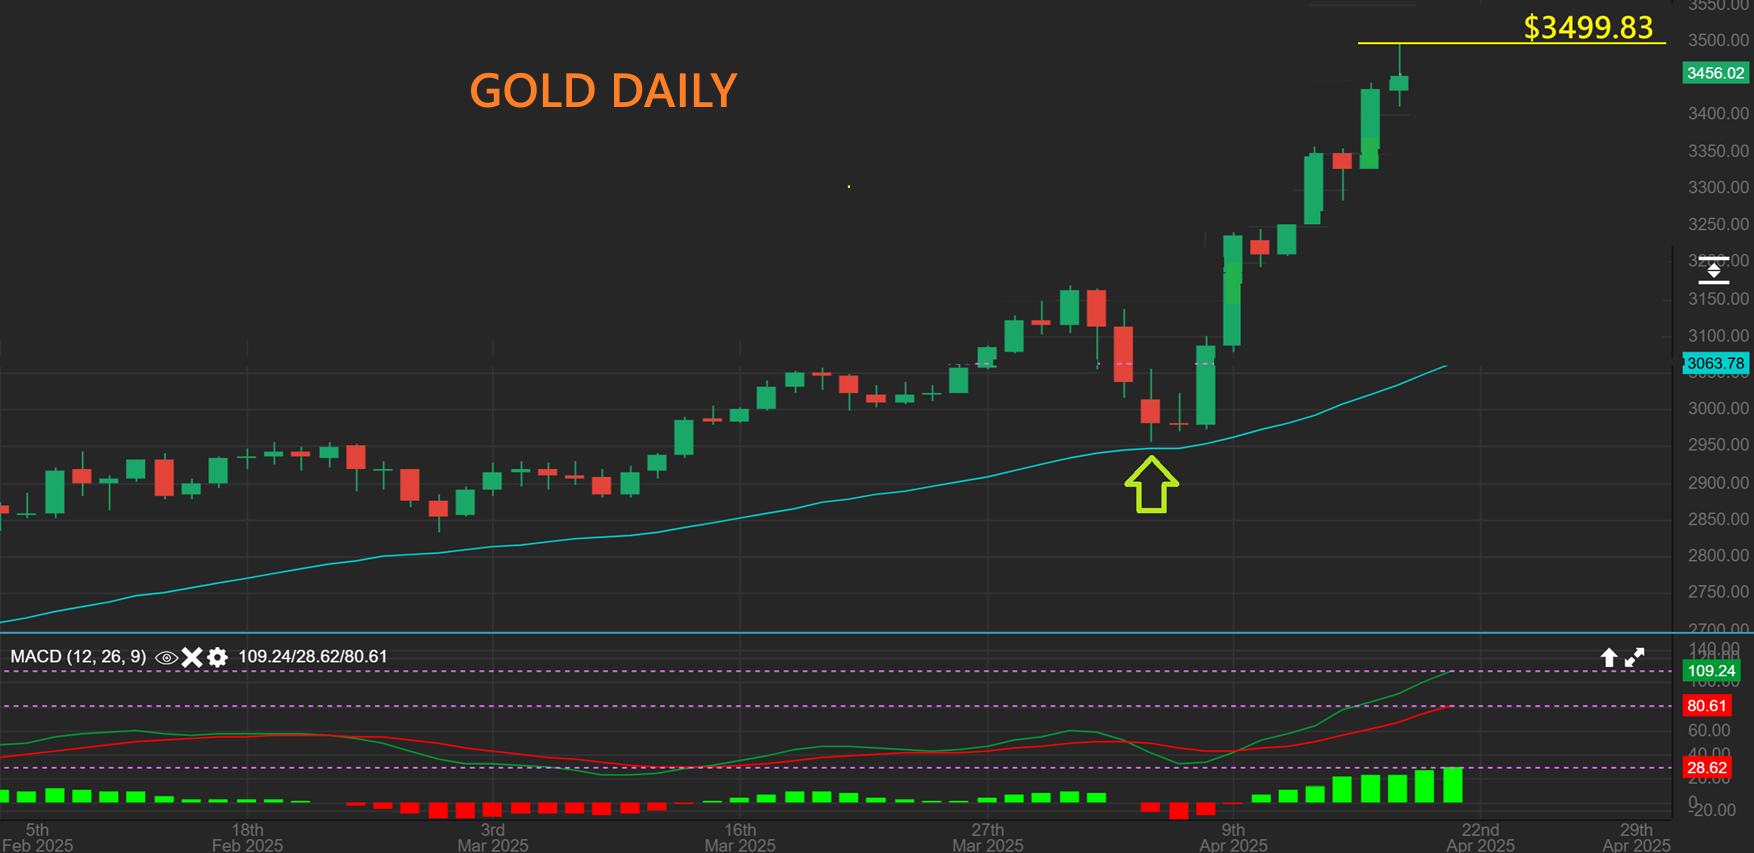
Believe it or not, GOLD hit $3499.83 on Spot Gold. That is 13 cents shy of that $3500, then it started to pull back, as you can see here with Gold at $3456. Well, did GOLD continue to drop or did it bounce back?
.
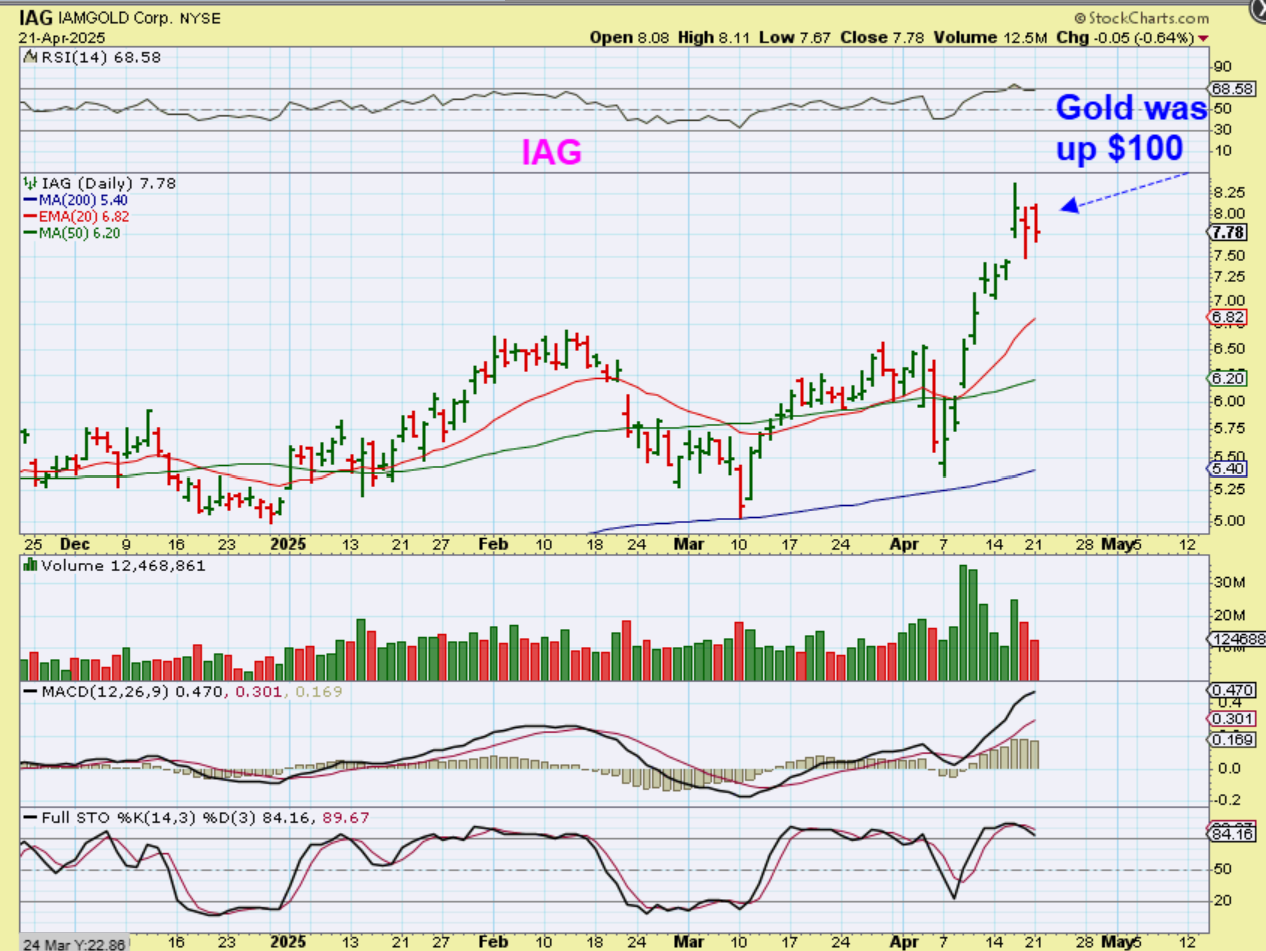
GOLD #1: GOLD ran up about $50 and then closed down over $100 with a pretty solid reversal on day 10. This would give us a L.T. daily cycle if the daily cycle is over 20 days long (They usually are). So now we could see a drop into May, as hoped for, but a bull like this might have some pretty strong bounces too.
.
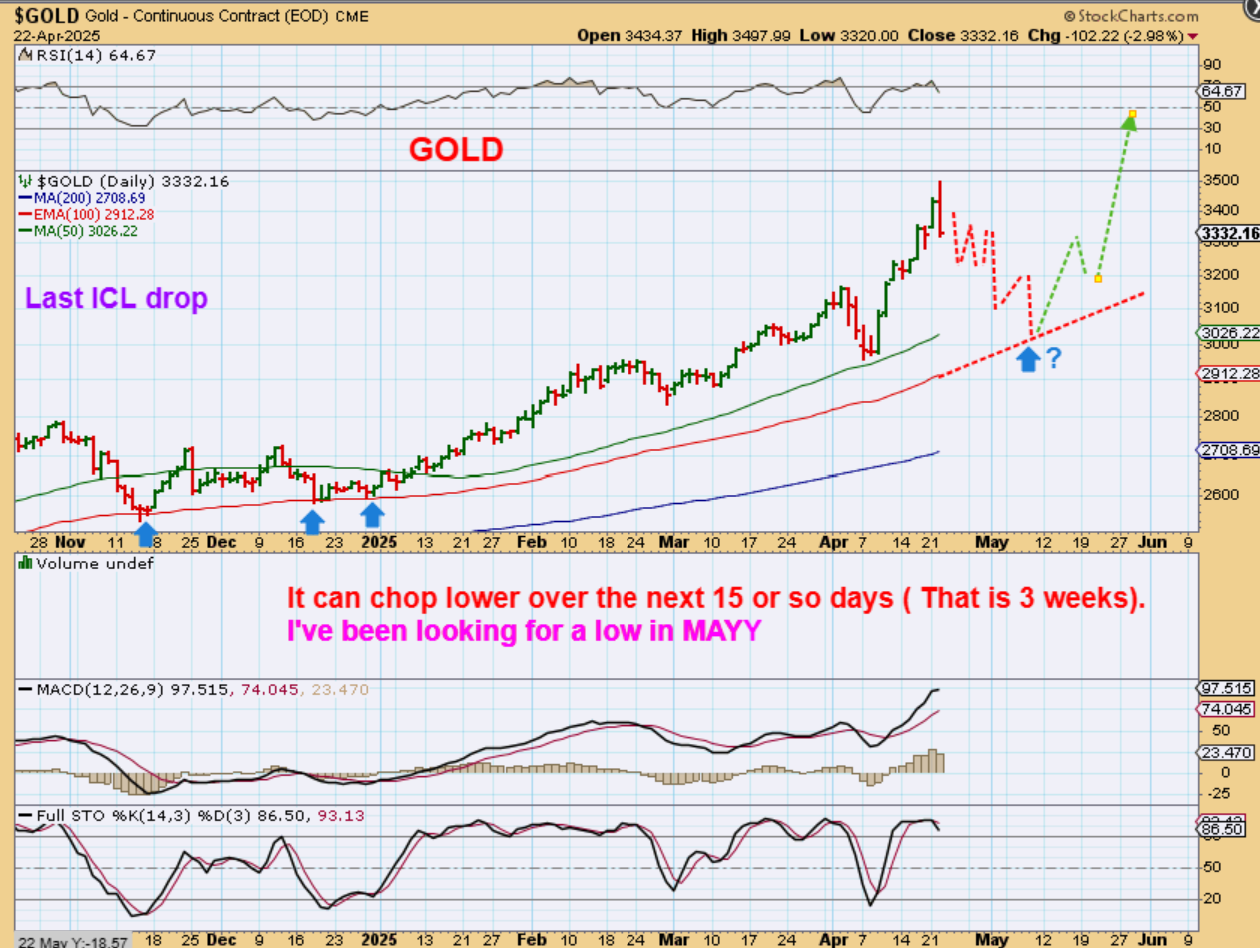
GOLD #2 – I’m just throwing this idea out there; it is not really an exact ‘prediction’ of the path of Gold. I’m showing the anticipated pullback with some bounces on the way. We can also take a look at the November drop into an ICL for clues. Another run higher from here could be the blow off top scenario, and this would be a strong buy.
.
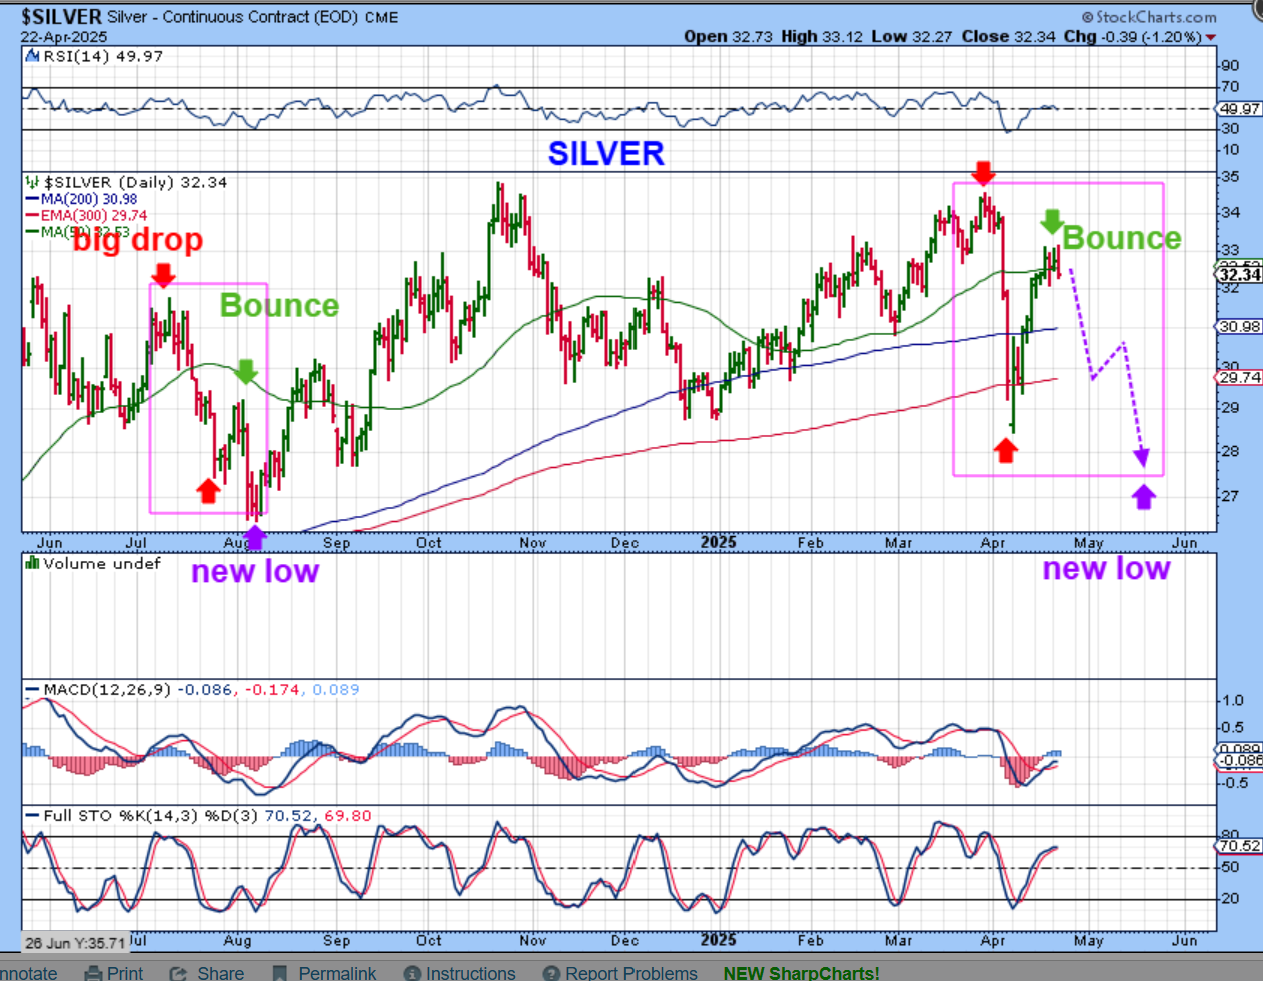
SILVER did not rally up to new all-time highs like Gold, so it can be expected to drop fairly easily when the time comes.
1. I looked back at July and saw a pretty sharp drop, a bounce, and then a final drop.
2. In April, we already had a sharp drop and a pretty good bounce, so now we may just drop to a slightly lower low hopefully (Rather than a huge slam down).
3. The point is that we should expect a drop into May that could bring us below $28.
.
On MONDAY GOLD WAS UP $100,
and yet GDX & THE MINERS POPPED AND DROPPED,
So I POINTED THAT OUT…
.
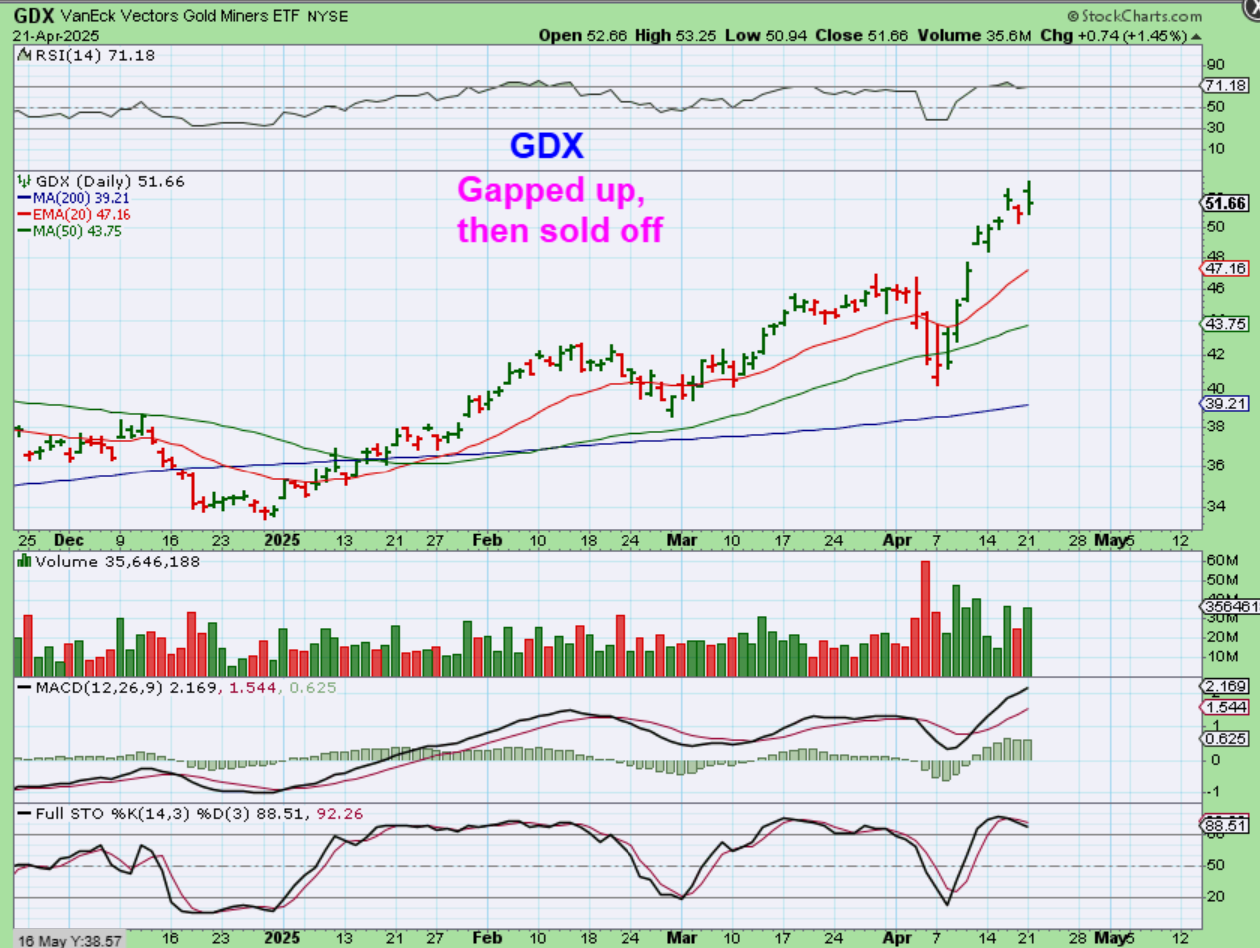
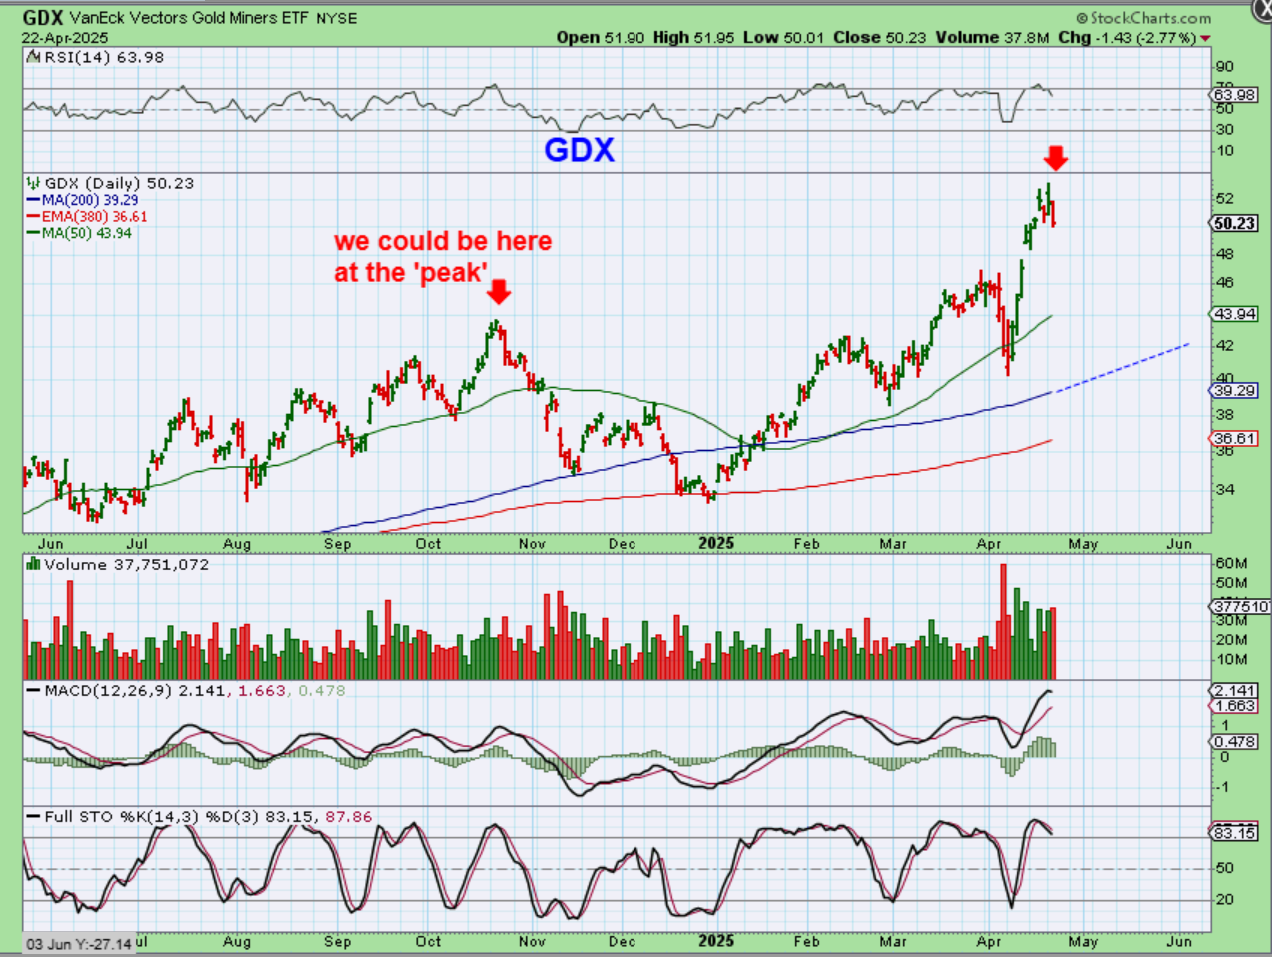
GDX DAY 9: Gapped up & sold off. Miners are at the highs, but if this is going to form as a L.T. Daily Cycle and dip lower into May, it can peak anywhere from day 7-13 and sell down. Volume has been strong as buyers piled in.
.
YESTERDAY I SAID: Looking at some of the Gold stocks like IAG, HMY, KGC, etc, we know that Gold itself was up $100, but even the stronger gold Miners started to ‘stall’. This may be hinting at a ‘peak’.
.
GDX – Miners actually started to follow Gold this time and rallied straight up, but if Miners are going to continue to act like Miners, then you KNOW that they can really get caught up in the selling when the time comes. If we are at a ‘peak’ for Gold and the Miners, then we could see this drop down to the blue 200sma or maybe even break it like it did in November. The next low should be a ‘Strong Buy’ if Gold does not look like it has a blow off top in place.
.
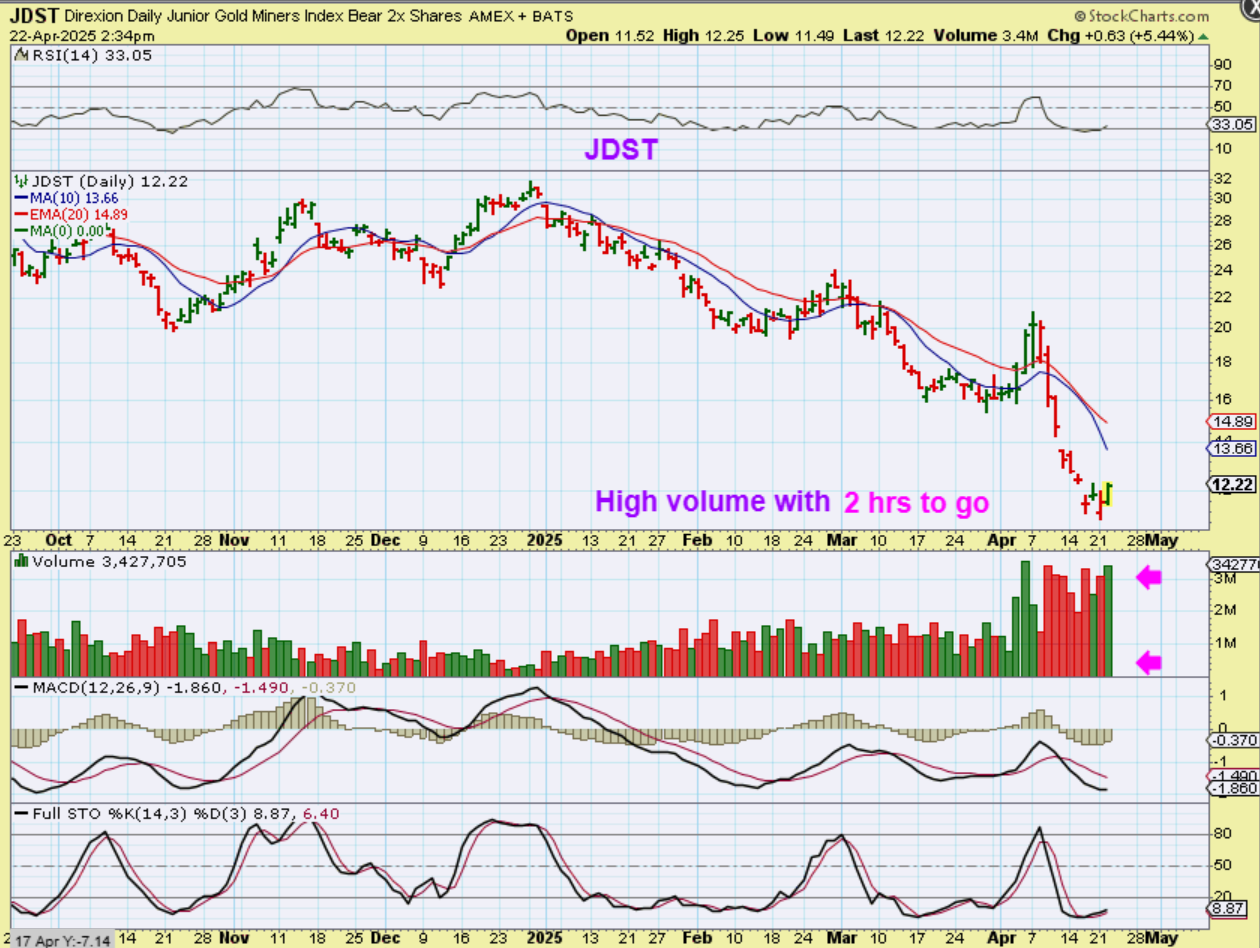
I was pointing out JDST over the past 2 days in the comments area, simply pointing out that it looks like a possible low is forming. It is VERY HARD to short a bull market, because a bounce can be pretty strong, but this is one way to short it.
.
Right now we have been discussing how the bounce out of the recent sell off lows could play out. It will take time to fully play out to a point that we can read it clearly, but for now it was expected and we can play it with a stop. Gold may have peaked and the Miners seemed to sense that on Monday when Gold was up over $100 and Miners popped and dropped. This would give us the dip into the month of may, which is something that I have been expecting. The big question: Is the parabolic move for Gold still ahead? If so, Miners will become a very strong buy in May, so we do want to be prepared to take advantage of that. I am thinking of putting together a special section about parabolic moves in the coming weekend report. It will be very important to discuss Gold in this context.
.
We’ll see if the inflation data at 9:30 am moves the general markets or Gold. For now, enjoy your Wednesday trading!
.
~ALEX
.
YESTERDAYS REPORT:
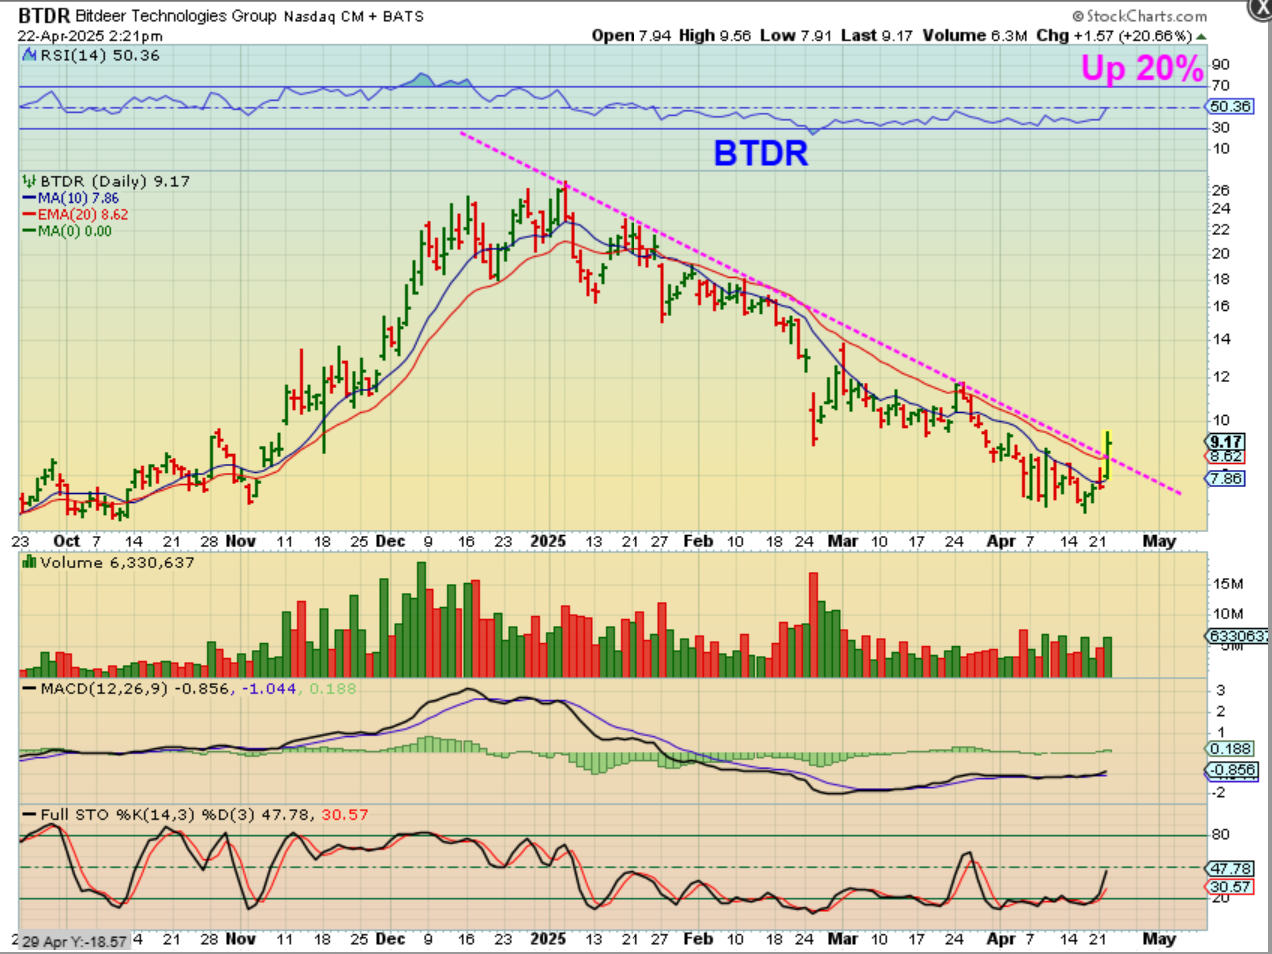
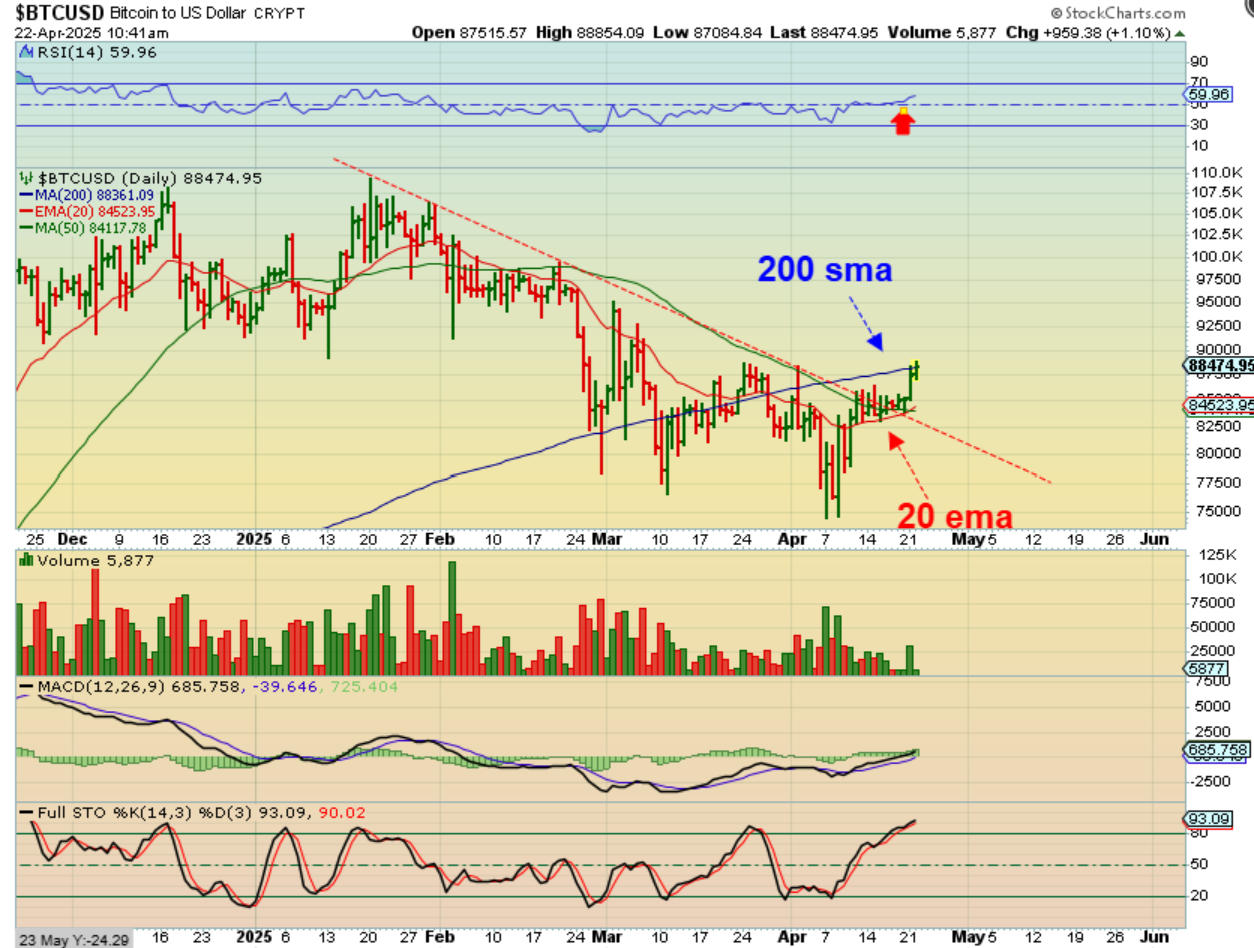
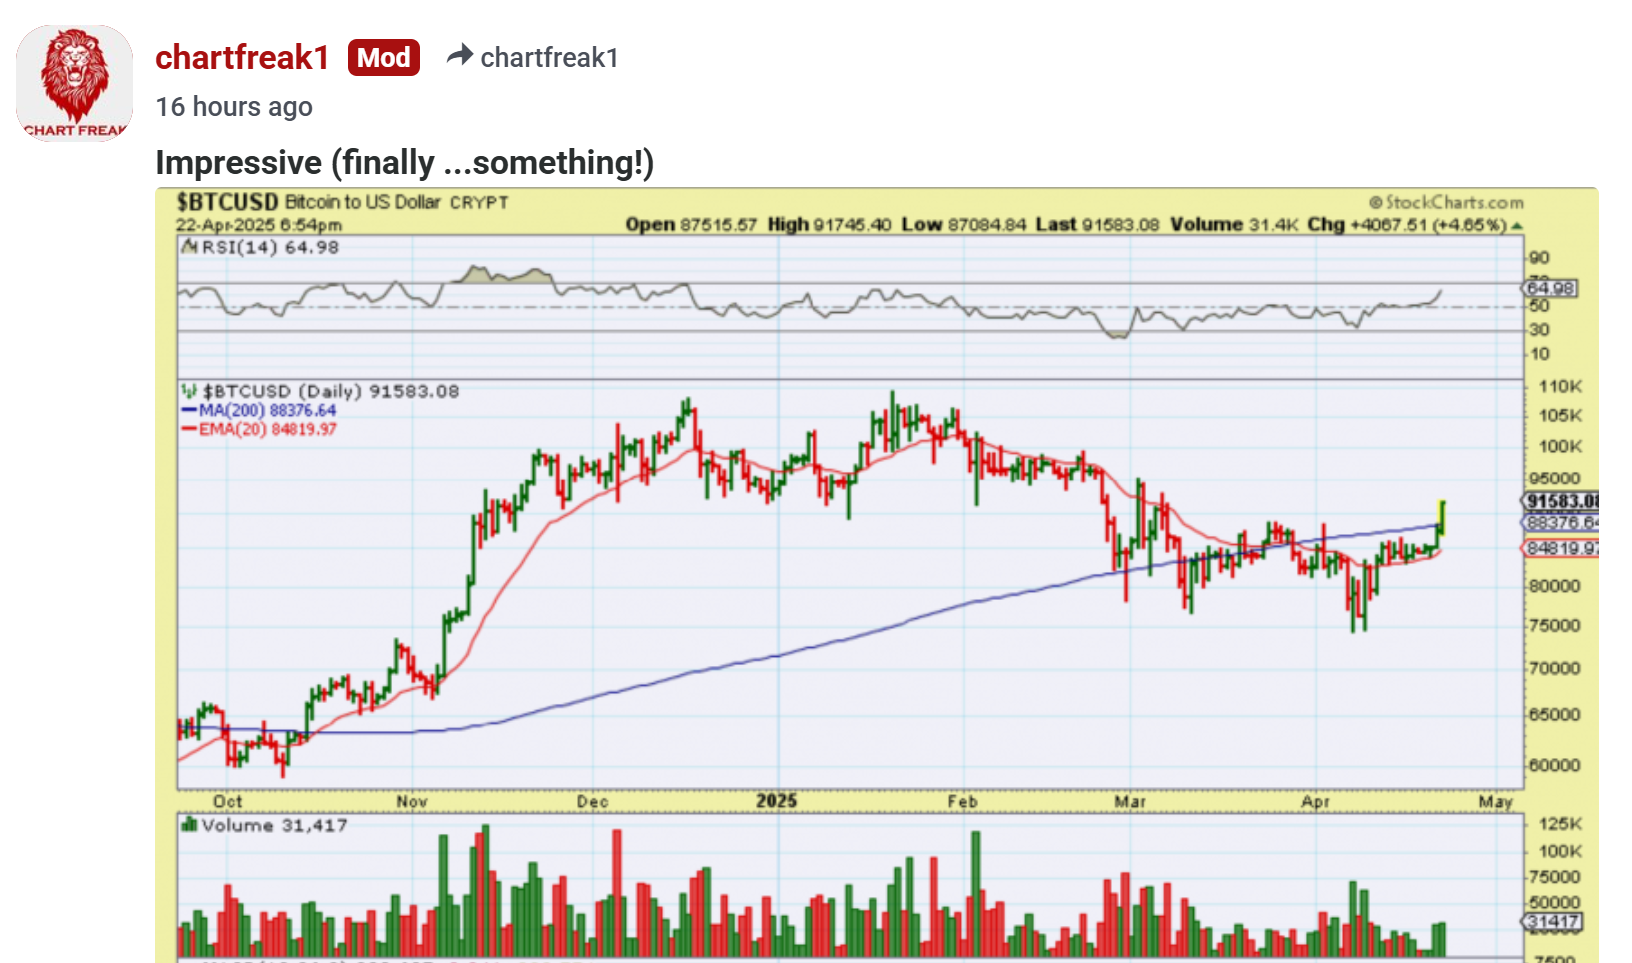
BITCOIN pushed above that 200sma overnight and did make a slightly higher high, so that is progress.
.
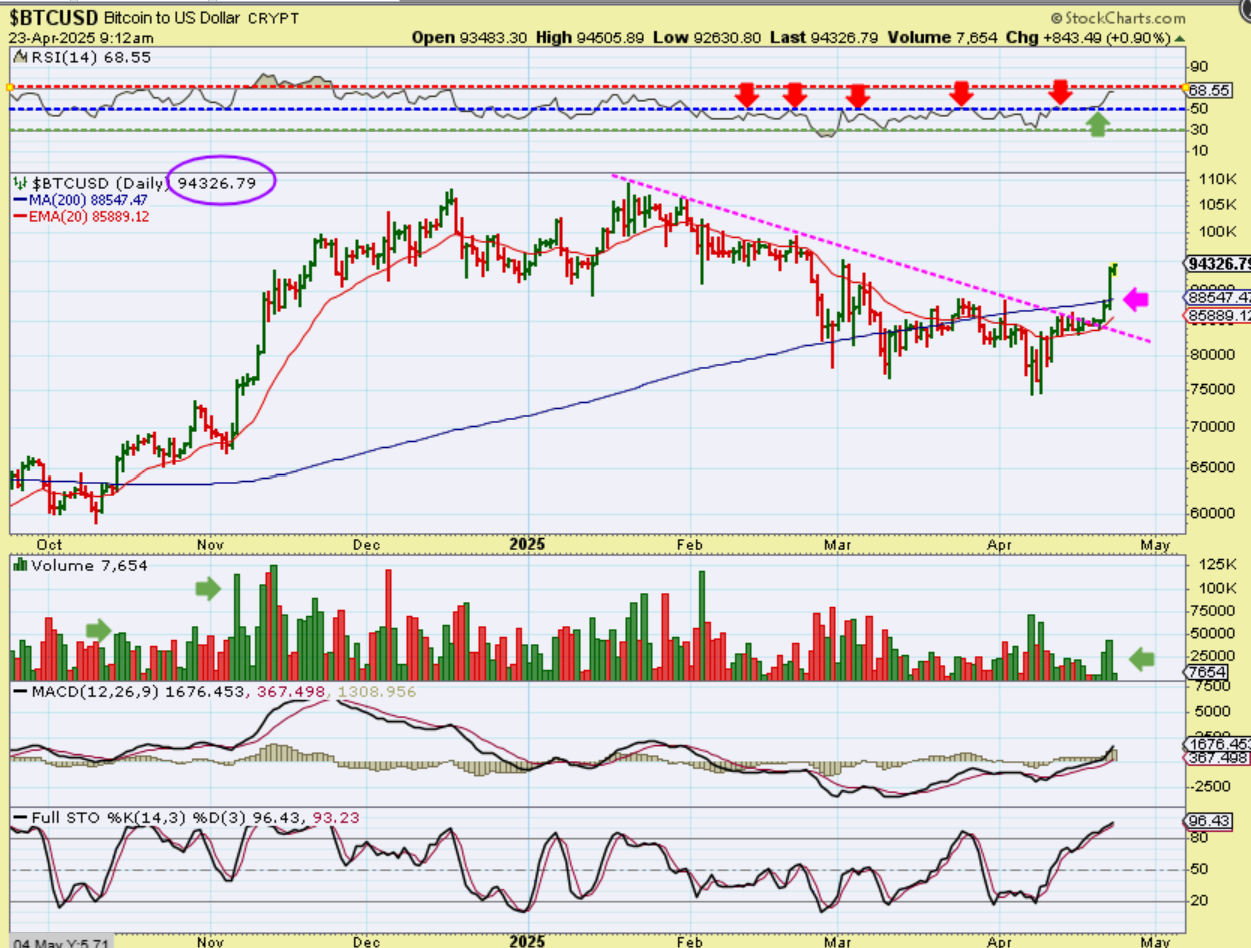
BITCOIN broke higher yesterday and I posted this in the comments. Crypto stocks were now starting to follow.
.
BITCOIN broke and the RSI is above 50%. Volume is increasing and crypto stocks did start to follow…
.
BTDR was up 20%, but the move looks small compared to the potential. These are very choppy and difficult when they run, but they do make strong gains.