April 19th Weekend Review
.
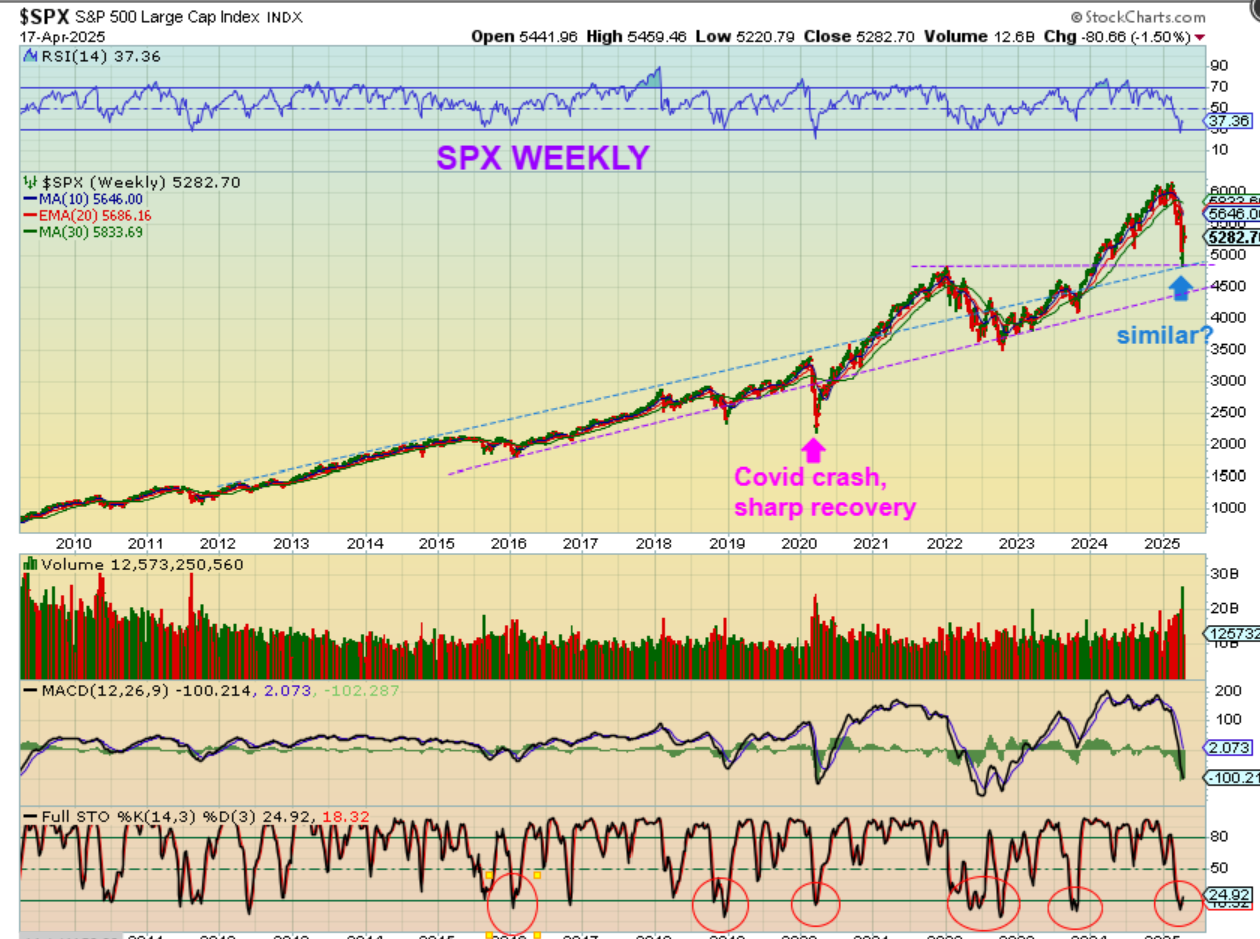
SPX CORRECTIONS – I always like to keep an eye on what is happening ‘now’ and compare it to similar times in the past. Right now, we have experienced a crash that was brought on by uncertainty in the markets with tariffs, lay offs, companies lowering expectations, etc. So far this appears to match the crash that we saw with the uncertainty that Covid brought about. Everything was shutting down and we wondered how companies would be able to survive. Let’s take another look…
.
That Covid Crash actually started to rally back and following the old pattern of ‘Climbing a wall of worry’. Why?
Well, it reversed higher in April 2020, right when most businesses changed and worked from home, hospitals were maxed out capacity wise, there was no vaccine and tens of thousands of people were dying. Masks, hand sanitizer, no traffic on the streets. fear and panic took place in some areas during 2020, but the markets somehow rallied back to new highs that year.
.
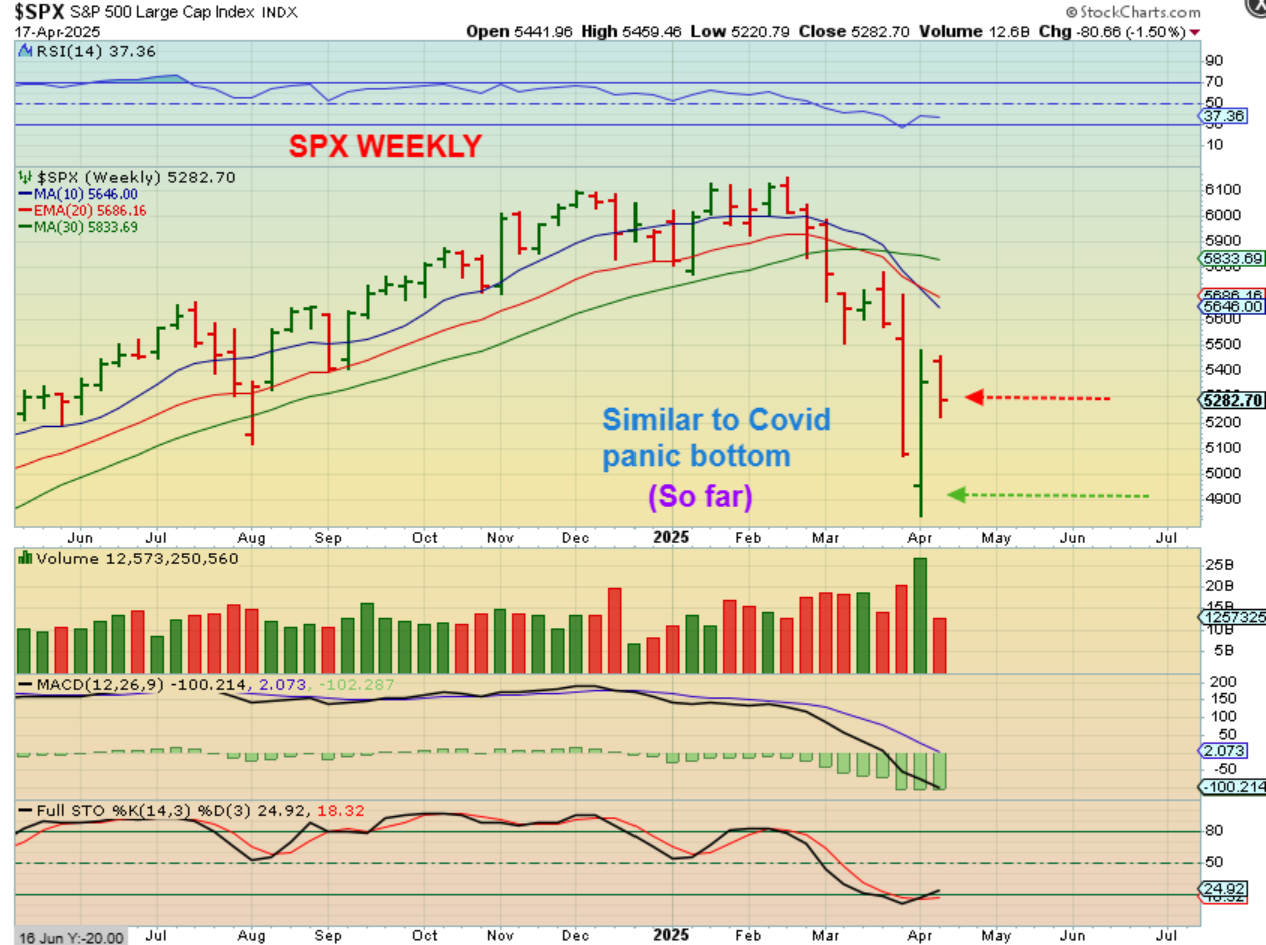
This is the same chart and we’ll discuss right now:
We have a similar sharp drop to a support level and a large reversal candle developed, so that could be bought with a stop. It reached oversold on a weekly basis and it is possible that this is an ICL, but it is too early to know for sure. Next We’ll look again at past corrections…
.
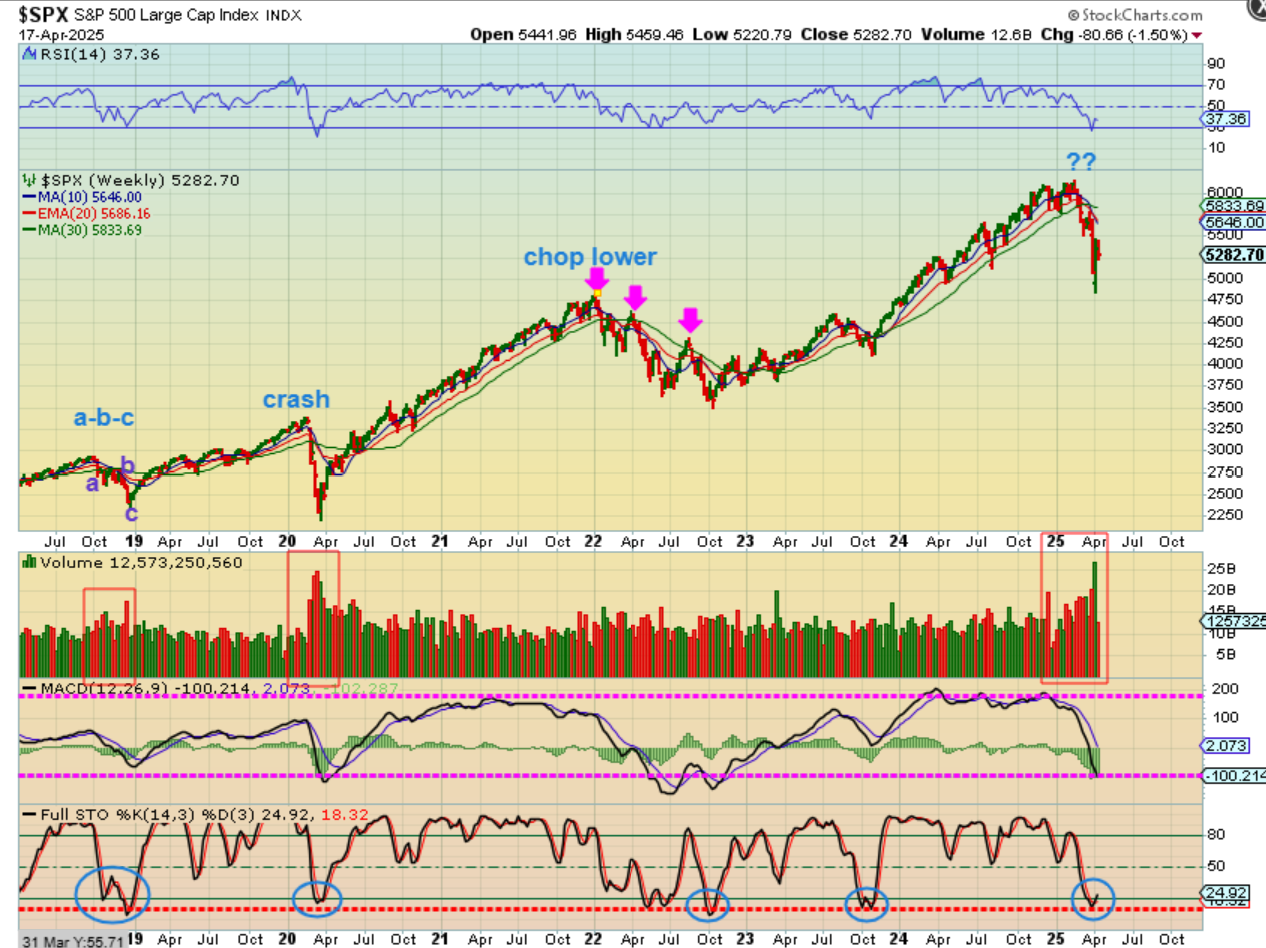
In 2018 we had
1. A sharp drop, then it chopped and then it had 1 more drop. That was the a-b-c ICL shown.
2. Then the Covid crash dropped straight down, flushed out, and put in a V-Bottom low.
3. The year 2022 was more of a bear market looking correction, where each bounce or ICL would rally for maybe 2 daily cycles. but then eventually roll over and break to new lows.
4. RIGHT NOW this resembles the Covid crash, but we could bounce and drop again like either of the other 2 corrections, so I just wanted you to see that. Much of that may depend on future economic reactions and realities yet unknown.
.
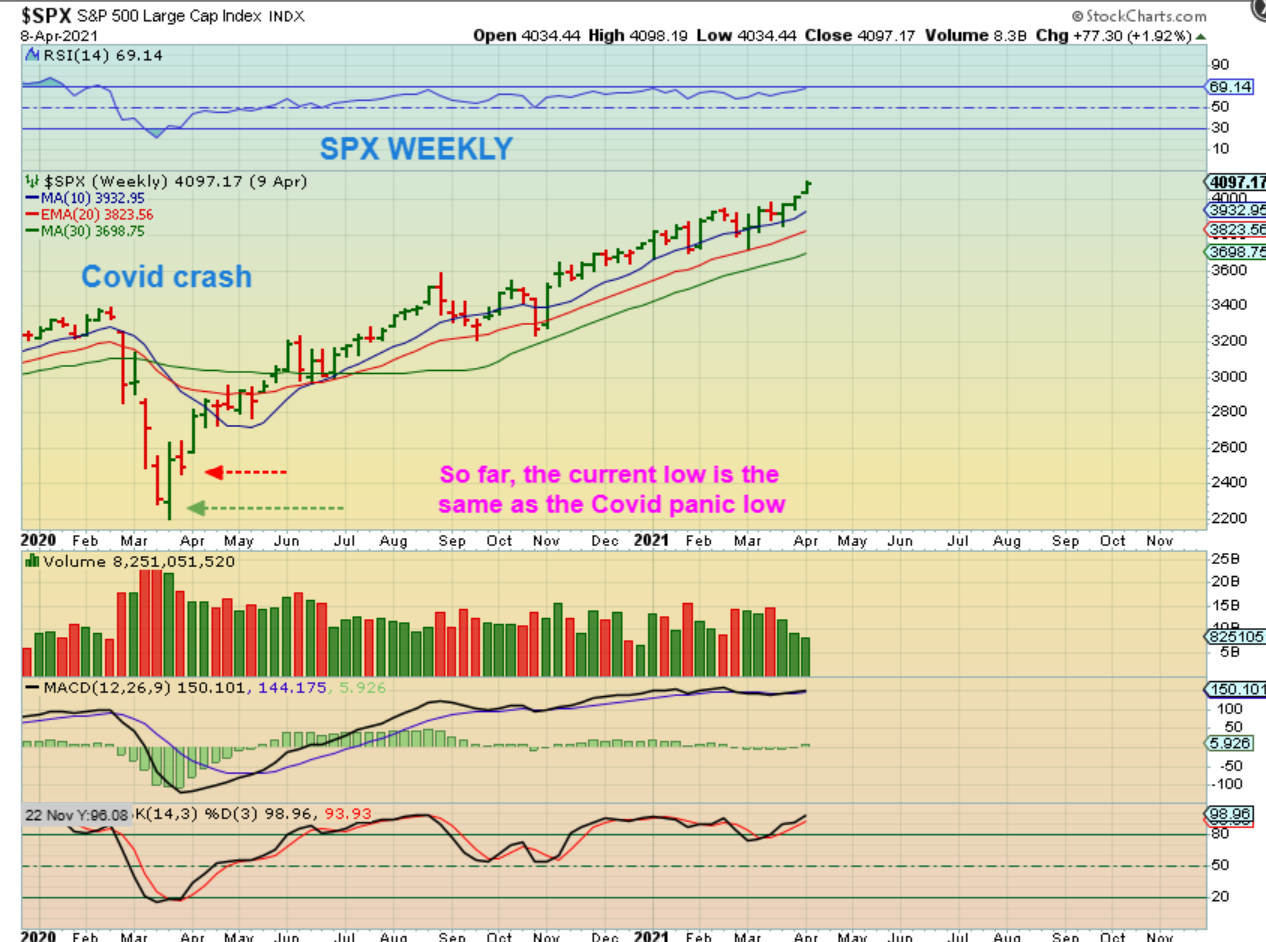
Zooming in on The SPX WEEKLY Chart during Covid I wanted to point out that the first 3 weeks out of that low were…
1. A strong reversal candle ICL and then
2. A small dip.
3. The next week was higher
.
Currently The SPX Weekly chart has the same thing as the above Covid chart:
1. The strong reversal candle and
2. The smaller dip lower
3. We’ll see what happens next week
.
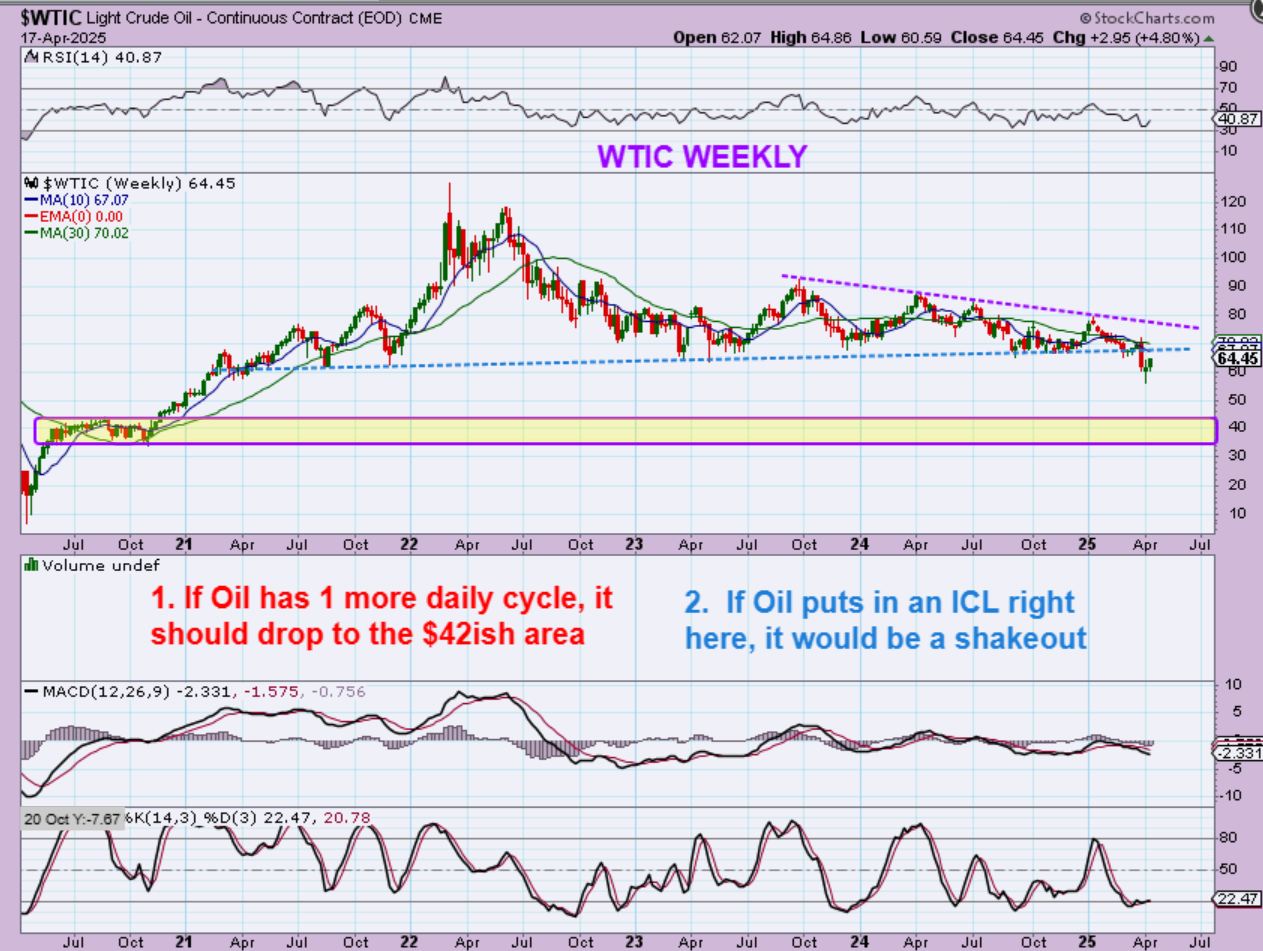
WTIC – For months I was saying that Oil was choppy with weak daily cycles, and it had enough time to break down. Oil broke down. I think that it still has time to put in 1 more daily cycle and that would just be a back test and a drop to support at the $42ish area. There is also a chance, however, that this is an ICL shakeout. .
.
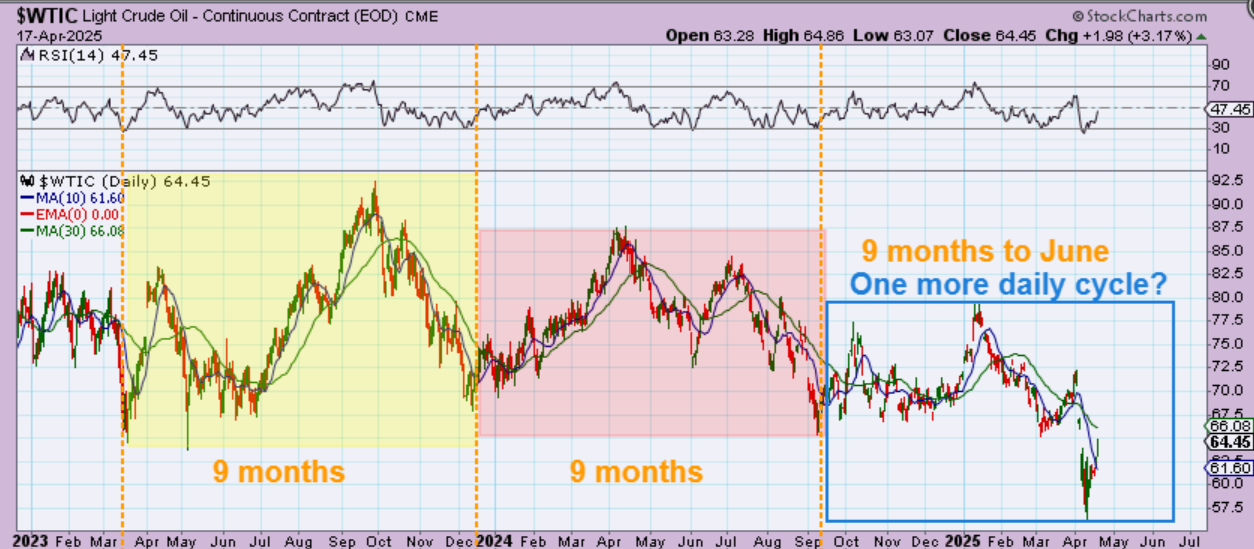
WTIC – Oils daily cycles can last 50 days, so the Intermediate Cycle are longer too, often around 9 months. You can see here that one more daily cycle would fit that 9 month pattern, so I think the higher likelihood is that we’ll see Oil bounce, weaken and get choppy, and then roll over again as a back-test.
.
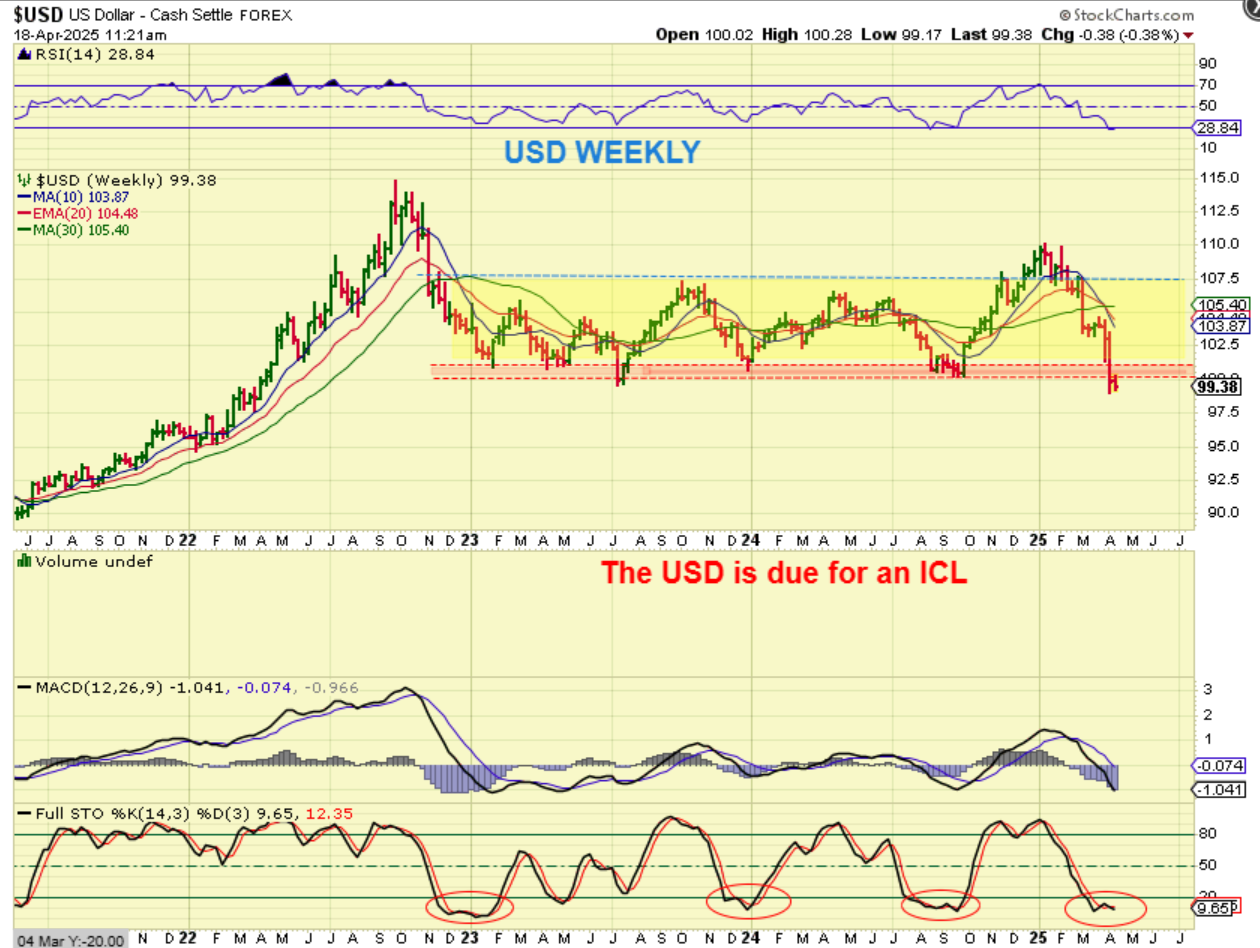
This is also what I had been calling for with The USD.
Since last year I actually thought that it would drop to the lows of this consolidation again, but when it broke out higher to $110, I was pretty surprised. It started to look like it would rally onward, but suddenly it weakened again and crashed lower in 2025. It is oversold and due for an ICL, but you can see 2 crashes in 2025, so it may struggle to get back above $104 for a while.
.
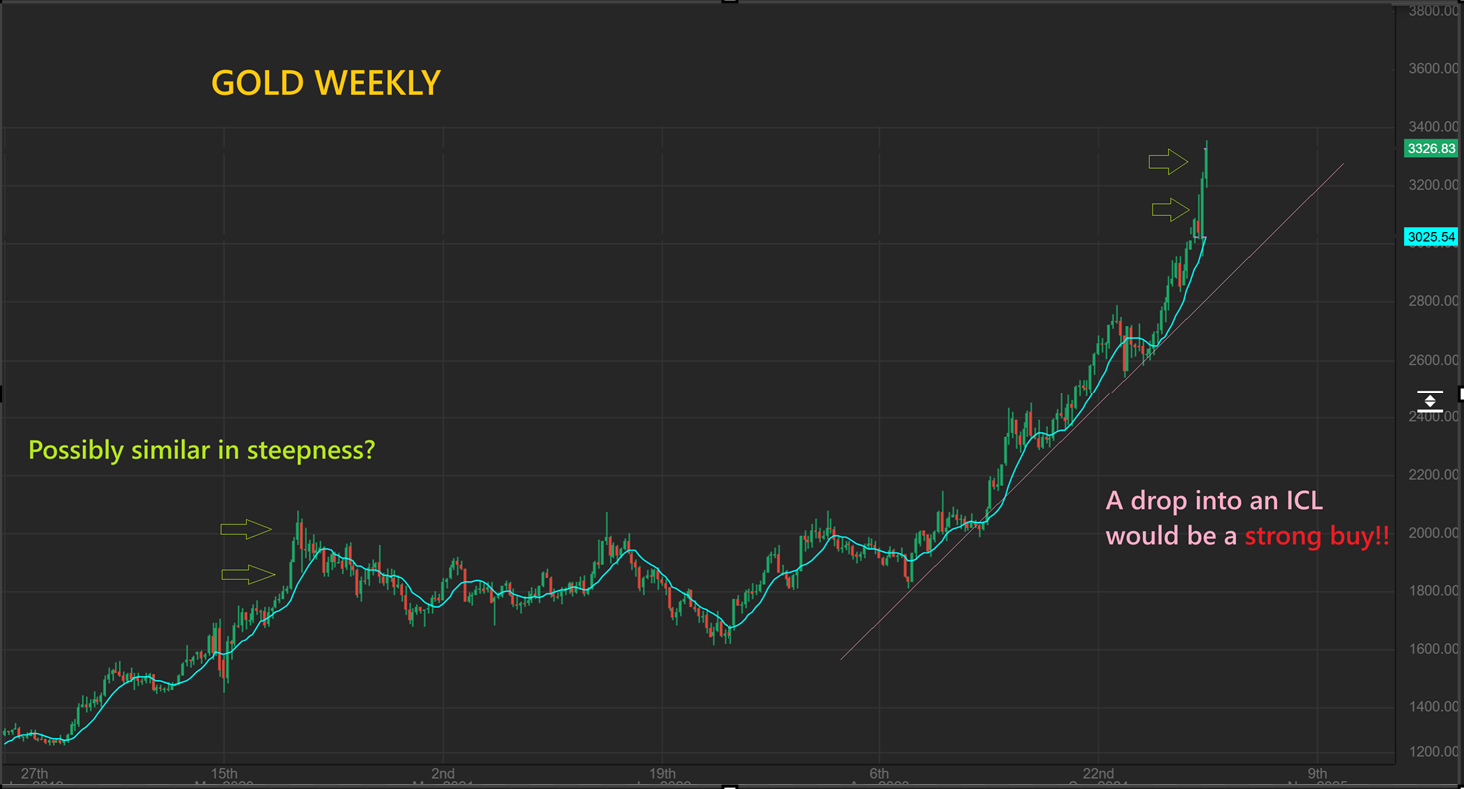
I have been discussing a possible ‘blow off top’ parabolic move in GOLD.
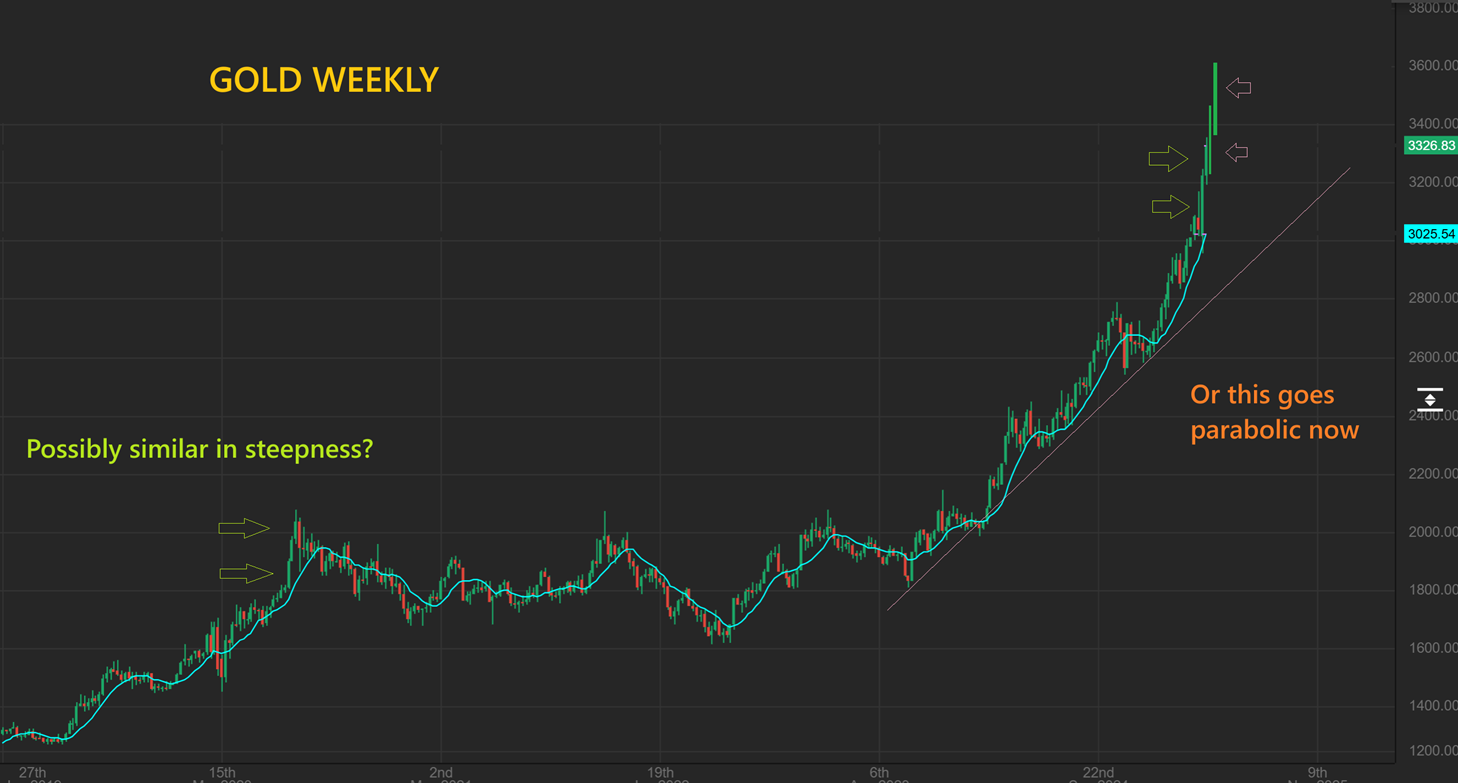
Last week I mentioned that I’d actually like to see Gold pull back now and into May, to give us a less parabolic move and an ICL dip to buy. Last week Gold continued higher and this is looking more and more like a parabolic run. 1 or 2 more weeks higher would be very steep, but right now it is possibly similar to a couple of these other steep rallies. I’ll discuss this further…
.
GOLD – This would be a parabolic move and likely the end of the run for now. I have drawn in 2 more weeks higher and this kind of a parabolic rally starts to become unsustainable. The sell off is often rather sharp too, as former buyers head to the exits in droves.
.
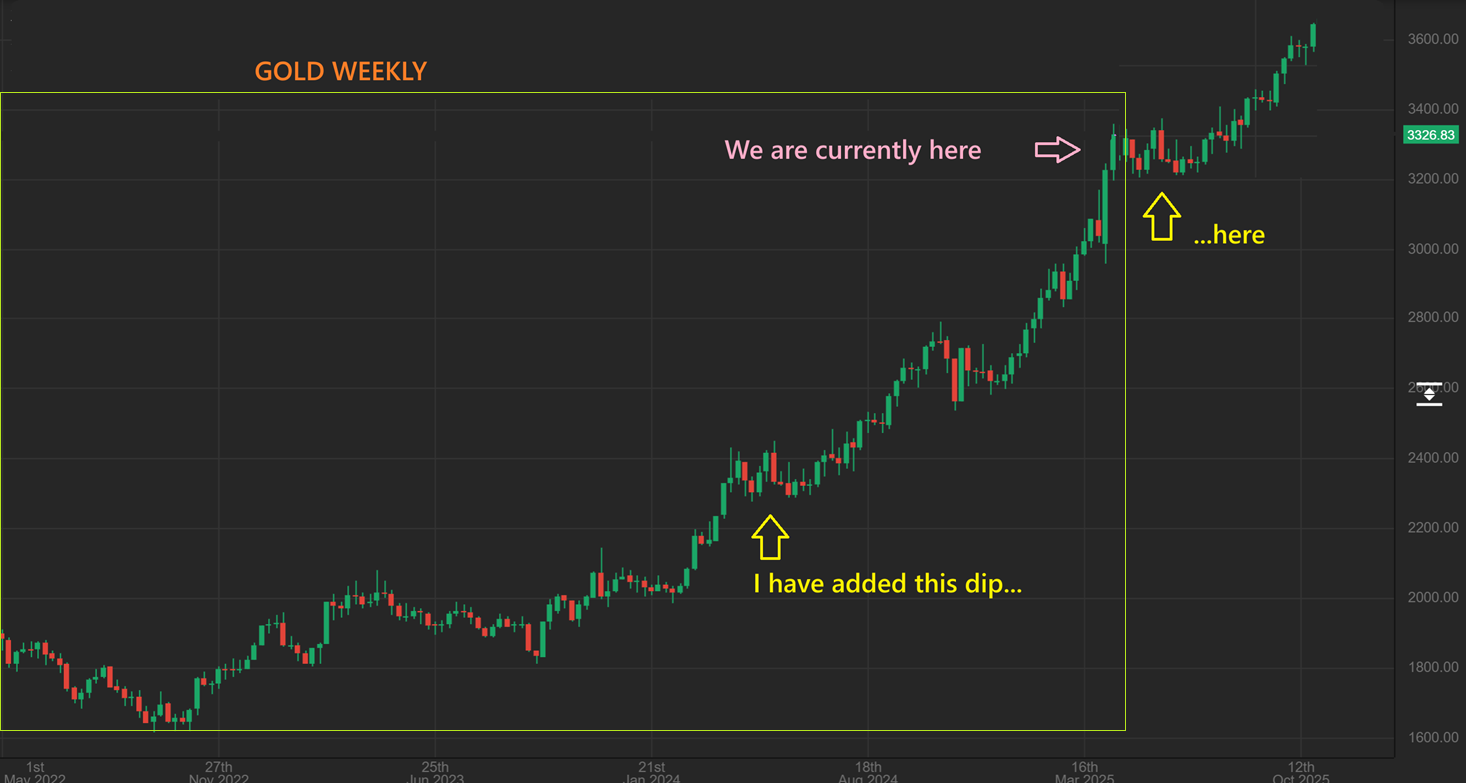
GOLD – What I did here is took a prior ‘pause’ and cop/pasted it on to where we are now. The difference would be that after that dip, we would probably see Gold go straight up again. We’ll see what next week does for Gold, but the longer it travels in this steep run higher, the more likely a prolonged correction could follow.
.
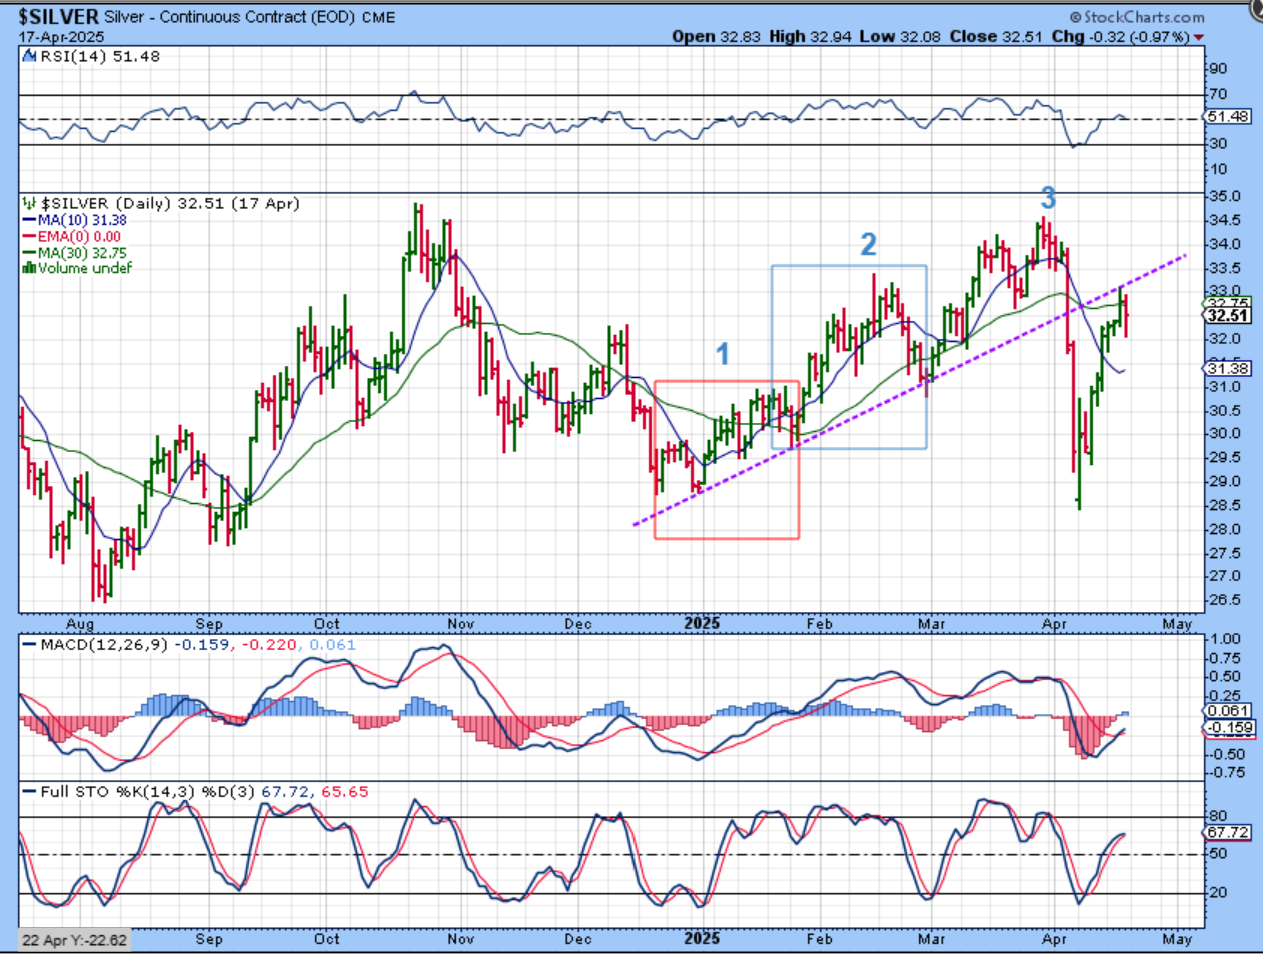
SILVER DAILY: This is tough, because in technical analysis, this crash & reversal would have been a buy, and it resembles an exhaustion sell off/ ICL. Now it is also resembling a V-Bottom low. In cycles, however, that would be a 3rd daily cycle that was right Translated, so we would expect a 4th daily cycle that is L.T. Price easily got back above the 10sma, which is starting to curl up, so buyers can raise stops to the 10sma. (Silver stocks have been quite choppy).
.
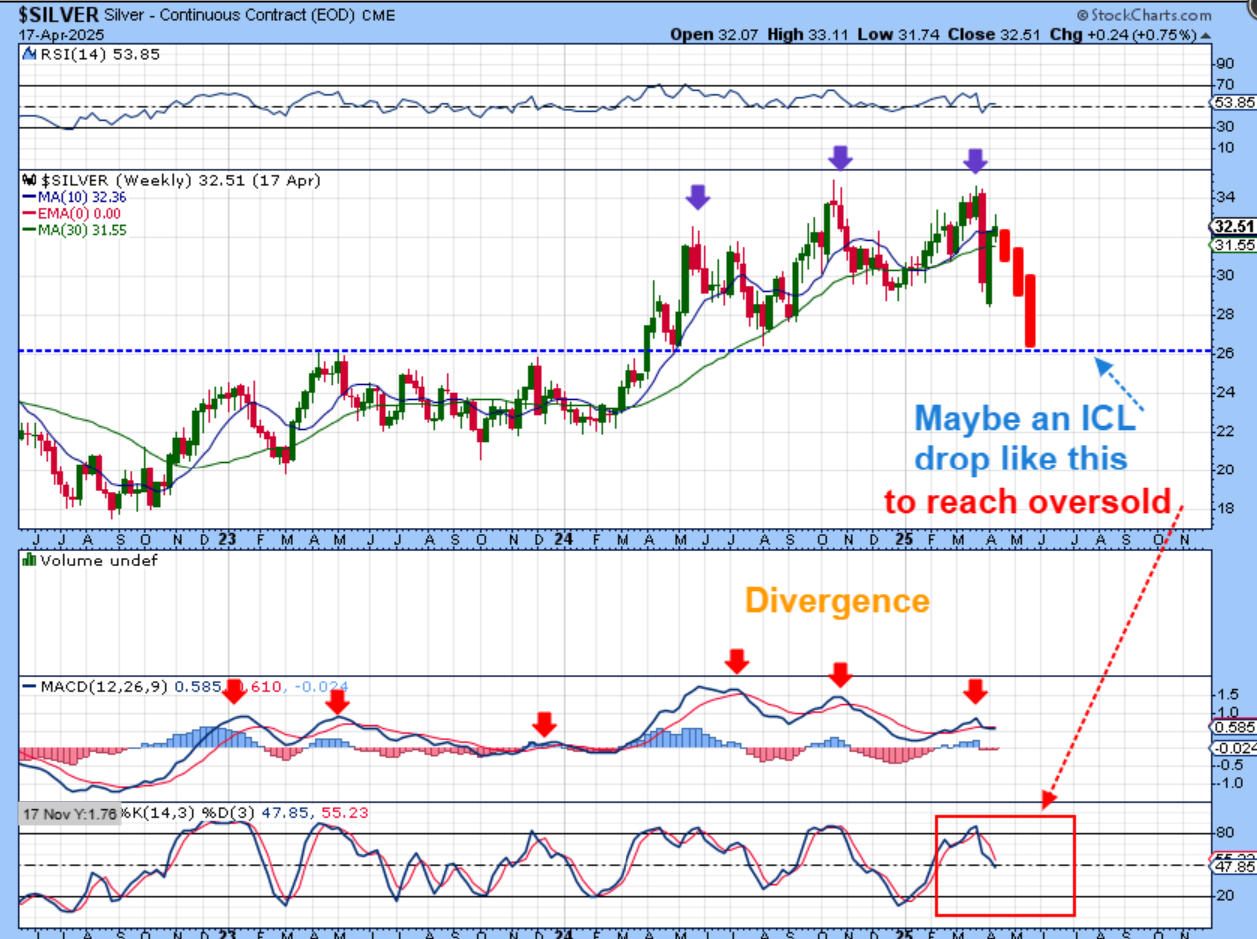
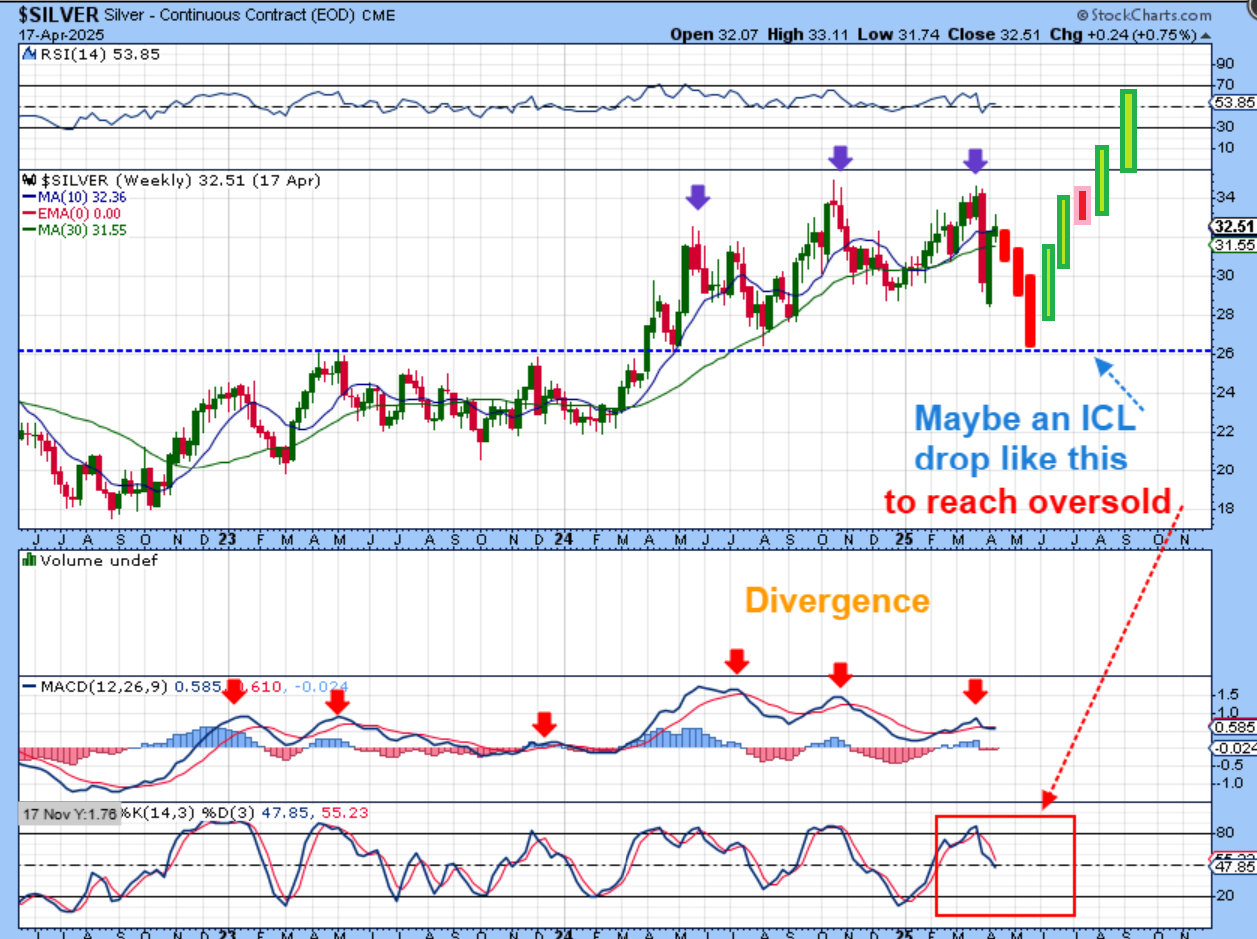
With the Bigger Picture, SILVER did NOT do as I expected. There are a few reasons why I expected Silver to rally with Gold by this spring, but instead it has been extremely choppy & even crashed. If Gold does pull back into May, I would have to expect that Silver will rally strongly from there, but so far? Silver has been disappointing. I have drawn a sharp ICL drop, because we saw a sharp drop in March.
.
SILVER:
I hate to use the word ‘Hope’ in trading, so let me just say that this is what I am ‘realistically hoping for’. 🙂 When Silver takes off, it can really fly, so I’d like to see Silver play catch up to Gold.
.
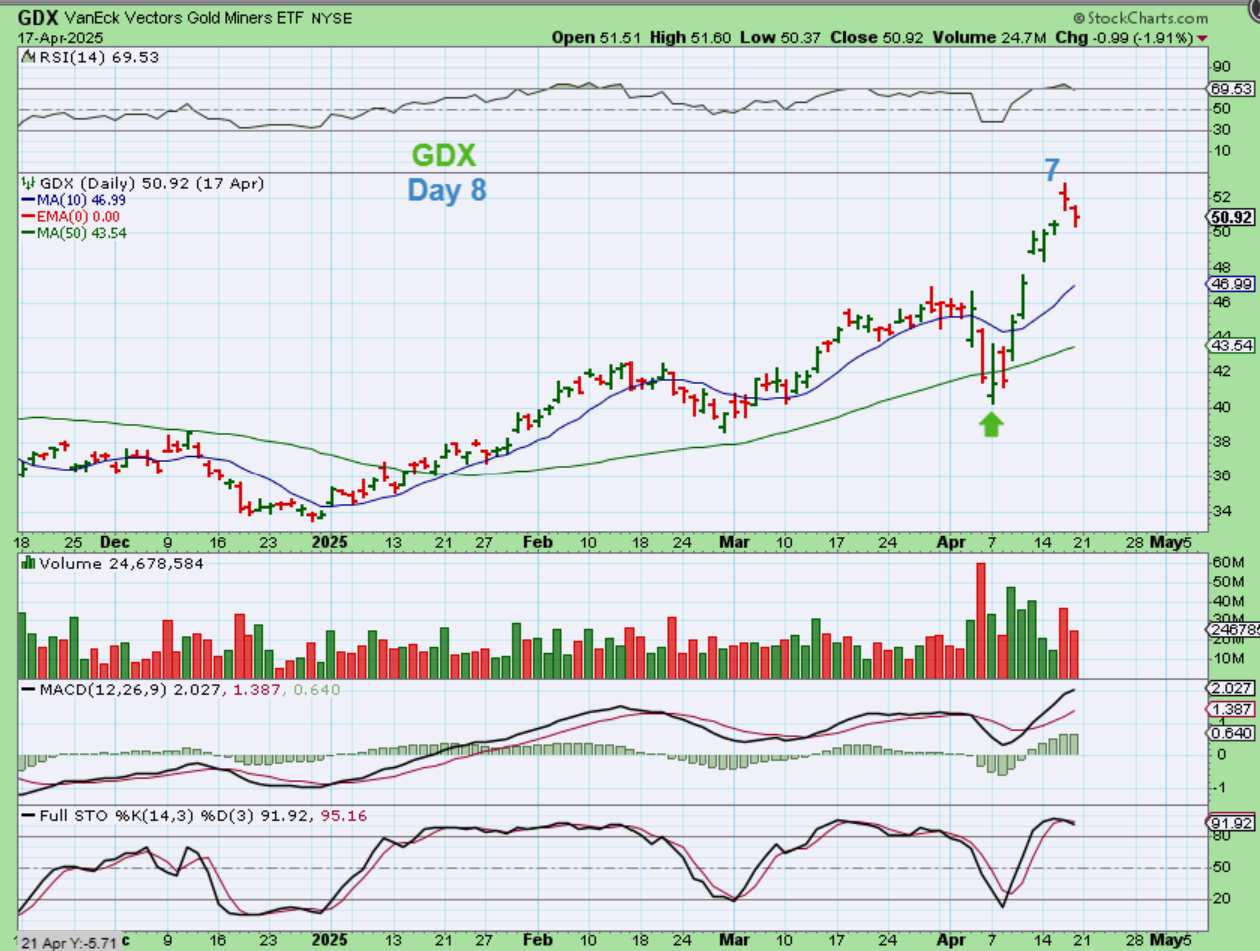
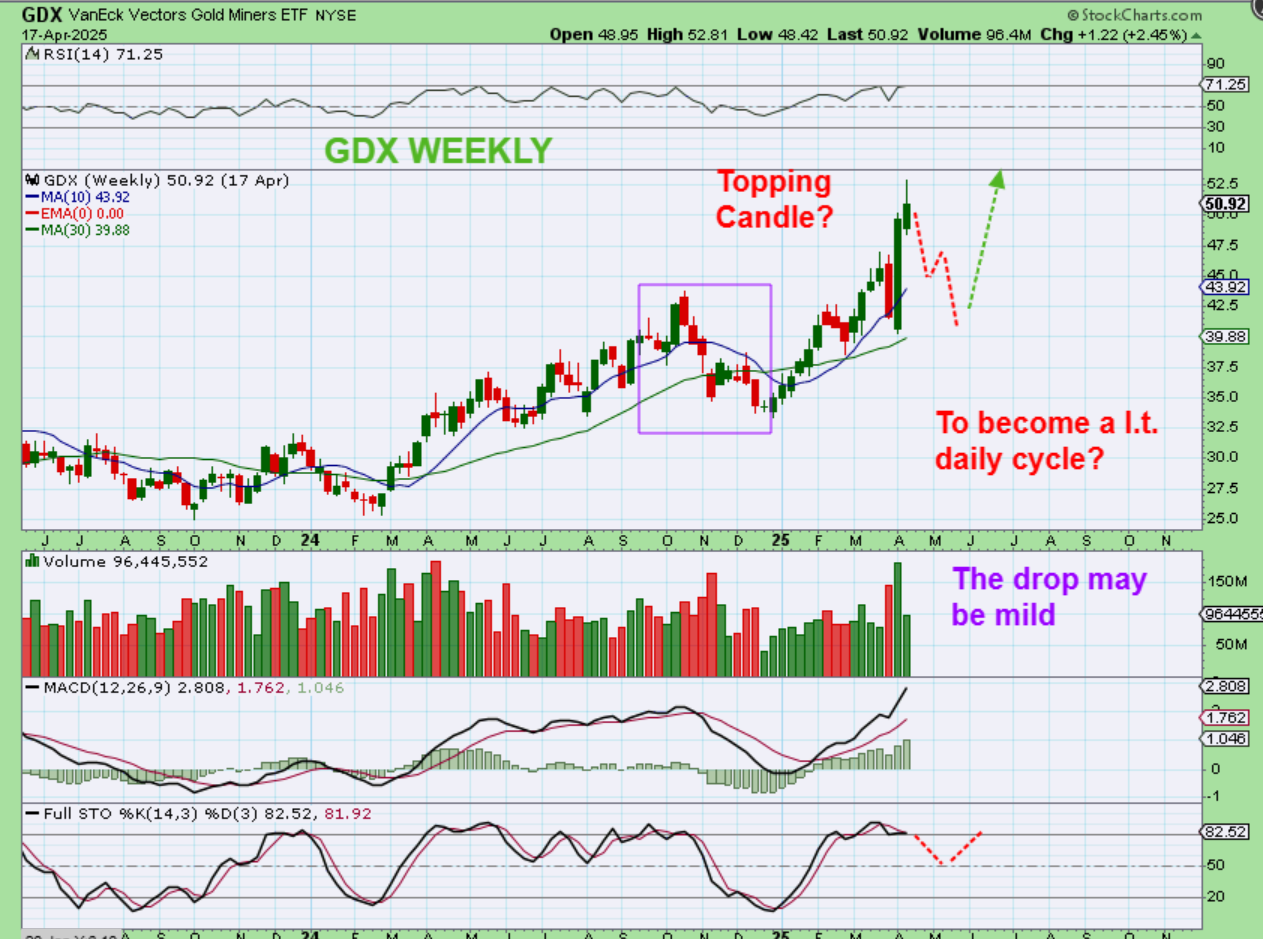
GDX shot straight up out of the lows as Gold looked to be going parabolic. This CAN continue higher, but since it started to pull back, lets draw this out as a possible L.T. Daily cycle…
.
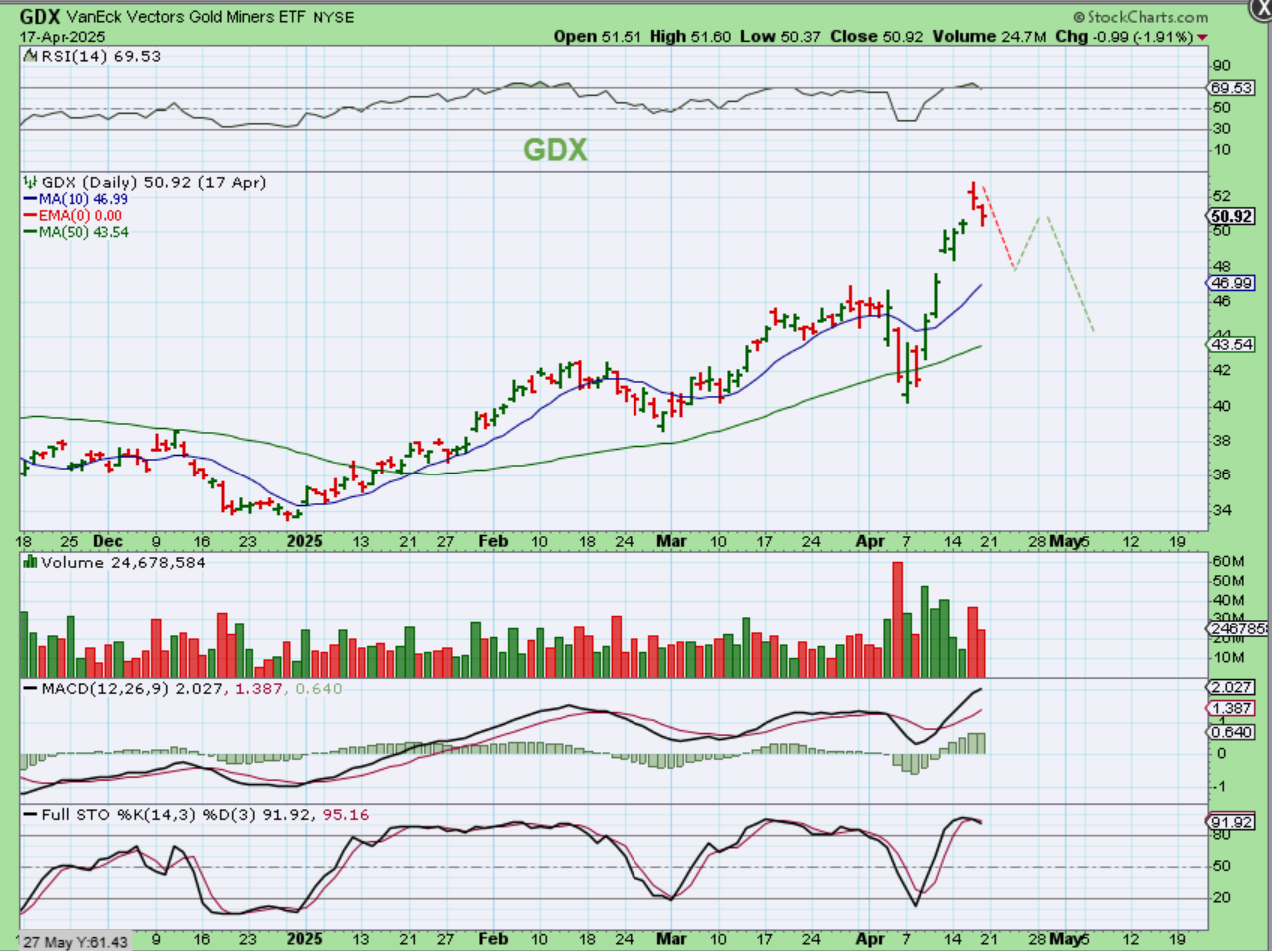
GDX could stay left translated and dip to the 10sma, filling that gap. Then it could bounce higher, and then drop into a low in May if that is what Gold does. What if Gold continues to rocket higher? Then the Miners can follow Gold higher. What about the weekly chart?
.
GDX was a bit choppy too, but it finally decided to follow Gold and blast off higher. Now we see a possible weekly topping candle. Again, if we get a dip into May, that would be a strong buy, with Gold and maybe now the Miners possibly ready to go parabolic. If Gold just keeps flying higher next week, Miners would likely follow.
.
As you can see, next week could tell us a lot. With the General Markets, we could see if they are starting to drop again after a brief bounce, or is it more like that Covid crash, where the drop exhausted the selling and the markets began to climb a wall of worry?
And what about Gold, Silver, and the Miners? Will they continue higher and thus continue to look to be going parabolic? Or will we get a L.T. Daily cycle despite recent strength, and then roll over and pull back into May to give us a nice buy point? Next week could help us to answer these questions. Enjoy your weekend, we’ll see you on Monday!
.
~ALEX
.
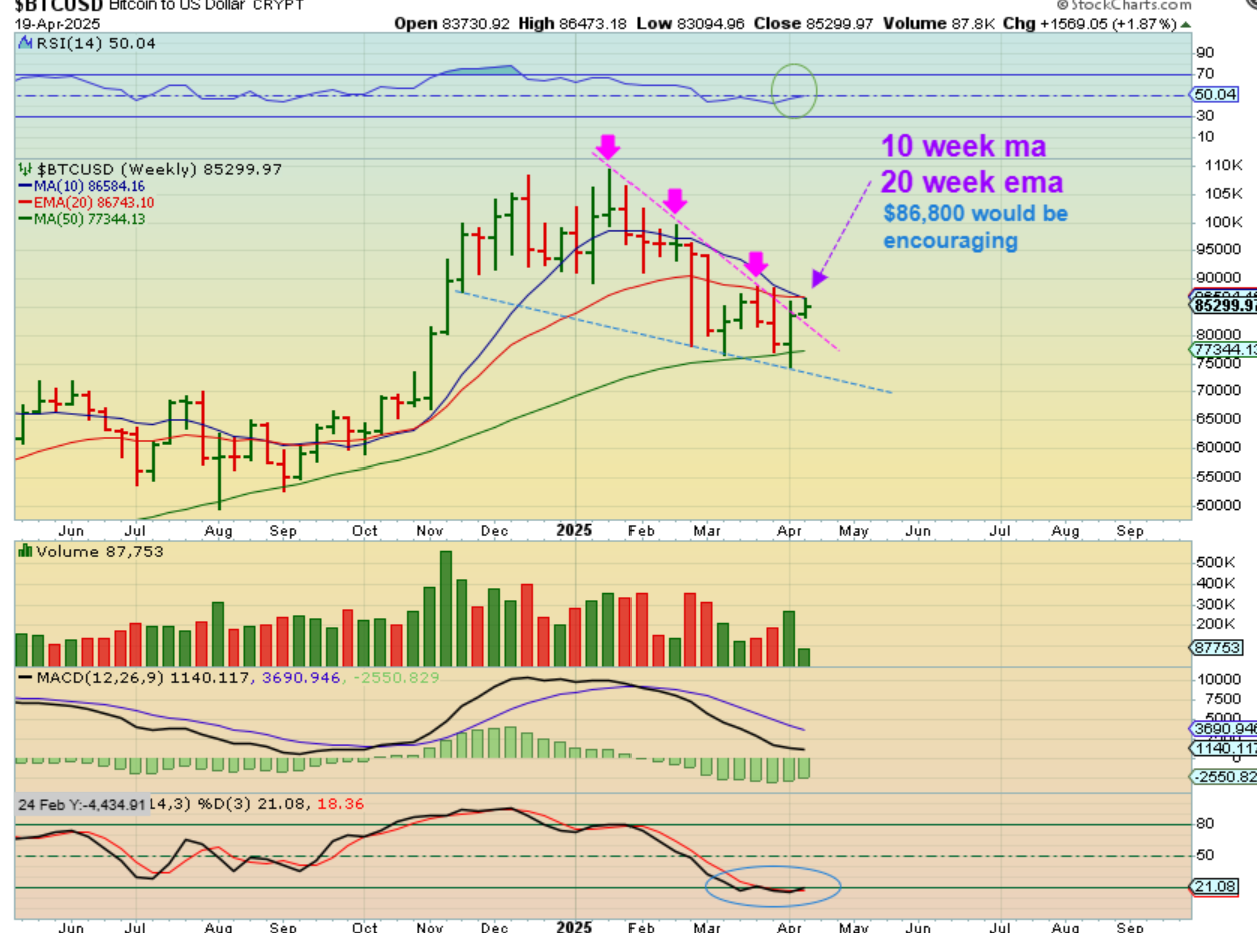
Bitcoin is both Bullish and Bearish looking, so let’s discuss that with 2 charts.
.
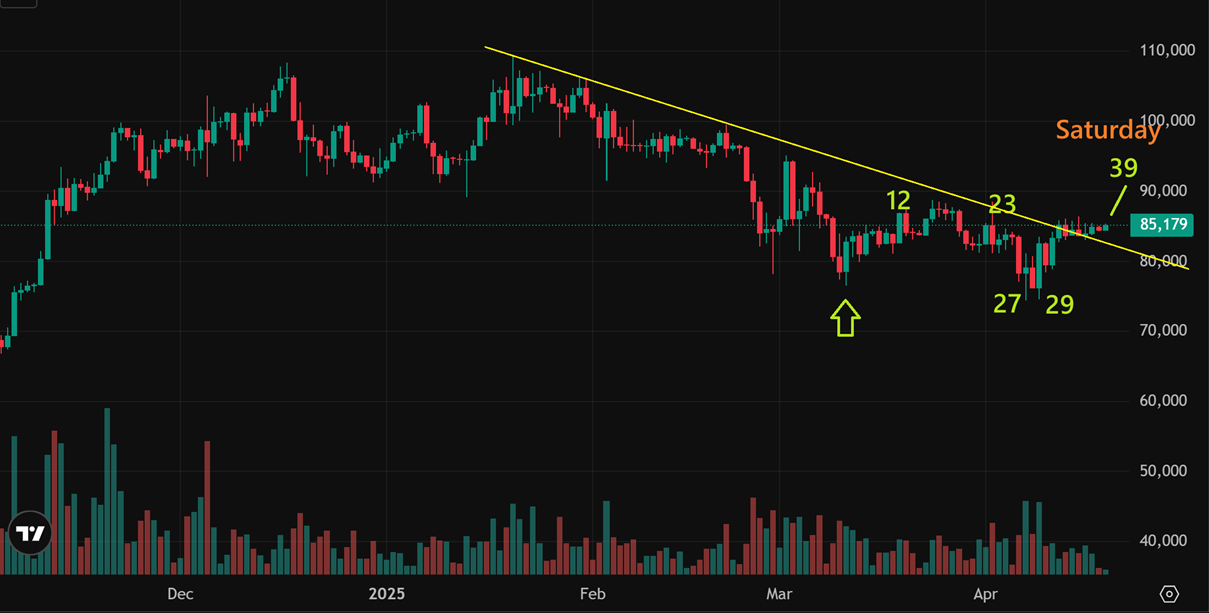
Bitcoin trades 24/7, so as of Saturday morning we see that we are on day 39 and not much progress has been made. The bearish part here is that
1. On day 27 price broke below the prior low, so this should be a failed daily cycle.
2. Also Bitcoin has been trending lower with lower lows and lower highs.
3. That said, I do find the weekly chart quite bullish looking, so let’s take a look…
.
BITCOIN WEEKLY: I want to say that this chart of Bitcoin really does look bullish to me.
1. It has formed a bull wedge.
2. It is very oversold, and it reversed bullishly at the 50 week ma, like it did in 2024.
3. If price can regain the $86,800 area, it would be above strong resistance and that could encourage buying. So far, the crypto Miners are still near the lows, but I am still watching this sector for signs of life.