Tuesday April 15th
.
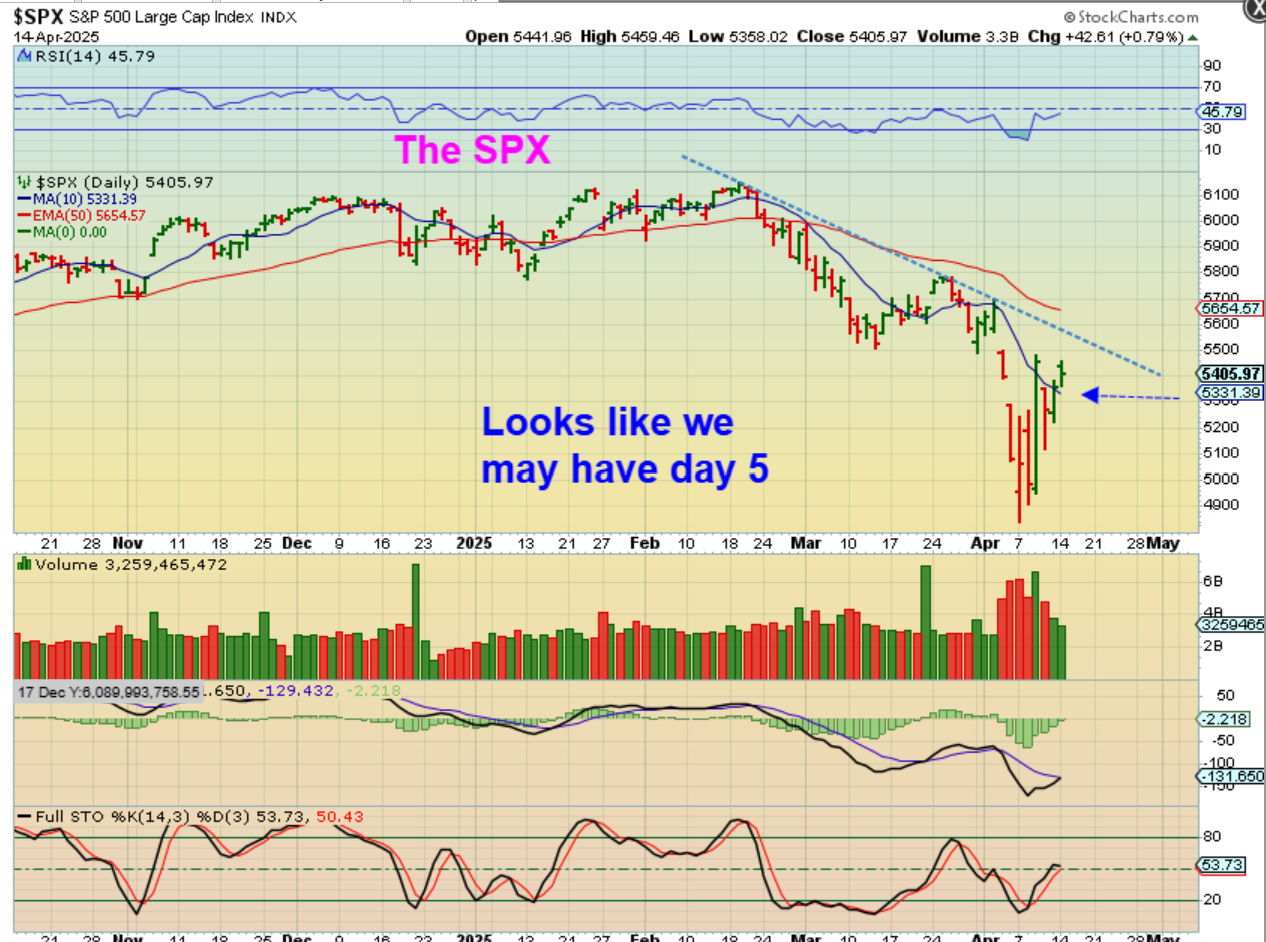
SPX – Price has moved above and closed above the 10 sma. We usually use that to gauge the strength of a bounce off of the lows and we also use it to view the bounce as a dcl or not. Well, in this case, I’ll just say ‘ so far so good’, but I’d really like to see a move above the 20 ema, because we aren’t really within the ‘timing’ for a dcl. We do have extreme conditions that may indicate exhaustion of the selling, so…
.
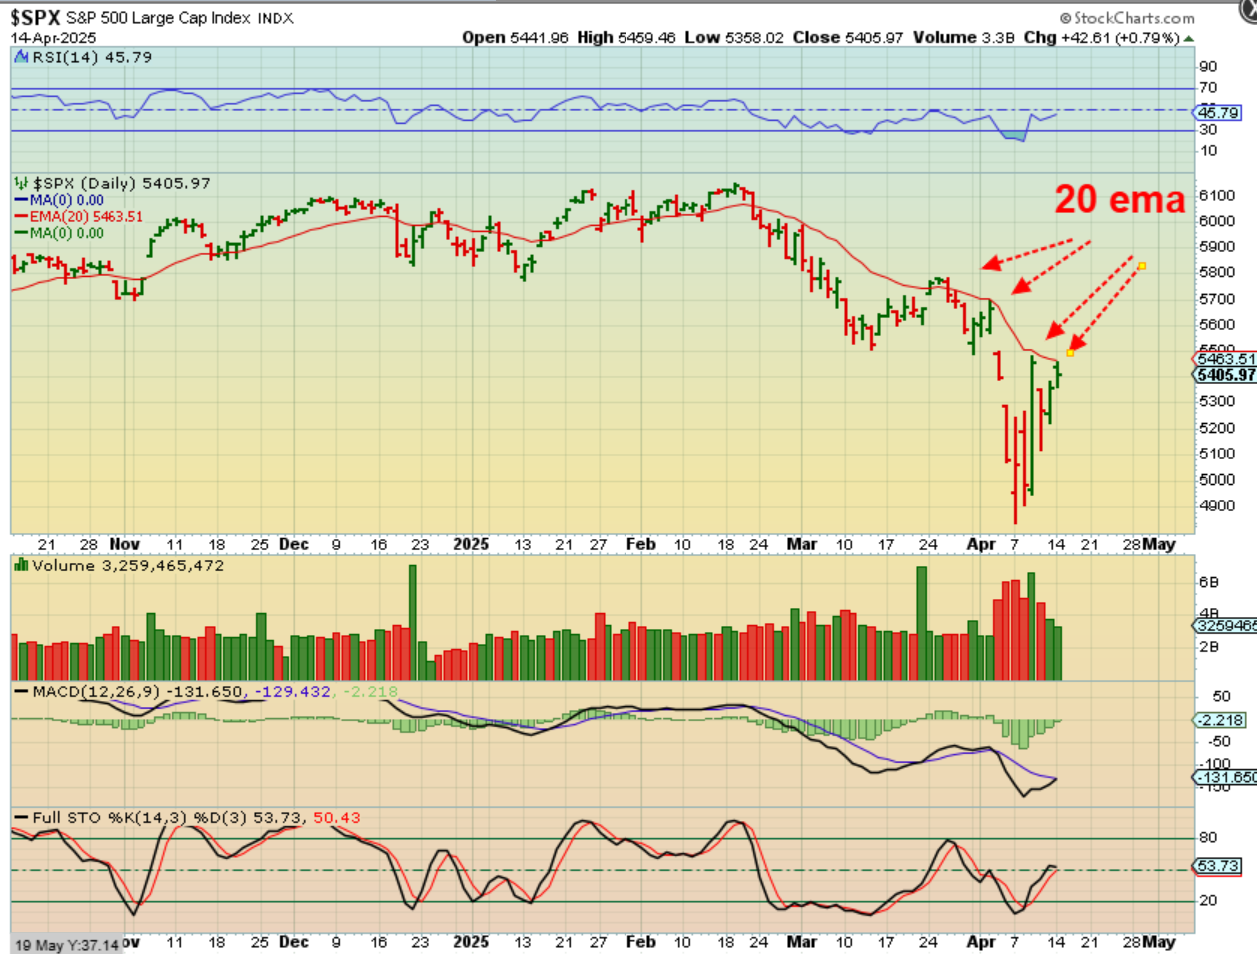
SPX – Take a look at the 20 ema. It did close above it and then roll over in March, but that was a lot of Trump tariff chatter that crashed the markets. A push above Mondays highs would be the next move above the 20 ema.
.
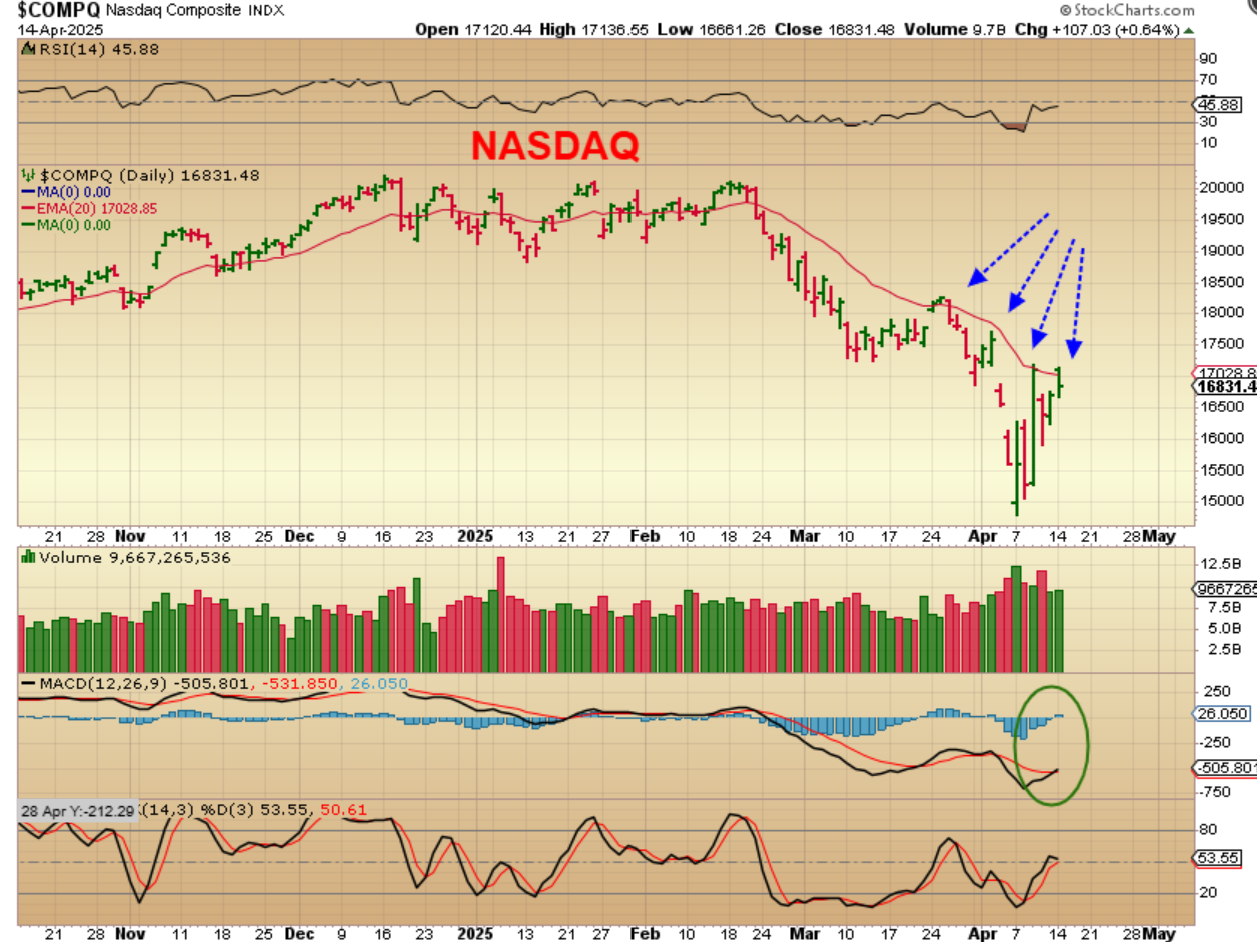
THE NASDAQ opened above it yesterday, but it then sold off to close the gap.
.
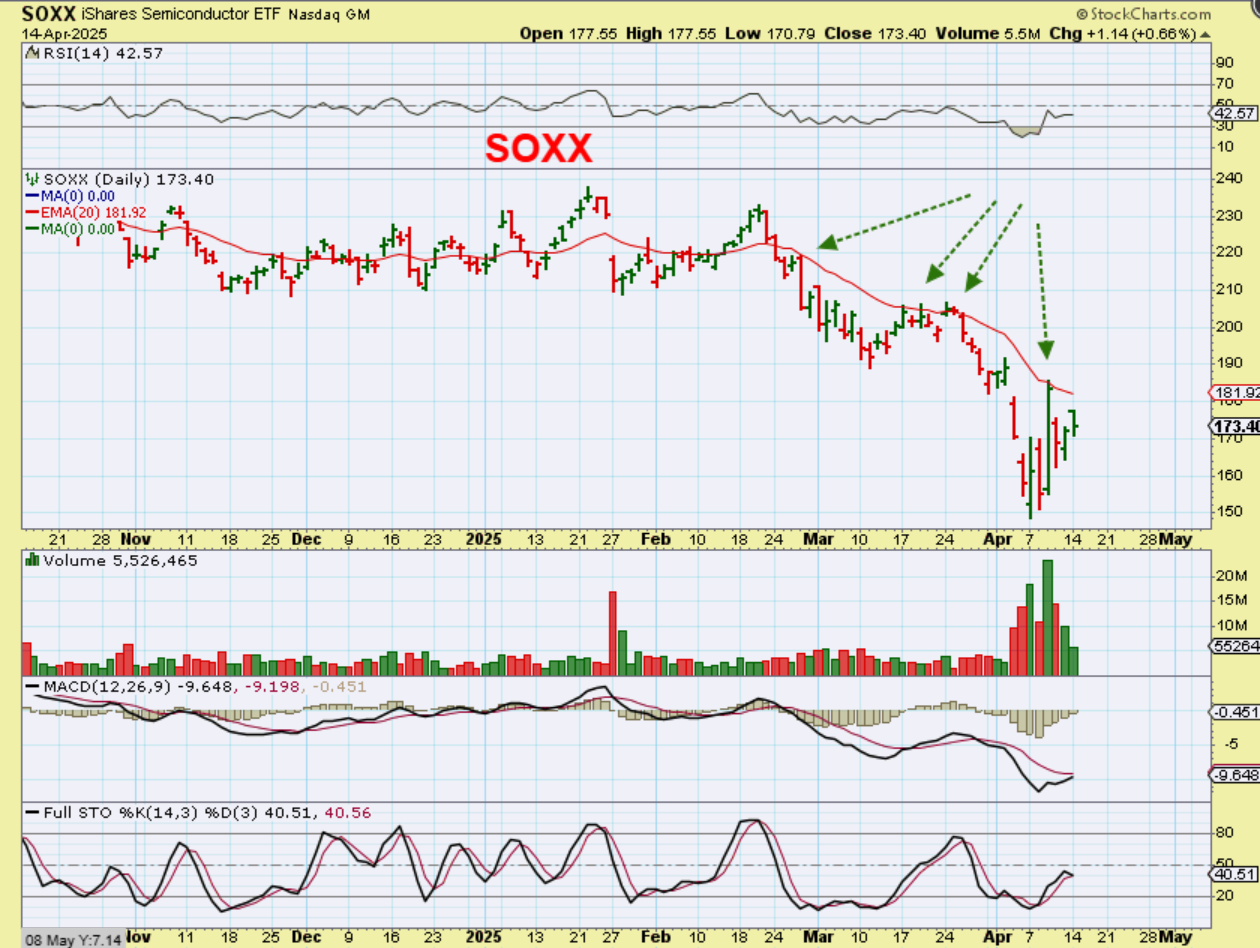
I decided to check the 20 ema on The SOXX and I do see the same resistance area here. The SOXX would need a move above the 182 area to overtake the 20 ema.
.
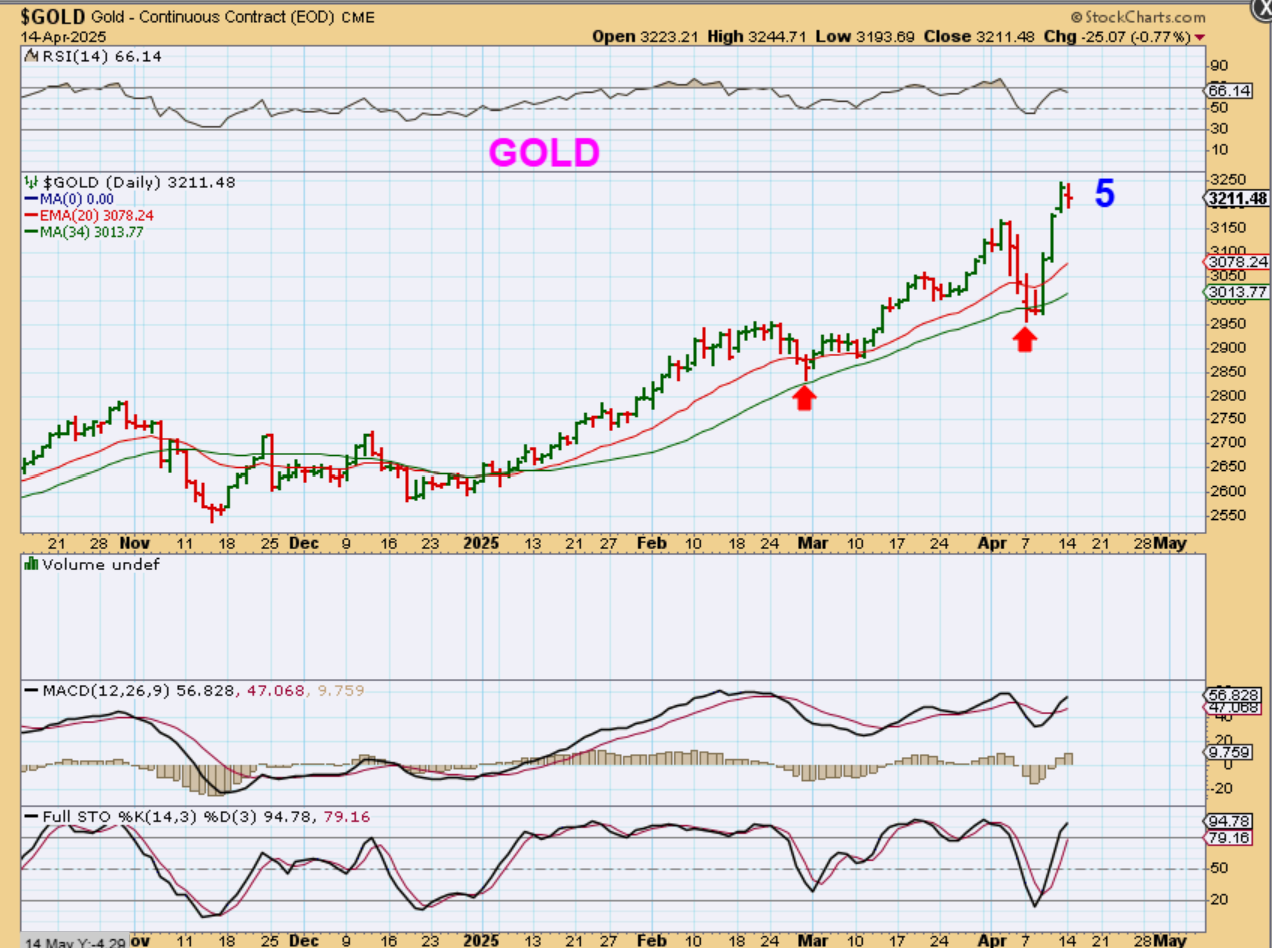
GOLD stalled on day 5, but even a L.T. Daily Cycle can peak on day 7-11, so we could see more upside on Gold. Gold was slightly down Monday, but some Gold Miners were higher.
.
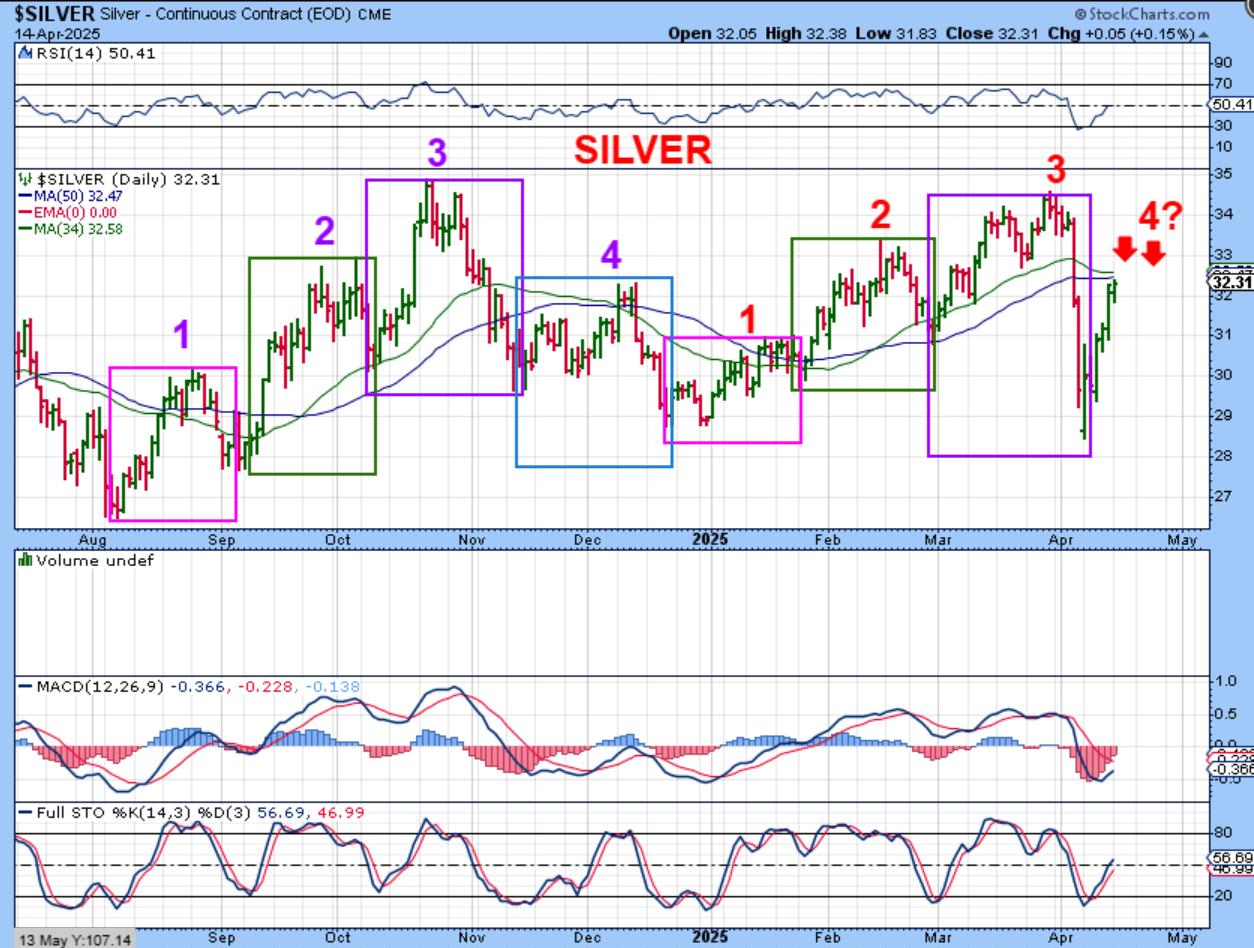
SILVER is pushing into a resistance area, but it may break above it because it is only day 4, it remains slightly oversold, and a slam down like we saw in Silver can recover sharply too (V-bottom).
.
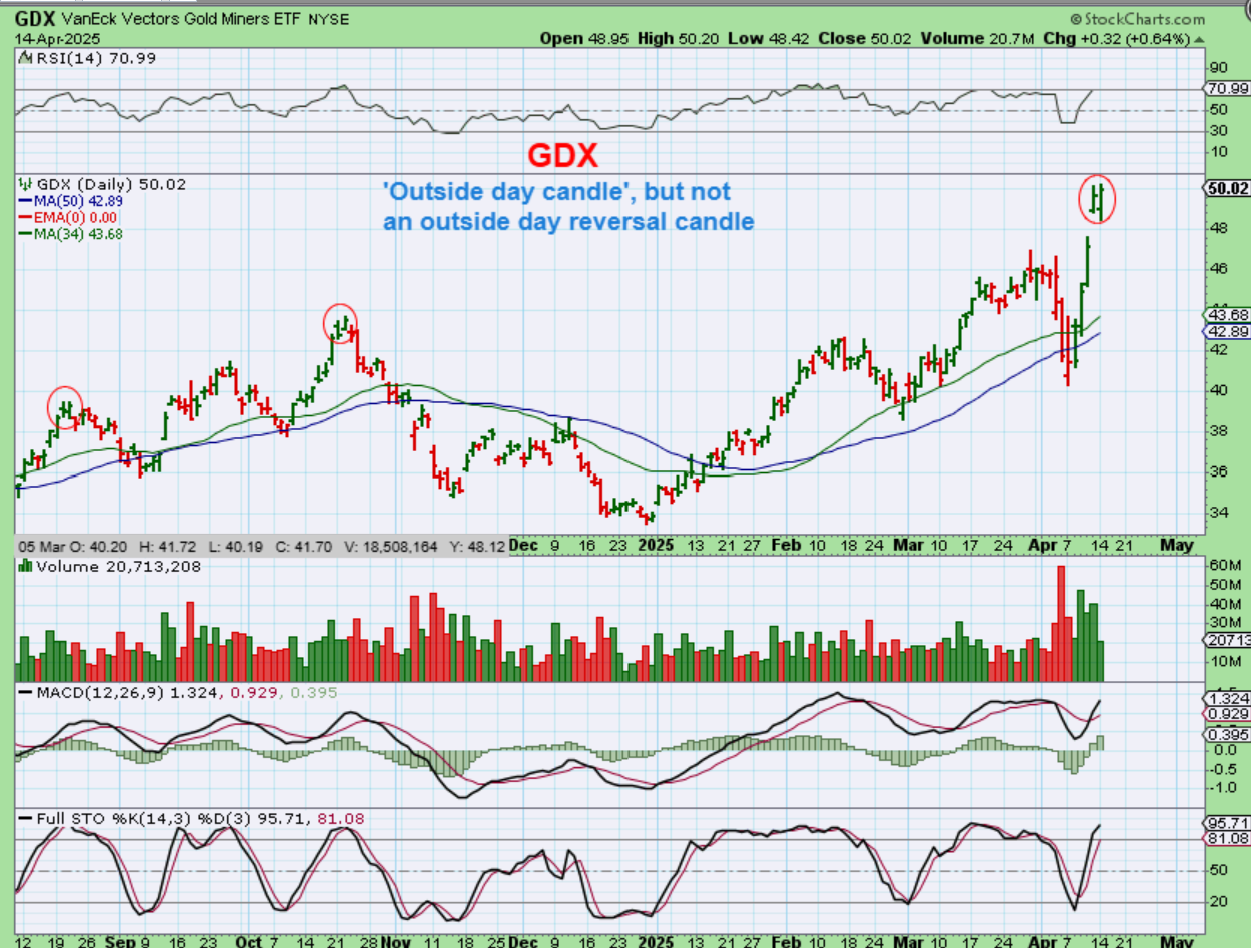
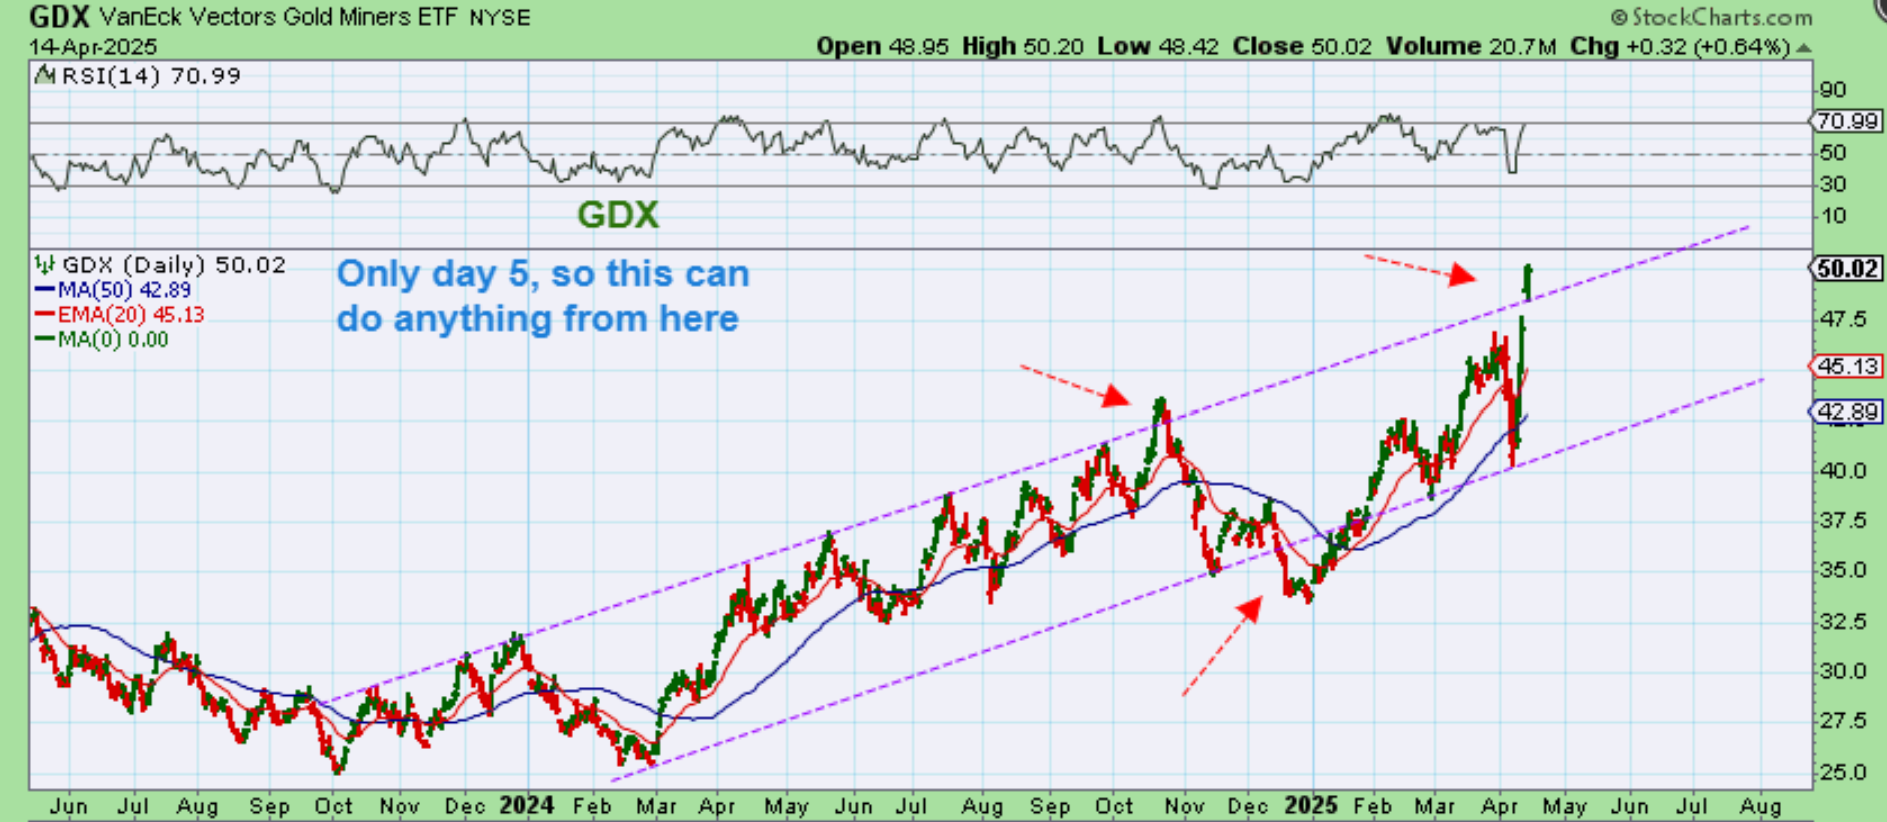
GDX used to look a bit like Silver, but now it looks more like Gold. This is day 5 and the Miners really started to look strong last week after a quick dip below the 50sma and recovery formed a dcl. This was day 5 of a 3rd daily cycle, and…
.
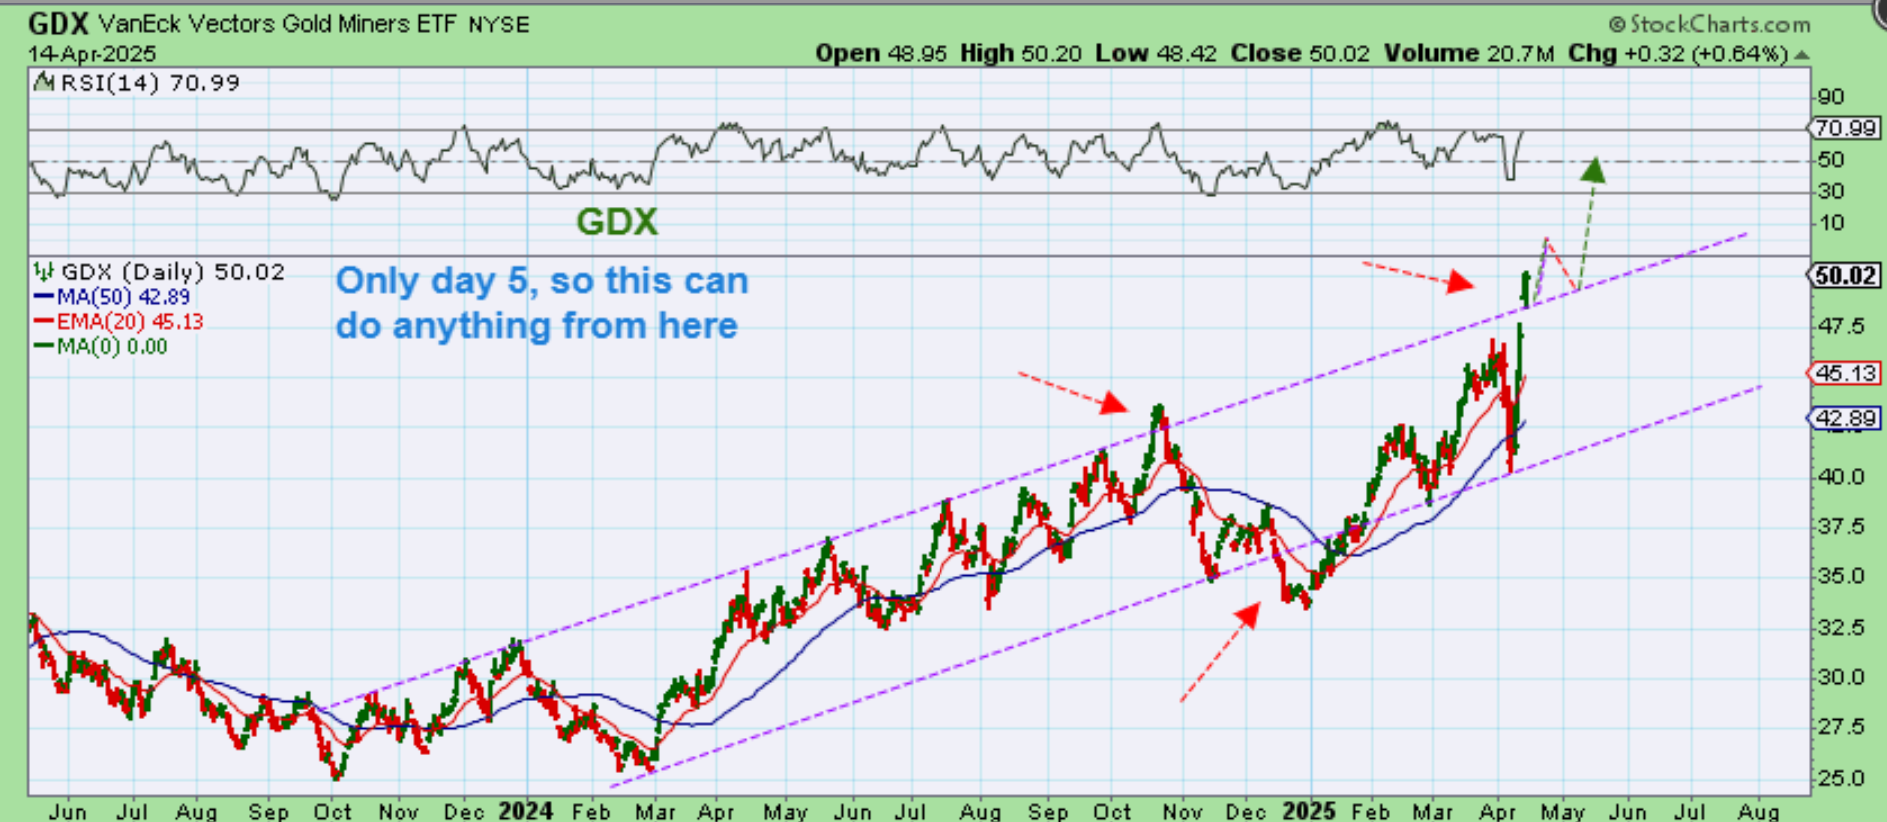
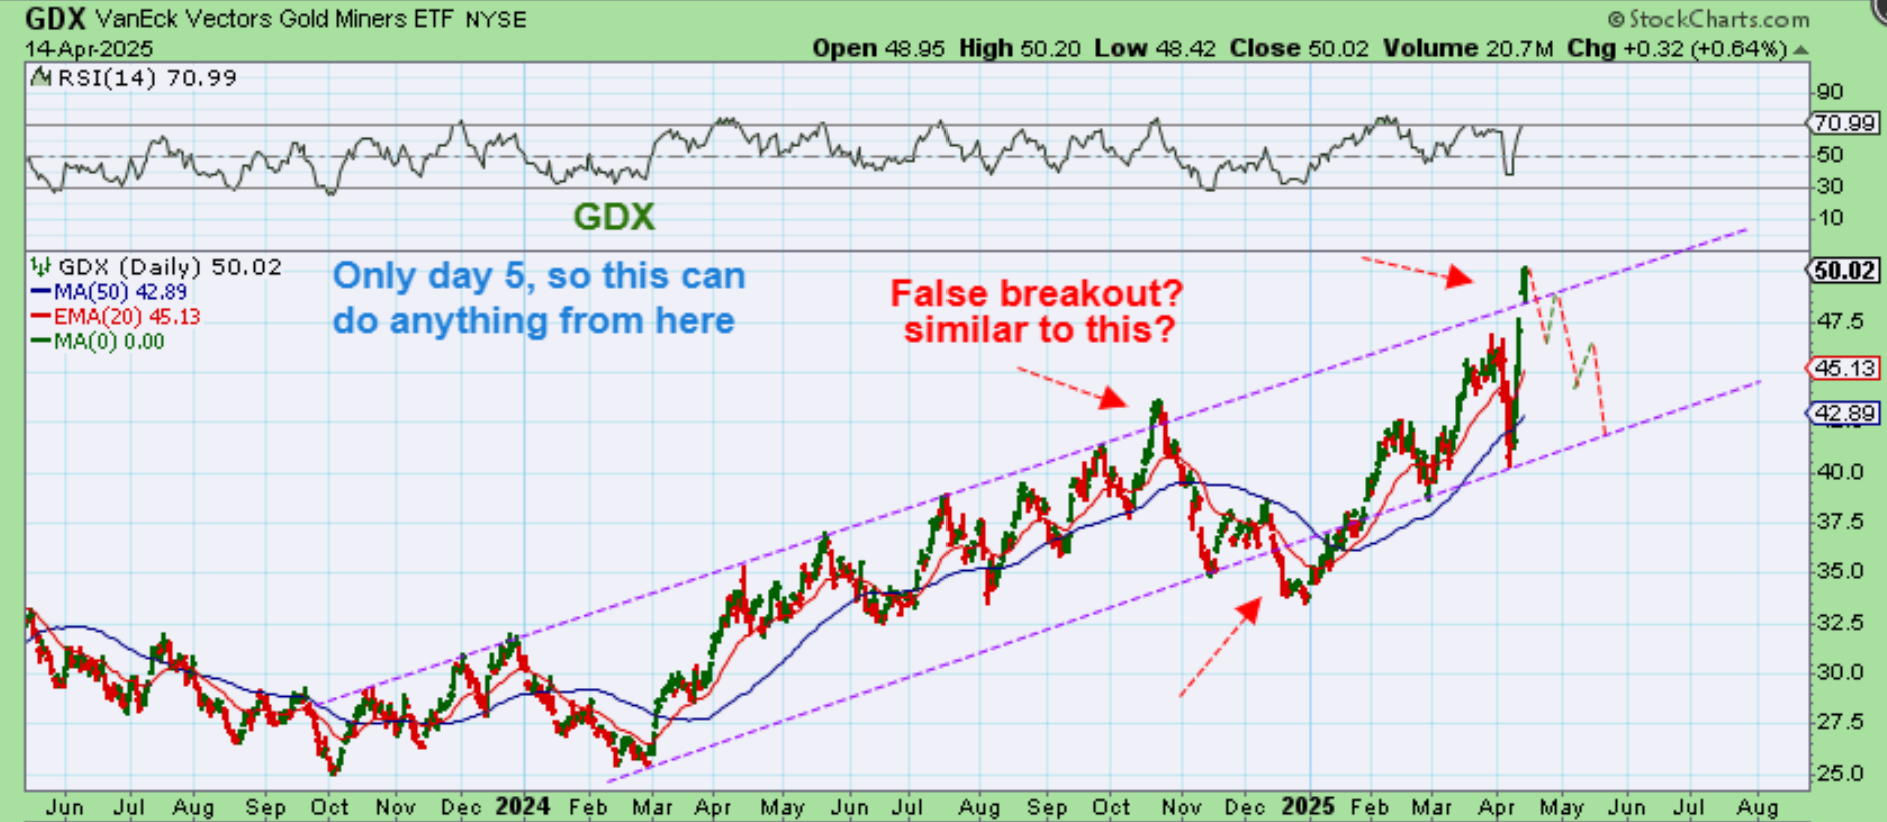
GDX actually broke out above that upper channel line. Often, we get a false break out from a channel and price dips back inside of it, but since it is only day 5, we could see more upside before this turns lower and re-enters the channel.
.
Scenario #1 would be if we see Gold going parabolic over the next week or 2, The GDX rally is already straight up and it could continue higher too. I prefer scenario #2…
.
Scenario #2 would give us a return into the channel sooner than later, and a drop similar to the drop we saw after the last false breakout.
.
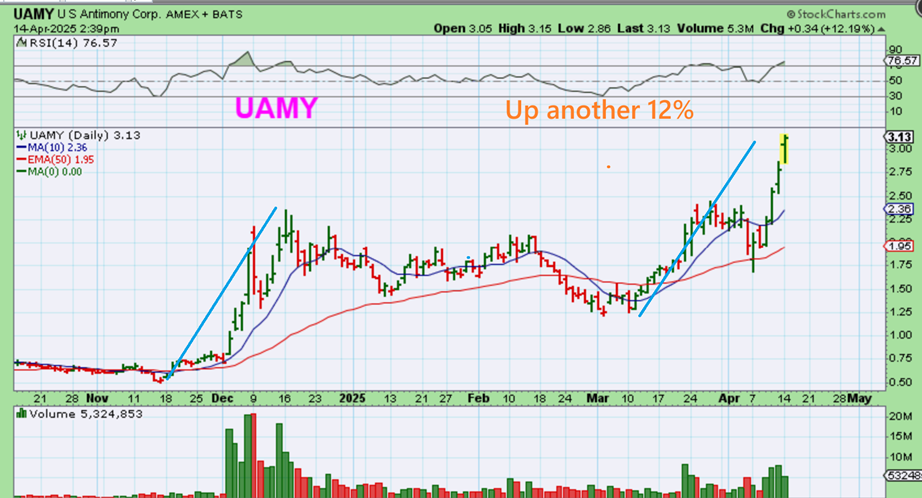
UAMY & REEMF: I had pointed these 2 rare earth mineral stocks out as bullish set ups despite the market crashing. I mentioned them as a buy & hold. UAMY was in the reports a few times. After reversing at the 50sma, UAMY gained over 80% from the $1.75 area. 50% above the $2 area.
.
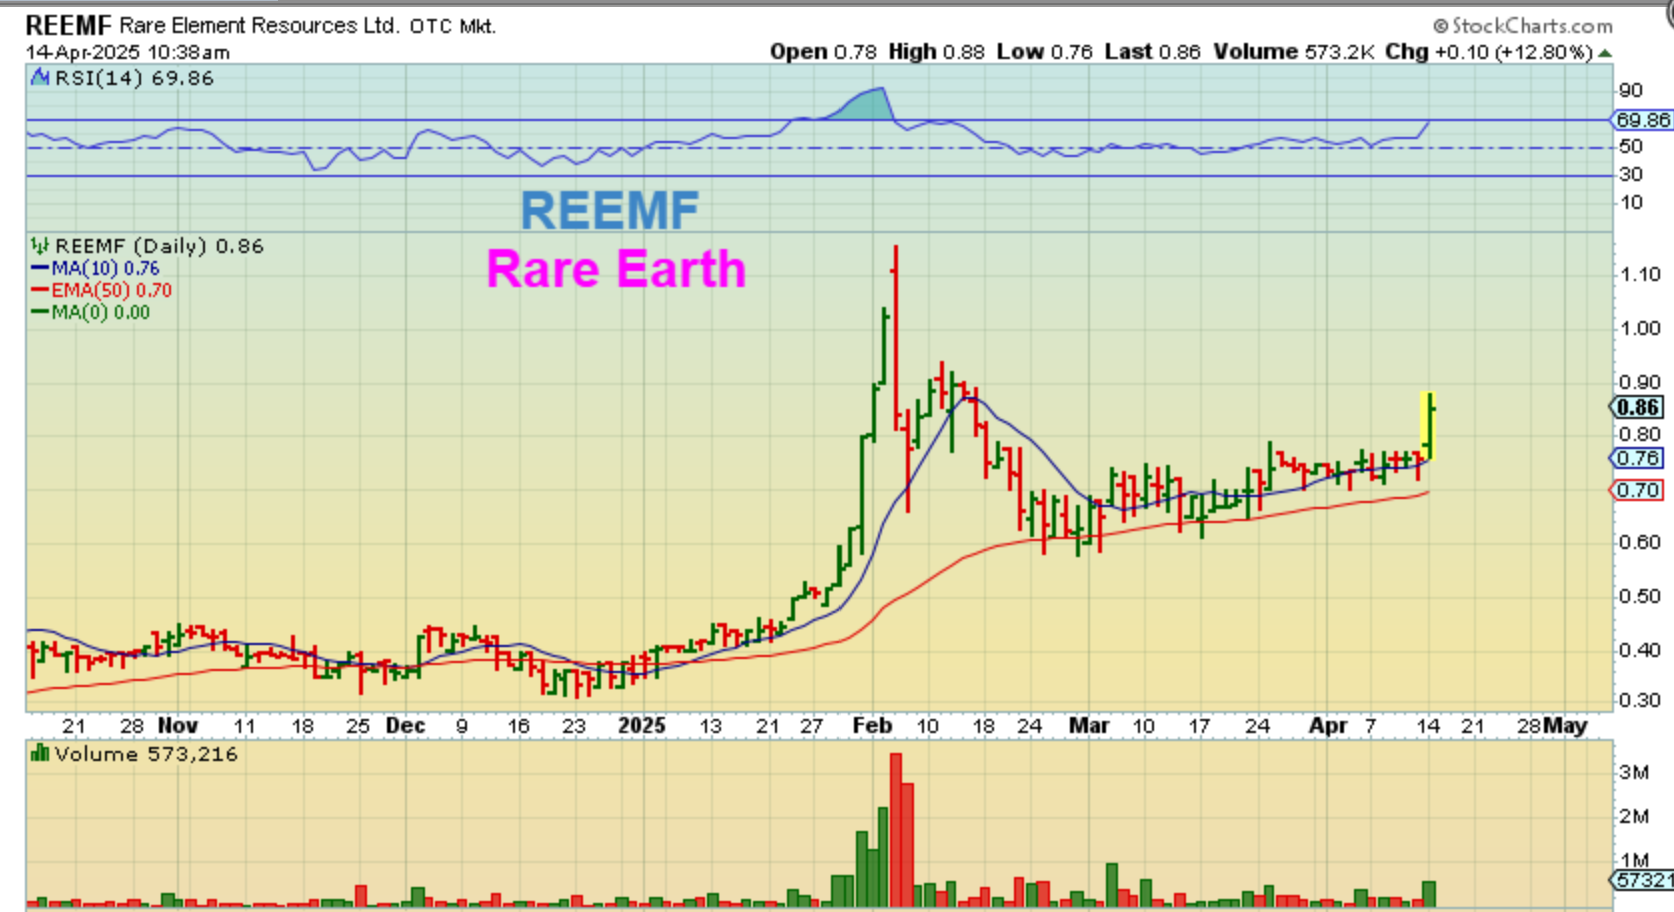
REEMF was started to run in the morning and I saw it up 5% and then here at 12.80%, so I posted this in the commenting area. That sideways consolidation was very bullish, because it took place during a market crashing.
.
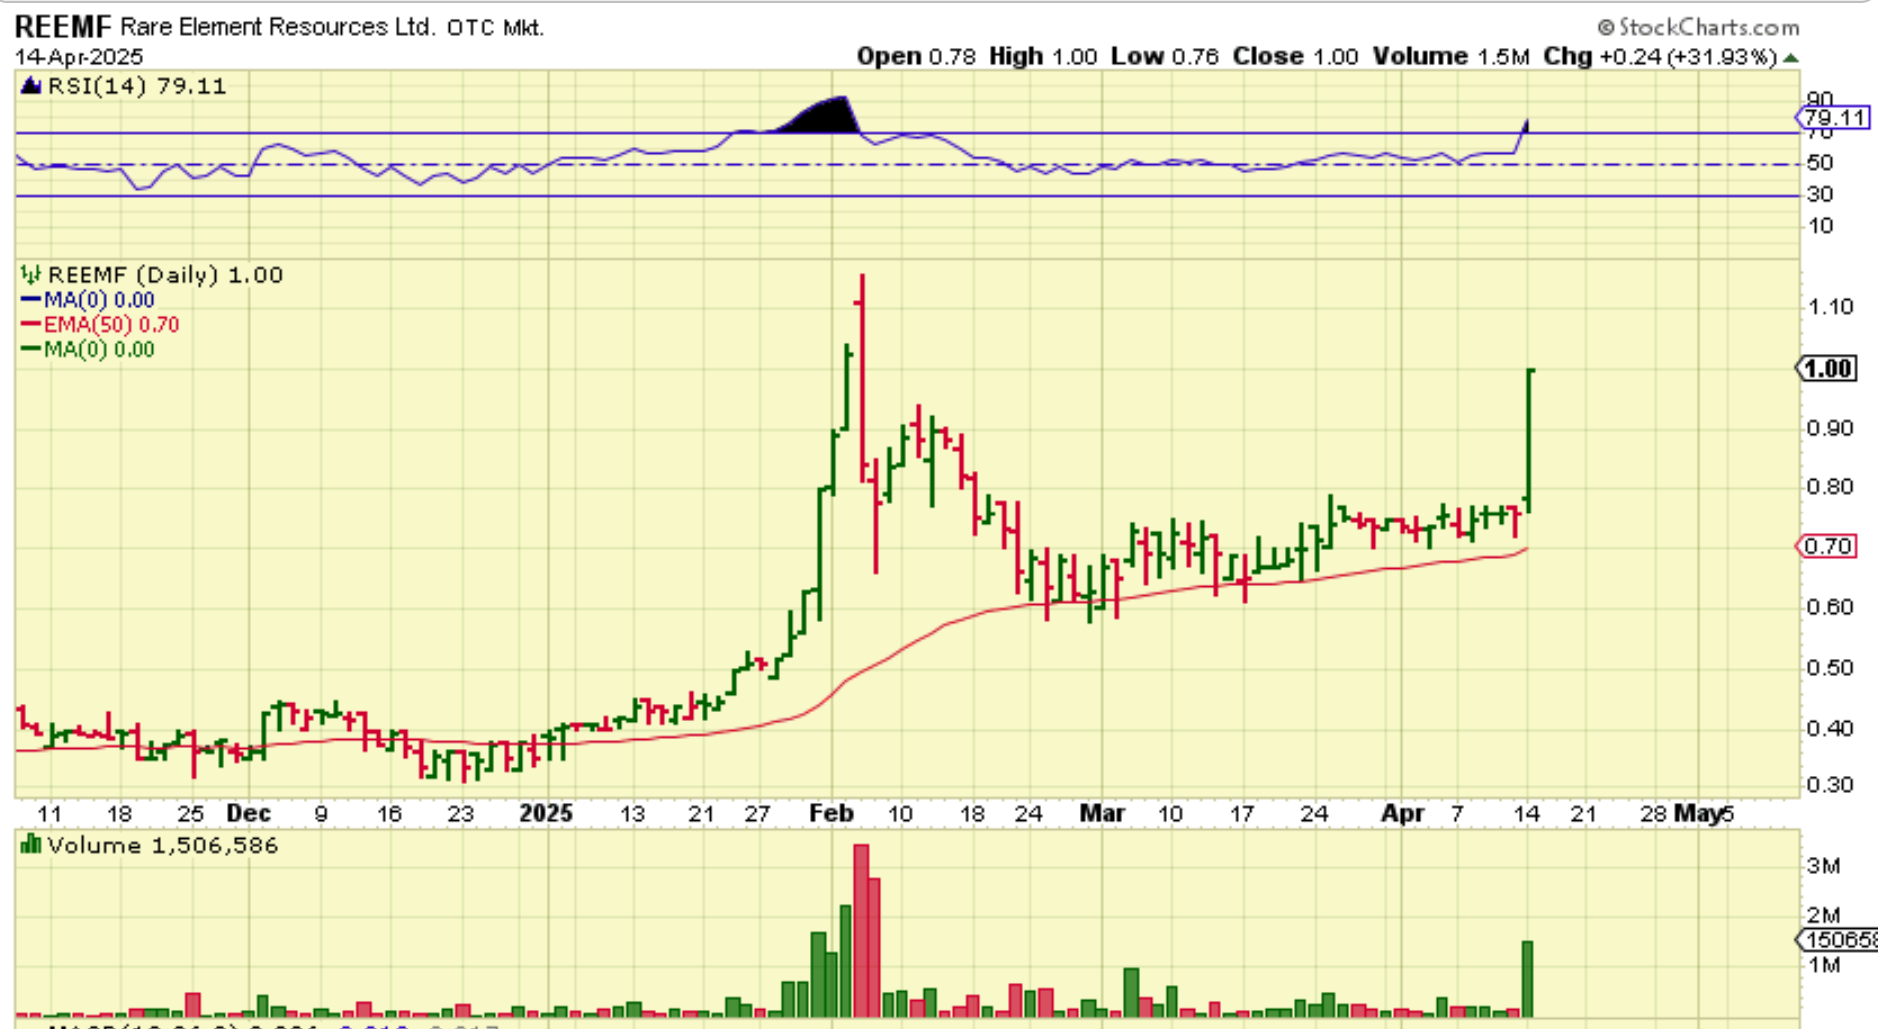
REEMF: Closed up 32%, congrats to those that bought and held on with me.
.
Currently, with the stronger tariffs on hold, the markets are experiencing a relief rally. As time goes forward, we are starting to hear that ‘XYZ’ is exempt from tariffs, auto makers may get a break, other countries want to discuss things & negotiate, etc, etc, etc. And with these glimmers of hope, the markets may be allowed to unwind a lot of that selling with an early ICL. The recent low was a cautious buy and stops could be raised. Traders may find stocks starting to rebound. I had pointed out stocks like RKLB at the 200sma, AMD with a strong bounce, and so on from watchlists. If the recovery continues and we do actually have an ICL in place, the half cycle dip or 2nd dcl will also offer entry points.
Gold, Silver, and the Miners are surprising to the upside. I expected a bounce out of the dcl, but this has been stronger and pretty much straight up, so you can now see the strength in Miners. If we get that dip into May, you will now know that buying that dip should be quite rewarding. Also, Gold could go into a parabolic blow off top then, as long as it doesn’t do that now. Enjoy your Tuesday trading!
.
~ALEX
.
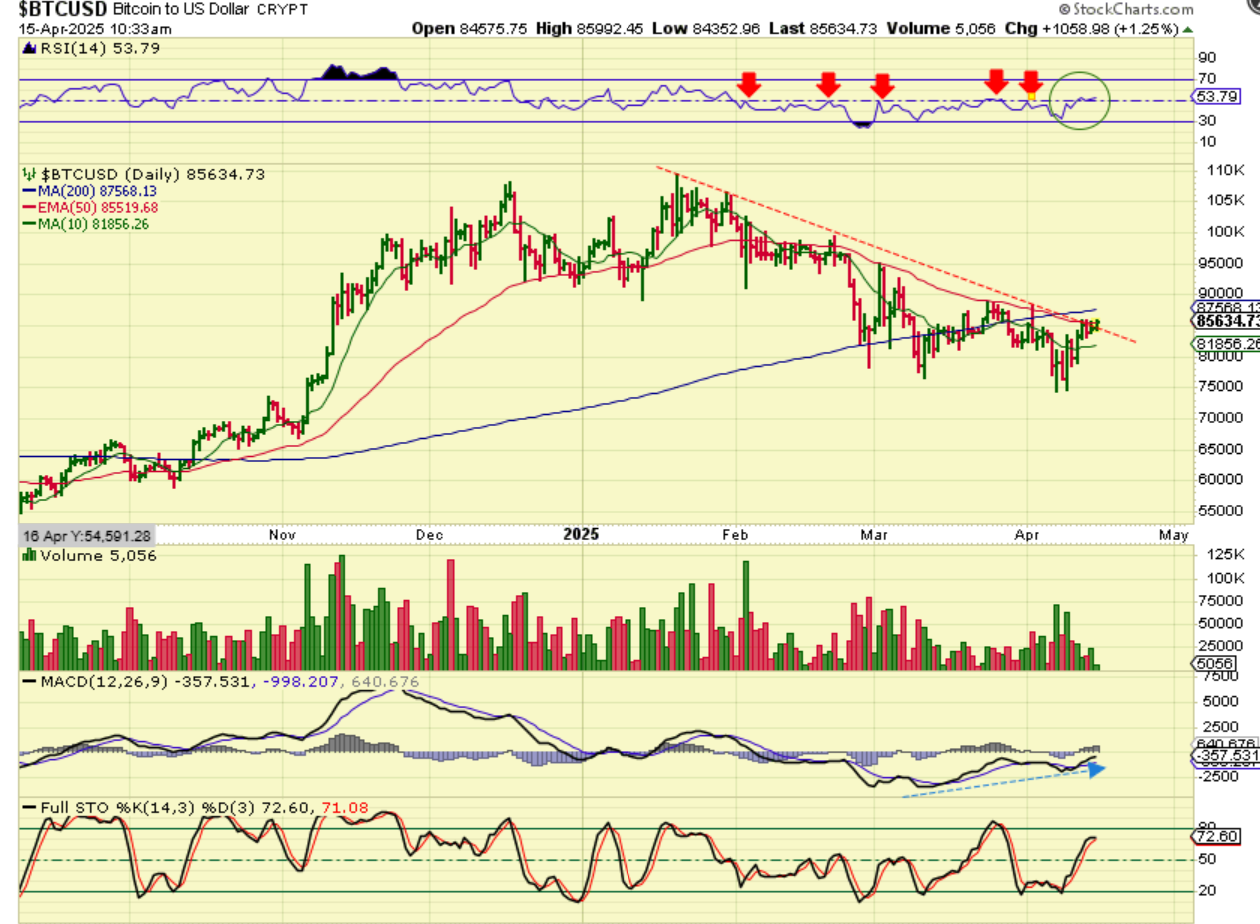
BITCOIN is pushing higher, but
1. I am very cautious with this low, because it broke the prior low, which looked to be an ICL or weekly cycle low.
2. I do see what looks to be renewed strength in the RSI, and the weekly chart looks good, as seen in the weekend report, but this still looked like a failed daily cycle, and I’ll be even more cautious as we get closer to day 50 or so.
3. This should only be day 35 of possible 60, so it does have time to push higher, and it is breaking the downtrend line today.