Thursday April 10th – Short Covering Reversals
FROM YESTERDAY:
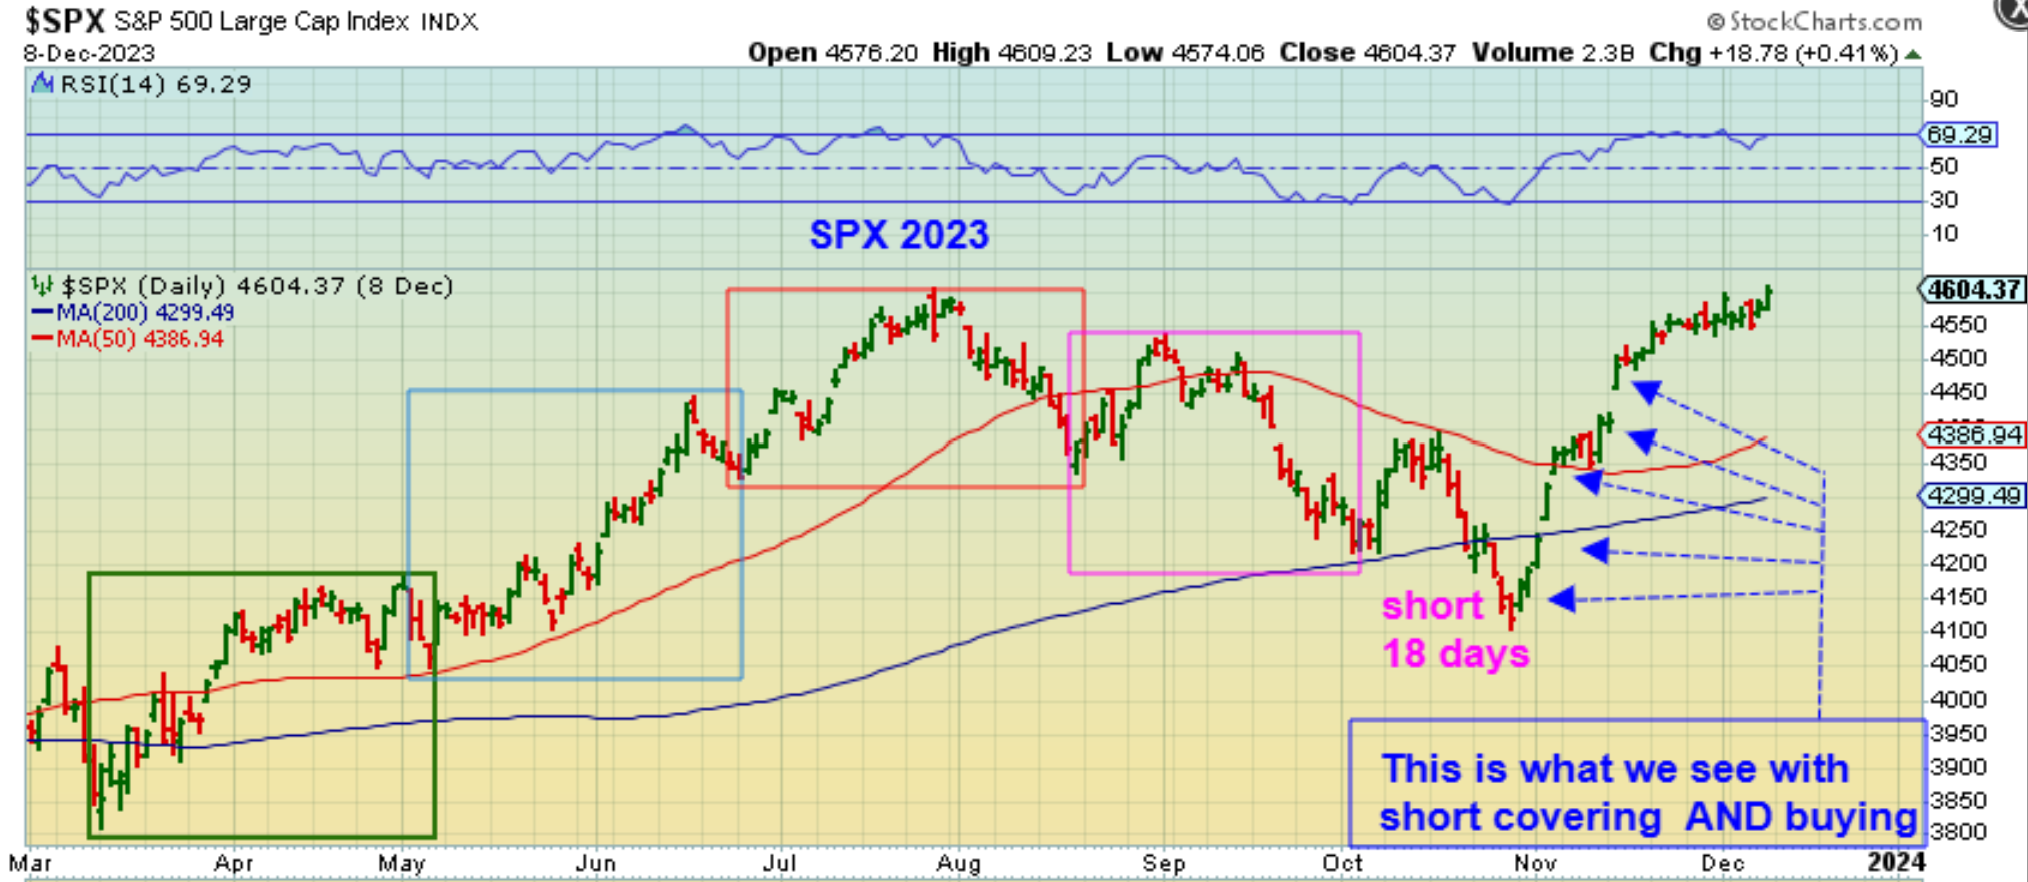
SPX 2023 – I had pointed out this set up with 5 daily cycles during a somewhat normal selloff. It ended with a shortened daily cycle, and my theory is that we suddenly had an event or situation where ‘shorts’ that had piled in heavily were forced to cover. As they cover, buyers see the v-bottom low and buyers move in pushing it higher. It goes straight up. I mentioned that this could happen now with good news, or it may not, so…
.
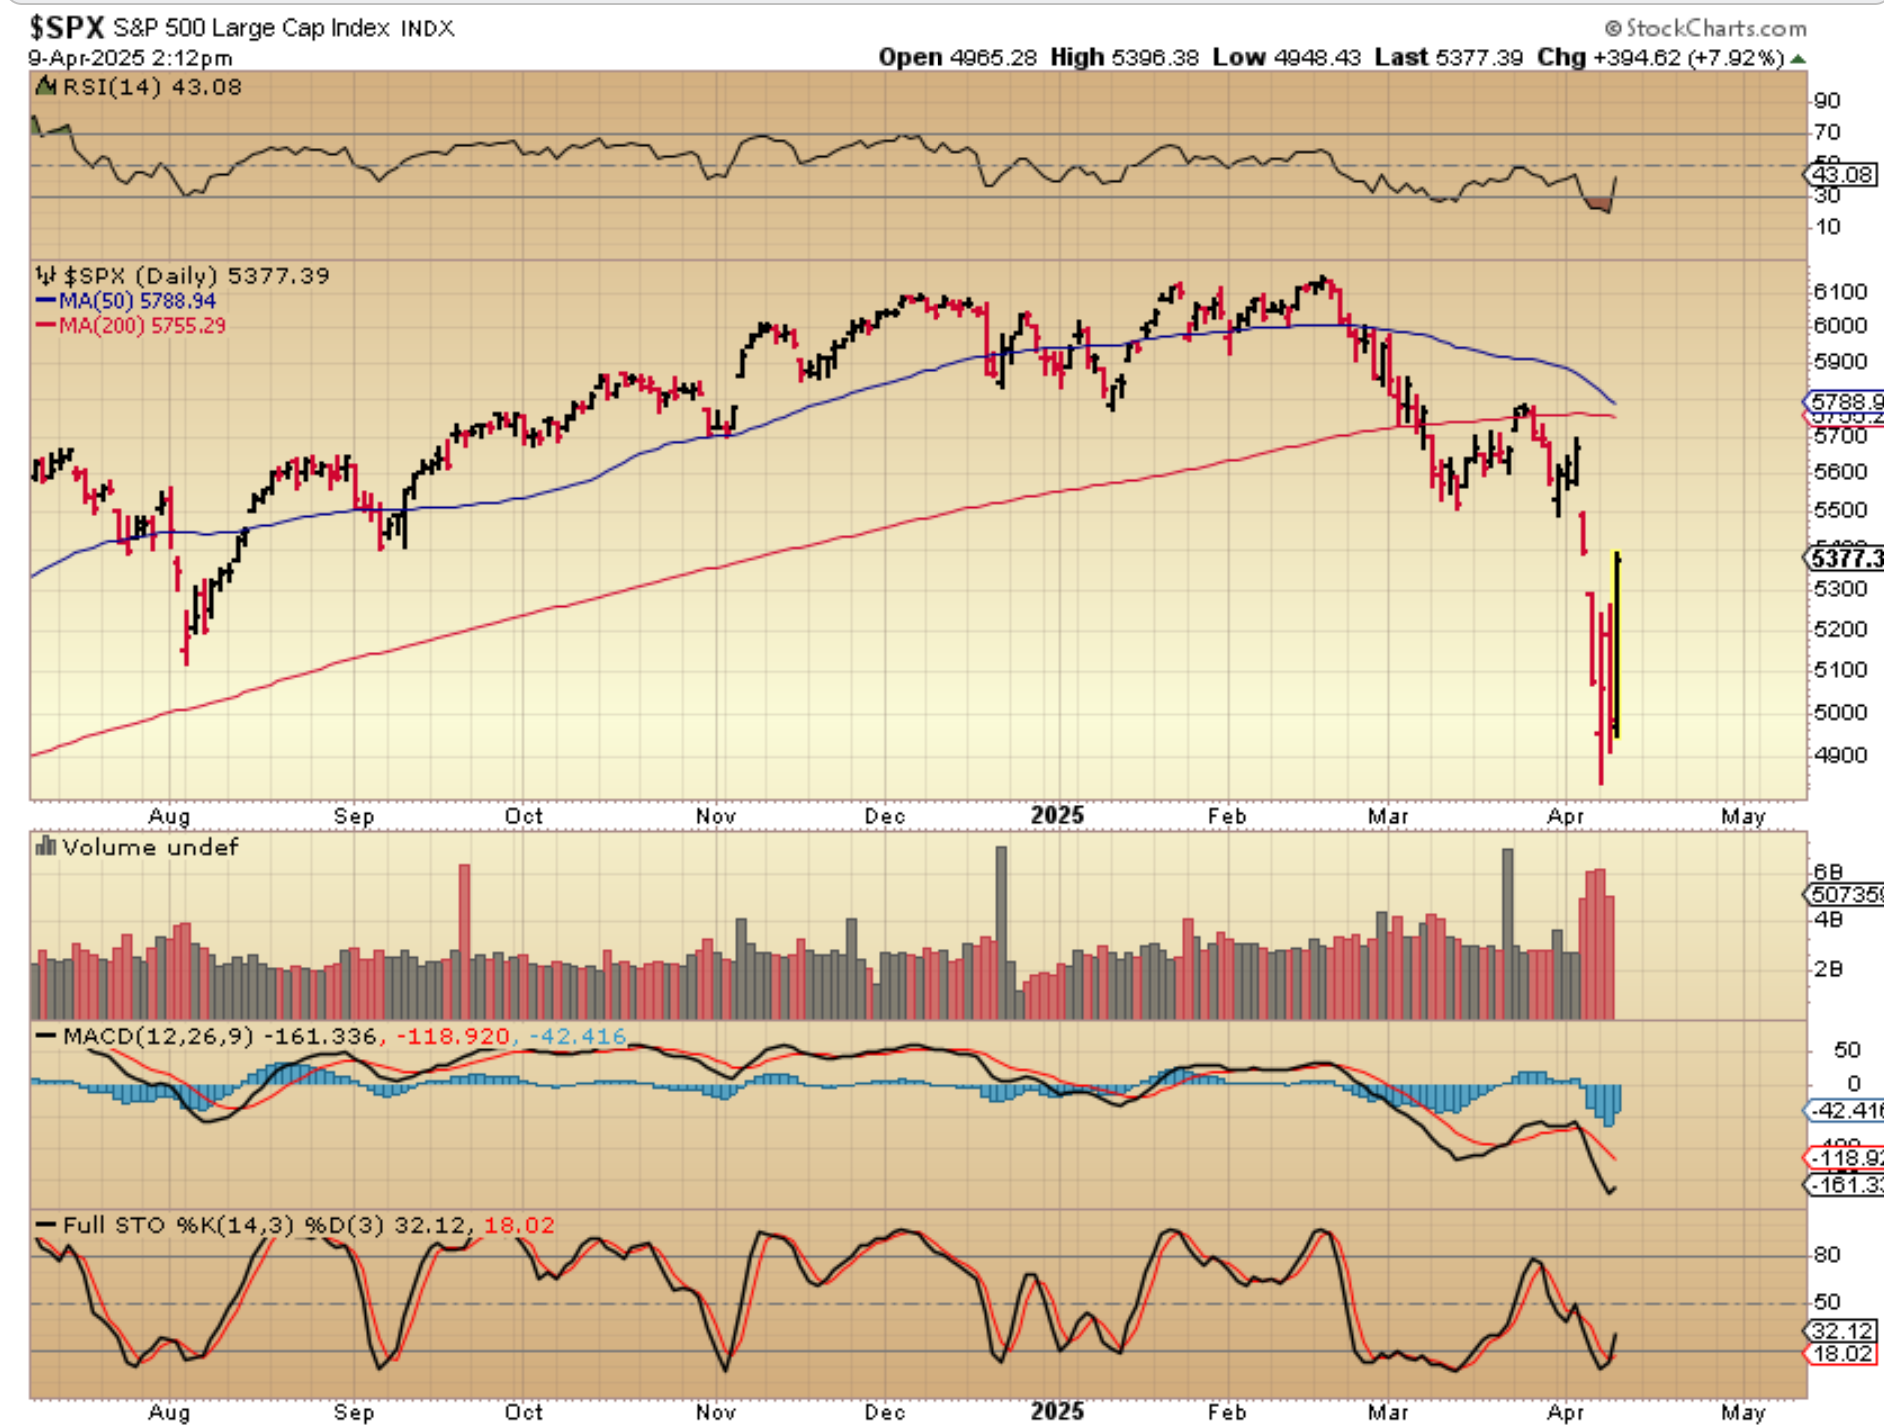
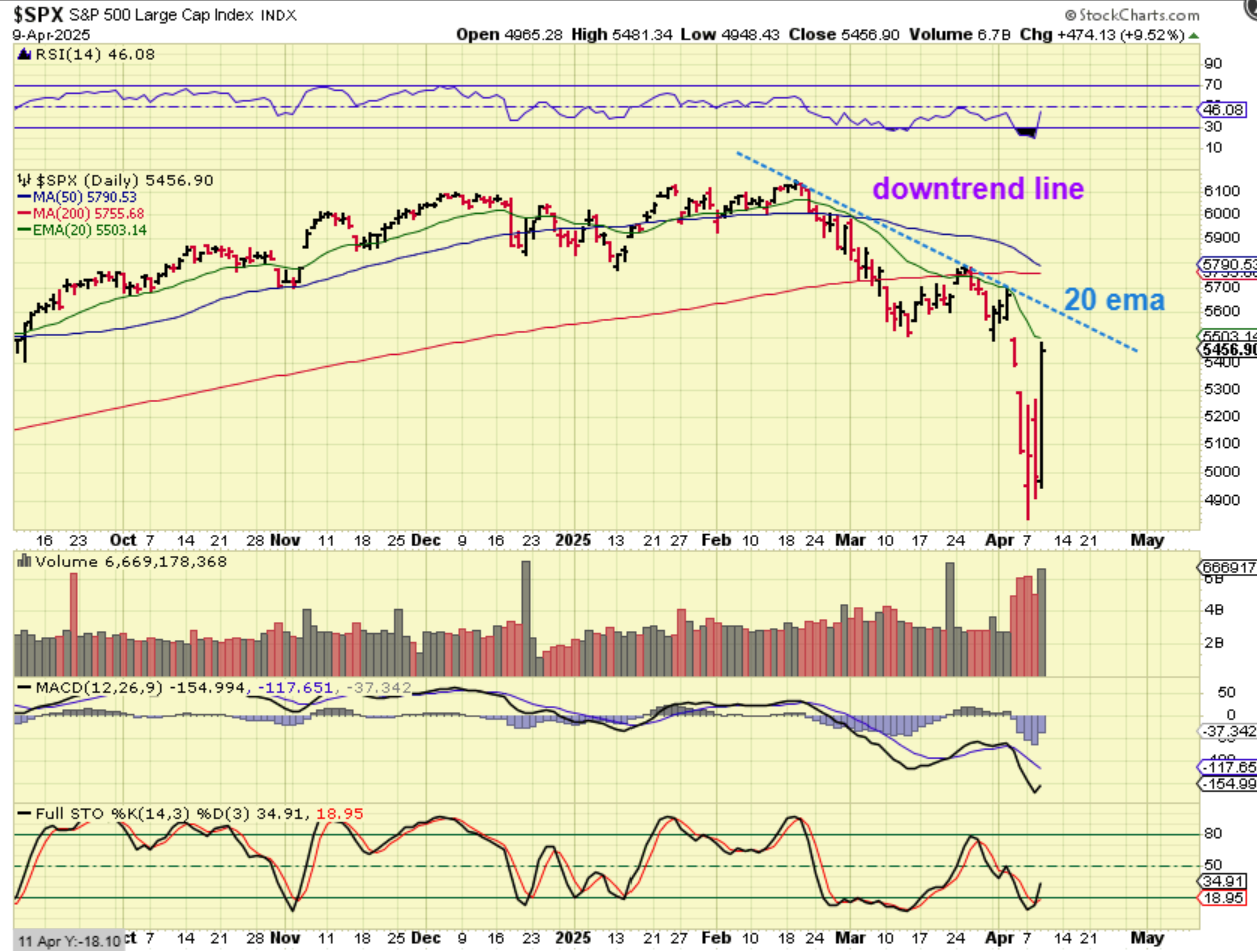
SPX – Yesterday we suddenly had an event that caused a massive short-covering rally. Trump ordered tariffs delayed for 90 days, except for China. Chinas tariffs became over 100%. This was a day 17 low, so it is early for a dcl, but he one above became a day 18 low due to extremes.
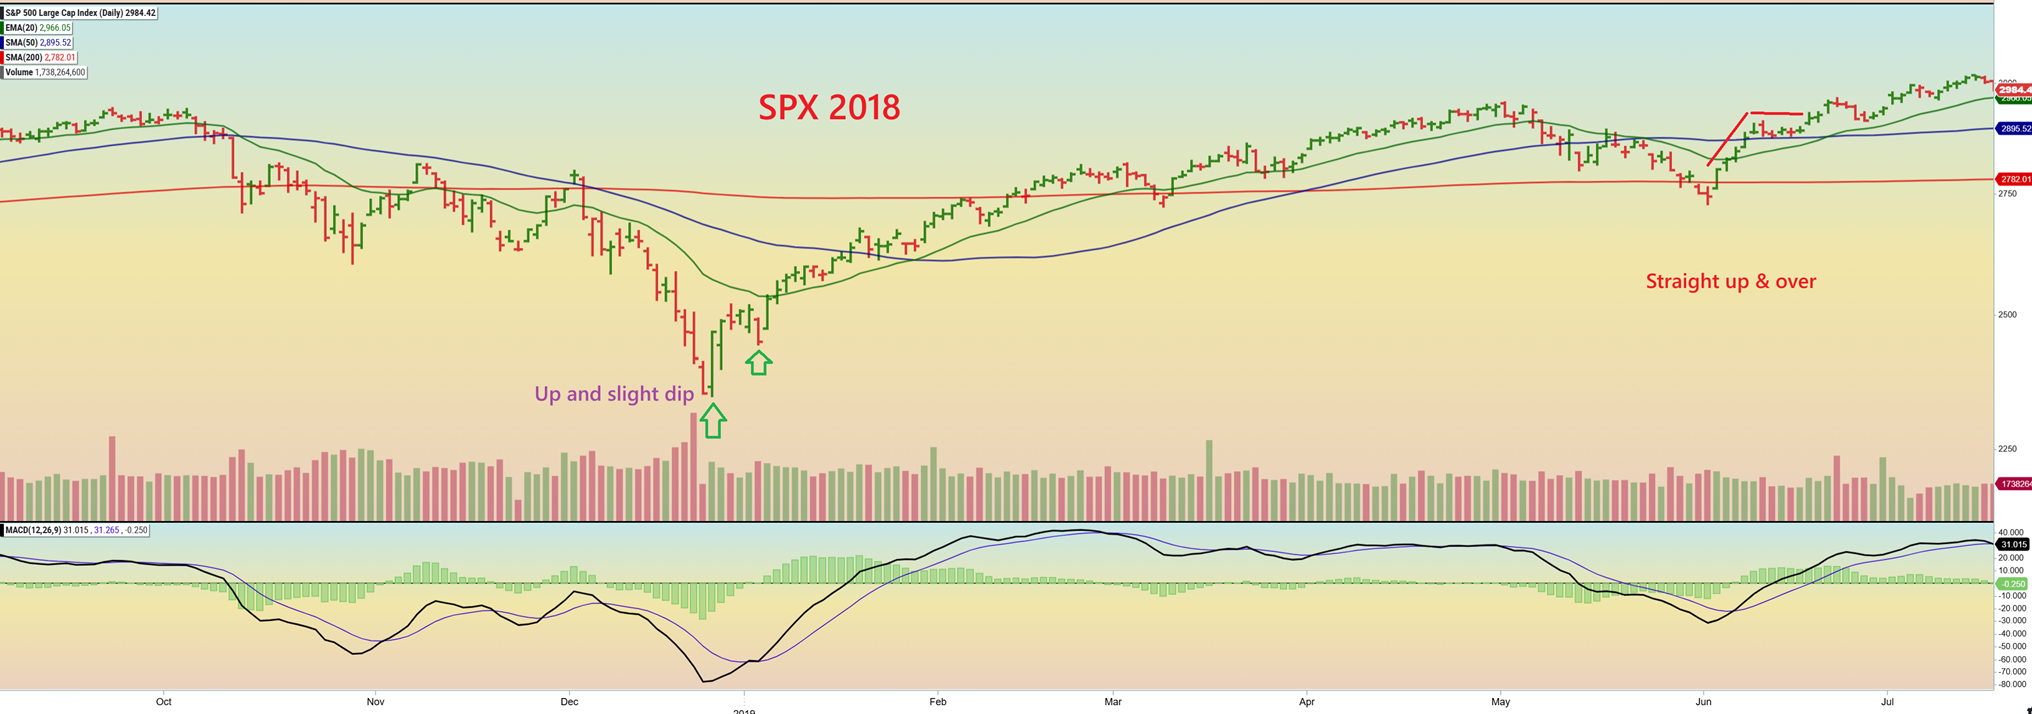
SPX 2018 – I just want to show other bottoms so you can see how they reacted after a reversal. The one on the left shot up and then pulled back with a higher low. That is common. The one on the right was more of a straight up and then sideways dip.
..
SPX – Price is currently right under the 20 ema. Overhead is also the downtrend line, the 50 & 200sma. It may pullback or stall at any one of these resistance areas if it is going to pause. Note: It also can just continue to surge higher with short covering and buyers jumping in too.
.
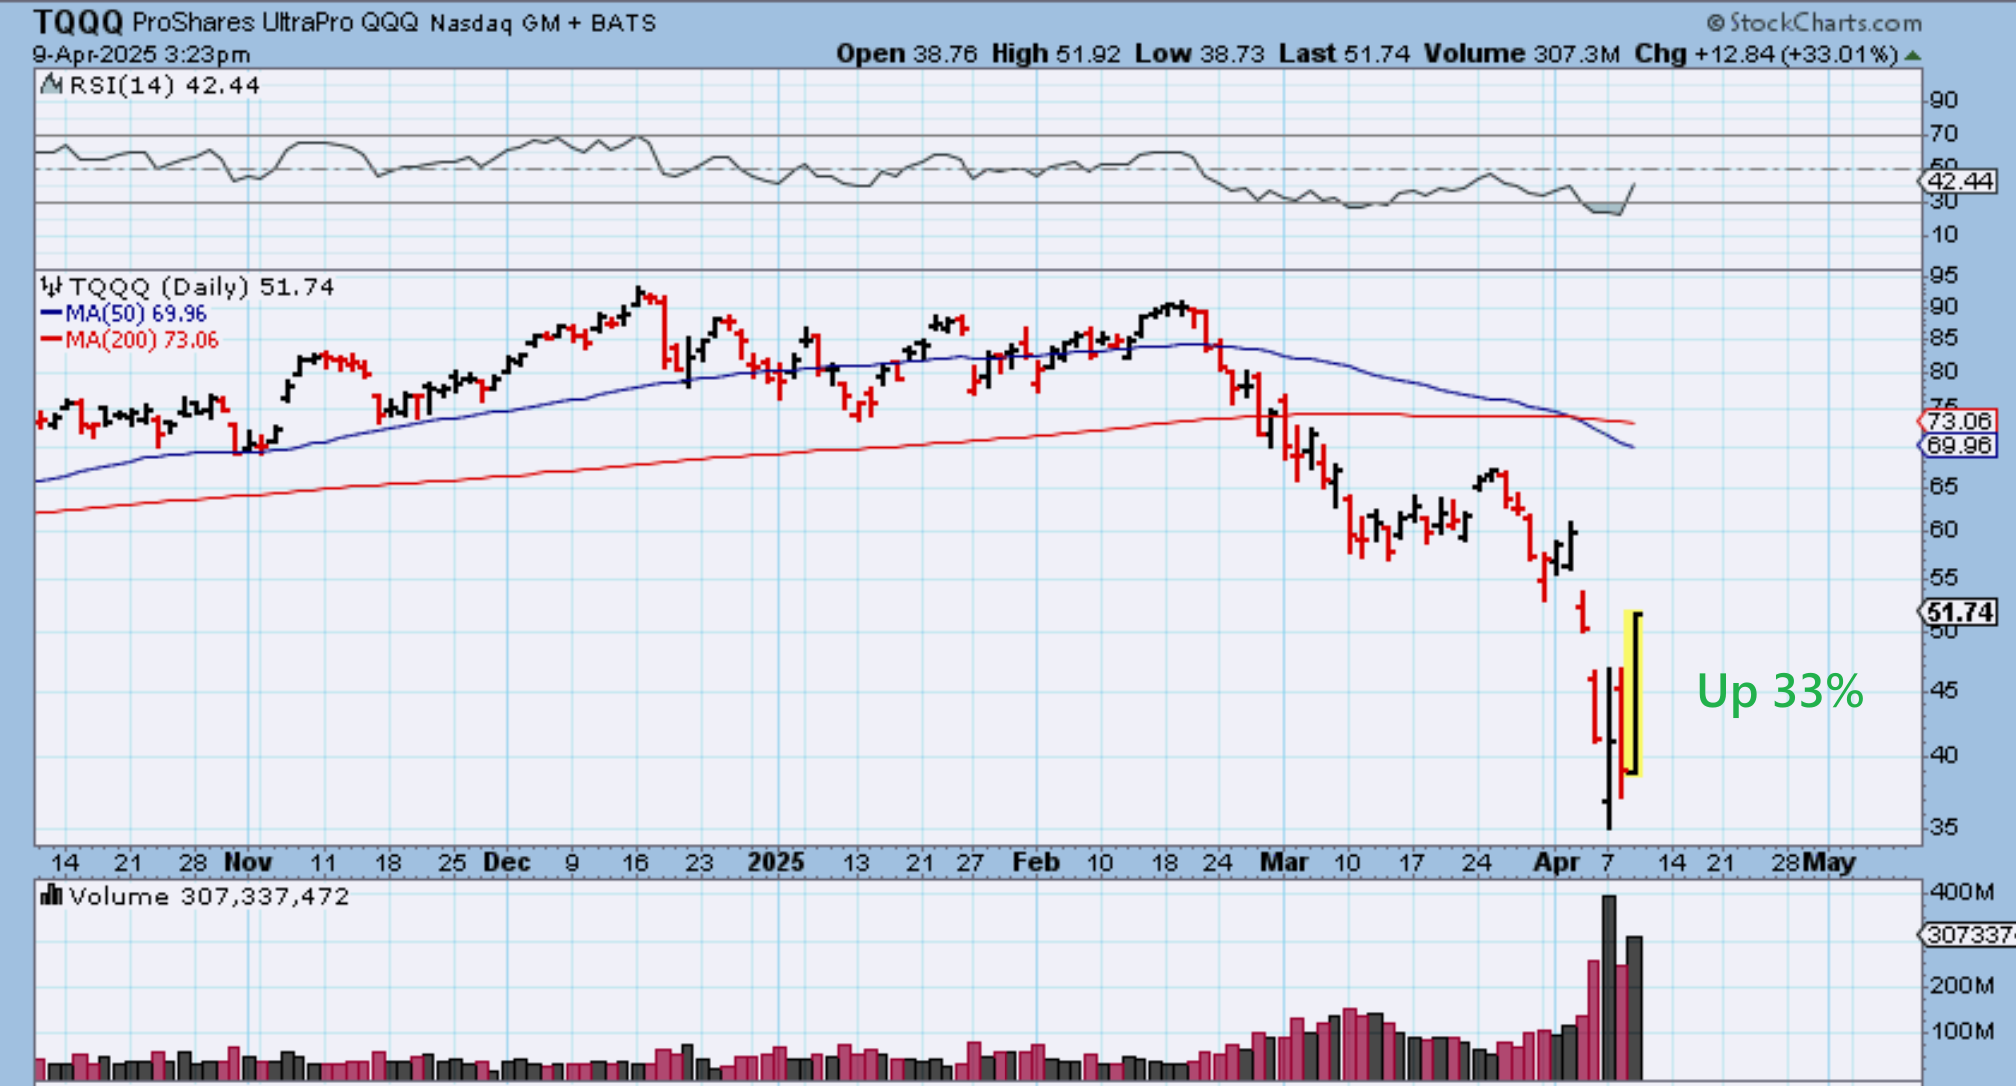
TQQQ -Leveraged ETF’s were up Big, with TQQQ up 33% by 3:30 p.m. and closing up 35%
.
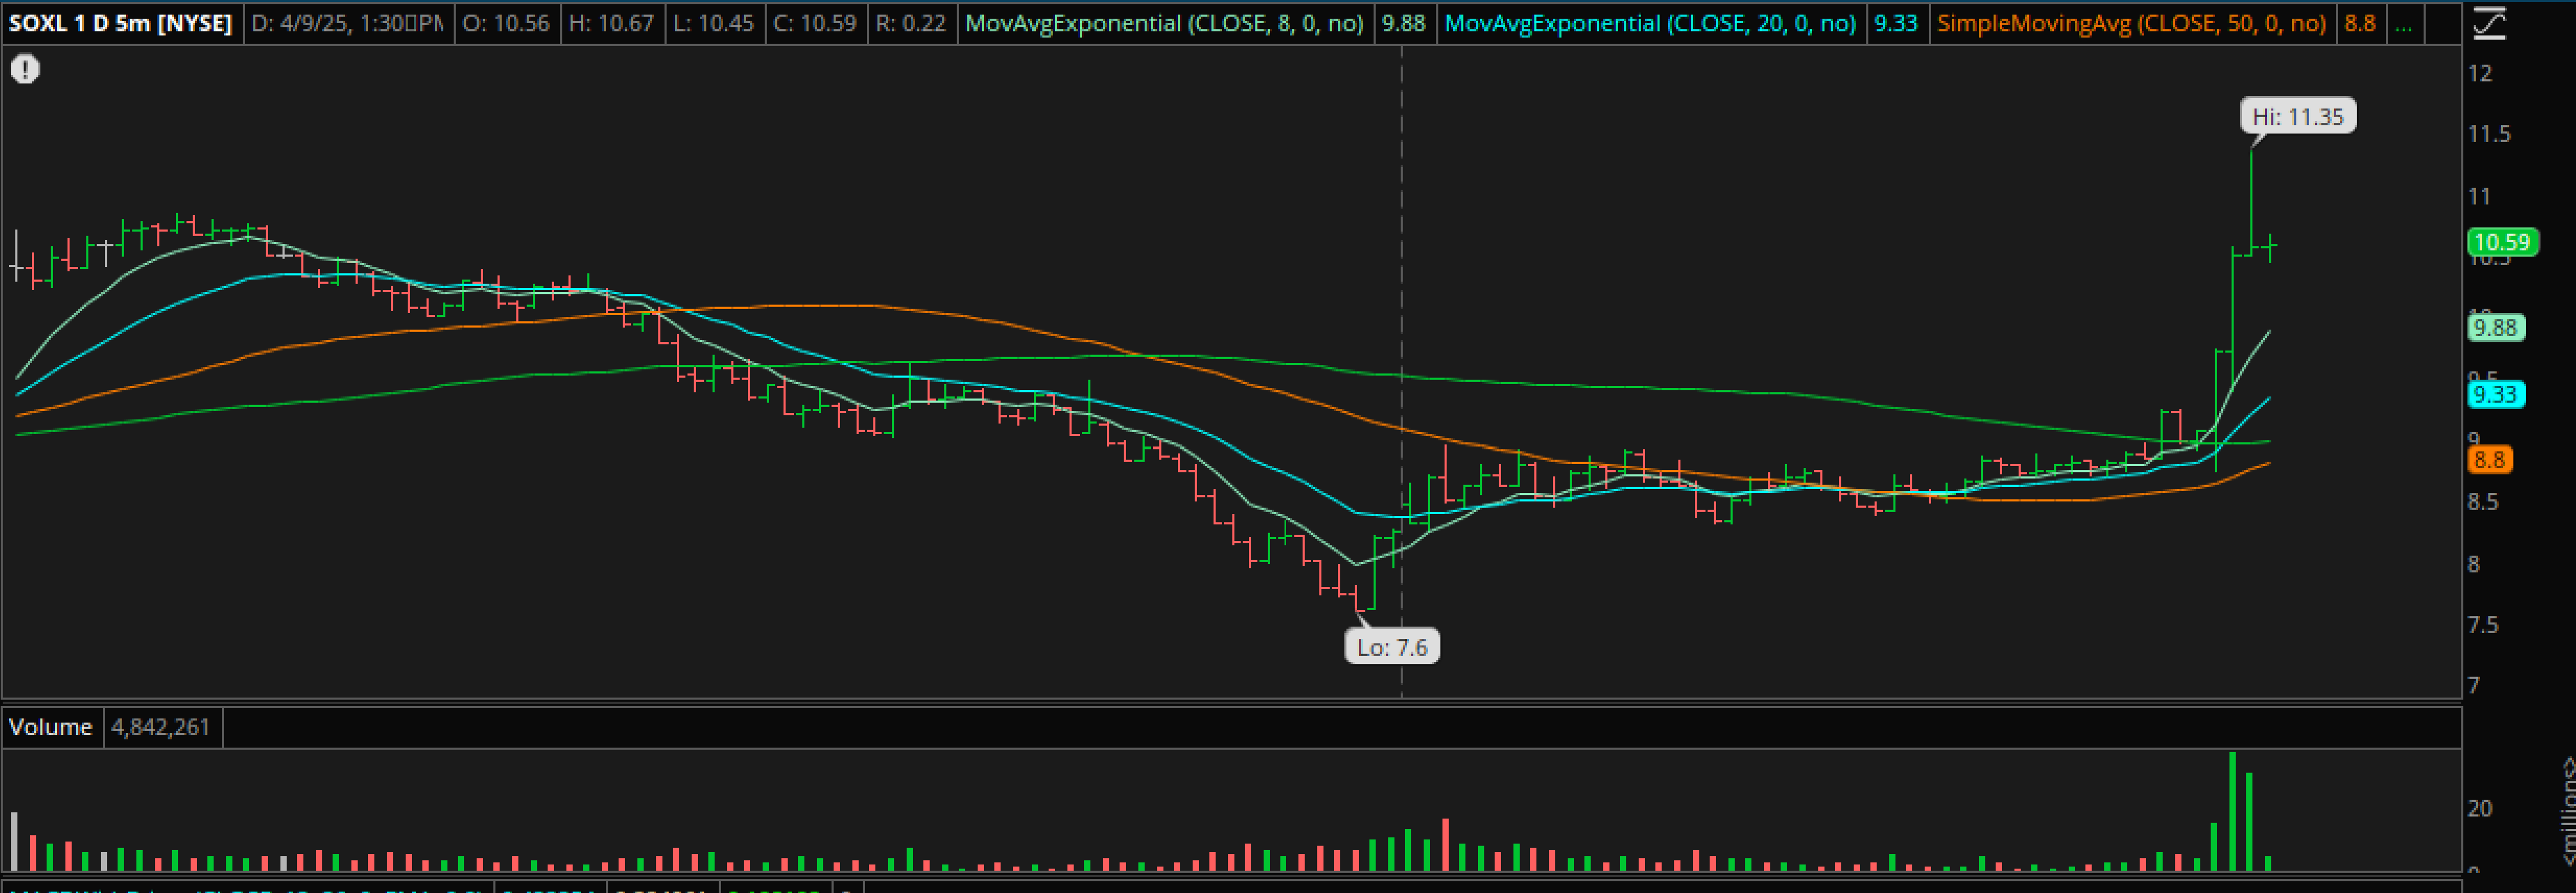
SOXL intraday – You can see that these markets shot straight up when Trump made the tariff pause announcement. This is a 5 minute chart, so you are looking at 20 minutes after the initial Pop.
.
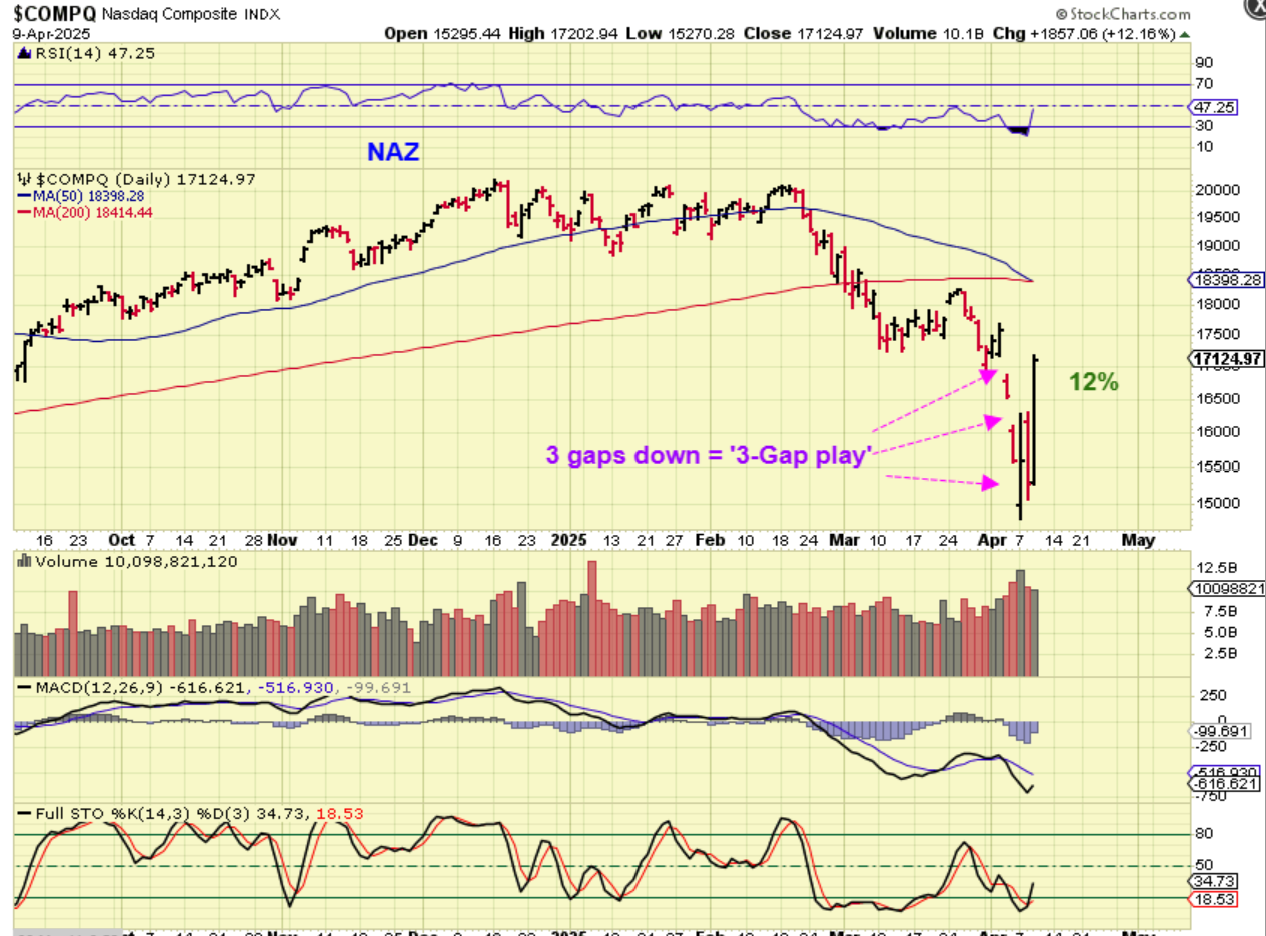
On Monday at 9:37 am, after the markets gapped down, I had discussed that 3 gap plays are extreme and usually reverse. It is risky in this Choppy Trump administration environment, but you can buy with a stop when it starts to rise back up. I started to buy as it started to reverse (small positions).
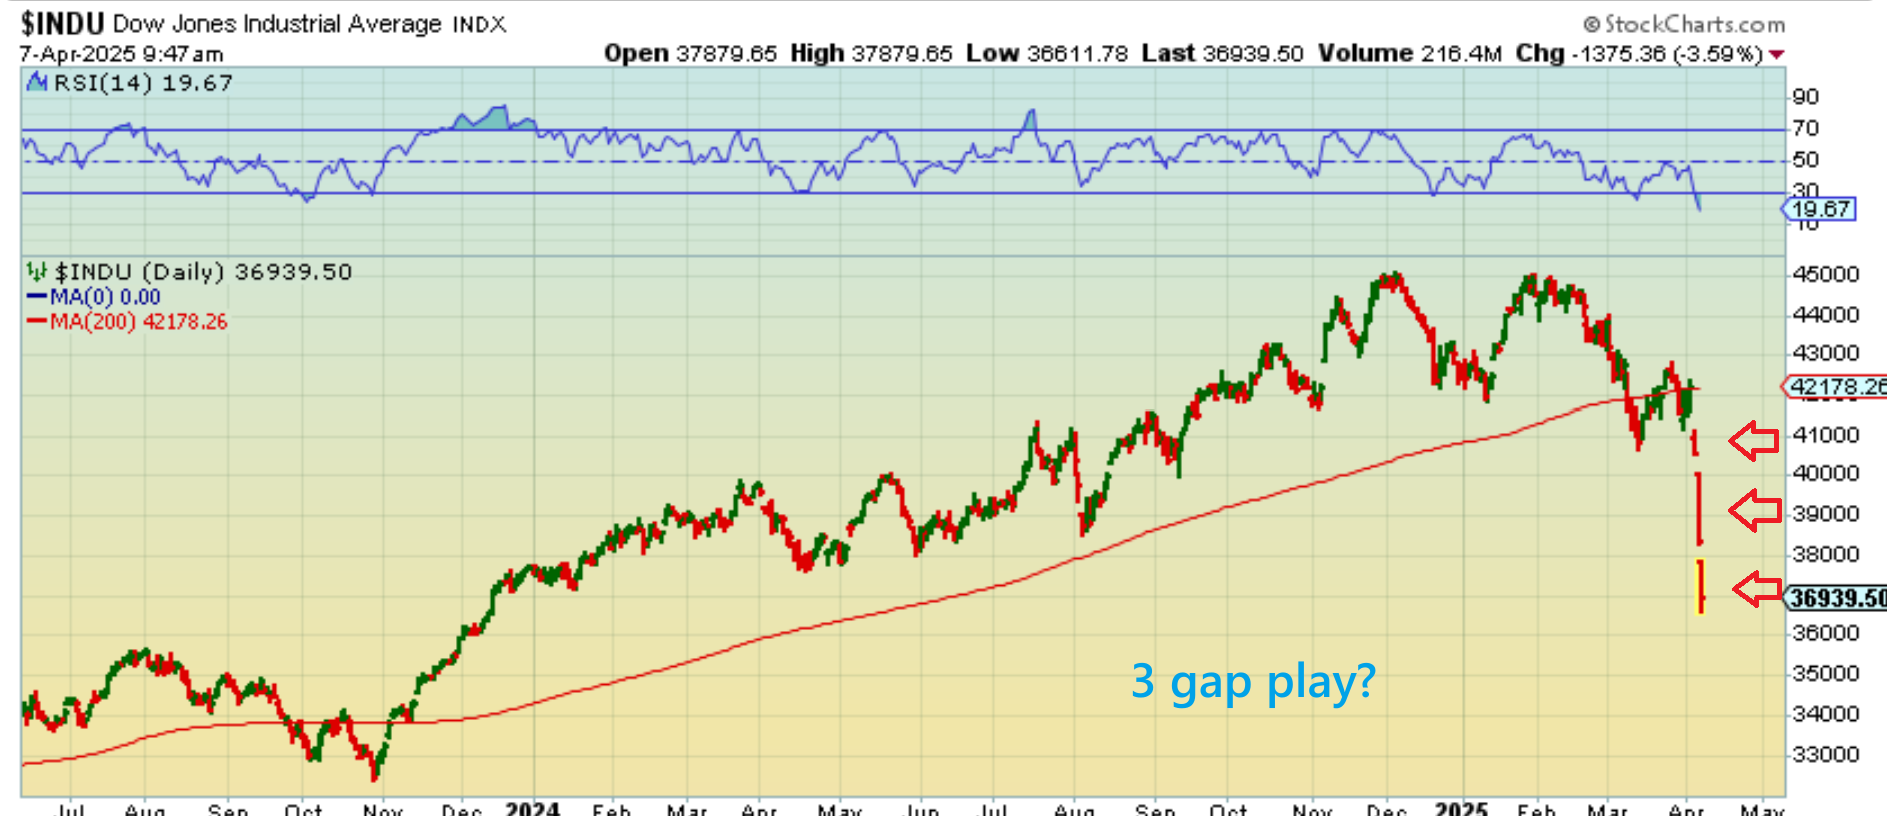
The NASDAQ reversed right after I posted that intraday on Monday & actually closed green. Tuesday it pulled back and ‘shorts’ probably felt that they could regain control. On Wednesday it needed a catalyst and popped 12% after 2 p.m.
.
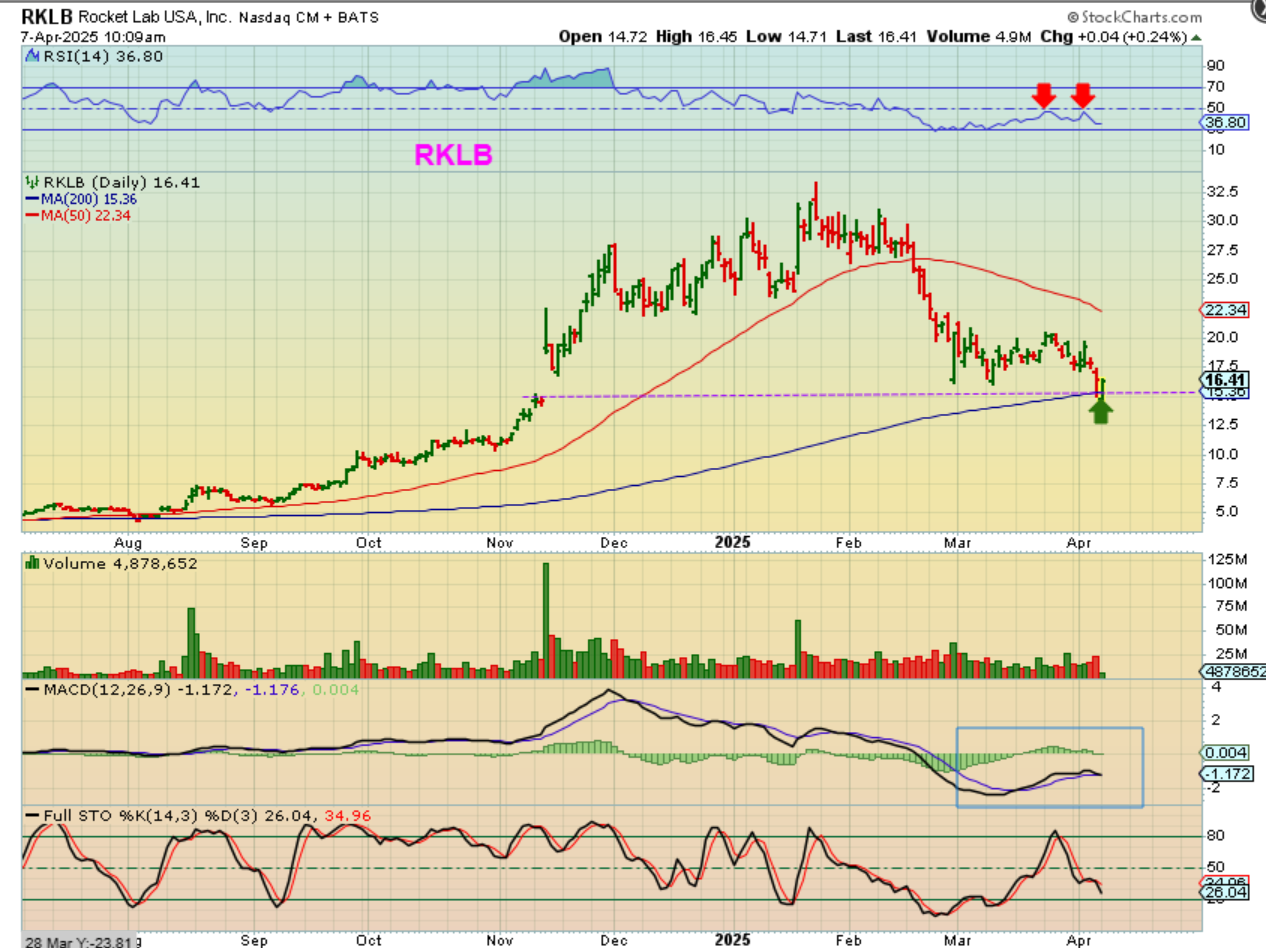
RKLB – In fact, I pointed out RKLB as reversing right at the 200sma ($15) after pulling back and having a bullish divergence in the MACD. It did not crash as much as the markets and I’ve been watching my watchlist for such ones (leaders)…
.
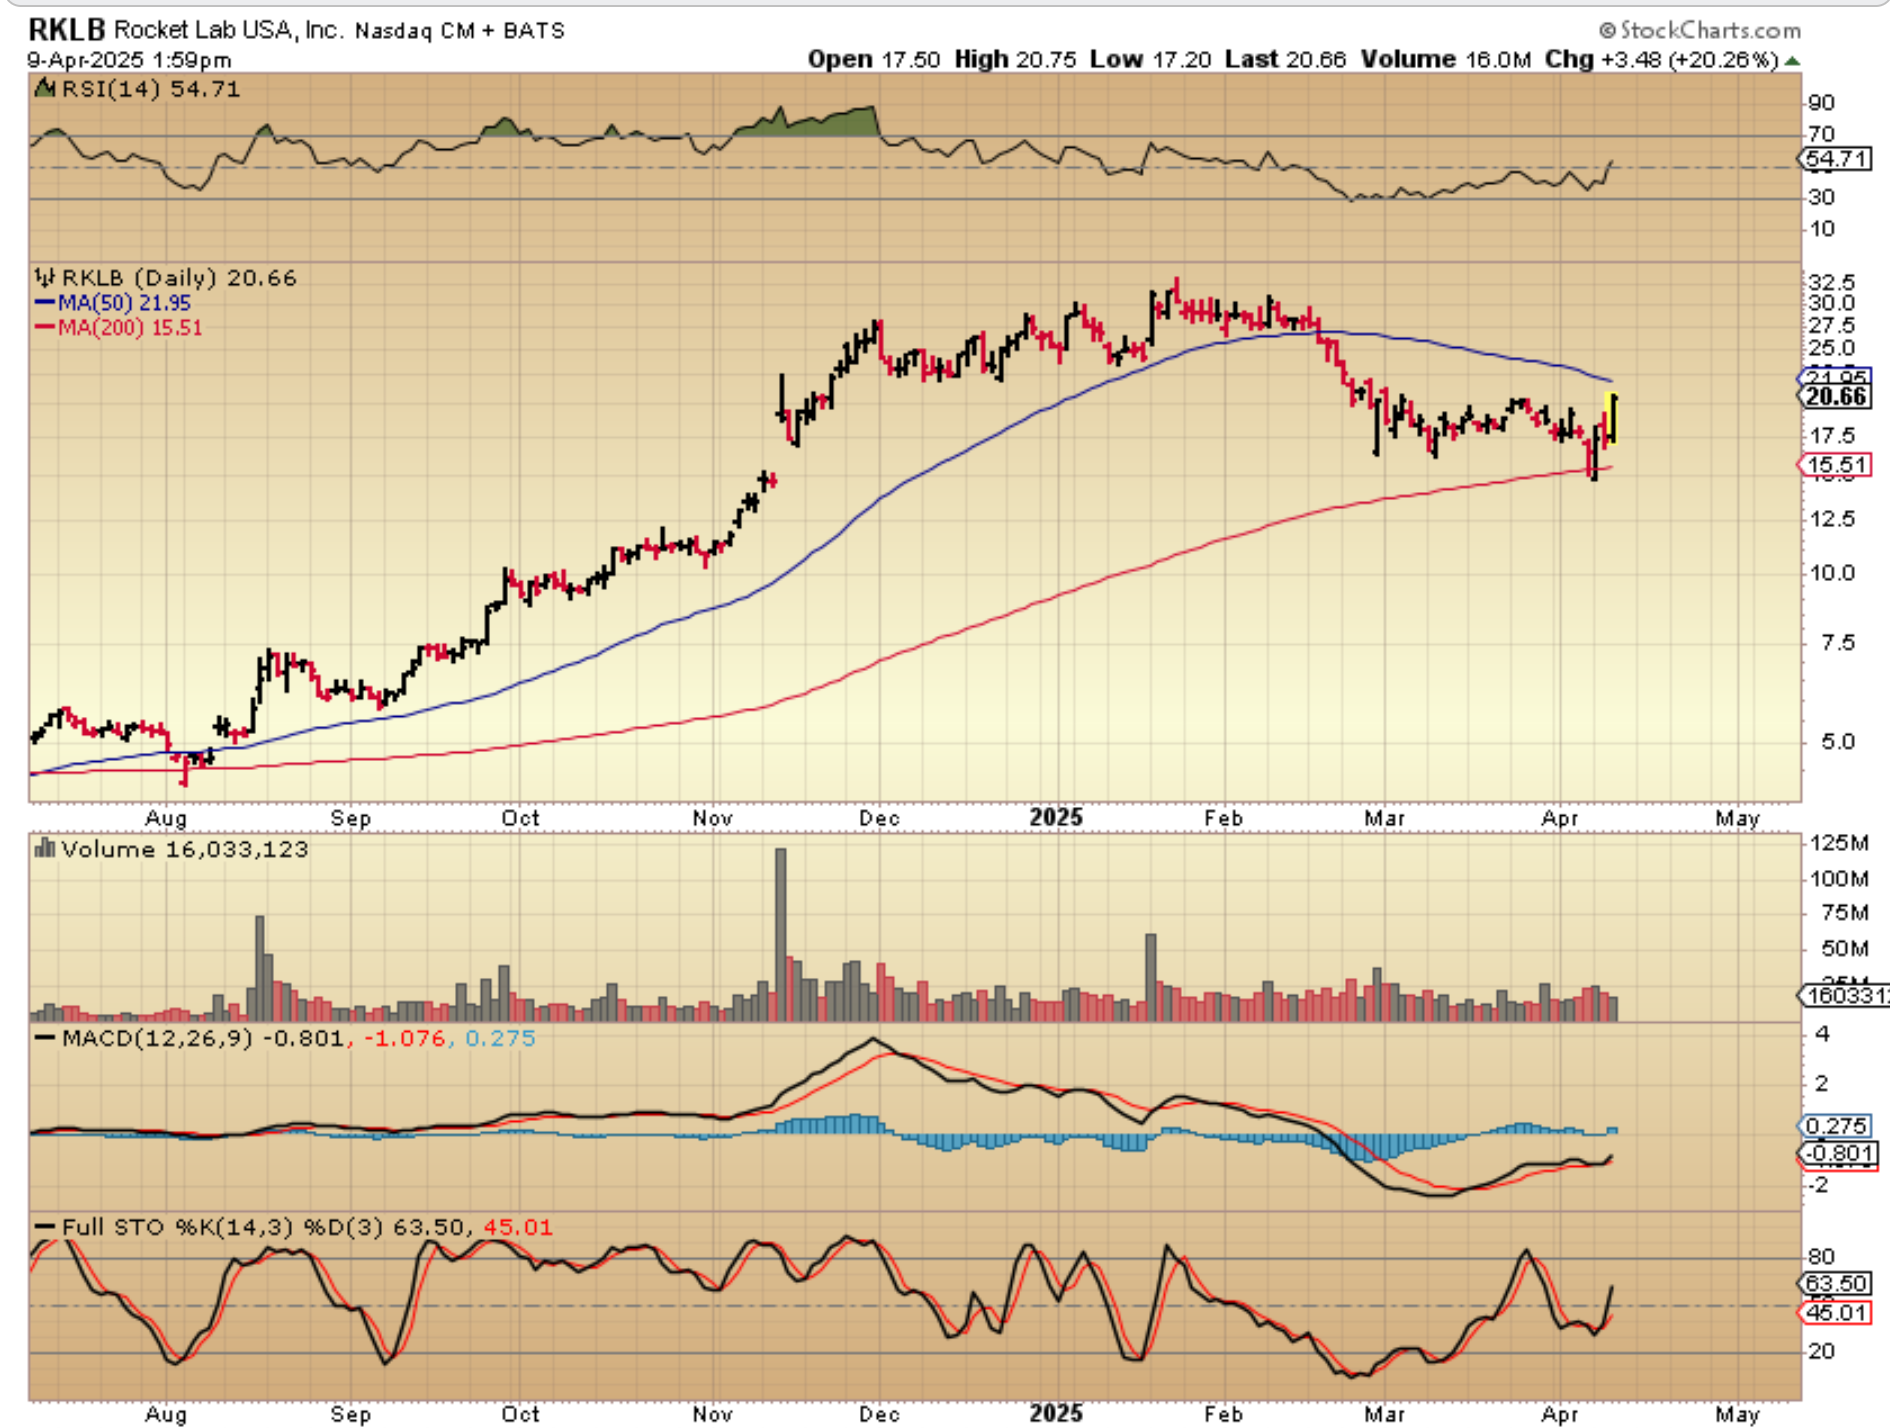
RKLB moved from that $15 area to $20 as of midday yesterday. The 50sma is resistance.
.
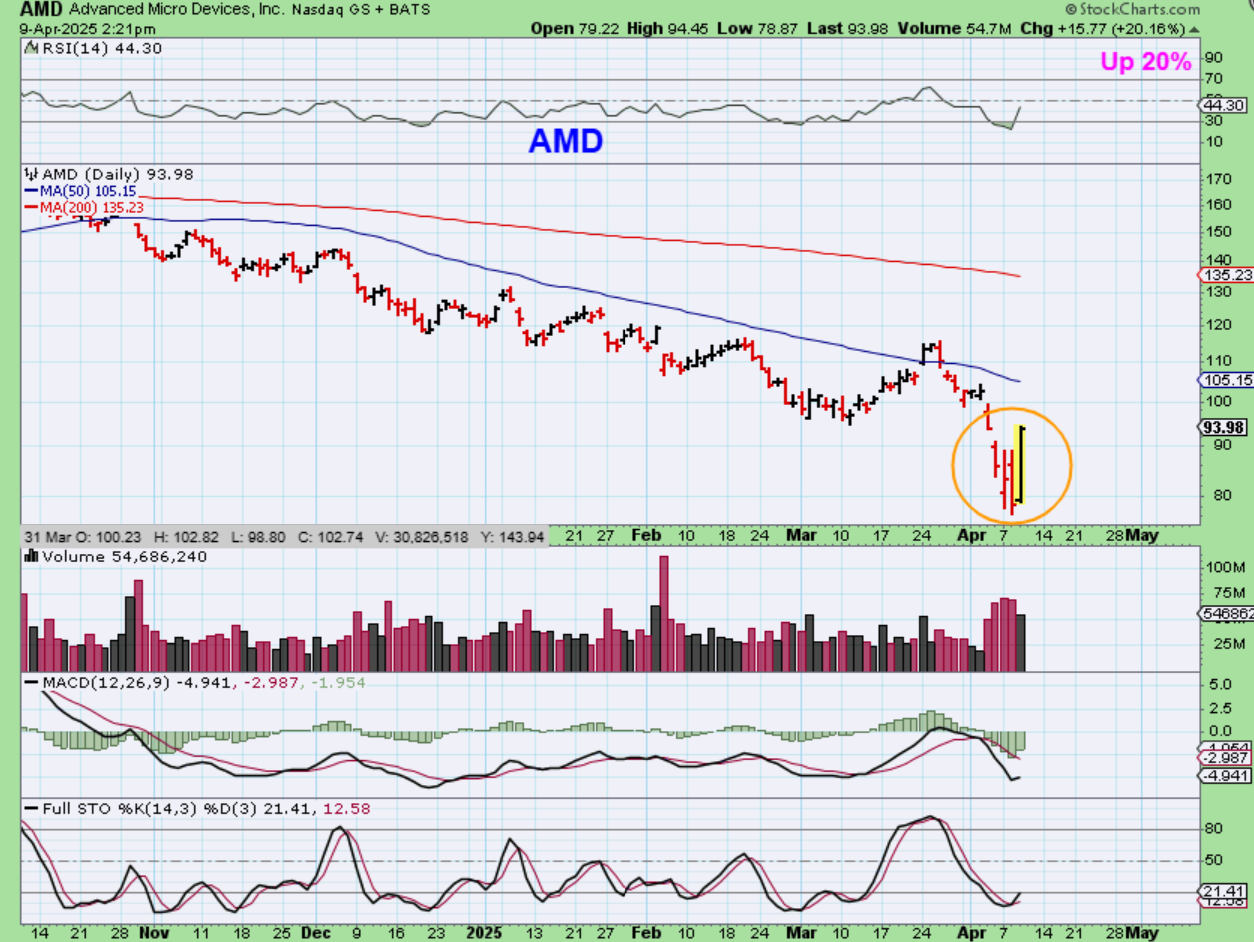
AMD popped 20% after the 2 p.m. tariff pause. Shorts needed to cover quickly to try to lock in those gains, now we see if Buyers keep it going.
.
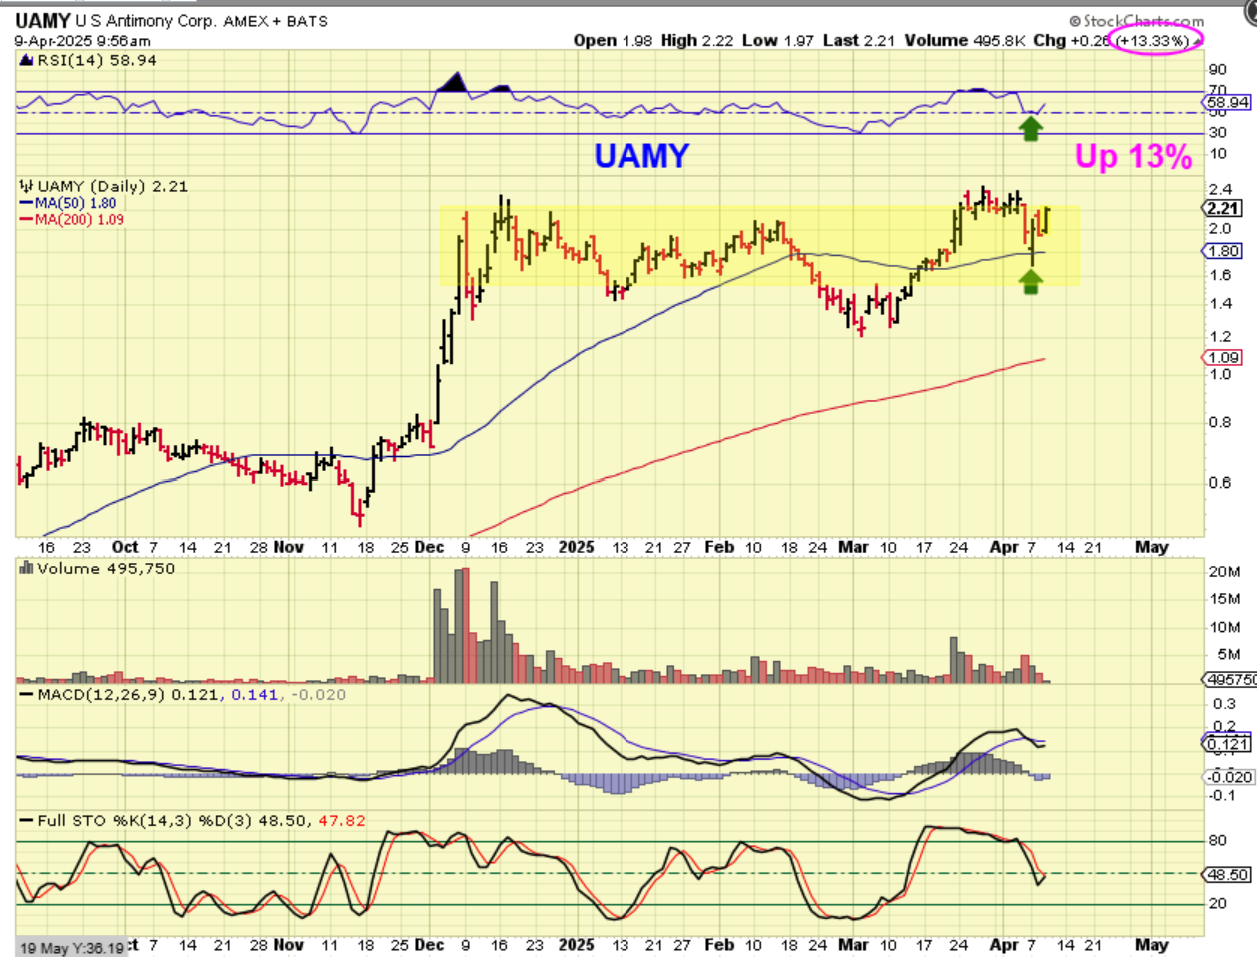
UAMY (Rare Earth) hardly sold off in the crash. It just tagged the 50sma and recovered.
.
YESTERDAY I SAID ABOUT OIL:
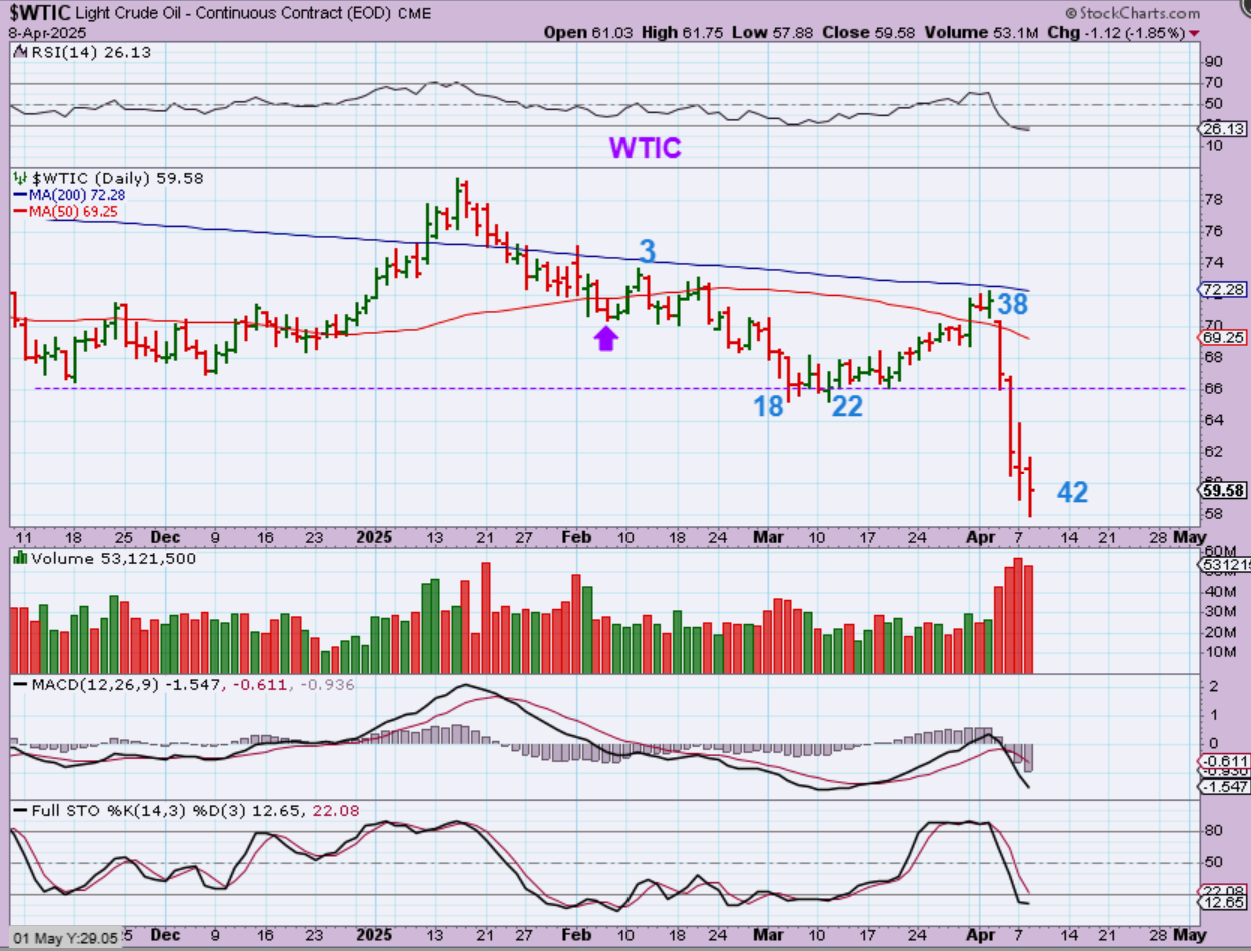
WTIC – Oil continues the break down, but we are at day 43 today and a low can form anywhere after day 40 in Oil. I have discussed a bounce with a dcl, a back test with that bounce, and then a drop to maybe $42ish if we have another bearish daily cycle. You can short this with DRIP on the bounce, if the bounce looks weak.
.
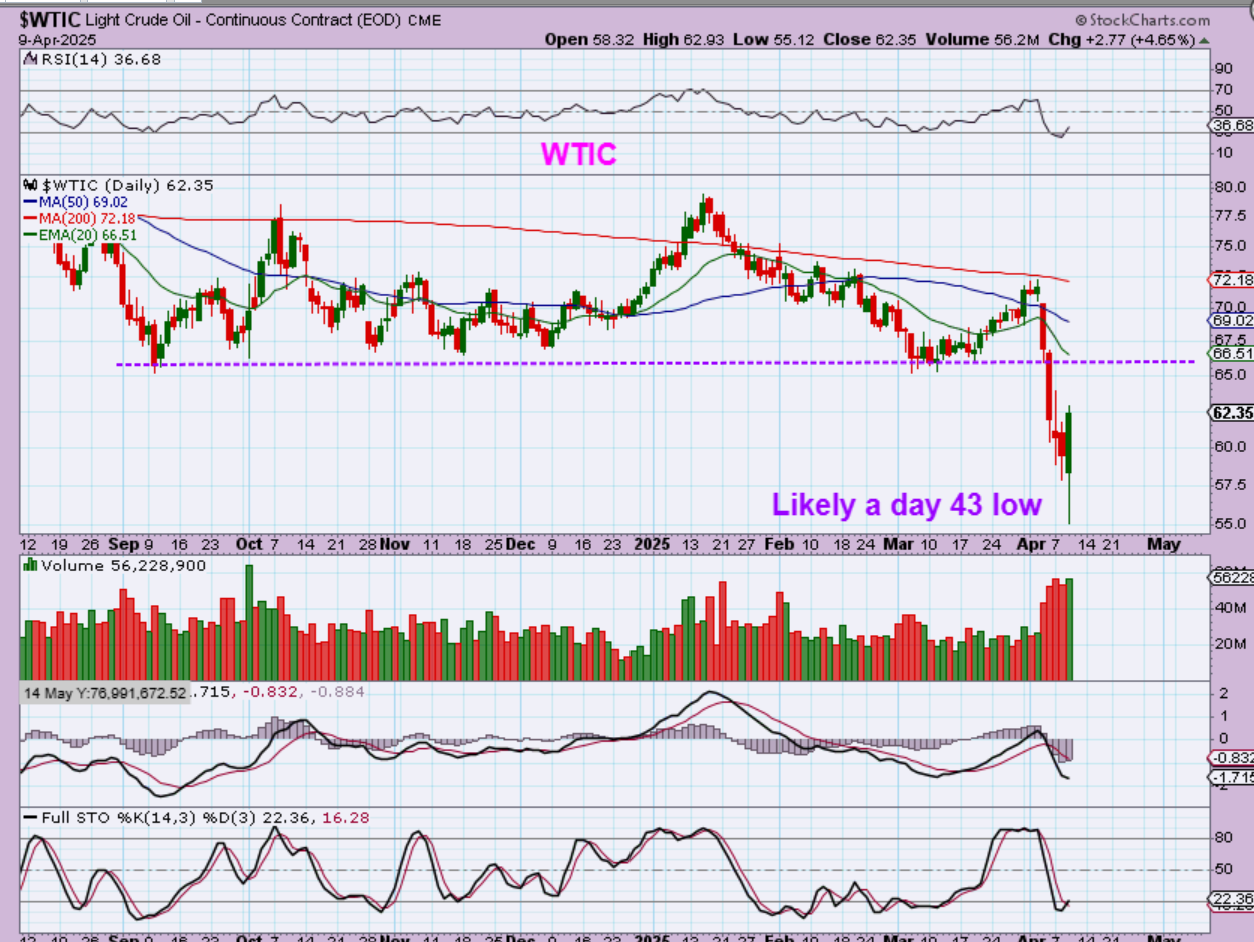
WTIC – Oil had a very sharp drop & reversal yesterday too, so I would say that this is likely to become the dcl at day 42. Oil tagged $55.12 and is now at $62.36. Big reversal.
.
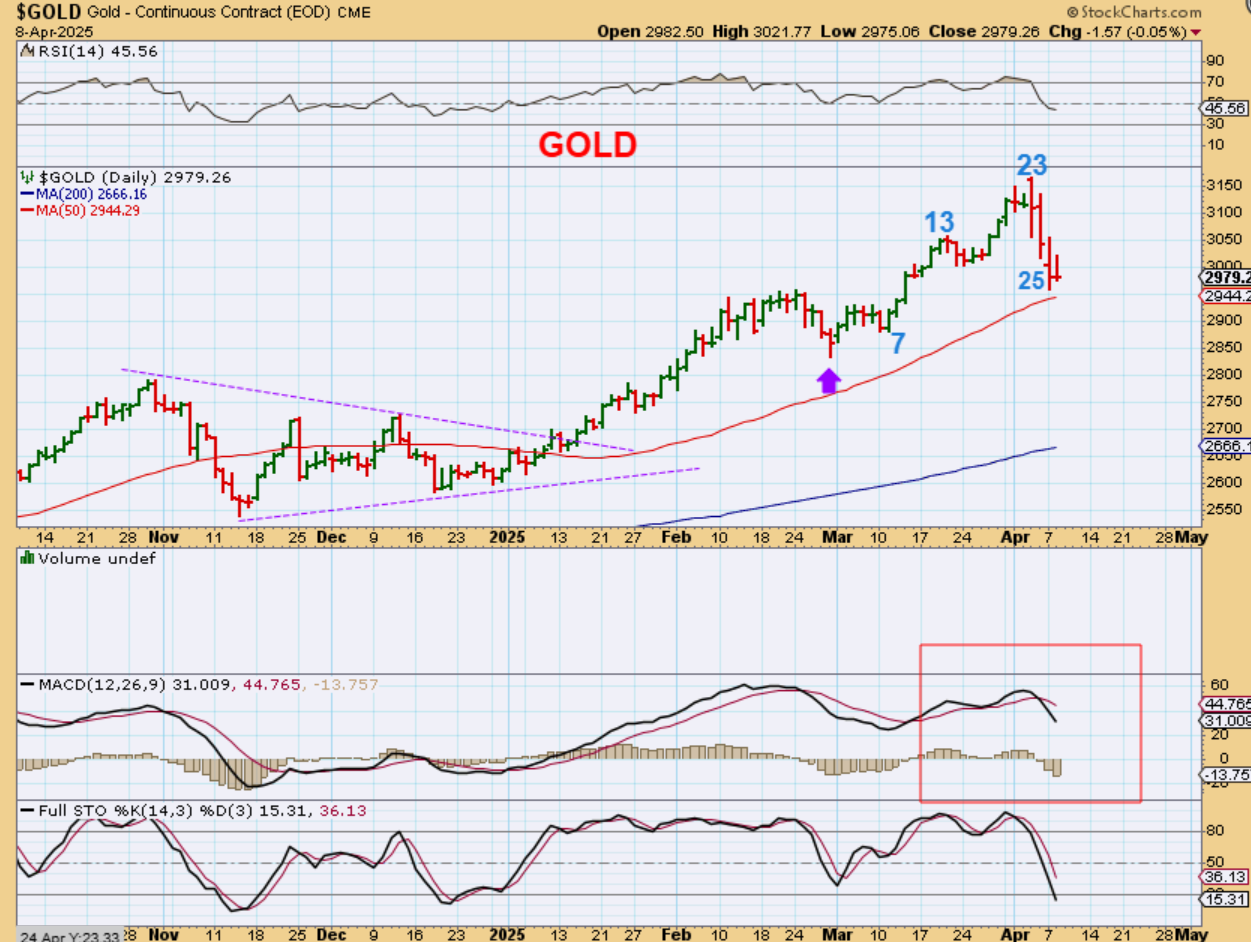
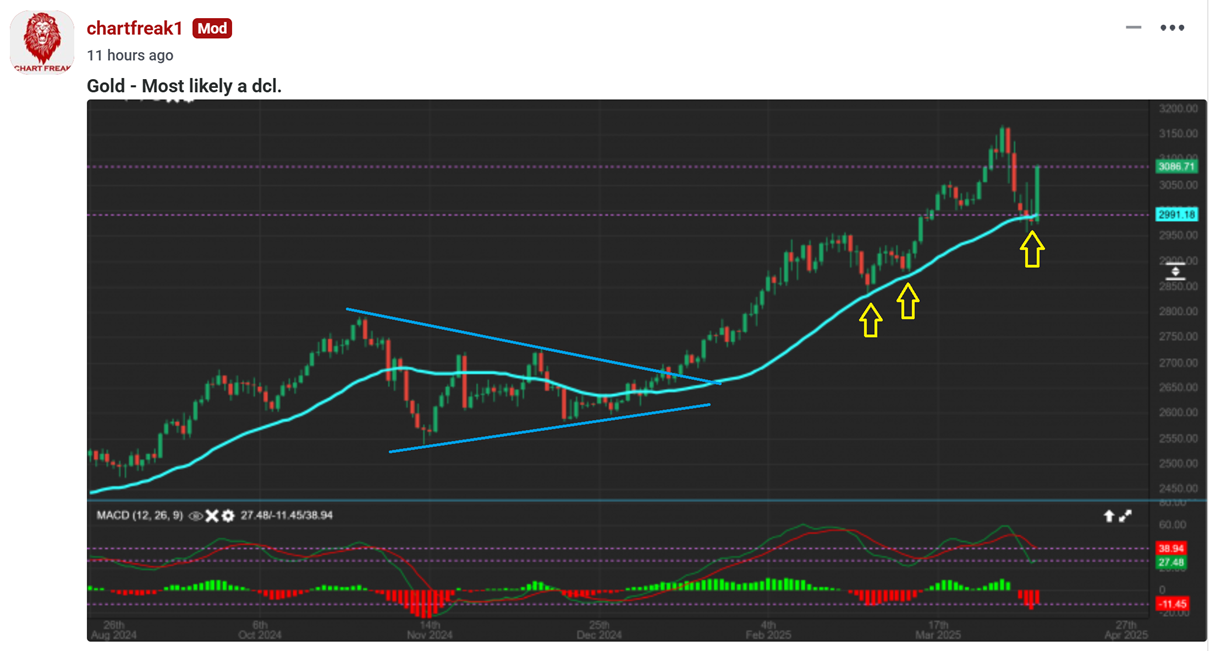
Yesterday I said that GOLD is near support, so it can bounce or even put in a dcl around this time.
.
So after saying that in the report Yesterday, I then pointed out the reversal by Gold at the support of the 34 sma area. I said that this is likely a dcl and this was before the tariff pause announcement. It was near noon.
.
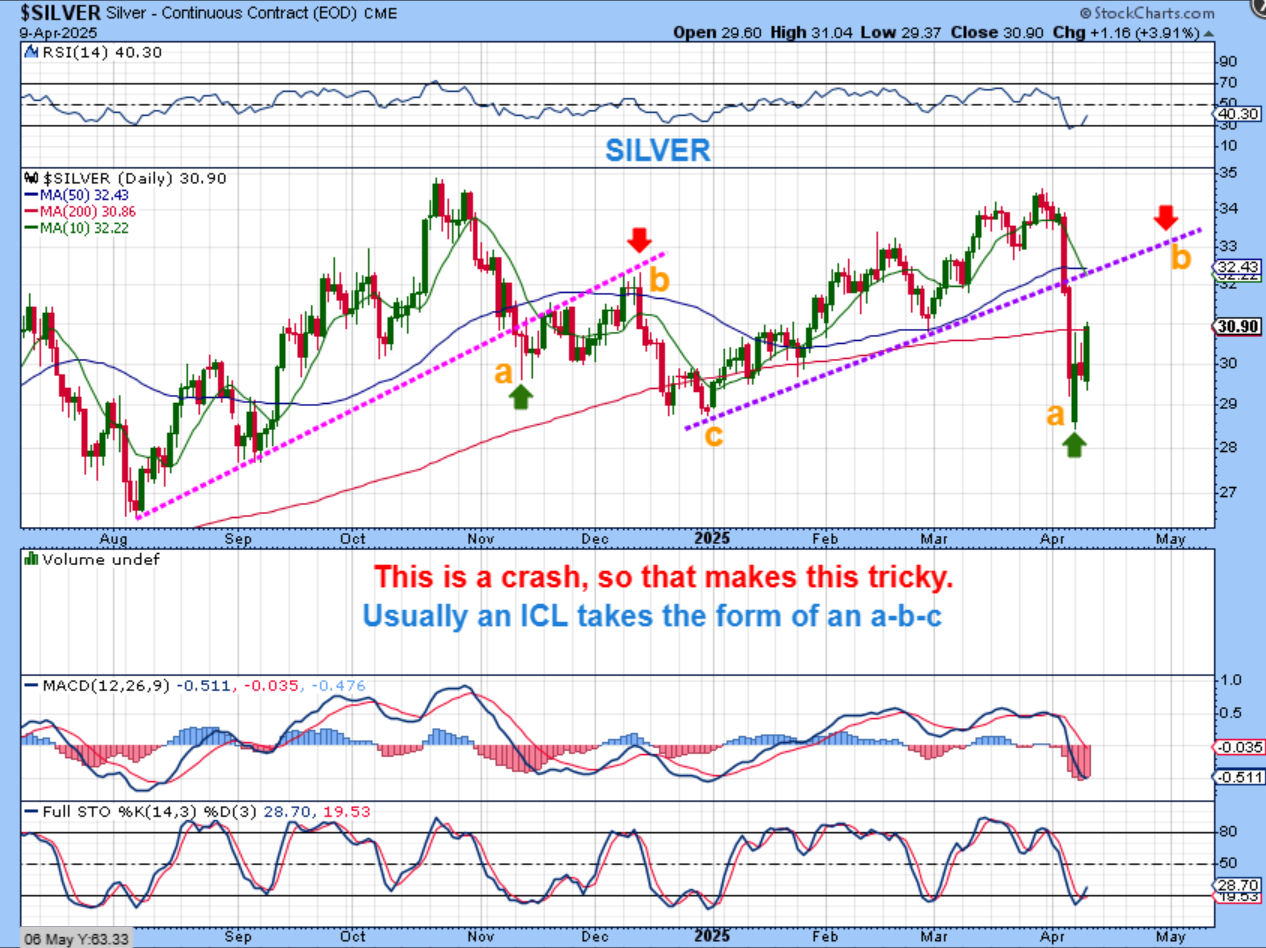
Will SILVER do the a-b-c dip into an ICL that I was predicting? Or is this drop so extreme that it exhausted the selling? It is hard to know but it can be bought and raise a stop. Yesterday I said…
.
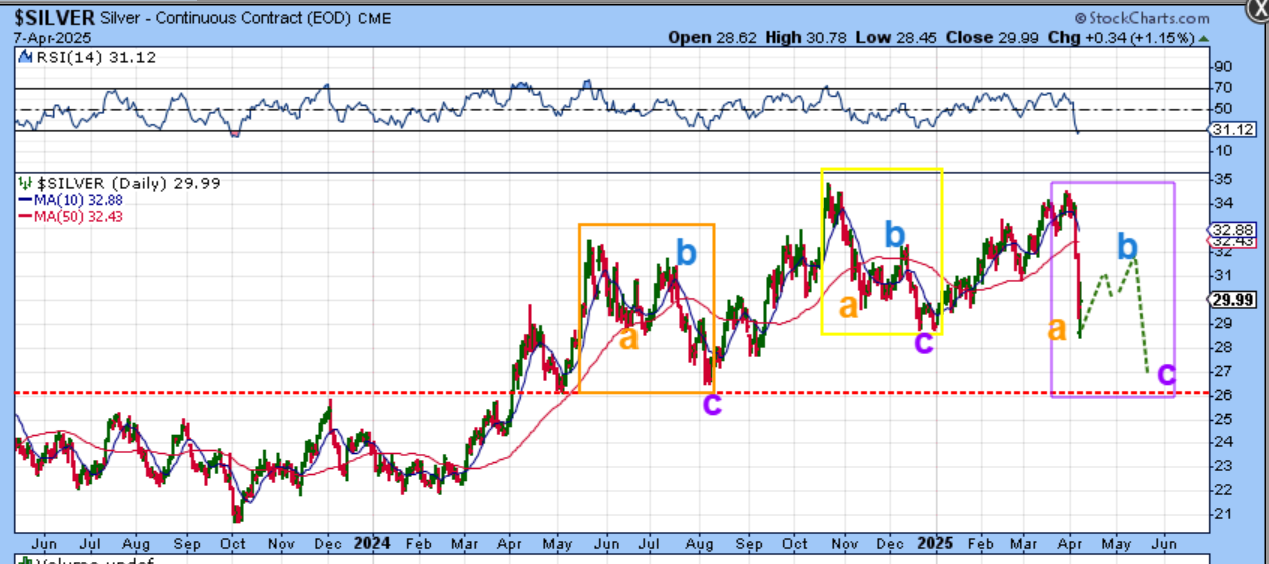
Yesterday I had these 2 charts showing that A-B-C style dip, so I will just include them again…
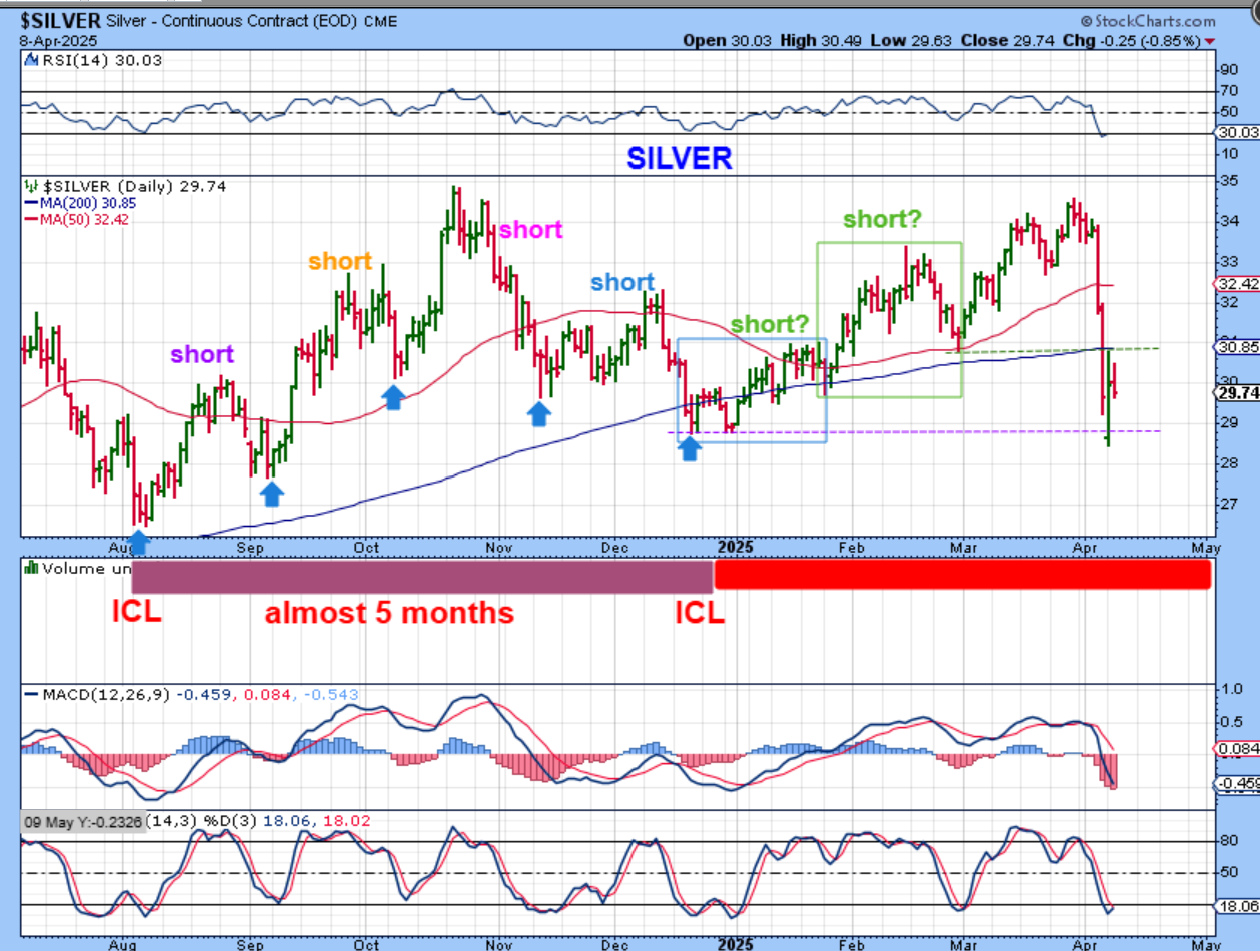
SILVER has a number of short daily cycles in the last intermediate cycle, as seen here. It lasted roughly 5 months. It may also have short daily cycles in this intermediate cycle, which is now oversold and could put in a low soon, as a dcl. The ICL may come later, and I showed that idea yesterday. The selling here was extreme and may be ‘exhausted’.
.
The ICL may come later, and I showed that idea yesterday on this chart.
.
SILVER just couldn’t hold up. I have drawn a repeating pattern with daily cycles here too. It is an A-B-C drop into the ICL. August ICL, December ICL, May ICL? I feel that this is reasonable to expect, but Aug to Dec is 5 months, and Dec to April is 5 months. I still have to think that we’ll see another bounce and drop to give us the a-b-c drop.
.
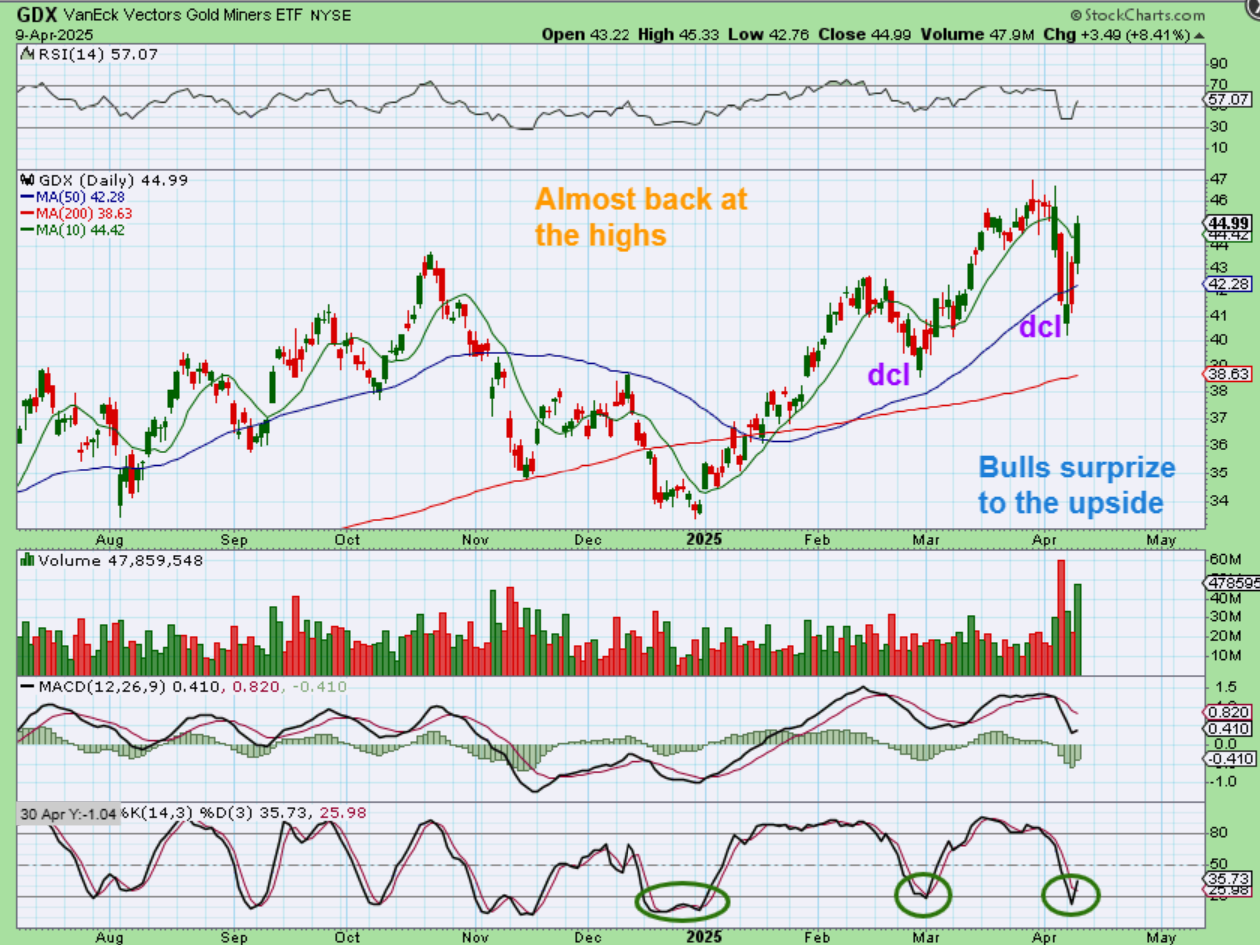
GDX was likely to dcl when Gold does, so with Golds surge, GDX also surged and we seem to have a dcl out of the crash and a shake out at the 50sma. It is still oversold.
.
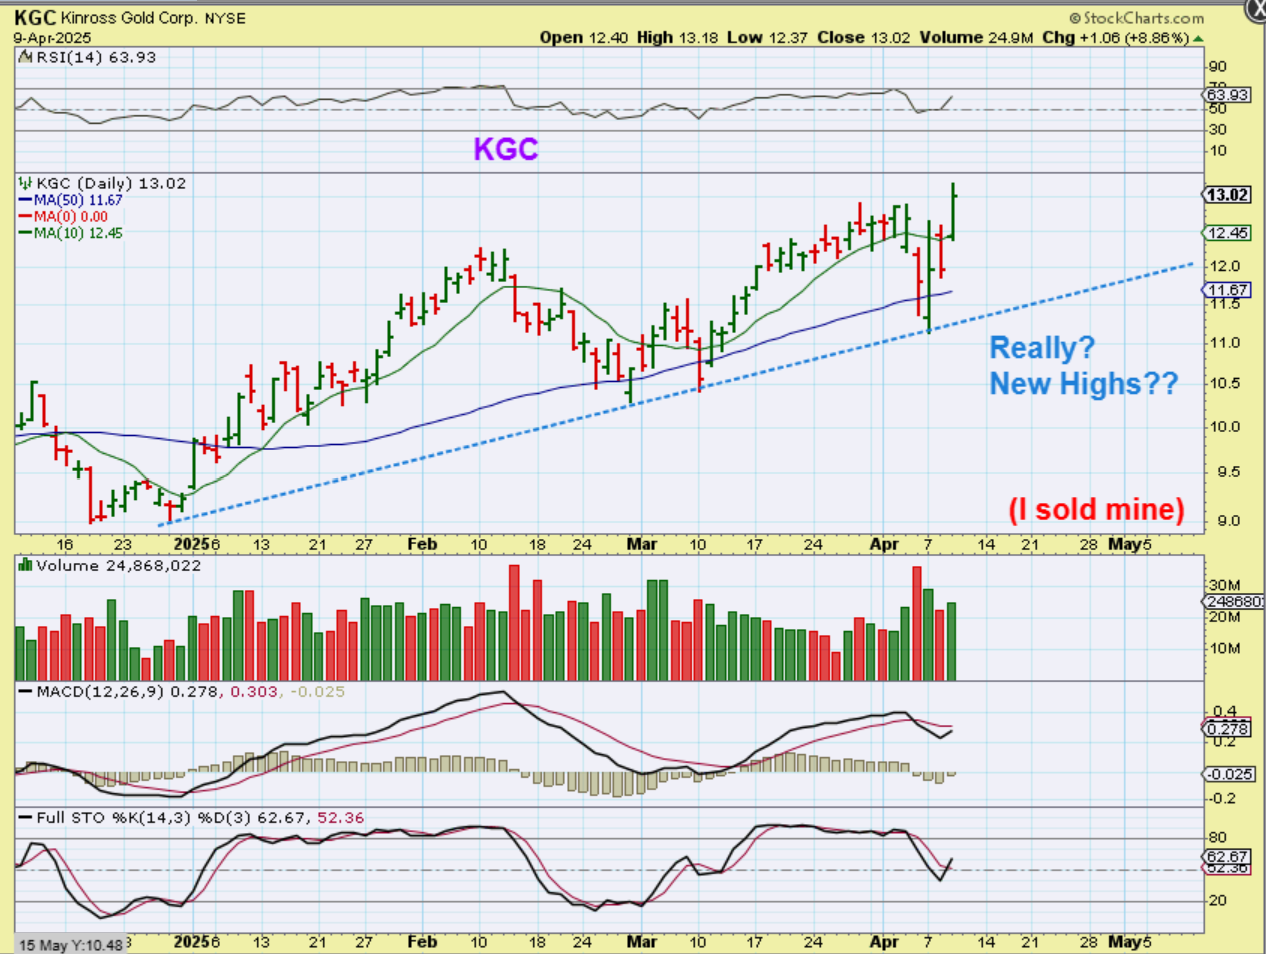
And KGC, which has been a strong Miner, is already back to new highs. I sold my Miners a little over a week ago with a dcl coming due, but I didn’t buy back. The reversal and environment were just too choppy and seemed risky.
.
So we had crashed in all sectors, obviously some areas were uglier or worse than others. The General Markets and Oil crashed sharply, Gold and Bitcoin just did a normal pull back. Bitcoin, however, made a new low an ‘failed’, so I’ll discuss that. From here the markets could rally sharply and swiftly move higher as I have mentioned in recent reports with a short covering rally – or they could do one day up and one day back, one day up and one day back, as shorts enter and try to regain control like they seemed to do Tuesday. Enjoy your Thursday trading.
.
~ALEX
.
From Yesterday:
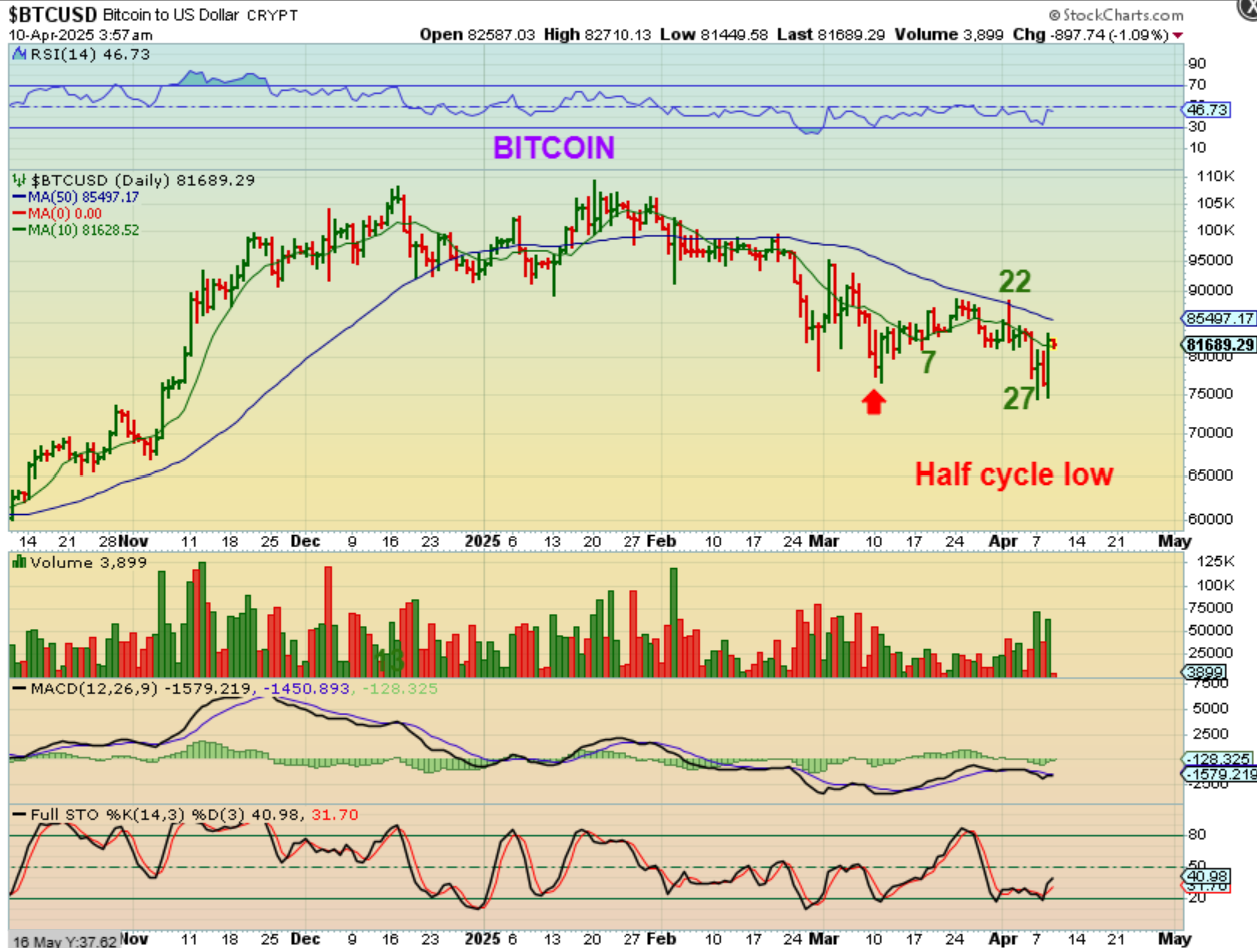
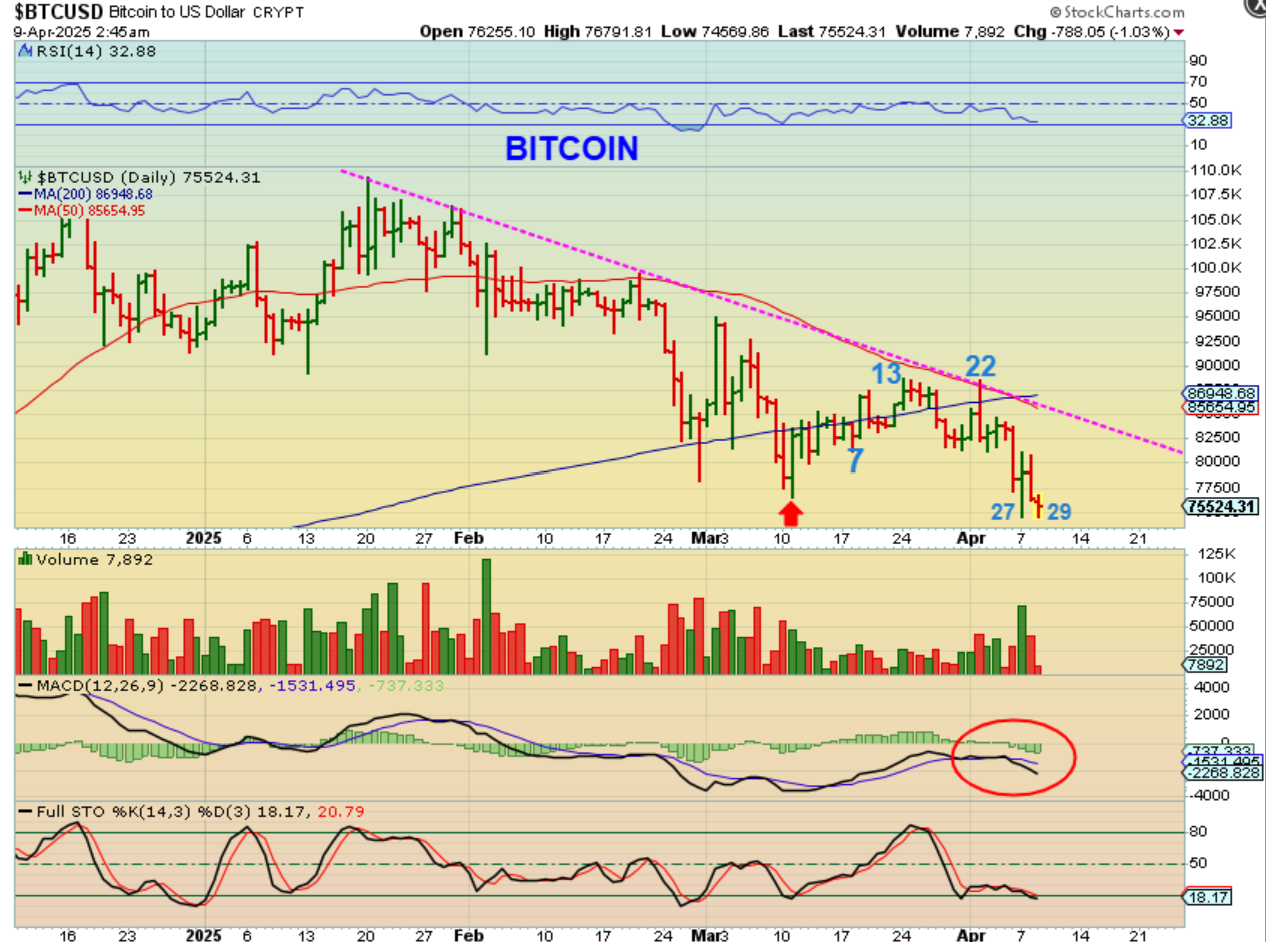
BITCOIN – As mentioned, Bitcoin broke below the last low and this has to be viewed as a failure. How high will it bounce after the 30 day low is in place? It may be a pretty good bounce, but I do not expect new highs. This might only get up to that 200sma and then crawl along it and roll over. We’ll have to wait and see. I do think that crypto stocks will bounce nicely if Bitcoin does too, so that may make for a good short term trade. We’ll see.
.
BITCOIN has that day 27 & 29 low in place that I was expecting (due around day 30) and then it surged out of that day 29 dip. Again, this broke the last low in early March and that represents a failure, so we can expect some upside, but we need to be cautious as to how much we will get.