Tuesday April 8 – More of the Big Picture View
We have been in crash mode and the moves are pretty obvious, so instead of only detailing the day to day moves, I also want to discuss the bigger picture ideas. We are in fairly uncharted territory when it comes to the number of tariffs we are seeing and the uncertainty associated with them.
1. Are they permanent?
2. Are they negotiable?
3. Will they be reduced over time? etc etc , so let’s just discuss what we see short term and long term.
.
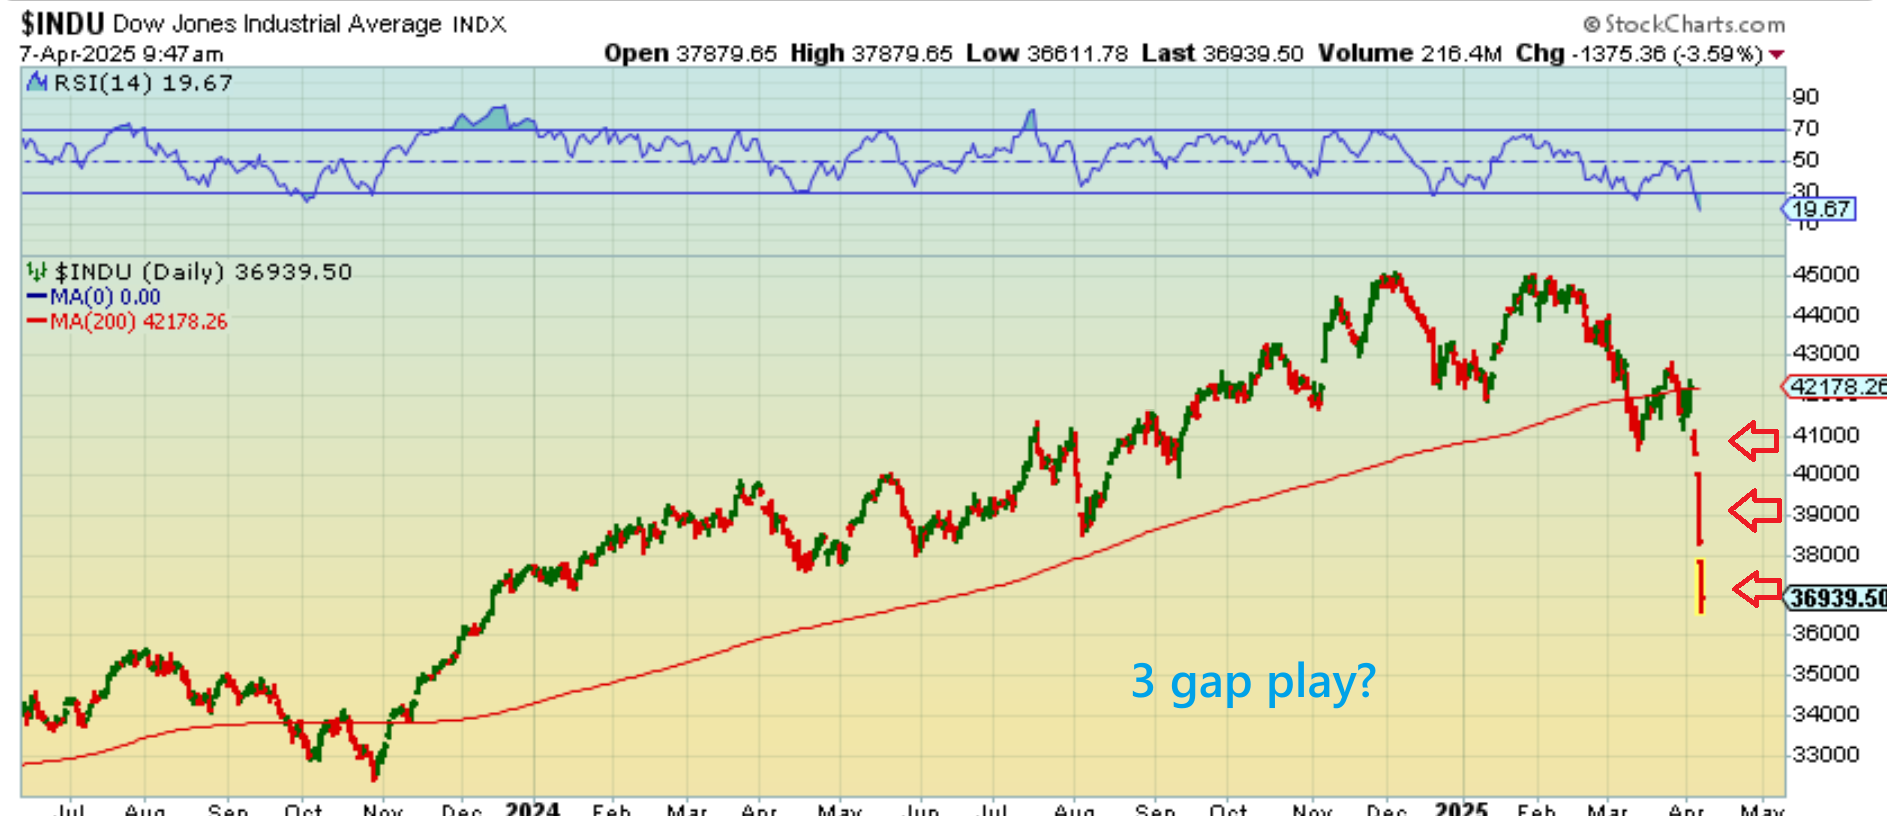
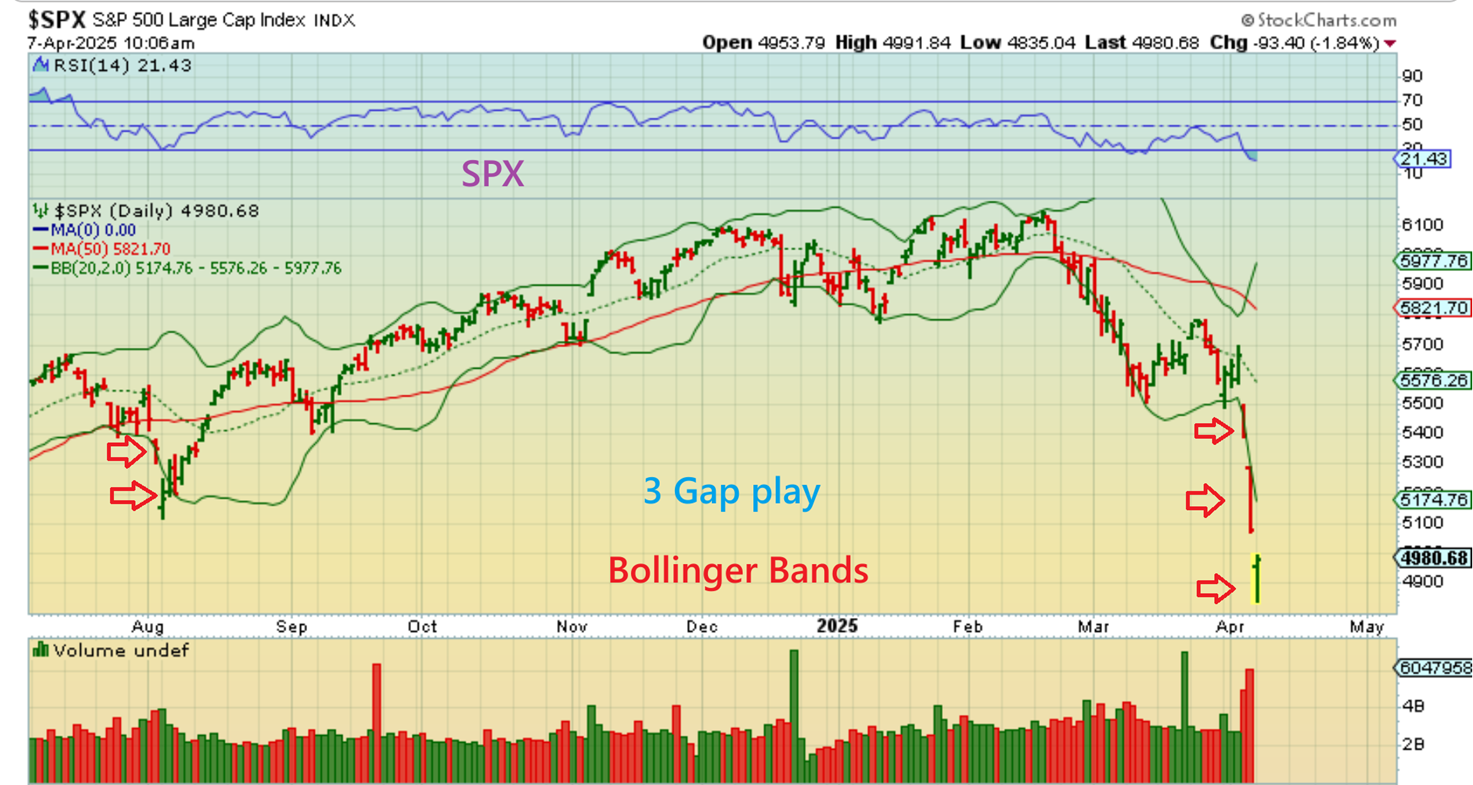
DOW- SHORT TERM OBSERVATION: Yesterday I mentioned a ‘3 gap play’ possibility. This is a technical set up that I learned of 20 years ago and I do not really hear of it often anymore. It is an ‘exhaustion play’ where you can trade contrary to the move if an extreme move gaps 3 times in either direction. 3 gaps up, you would go short for a drop. Usually at least 2 gaps fill. 3 gaps down would have you go long a reversal with a stop.
.
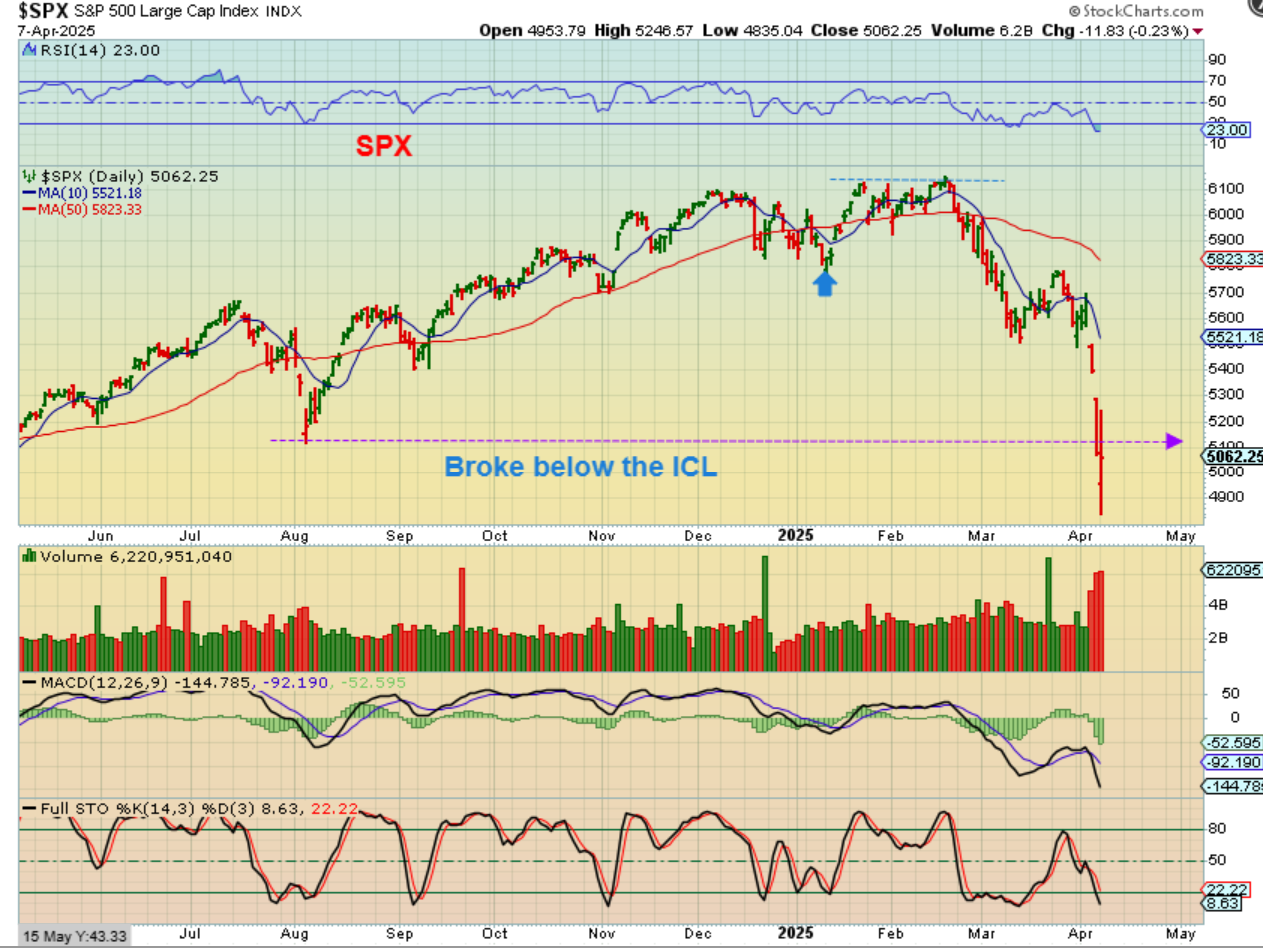
SPX – There was a time when the blue arrow was thought to be an ICL and then the SPX made a slight new high and rolled over. THAT would be a failure in the first daily cycle and would mean that we could have 3,4, maybe 5 daily cycles down. IF THAT WERE TRUE…this crash is only starting and is extremely harsh. We’d have a first daily cycle crash and this is the 2nd of lets say 4 daily cycles. IF THAT WERE THE CASE, YOU WOULD SELL THE BOUNCE. I didn’t stick with this idea, because the Nasdaq, Dow, IWM, SOXX looked different and did not break to new highs. They looked to be dropping into an ICL, so I took that view…
.
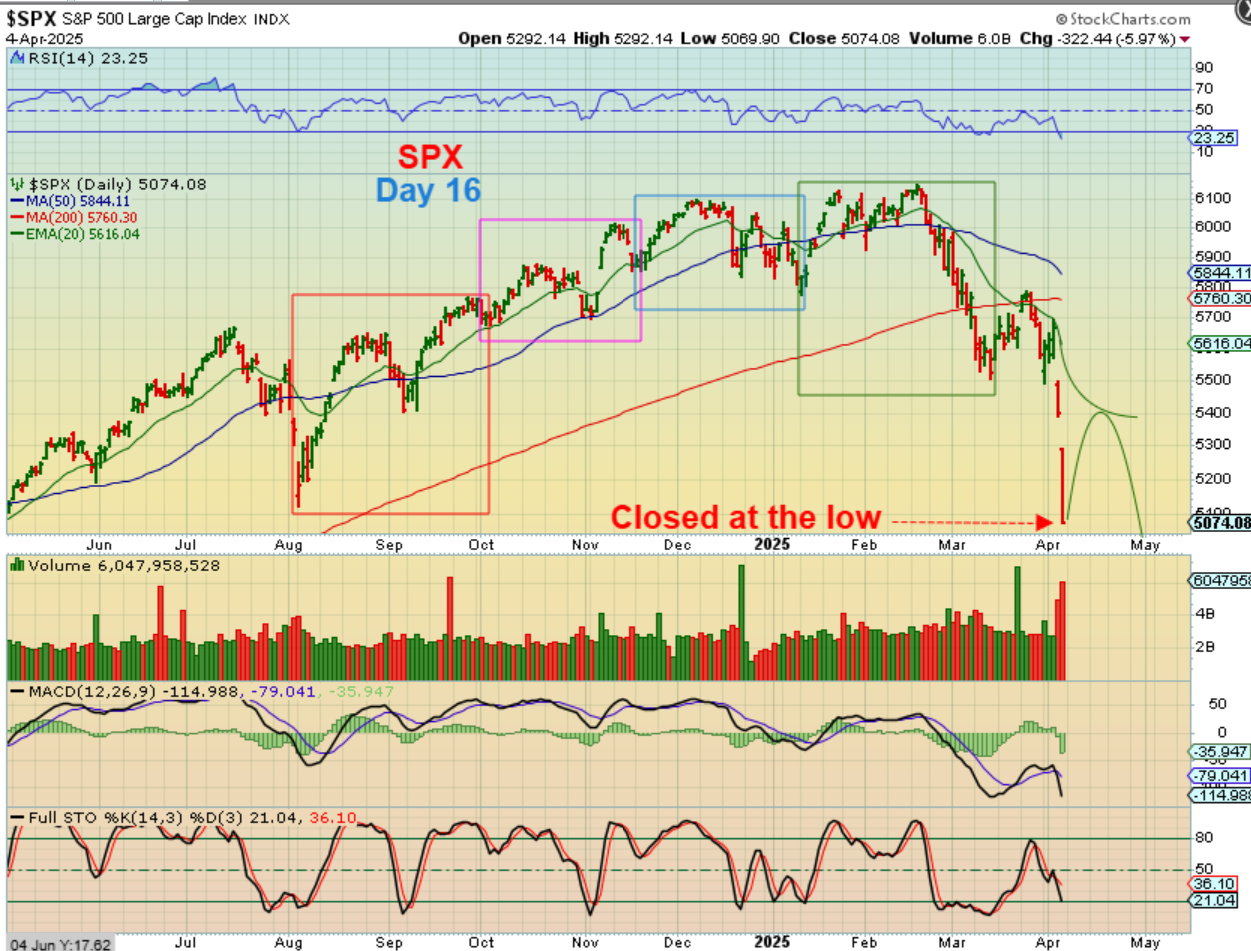
This is the view that I preferred:
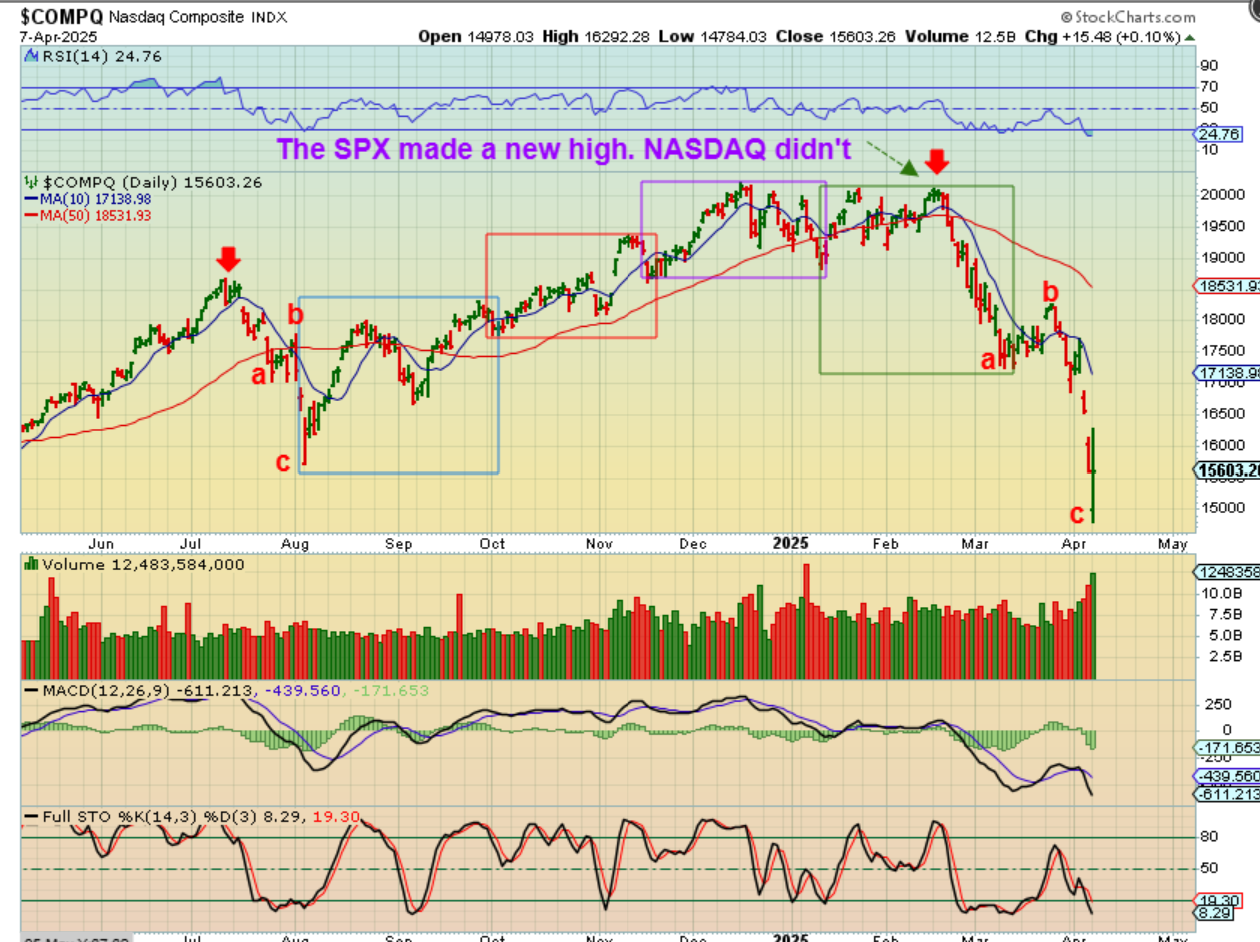
THE NASDAQ looked like 3 daily cycles up (boxes), and then a drop into the ICL with a 4th and 5th daily cycle, which would be a-b-c down. Similar to the a-b-c in July. IF THIS IS CORRECT, this would be a drop into an ICL right now and…
.
IF THIS IS CORRECT, we may have an ICL developing in this daily cycle. Then the next question would be.
“Is this ICL going to lead to the Bull Run resuming again? Or will the next IC lead to a recession and weak choppy daily cycles?”
So even with THE SPX, it is hard to believe that this is only the start of the 2nd daily cycle. If that is the case, this is going to drop with 2 more daily cycles and it is already in a cascade lower crash mode. Due to that, I am going to look at this as a possible ICL and I would go long and raise stops. One problem? This is only day 17. I DID point out that daily cycle that was only day 18 in 2023, but for now you just have to be cautious. We are in crash mode and everything that happens seems to cause strong selling. This could bounce and drop to a slightly lower low, right? I showed that in the weekend report.
.
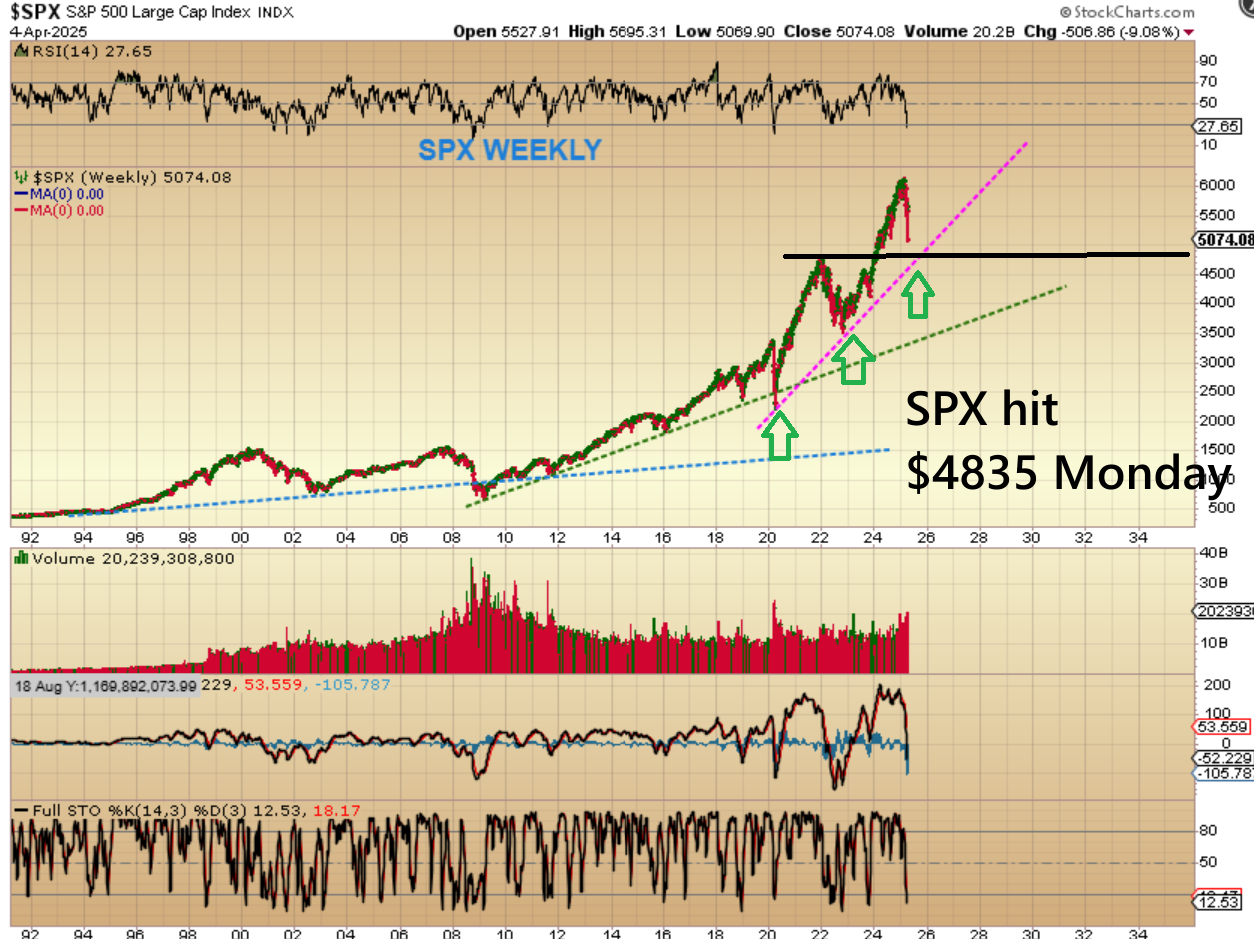
I SHOWED THAT IN THE WEEKEND REPORT WITH THIS CHART
After a bounce, we have ‘time’ in the daily cycle for another slight new low. ALSO …
.
I drew this in the weekend report and on Monday we dropped even lower (to $4835), so we would likely be at the trendline area with the next bounce and slightly lower low. We could even be considered to be there now.
,
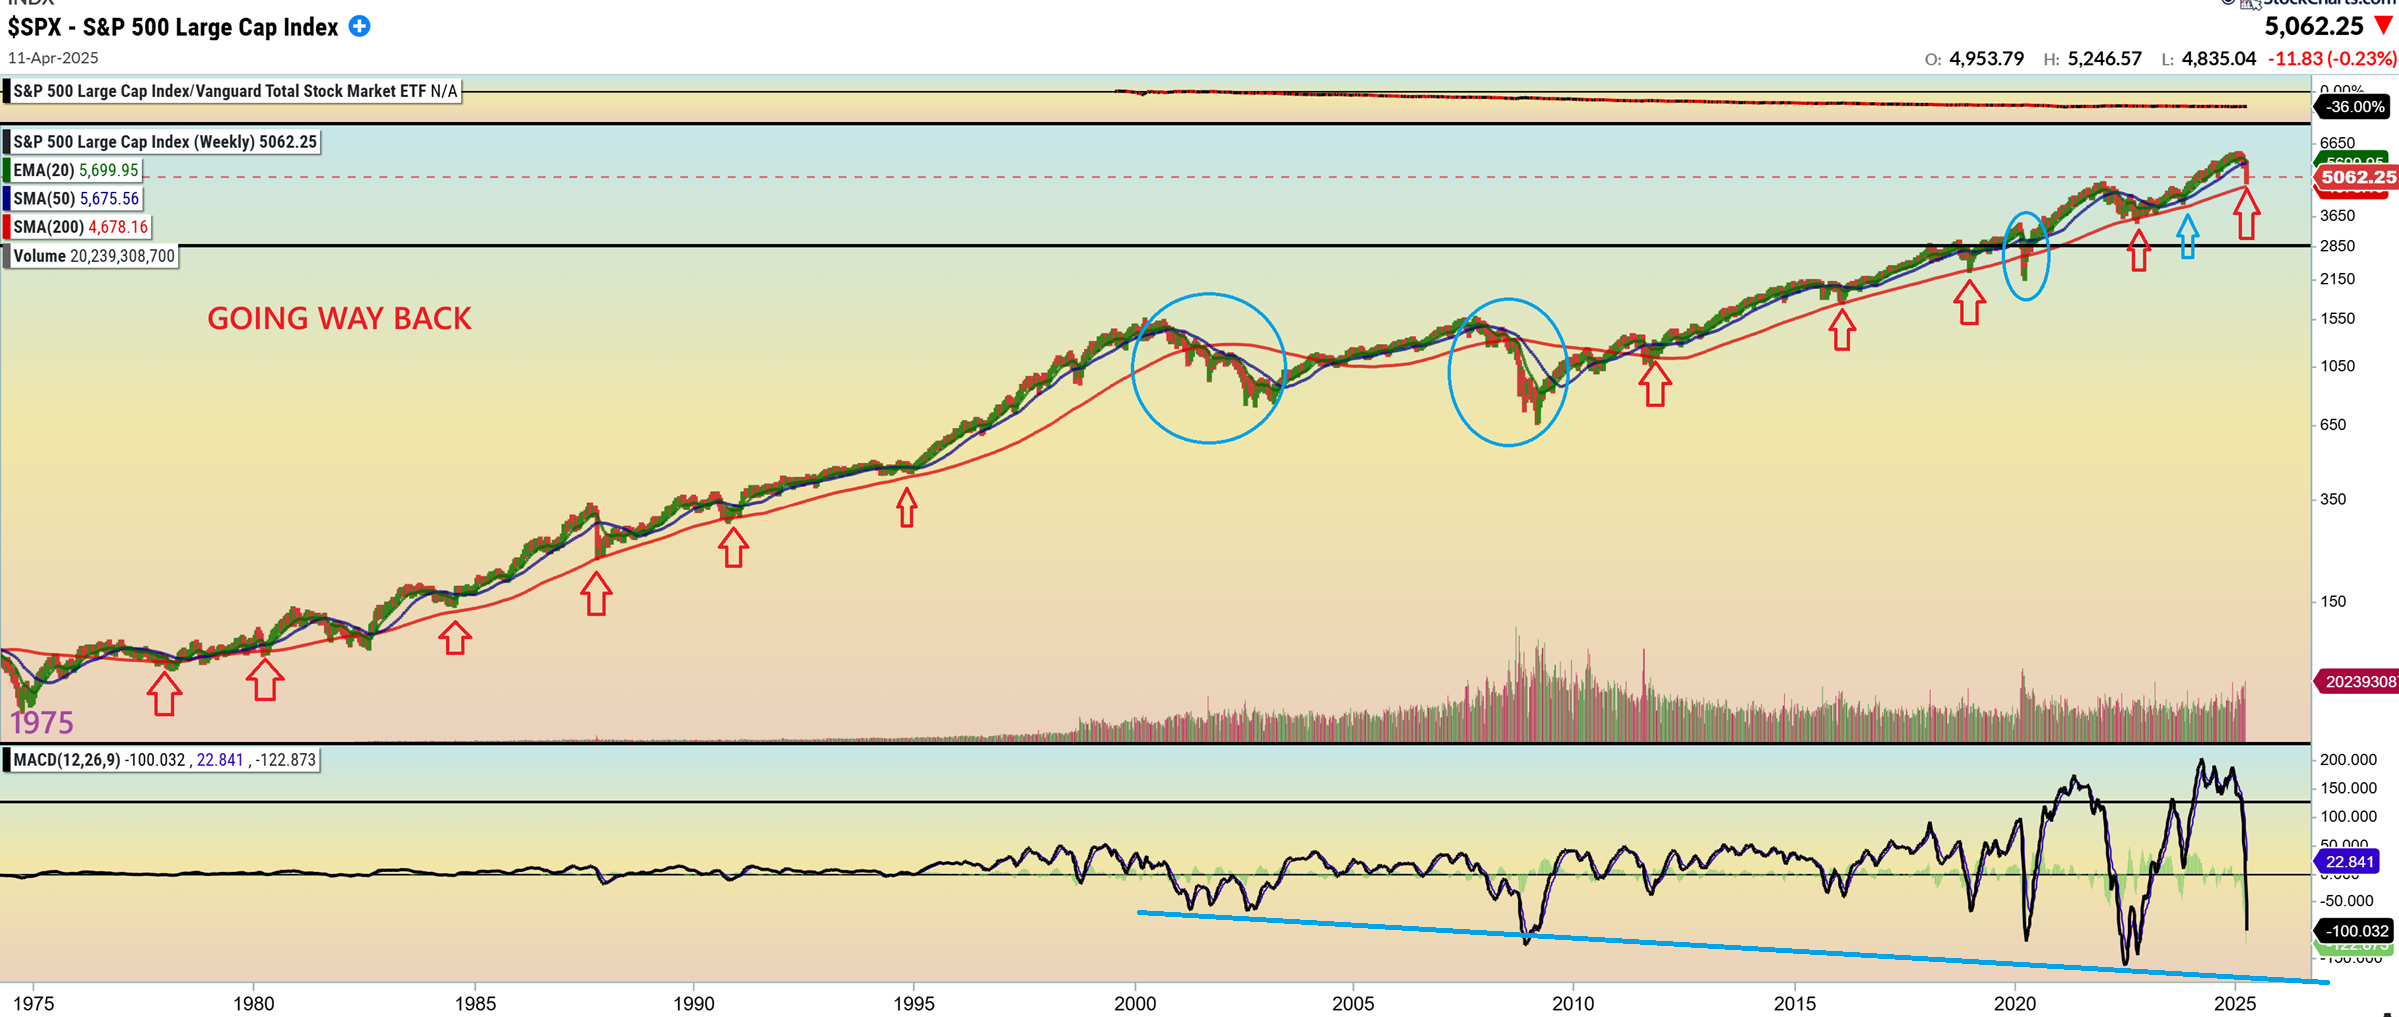
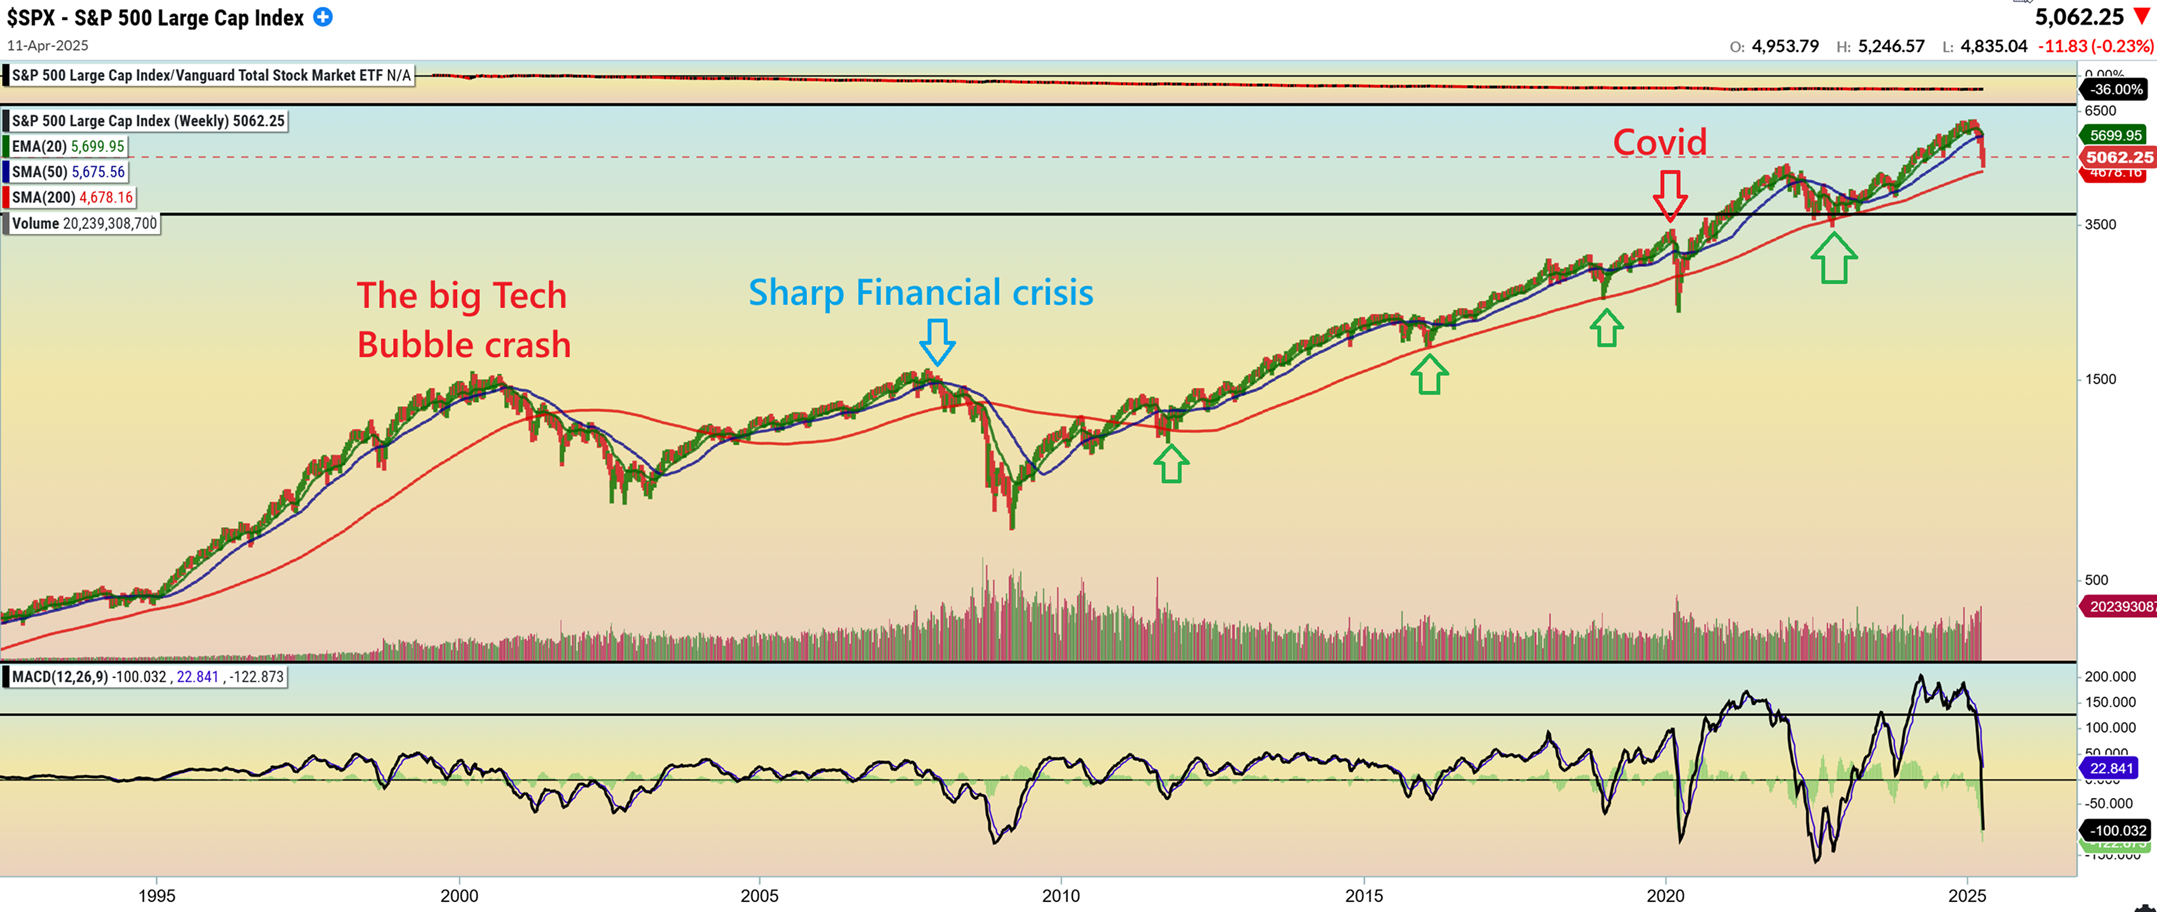
Let’s look at the BIG PICTURE:
This is The SPX back to 1975. Notice: Sharp drops quite often landed on the red 200 week ma. We are there now. Blue circles are the rare times when we collapse even further for longer periods of time. What will this be with the ‘tariff wars’, possible recession, etc? It remains to be seen, right? I will zoom in, so you can see this better…
,
SPX WEEKLY – You can see the red 200 week ma has acted as support after several sharp crashes, and we are there now or after a bounce and 1 more slight new low to end the daily cycle. Covid, The 2008 crisis, and the Tech Bubble bursting crashed below the 200week ma. What about the current U.S. Administration? This shows you how ugly it Could get. We’ll see.
..
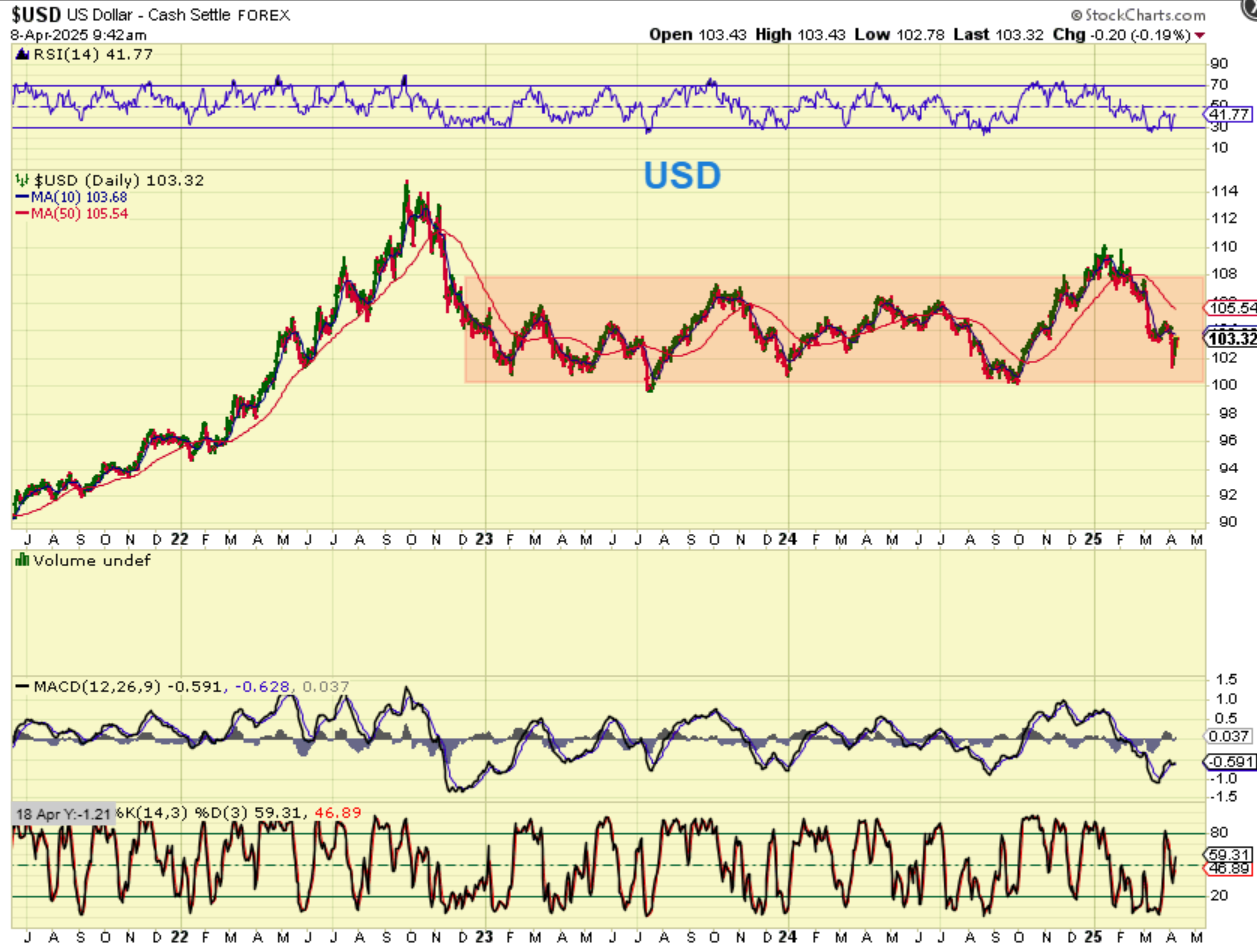
THE USD dropped and bounced yesterday too.
.
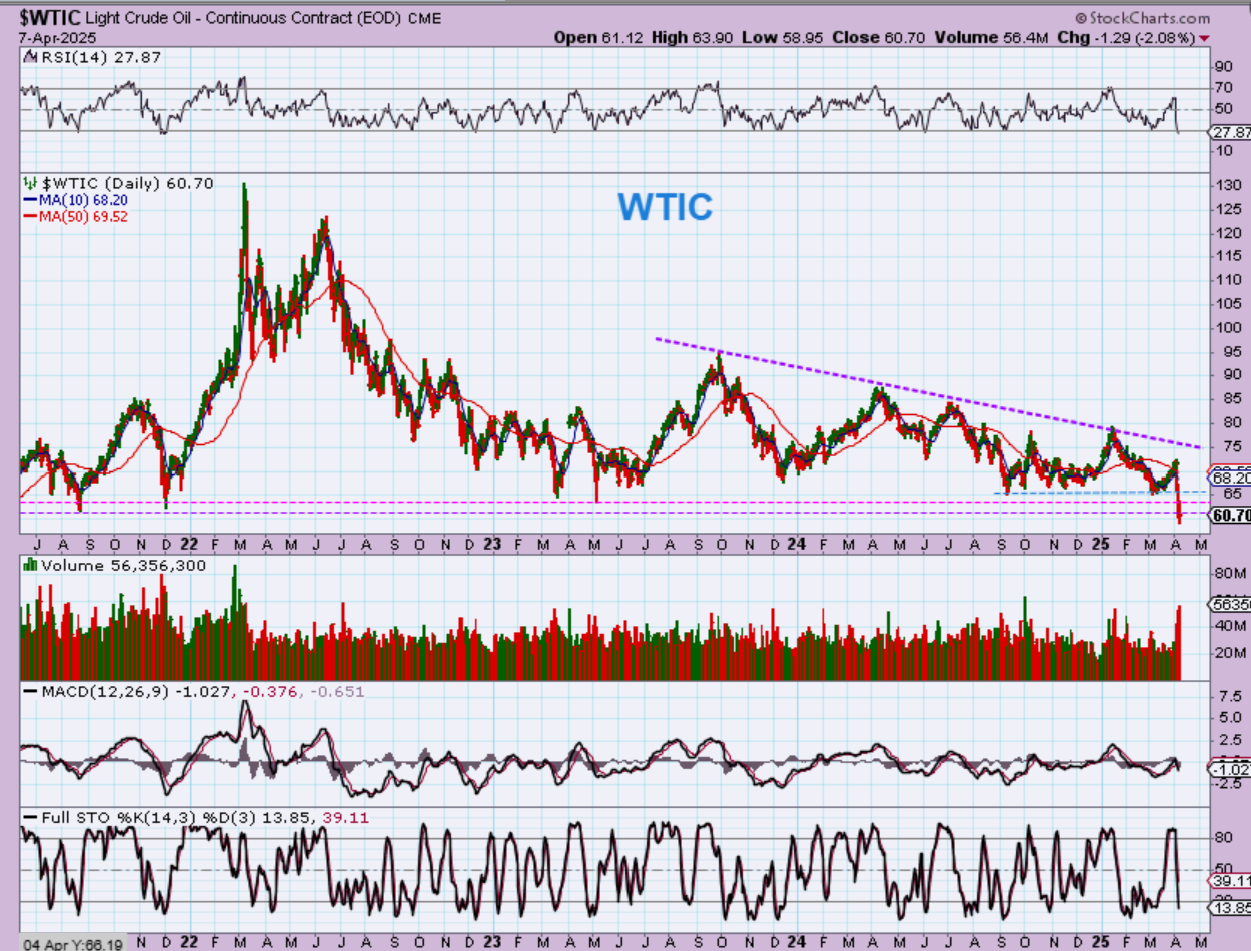
WTIC – Oil closed down another 2%, but it was down more. It bounced too.
.
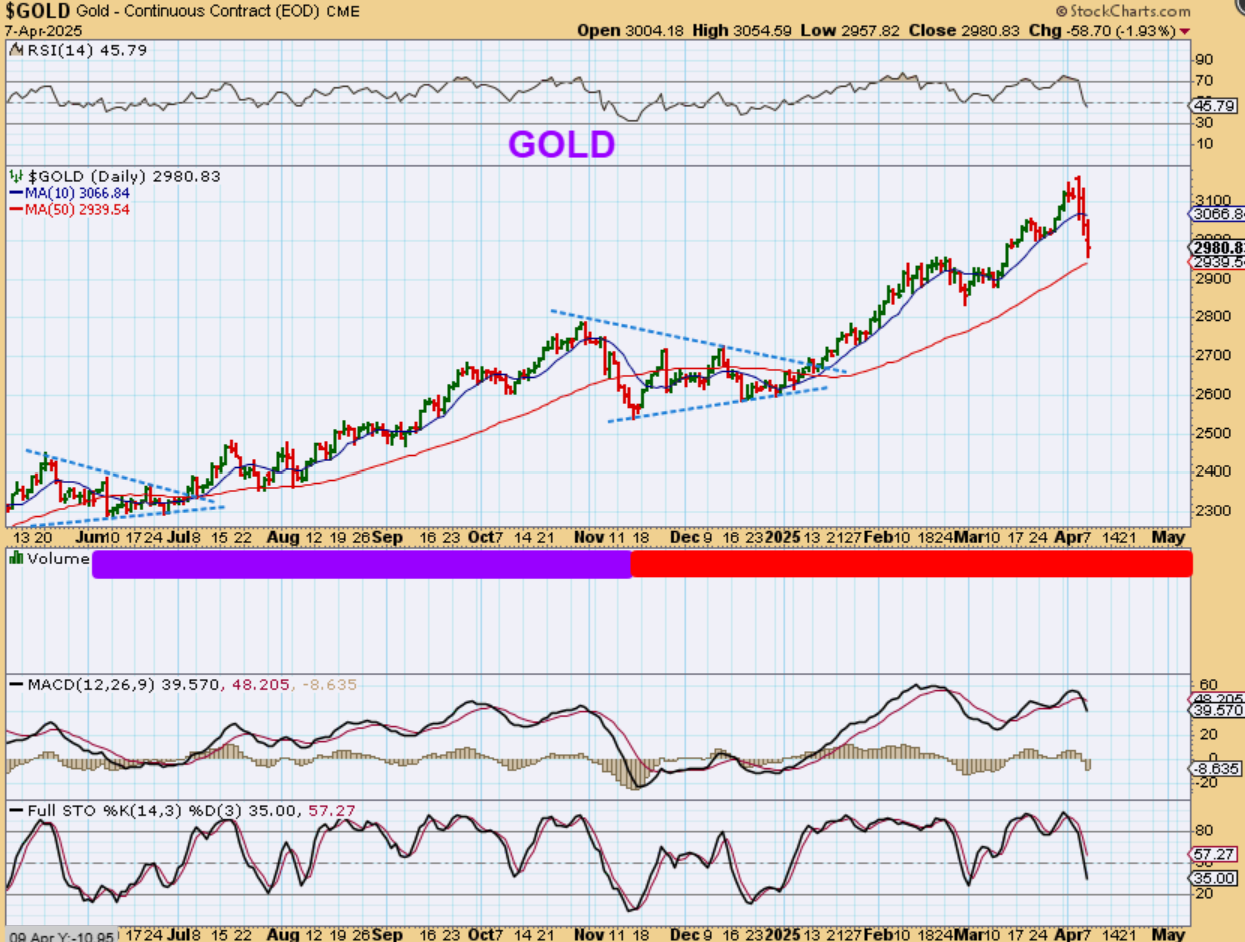
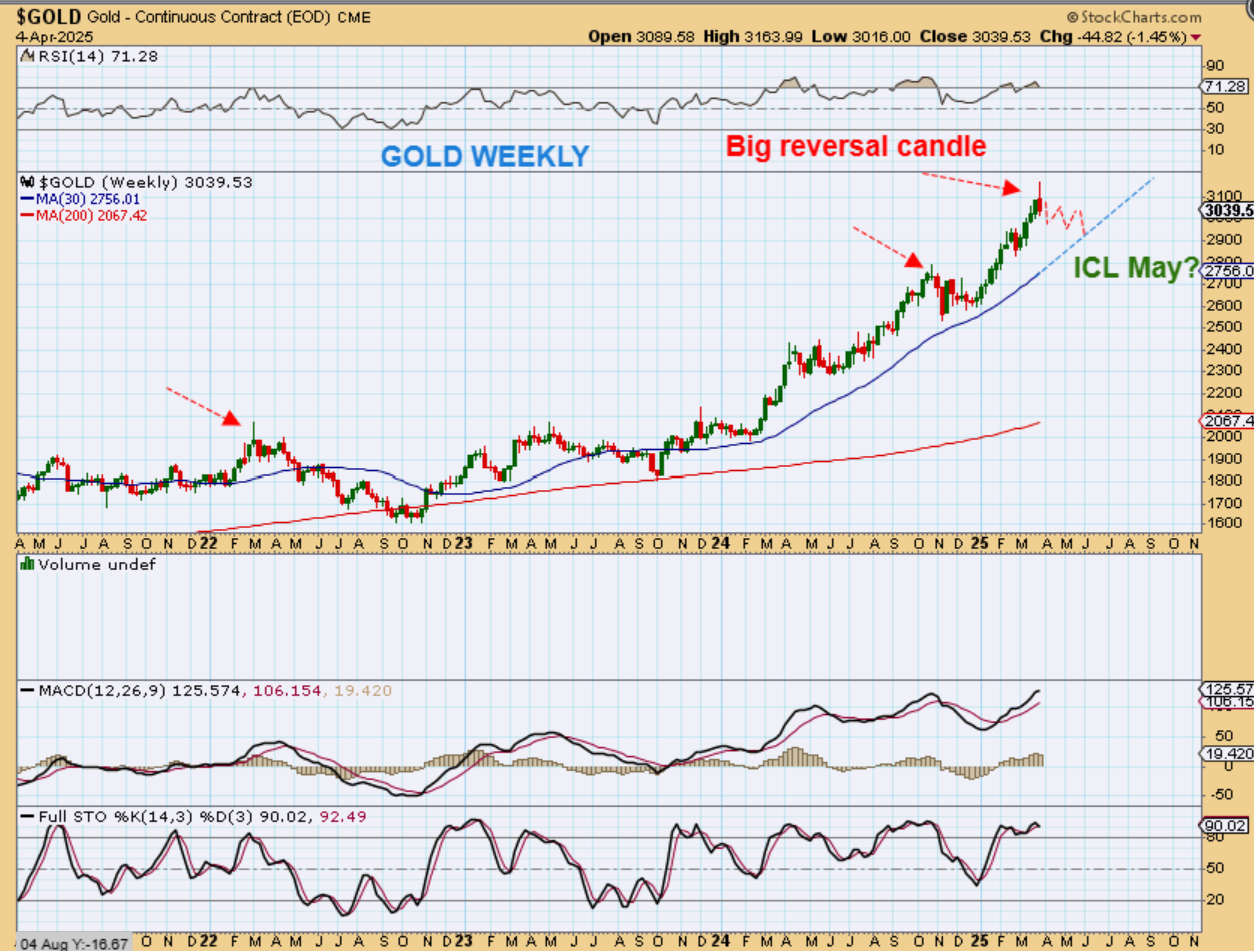
GOLD should be viewed differently. It has been in a strong bull run, but it is due for a dip into a dcl and an ICL. That ICL could come in May, and will make this sector a buy area. The last 2 ICLs can be seen here. The drop was sharp at the start and then it chopped and formed triangles or wedges. We may see that repeat with this sharp drop.
.
In the weekend report I said that we could expect this with Gold. Gold is a strong bull market and may only correct as drawn here. It could ICL in May?
,
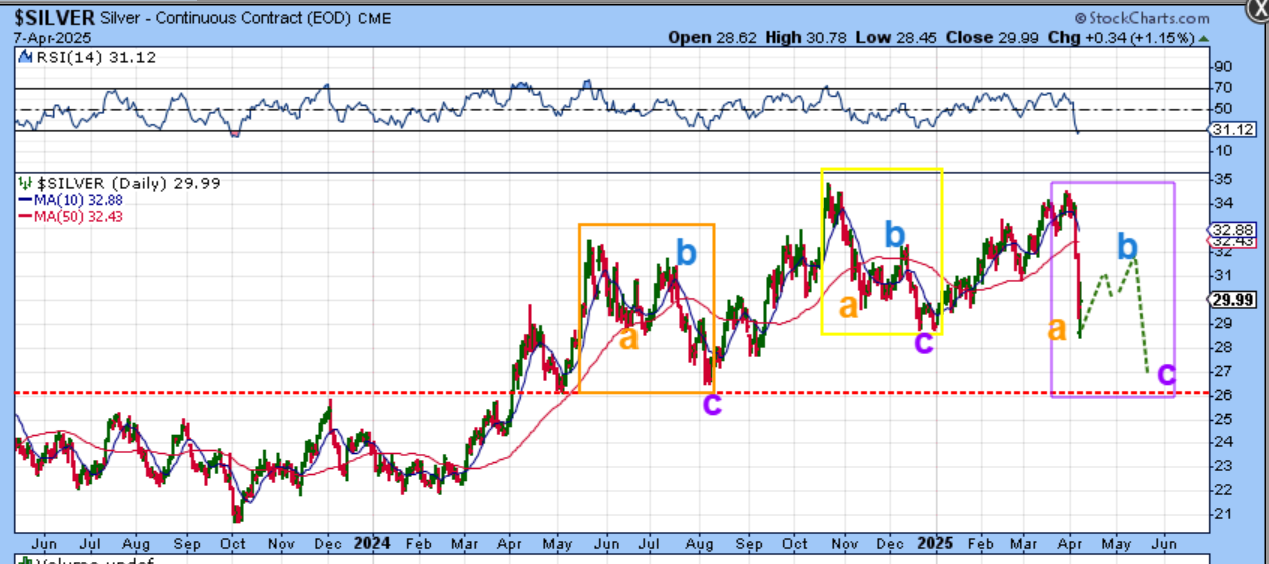
SILVER just couldn’t hold up. I have drawn a repeating pattern with daily cycles here too. It is an A-B-C drop into the ICL. August ICL, December ICL, May ICL? I feel that this is reasonable to expect, but Aug to Dec is 5 months, and Dec to April is 5 months. I still have to think that we’ll see another bounce and drop to give us the a-b-c drop.
.
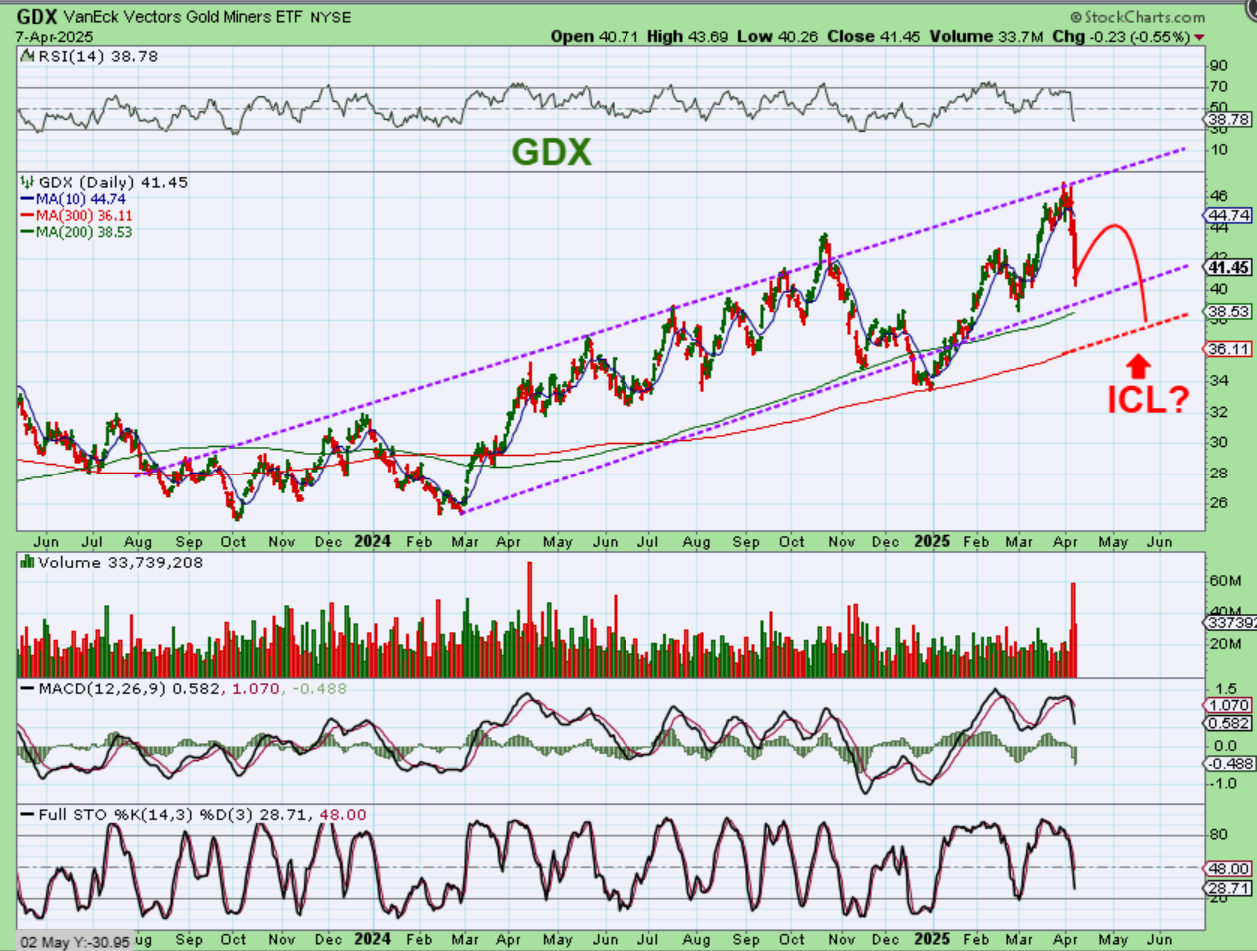
GDX did have a good run December to March, but it just crashed down too. A-B-C would give us a possible dip to the purple trend line, the green 200 sma, or the Red 300 sma that it tagged in December. Some sold closer to the top already, some may try to sell the bounce, others may just ride the bull and hold these as long term trades that they took back in 2023. Miners are always a tough ride, but it has been making higher highs over time.
.
We’ve been in crash mode, but there are usually bounces along the way and we also would have DCLs and even ICLs developing over time. My analysis will be focusing on the bounces when they come and trying to discern whether we have more downside with a recession this year (?), or did this cleanse the markets of a little excess?
2 things come to mind: Some that lightened up may want to buy and trade the bounces with stops in place, in case we form an ICL and recover from here. Others may actually think about lightening up on a weaker bounce in longer term charts, just in case we enter a recession, and the markets crash like 2008. They may wish to try to buy back into AAPL, MSFT, AMZN, NVDA, etc. at a lower price point. Another area that is important to cover is Bitcoin, because over the weekend it made a new low, so I’ll cover that below. Have a good day!
.
~ALEX
.
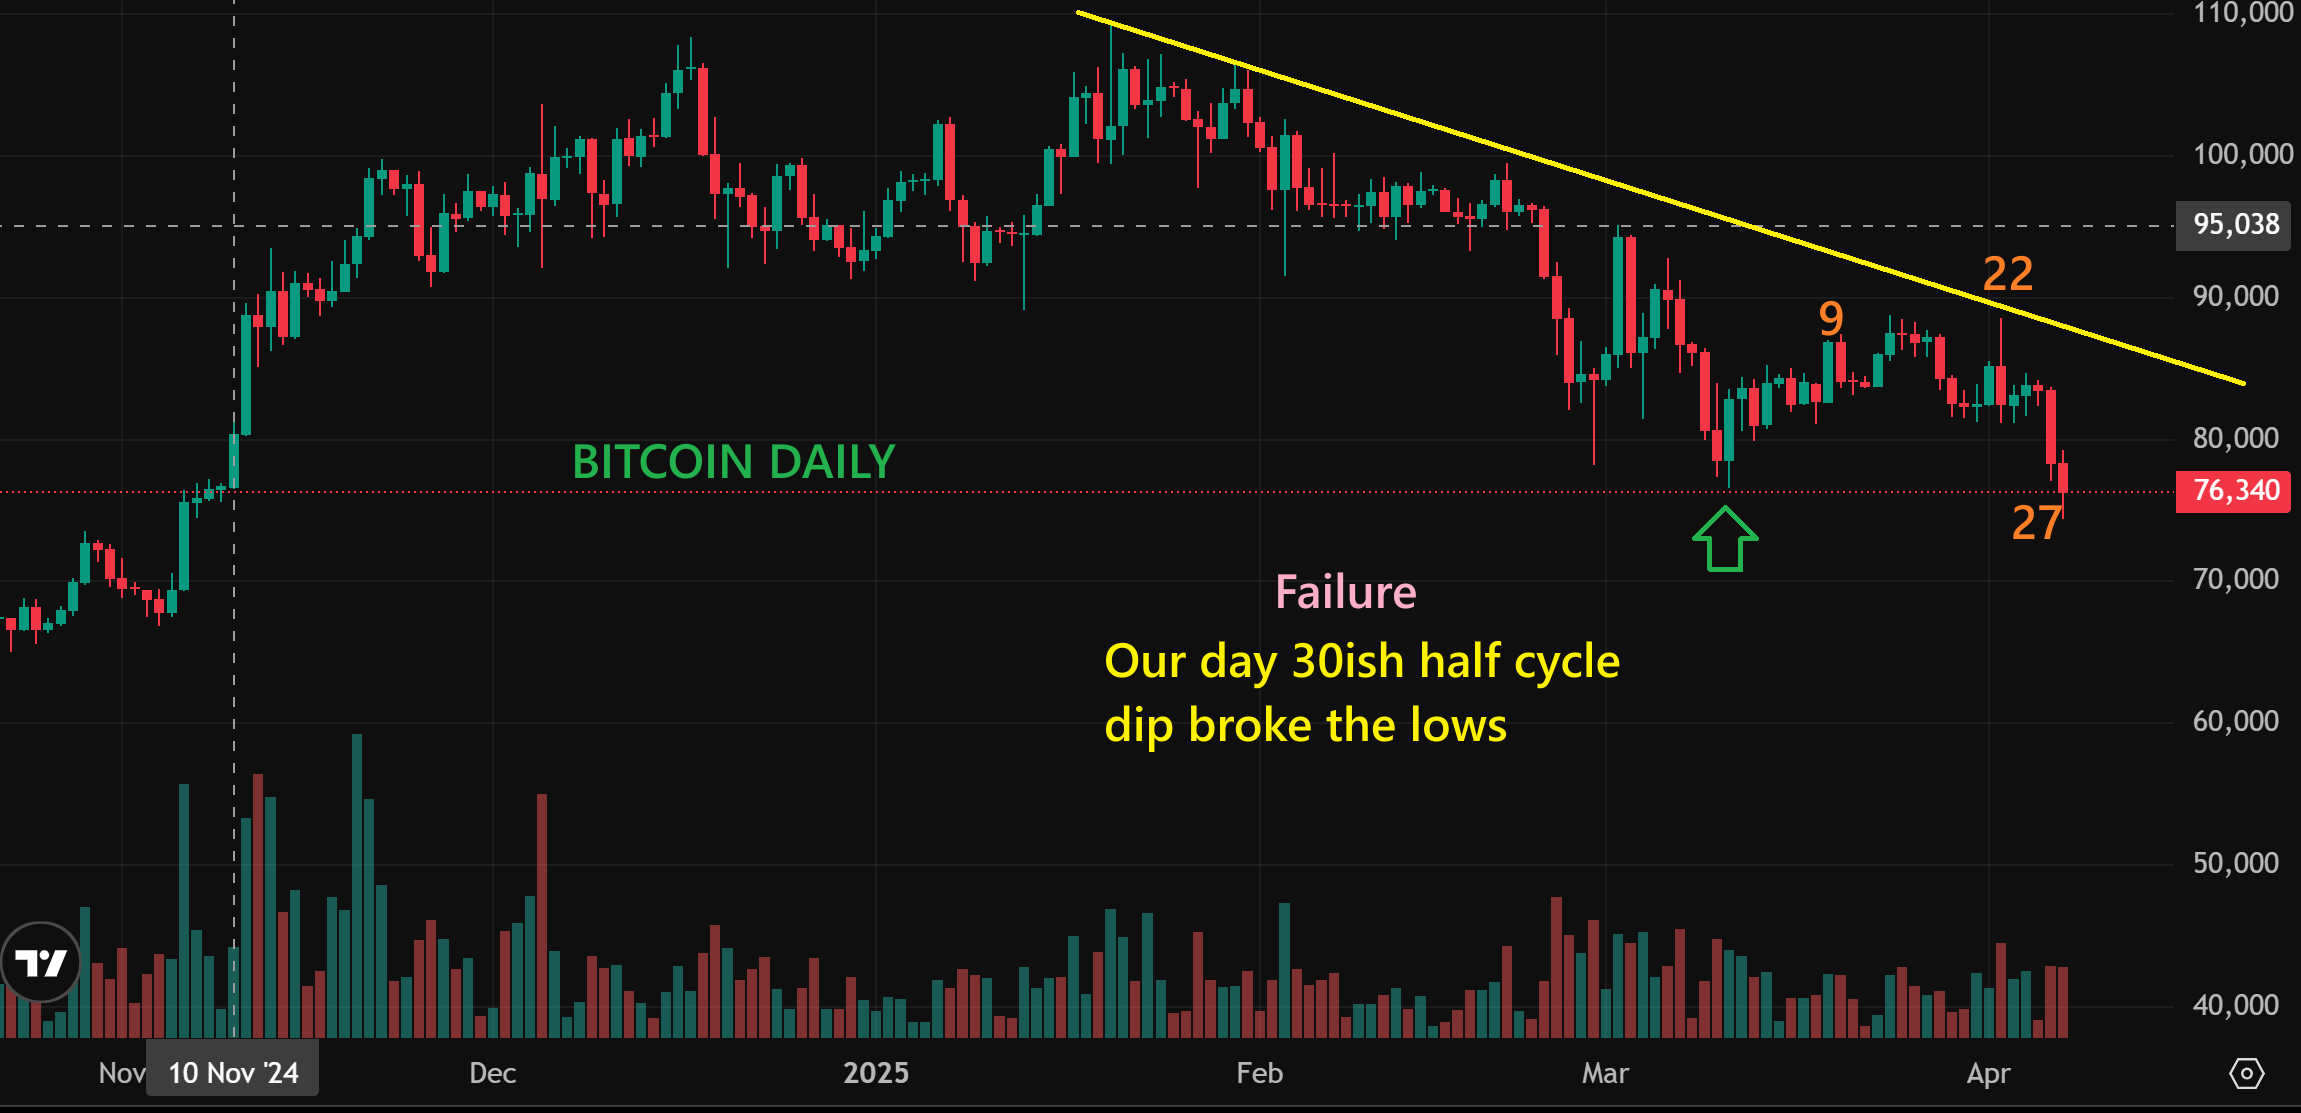
BITCOIN did what I was hoping it would not do. Bitcoin broke to a new low and this should only be a half cycle dip. That is a failure and it means that the next bounce should not rally us to that 120,000 area. As a failed daily cycle on day 27, we could begin to bounce at any time, but the move should continue to be a weaker bounce. Bitcoin may remain choppy, and then it can roll over. When Bitcoin rolls over, you do NOT want to get in the way. I’ll discuss that more over time.