April 5th – Weekend Report ‘The Long Term Outlook’
This week we saw some very heavy selling come in, and it finally affected the Precious Metals sector. In some areas it did look like ‘capitulation ‘ selling with high volume, so a bounce may come in next week. In other areas, like with Oil, we also got that break down that I have been calling for, but it is not oversold, so we’ll discuss that too. And through all of that, Bitcoin and the Crypto stocks took on an interesting look. Let’s discuss what we have and what we could see going forward…
.
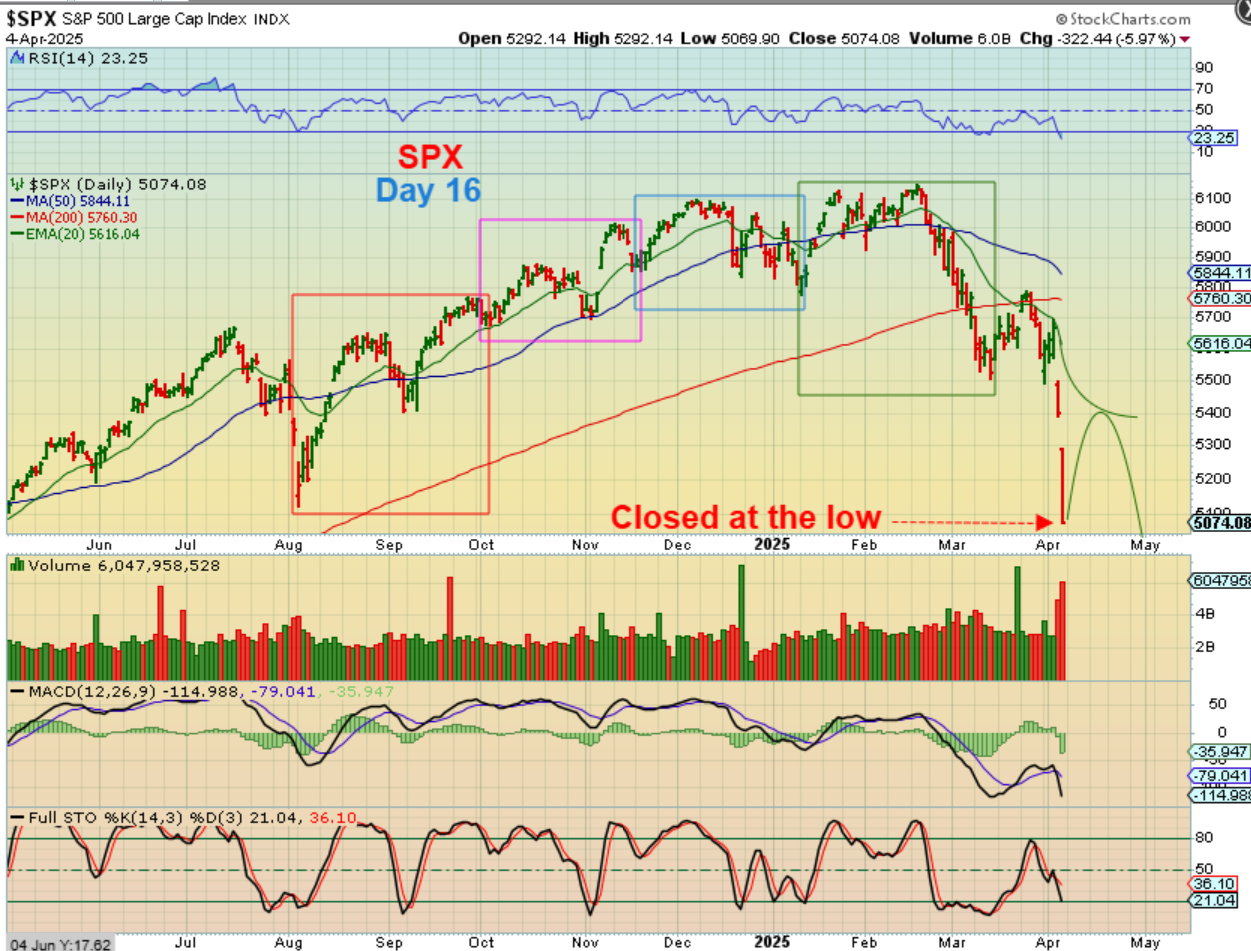
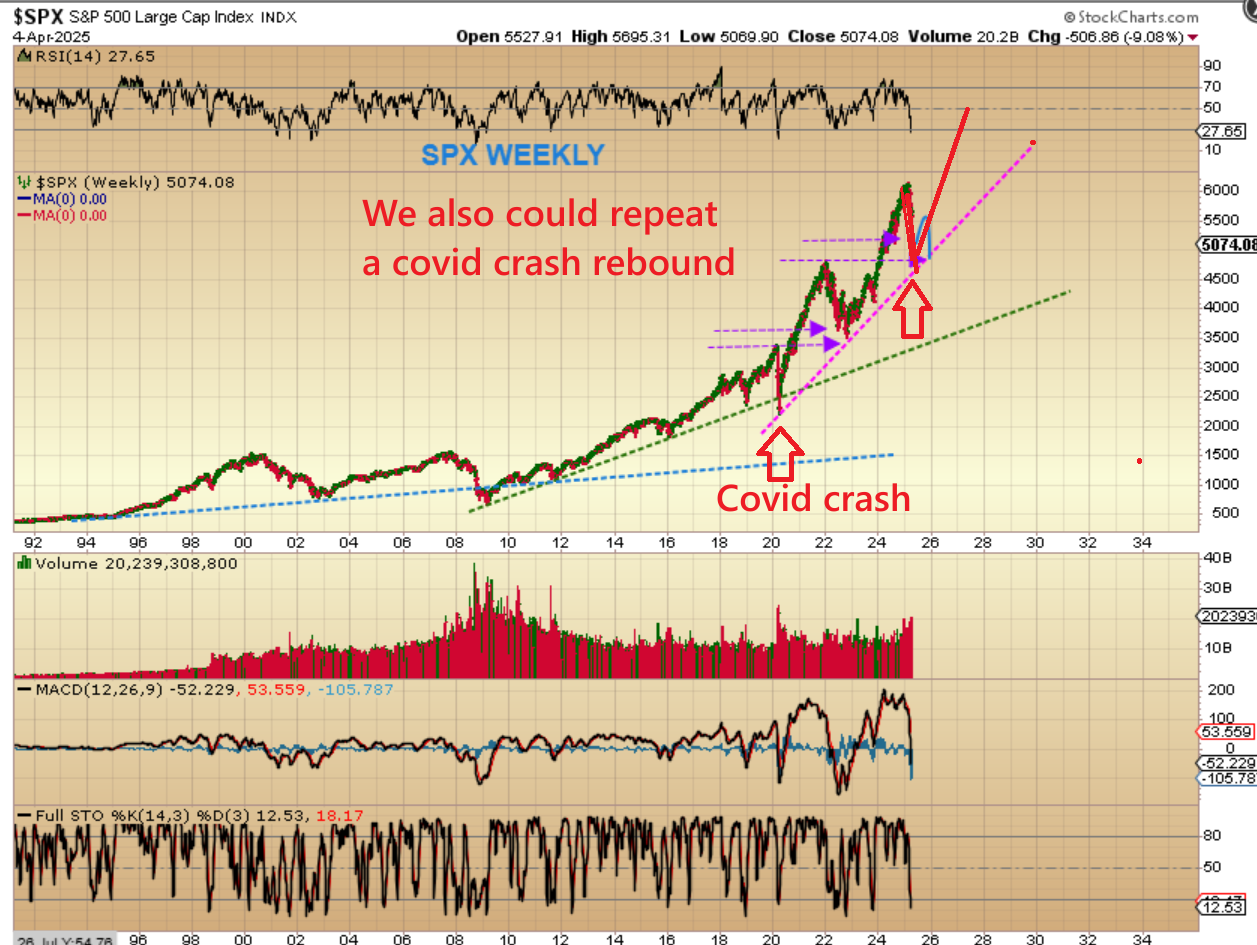
SPX – We should be falling into an ICL and a 5th daily cycle. The problem? We aren’t fully oversold and we are early in the daily cycle count, so I am wondering if we get a bounce next week that rolls over to a slight new low with divergence for the final low? This COULD HAVE been capitulation selling as an early low, similar to 2003, but we’ll have to wait and see. This also looks similar to the August low.
.
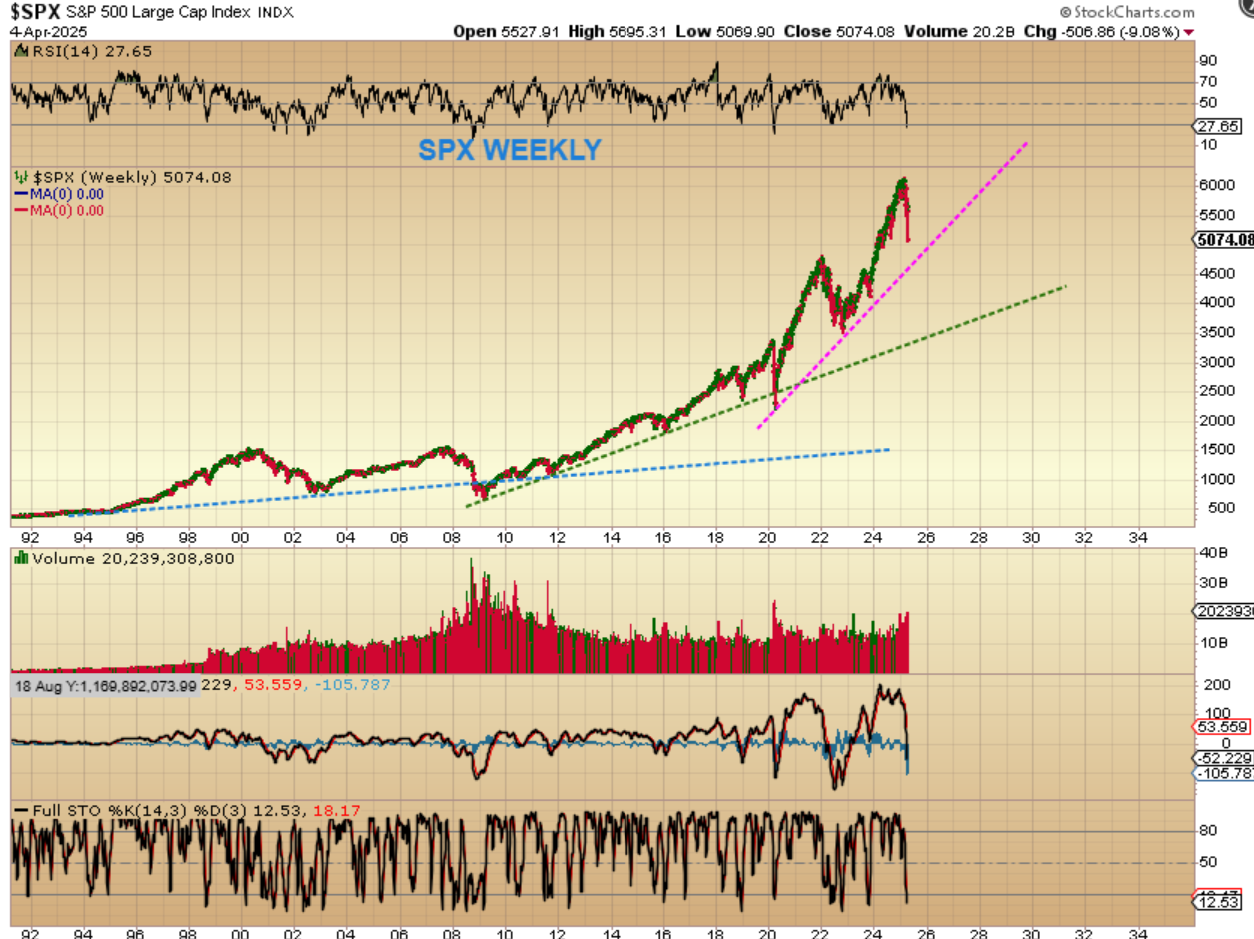
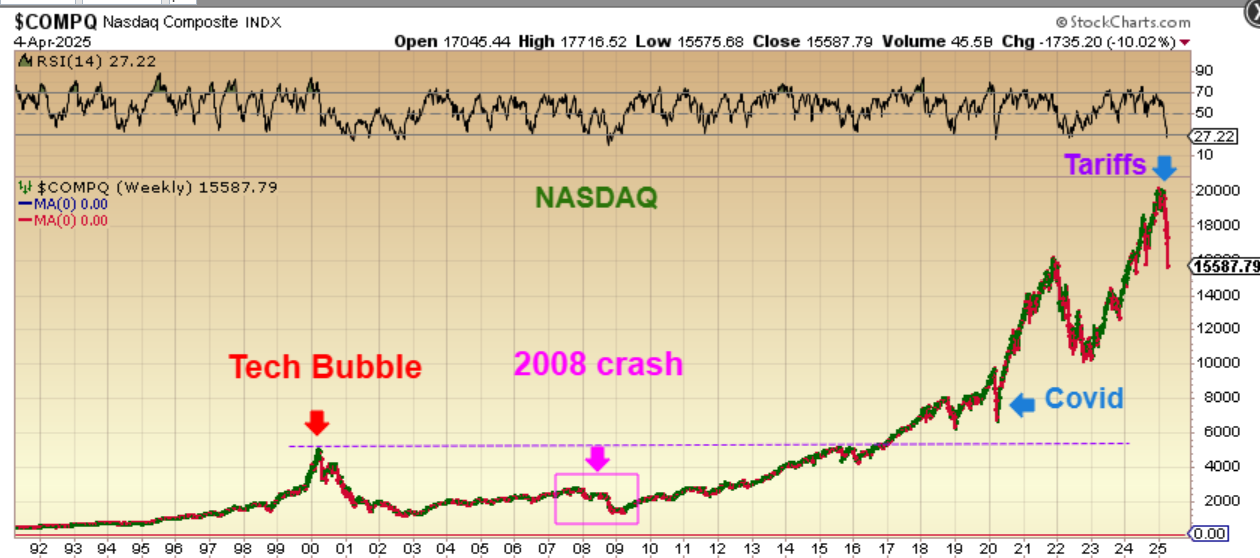
SPX – These markets look like they’re going parabolic in the big picture, and we see large ‘corrections’ along the way. So…
.
Will we drop to the magenta uptrend line with the new administration’s policy changes?
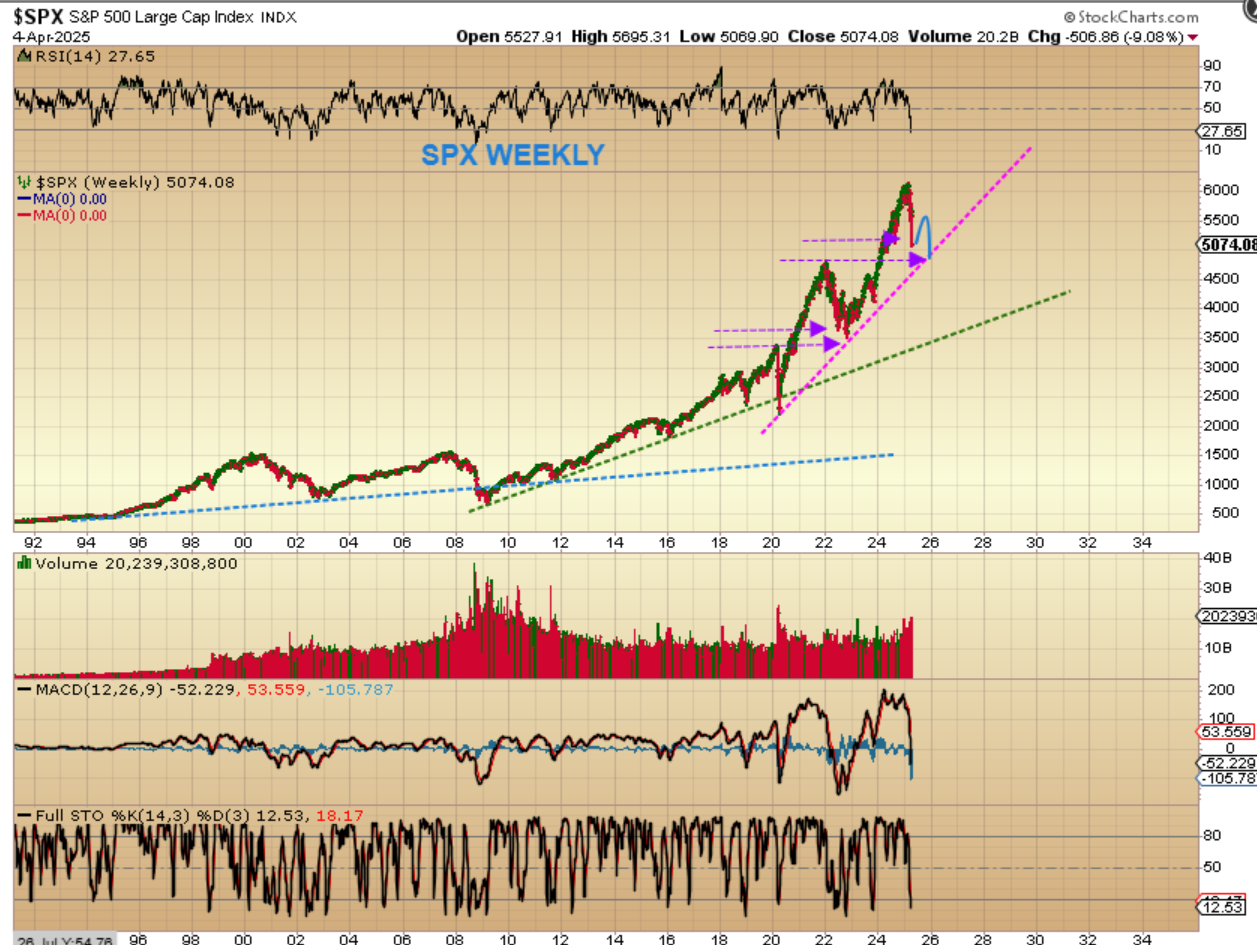
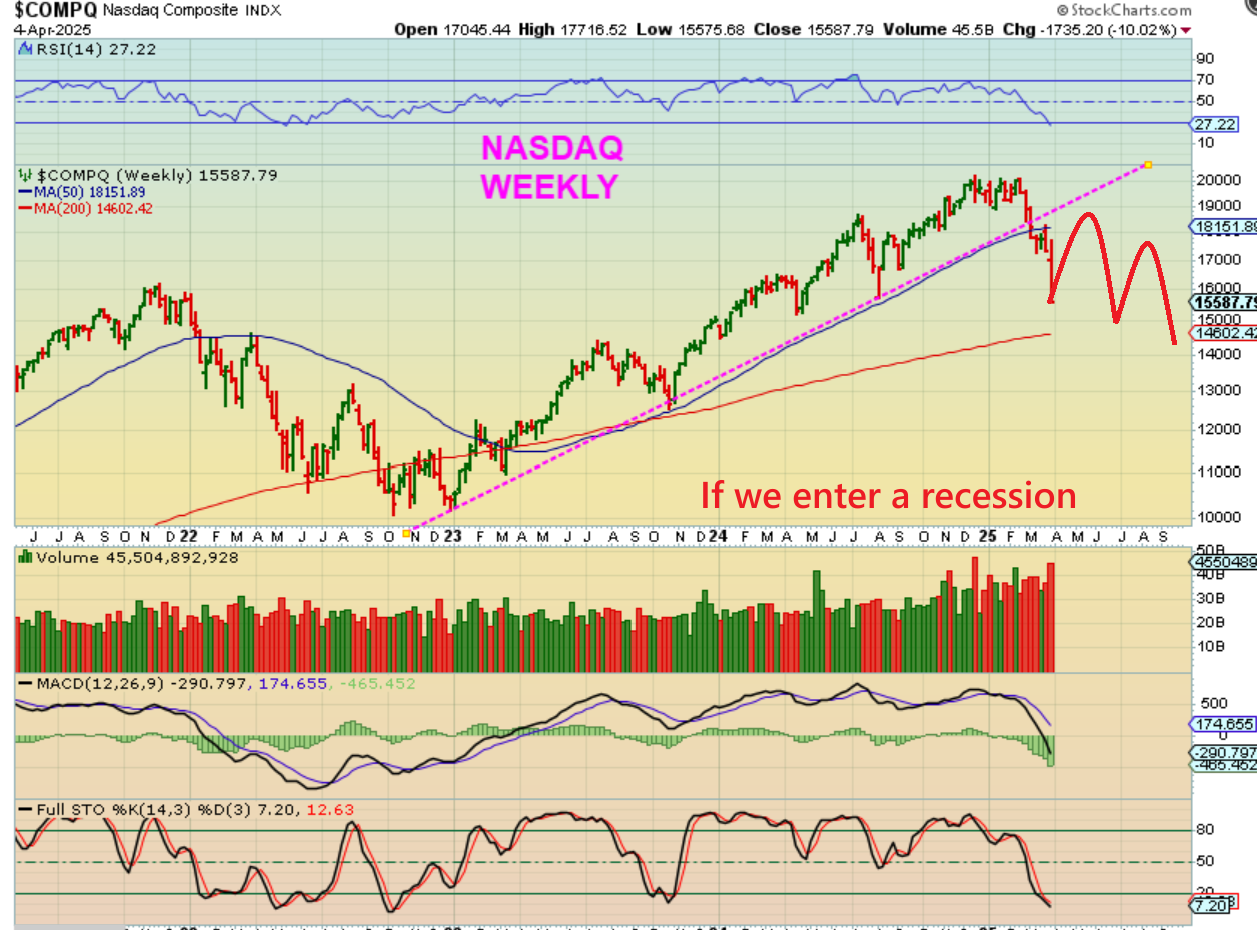
We could do that with a recession. The next intermediate cycle would have the first 2 daily cycles come up short of new all-time highs and then the next intermediate cycle low would be below the one that the current daily cycle forms. This would be a ‘correction’ or even a ‘recession’, but recessions often only last about 1 year in a market uptrend like we have.
.
Finally, when we had the Covid crash, it lasted for a couple of months and then it rallied sharply again. That could happen in a parabolic type move, if we see a rebalancing take place. If we saw some U.S. companies start to strengthen with tariffs as others struggle, or if it is perceived that things will change, tariffs will be reduced, etc down the road, we could see a quicker recovery.
.
Right now, the uncertainty and unknowns short term make it hard to know exactly how this will play out.
.
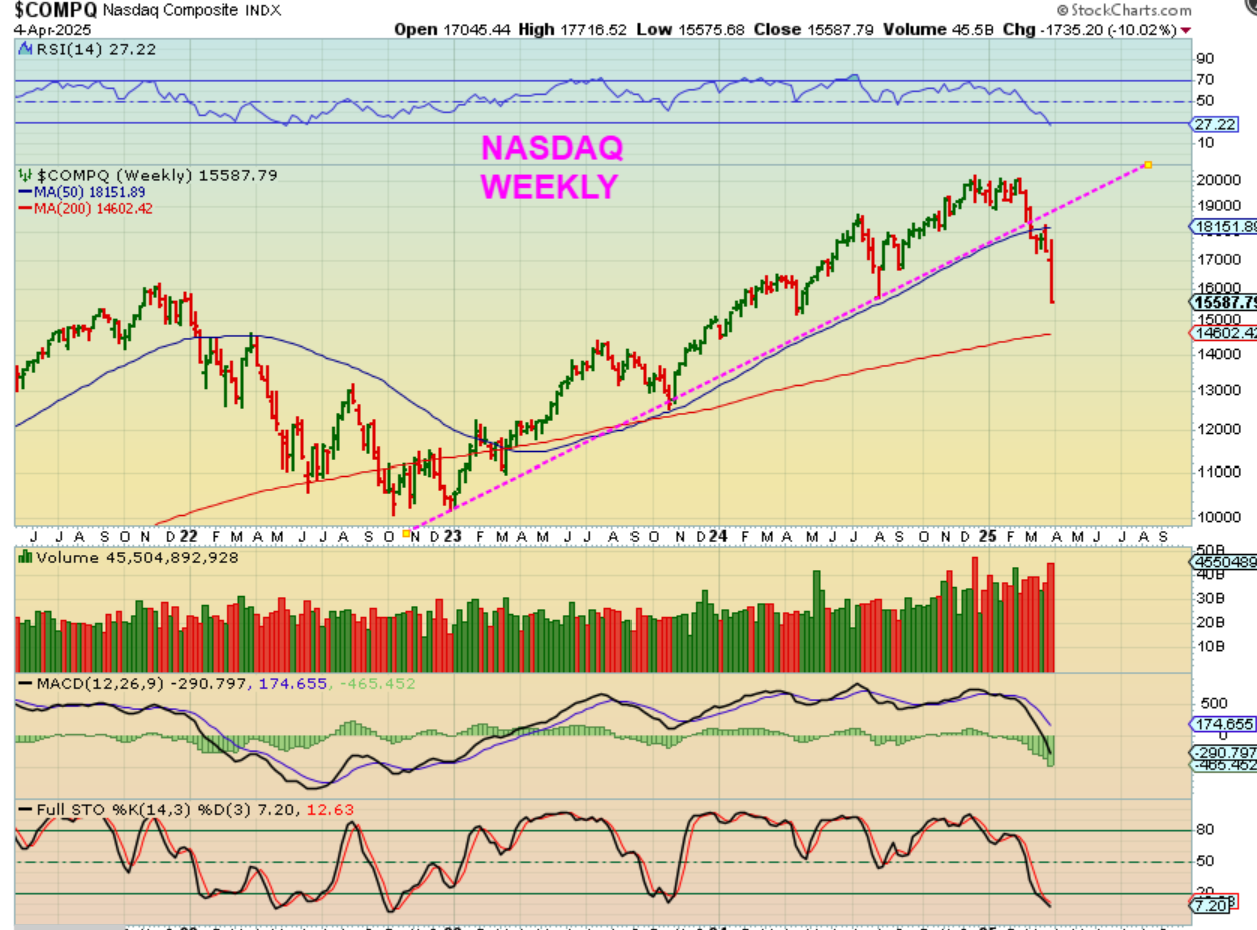
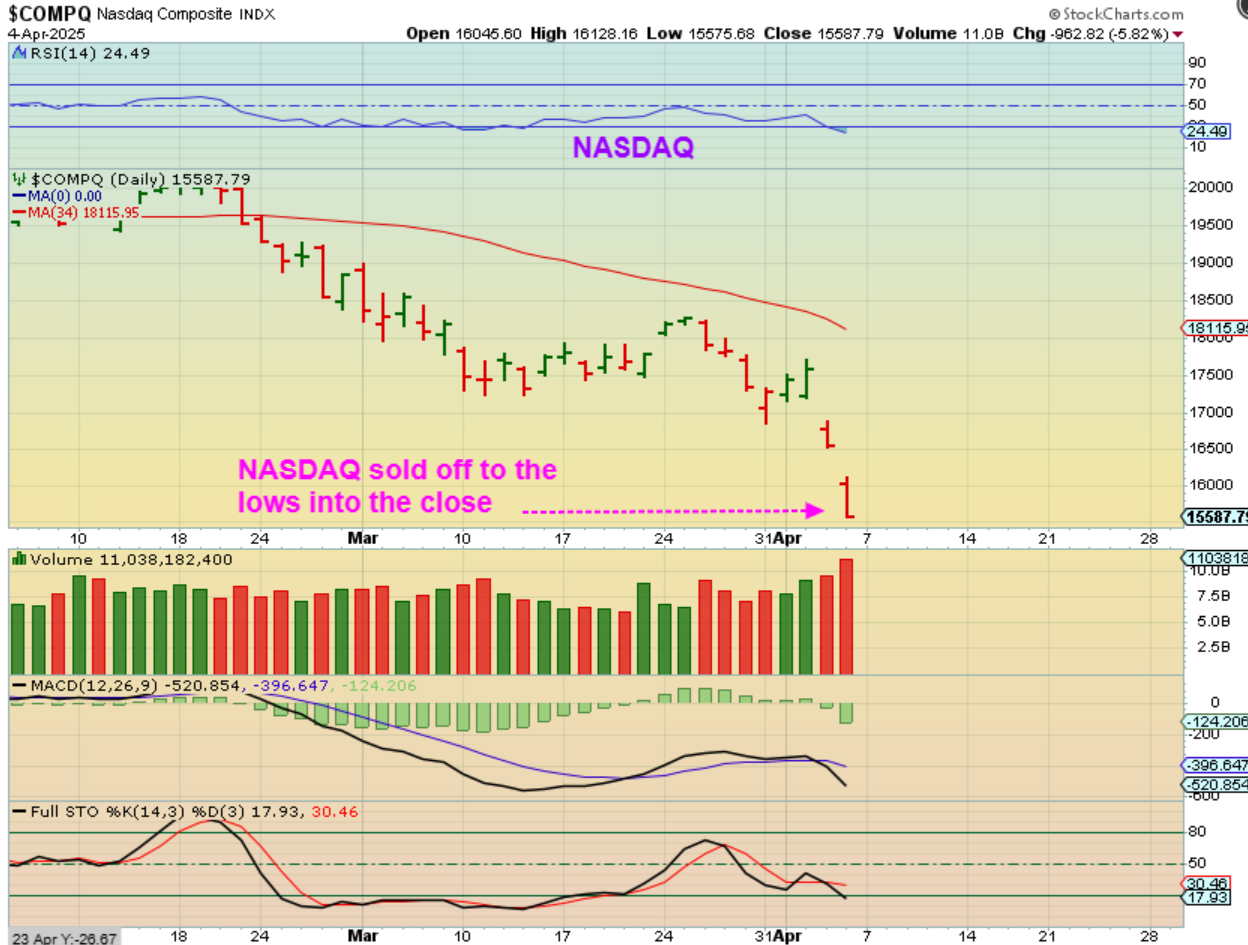
NASDAQ – We see an obvious break down in the Nasdaq and this sell off closed at the lows. No buyers stepped in, no short covering as of Friday. So…
.
NASDAQ – We would look at the next IC as one that is showing a weakening. It would begin to bounce along with lower highs and lower lows. It may back test that break down at the 50 week ma or trendline.
.
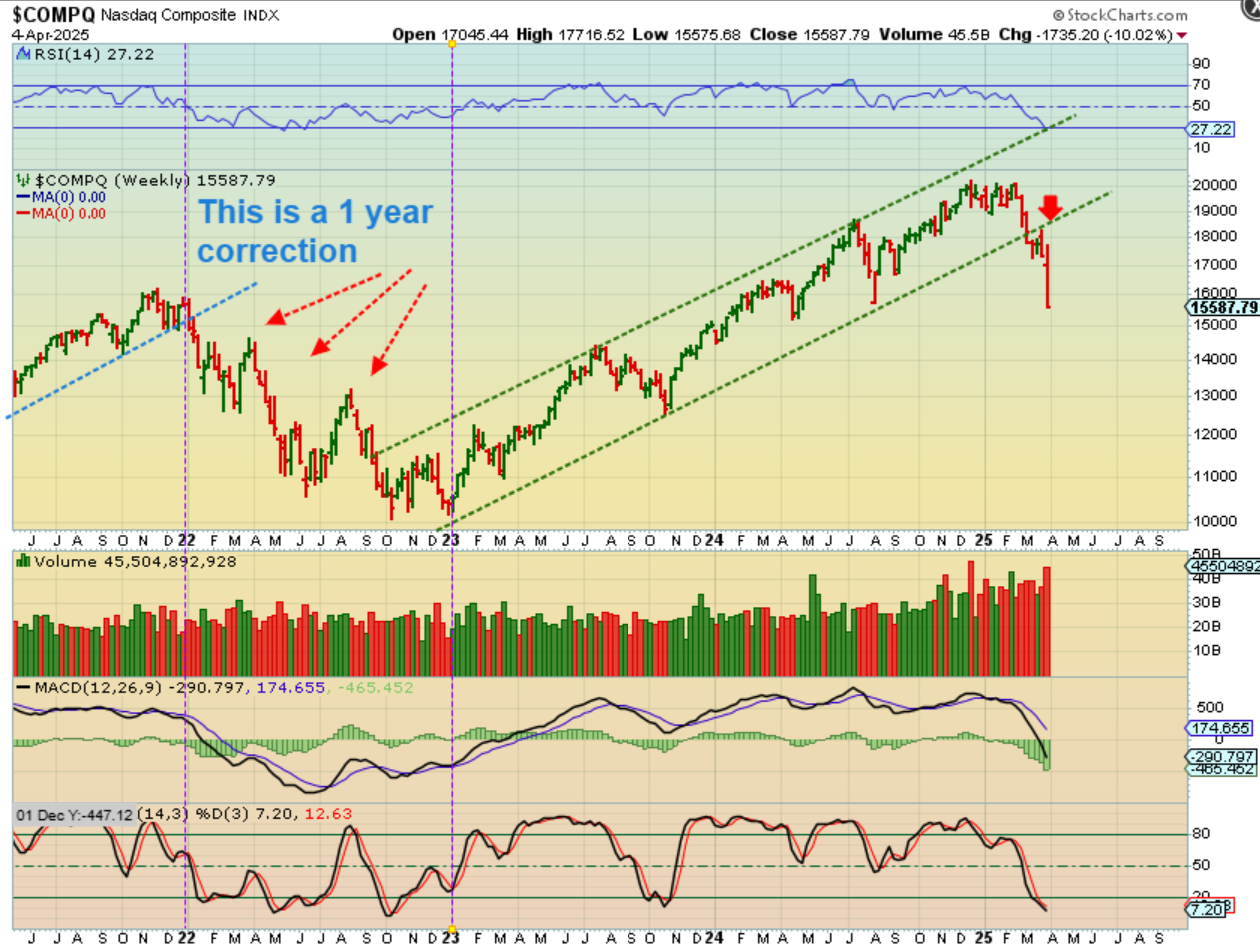
NASDAQ – The year 2022 saw a similar break down and weaker intermediate cycle, before it regained that bull run.
.
NASDAQ – Crashes and corrections come and go, and the ICL can be a buying opportunity that offers very nice gains, so we just have to see how price acts coming out of the first 2 daily cycles of the following ICL. This current drop looks like we almost lost as much as we did all year in that 2023 correction. Will it V-bottom like the covid crash? Or will it extend? We’ll see.
WTIC – This week Oil rallied, but I pointed out that with cycle counts, this is likely to fail, just like we saw with past false rallies…
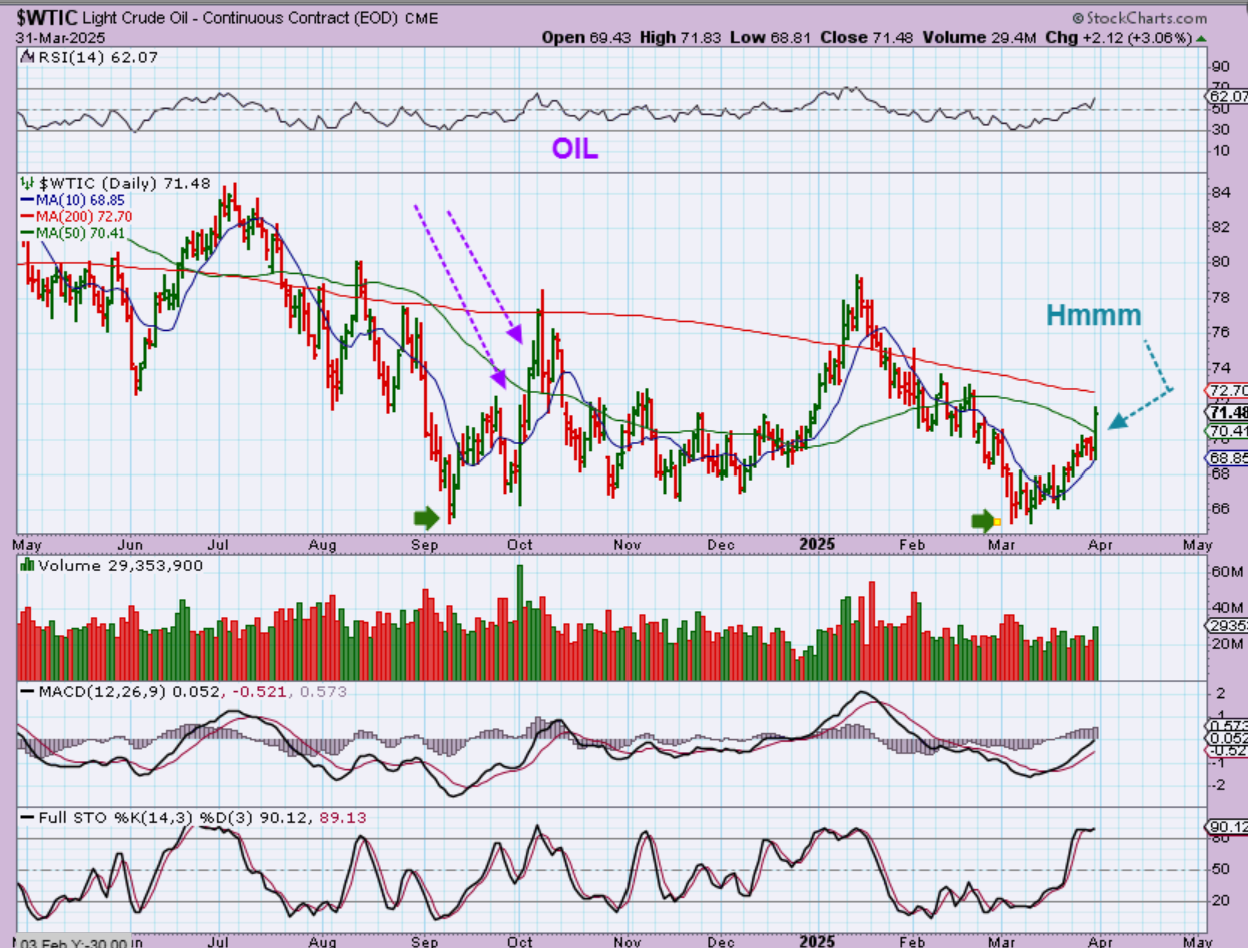
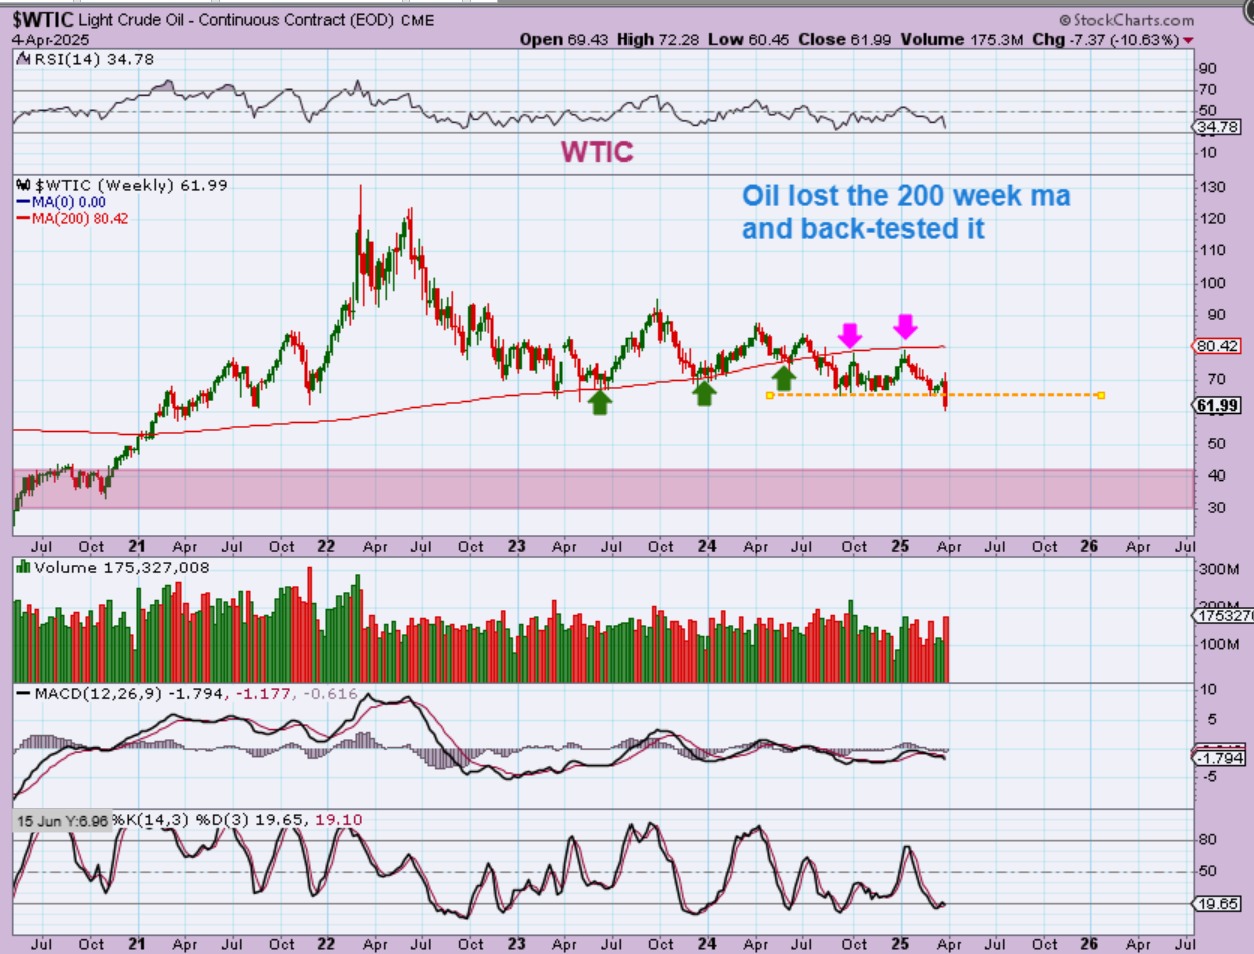
WTIC – Oil sold off and broke down and this is what I was expecting. I have also been saying that there is not a lot of support between $60 and $42ish, so this could drop even further. We are in a 3rd daily cycle, so a 4th would cause a sell off to that $40 area after a bounce.

.
WTIC WEEKLY – oils weekly chart lost the 200 week ma and back tested it but was too weak to recover. We now have a weekly break down.
.
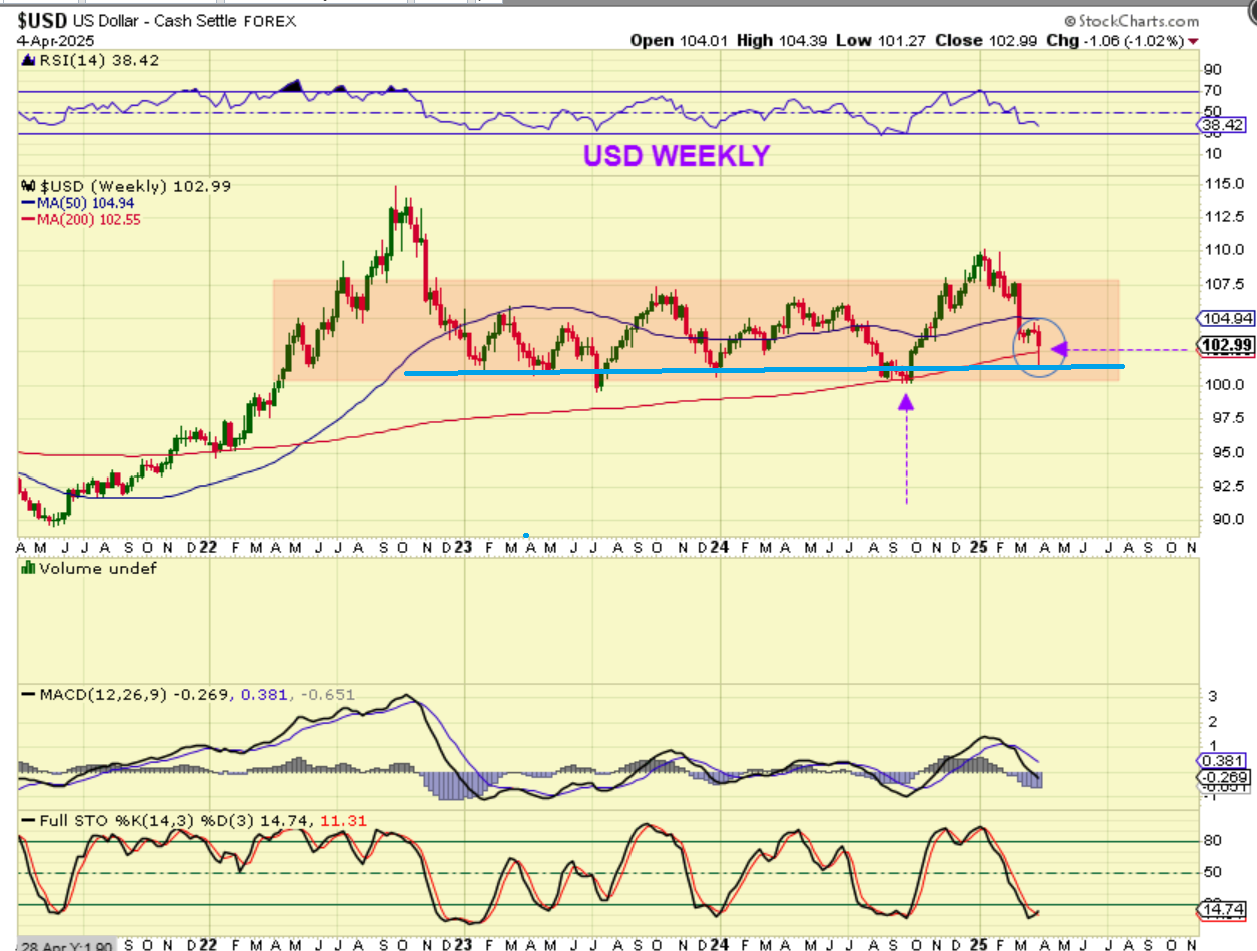
THE USD did drop to my target of the lower end of this consolidation, and then it bounced at the end of the week and regained the 200 week ma. The USD may have finished that daily cycle and could continue higher. The USD has acted exactly as expected over the last few months too.
.
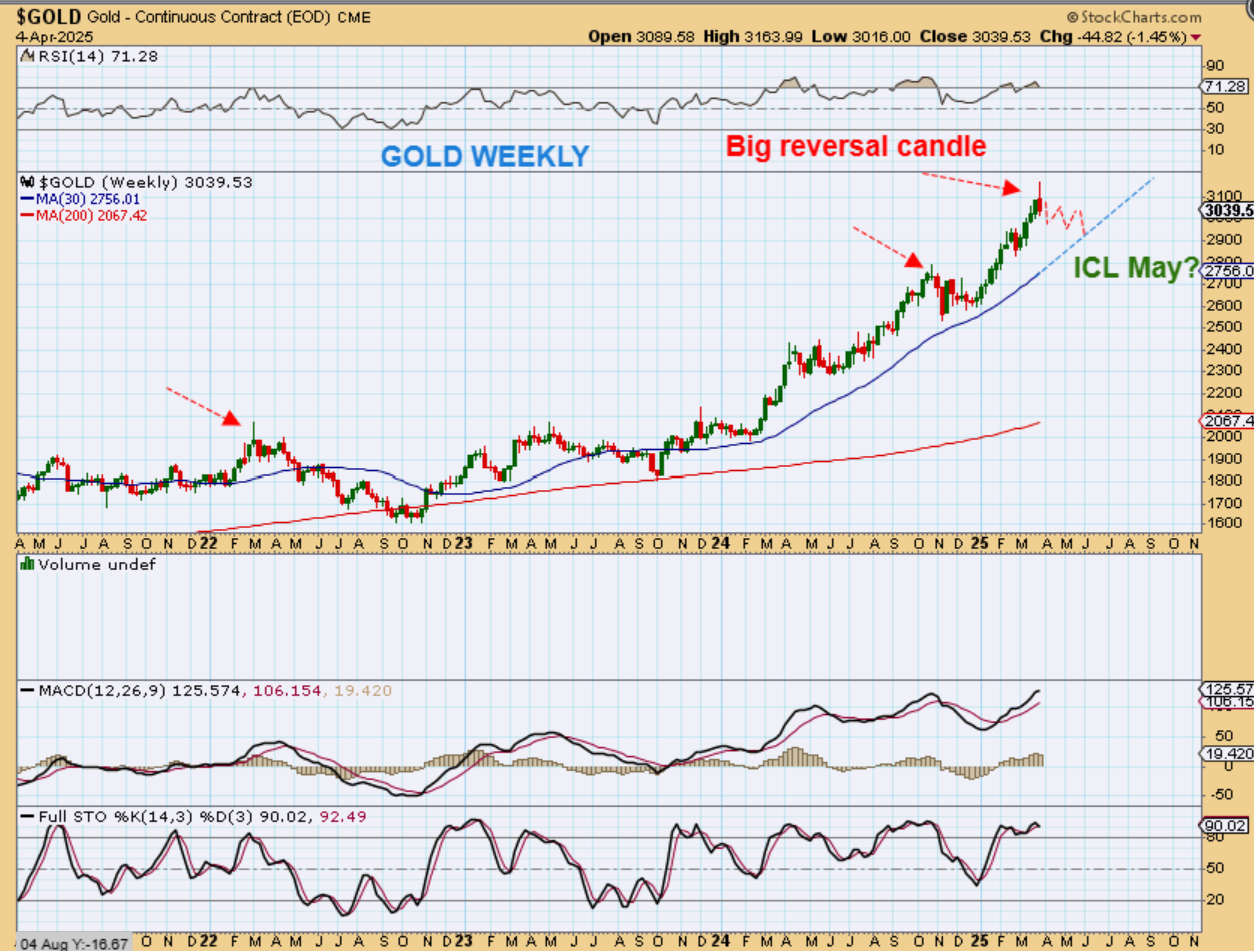
GOLD has a reversal at the top, as the USD put in a reversal candle at the lows. The movement of the USD has NOT affected gold for months, but they may act inversely with this new development, since Gold could be due for a dcl drop and then an ICL dip. Gold is a strong bull market and may only correct as drawn here. It could ICL in May?
.
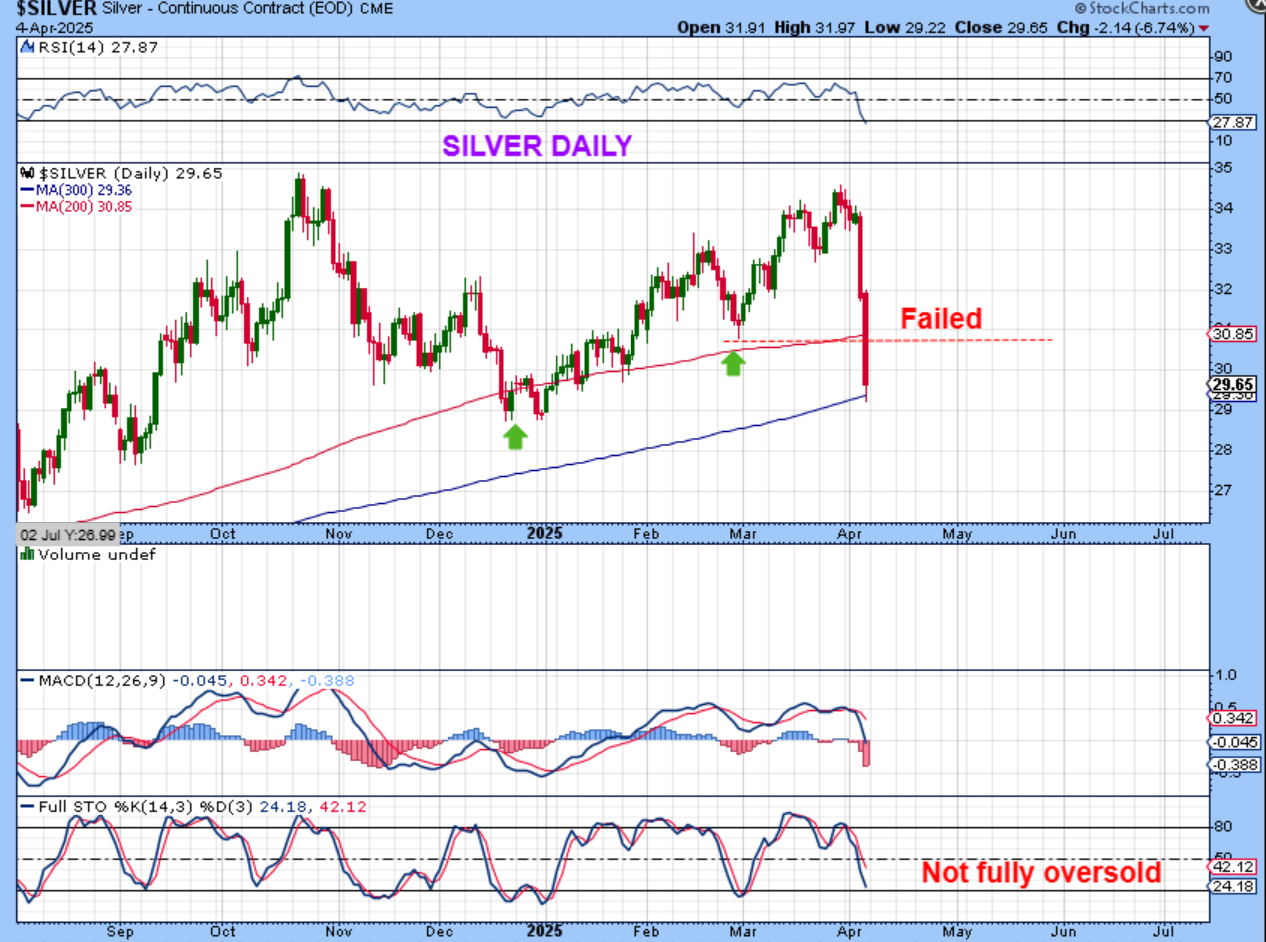
SILVER crashed. This could be a capitulation low to the daily cycle, but it is now a failed daily cycle and will bounce soon and then gradually (I hope it changes to gradually) dip down into an ICL also.
.
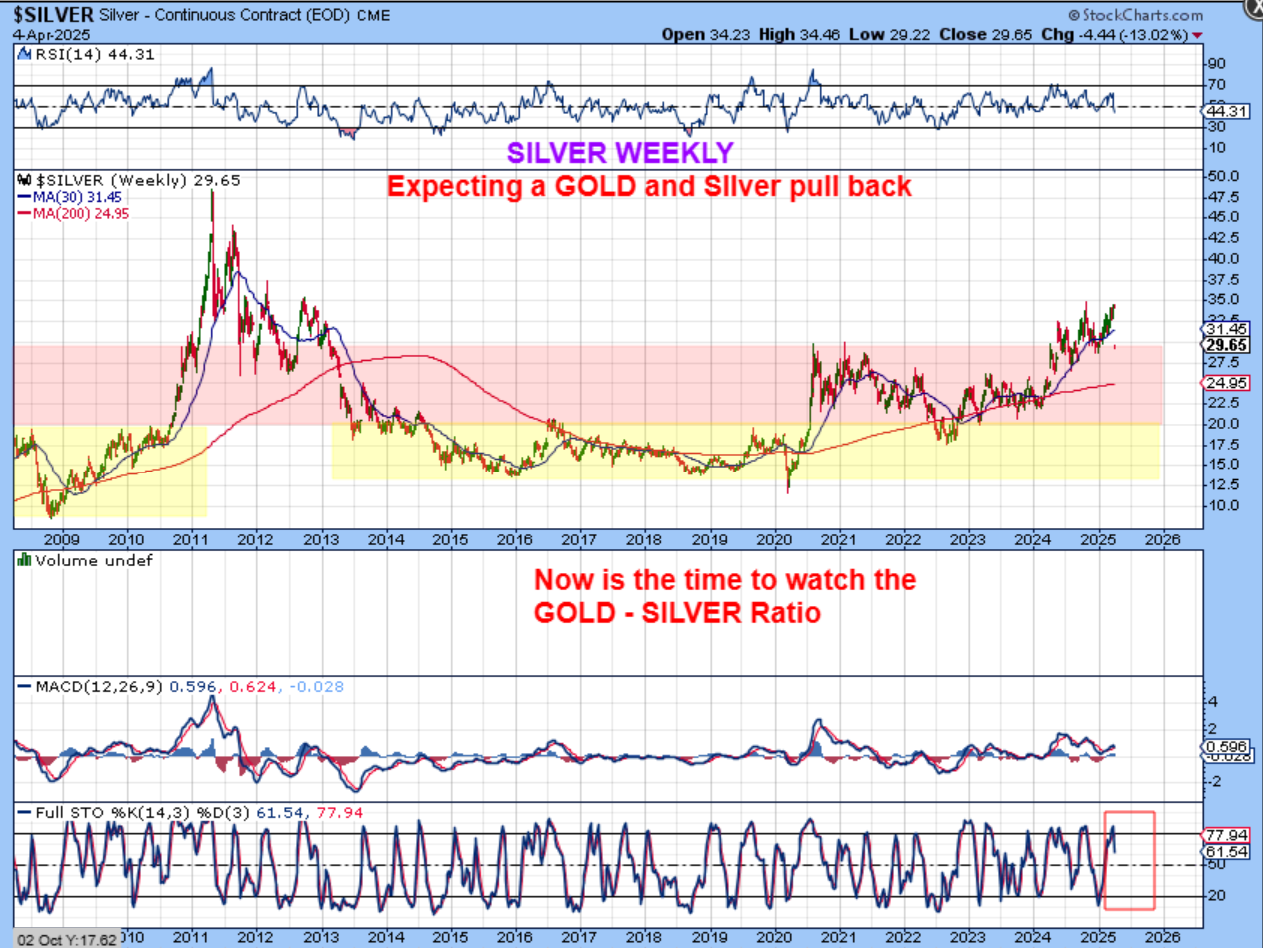
SILVER dropped to $29.65 and the candle doesn’t show up here, but it lands price right at the red support area. How might this play out ?
.
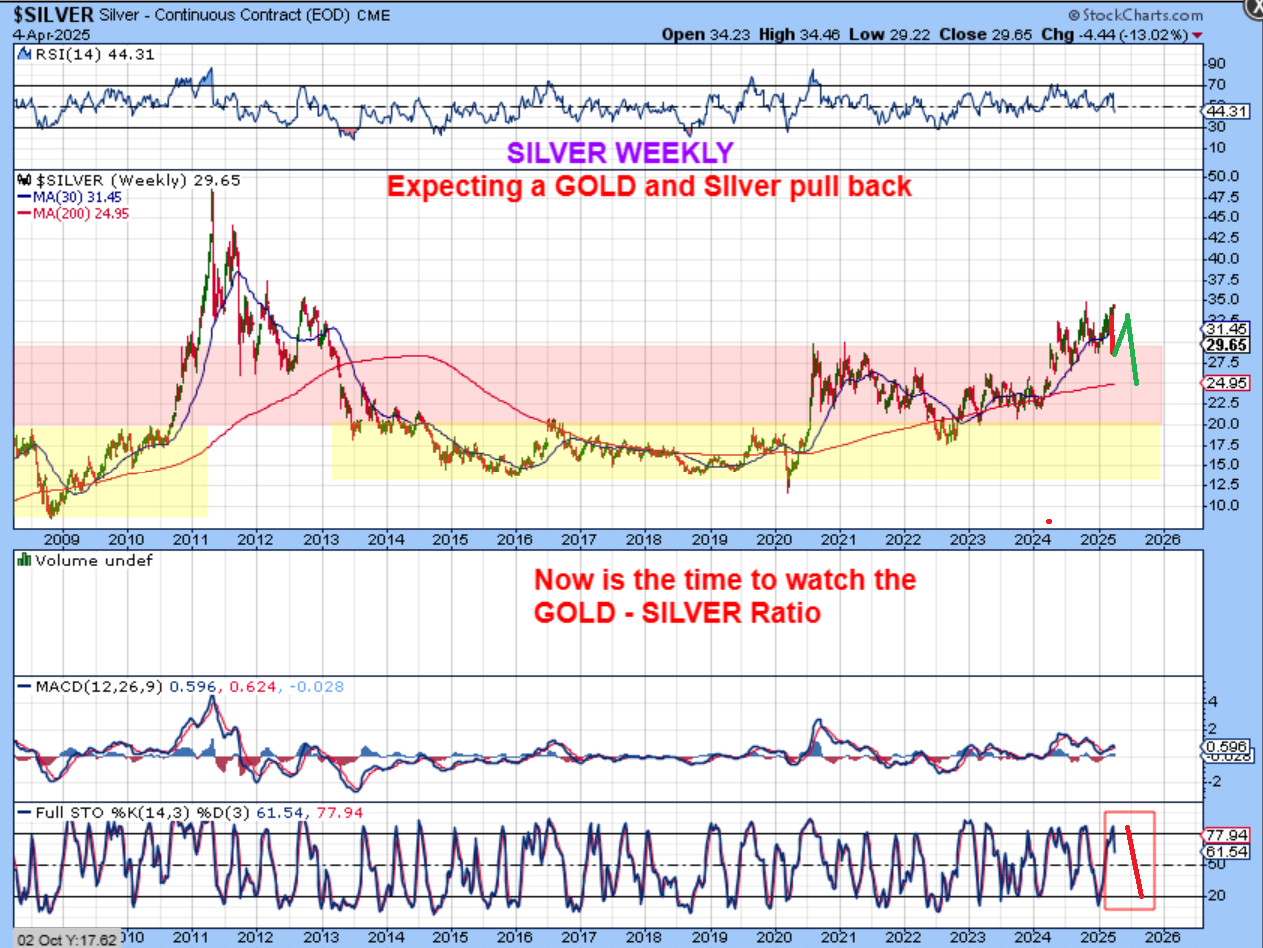
SILVER I’ve drawn in the candle drop from this week. So we could get a choppy bounce higher in the next daily cycle and then a dip down into an ICL. I’m drawing it to the 200 week ma. May or June would be possible timing, and even though Silver dropped sharply this week, that would be a good buy point.
.
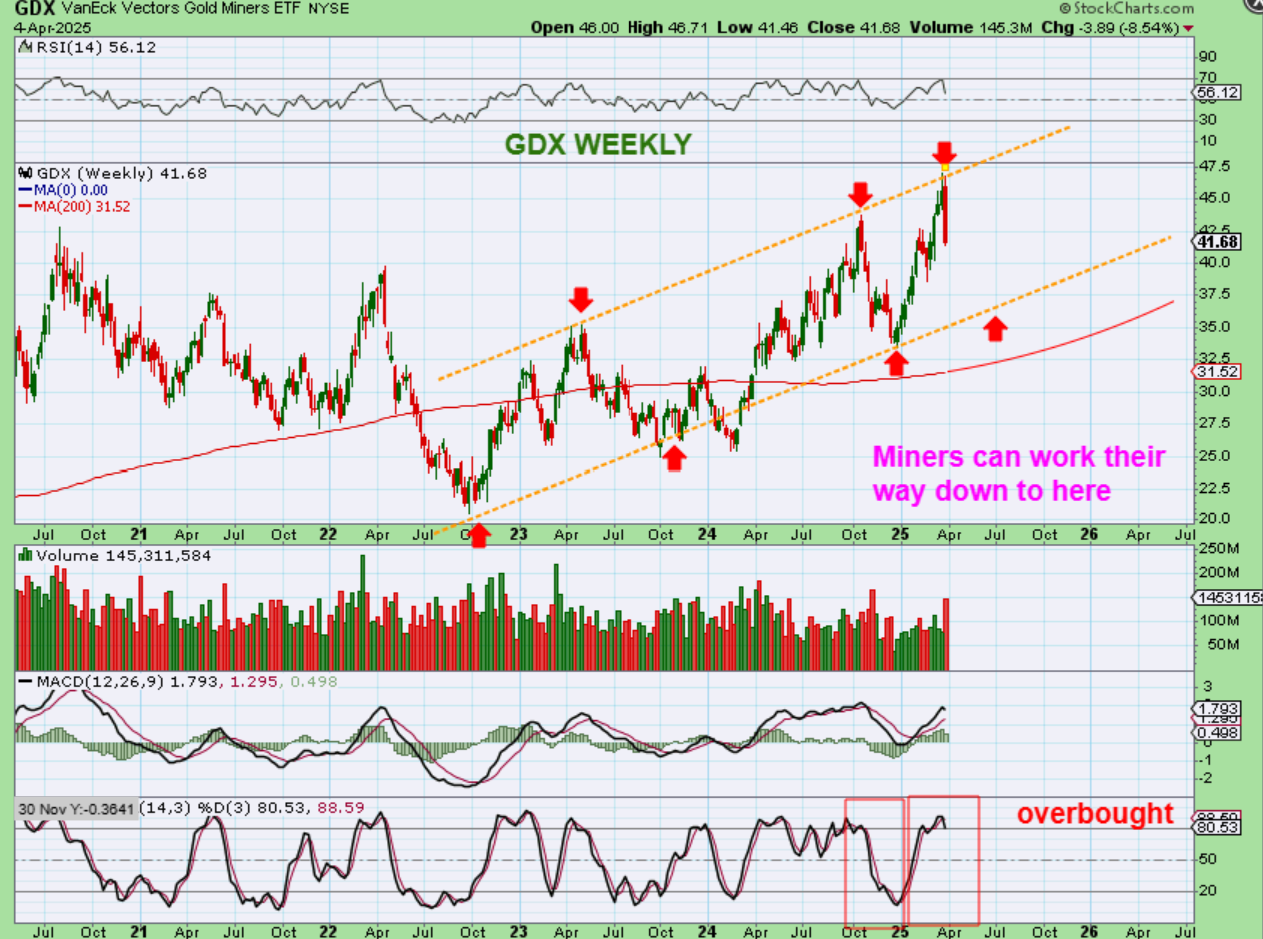
I pointed out that GDX had reached that upper trend line. It was possible that it could crawl up along the upper trendline, or it could start to dip back, since the daily cycle was in the day 20+ area. Well, with everything else, it sold off last week. Take note that the weekly chart is overbought, and we should be due for a dcl and then an ICL in the next month or so. The downside targets could be the lower trend line or the 200 week ma.
.
Right now, we are seeing the effects of change on the markets, but continued change can really cause this to go either way. Some companies will benefit, others will definitely be hurt short term. There is a lot of talk about recession chances increasing, but it should be fairly short lived if it happens. Gold & Silver are in a bull market, so the pull back there will be a buying opportunity. Below I want to point out 2 interesting things with Bitcoin, since it did NOT break down to new lows last week. This weeks selling was heavy and that can often lead to a capitulation low, so I’ll be looking for that next week. We closed at the lows, but short covering can cause a sharp reversal, we’ll see. Enjoy your weekend and hang in there, these corrections do not last forever.
.
~ALEX
.
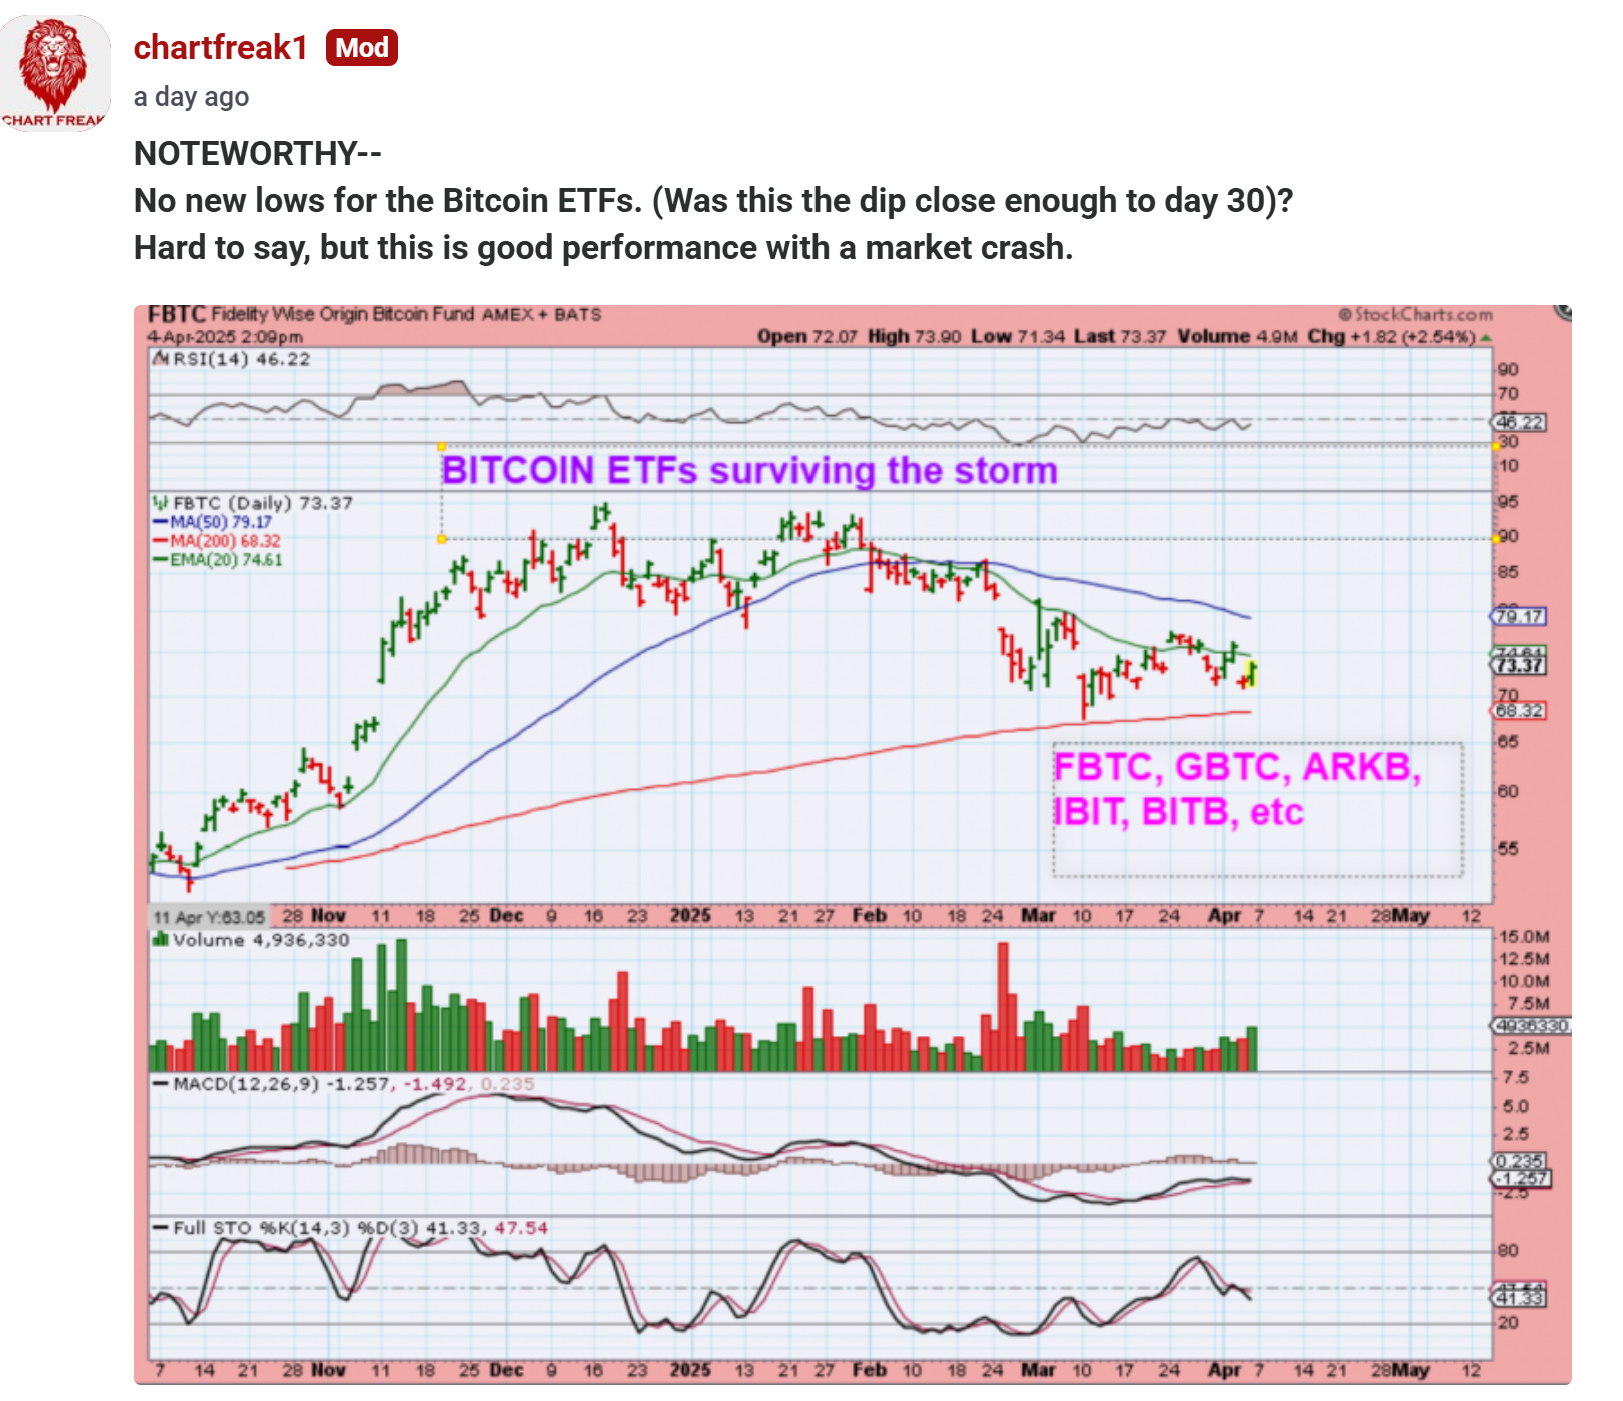
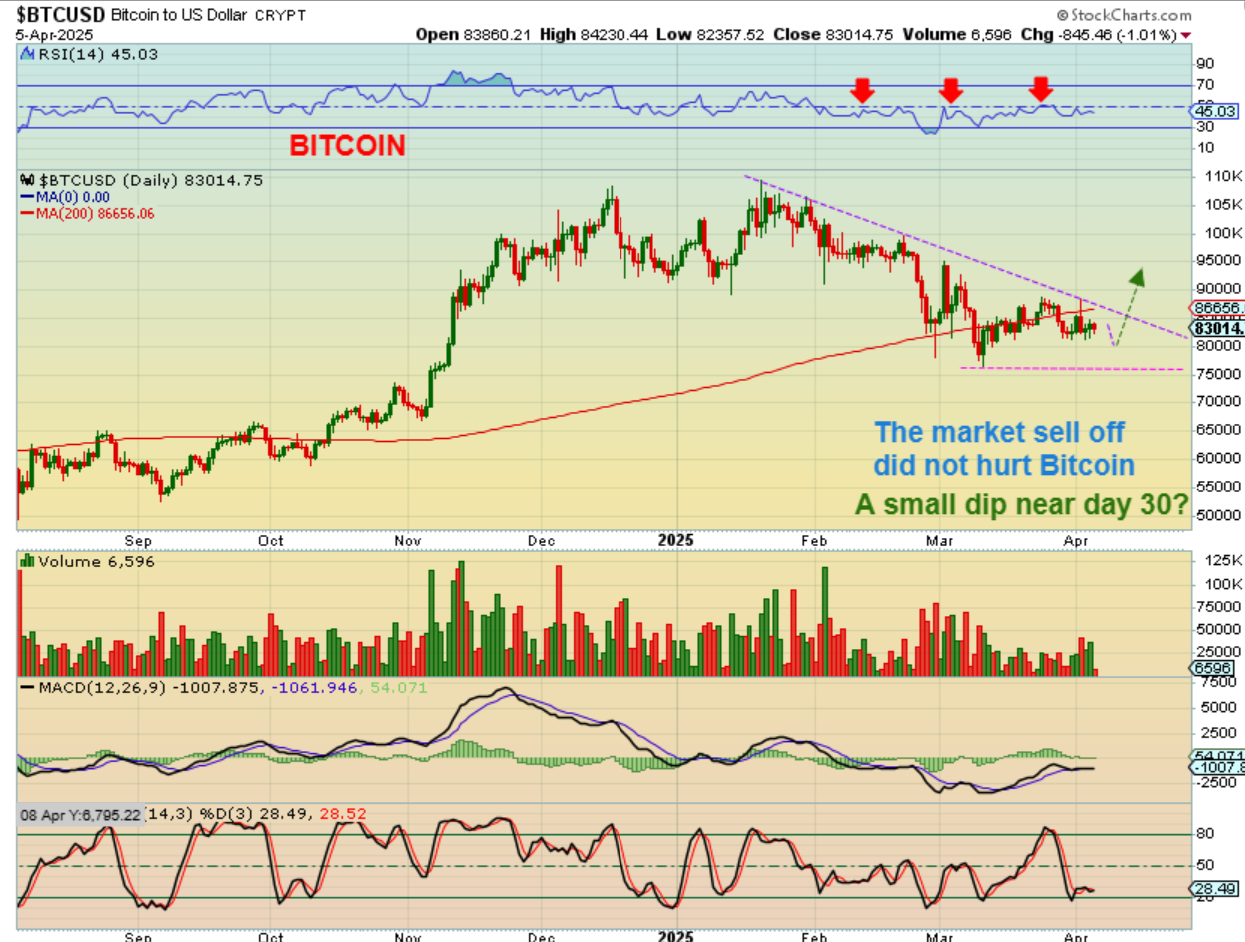
BITCOIN – Saturday is day 25, so bitcoin had every reason to dip lower near the day 30 timeframe, right? But even with the markets crashing lower, it acted more like Gold was acting. This may be the safe haven in that sell off. So we could still see a dip as we approach day 30, but it may not be necessary. Bitcoin could break that downtrend and rally soon (I Hope). 🙂
.
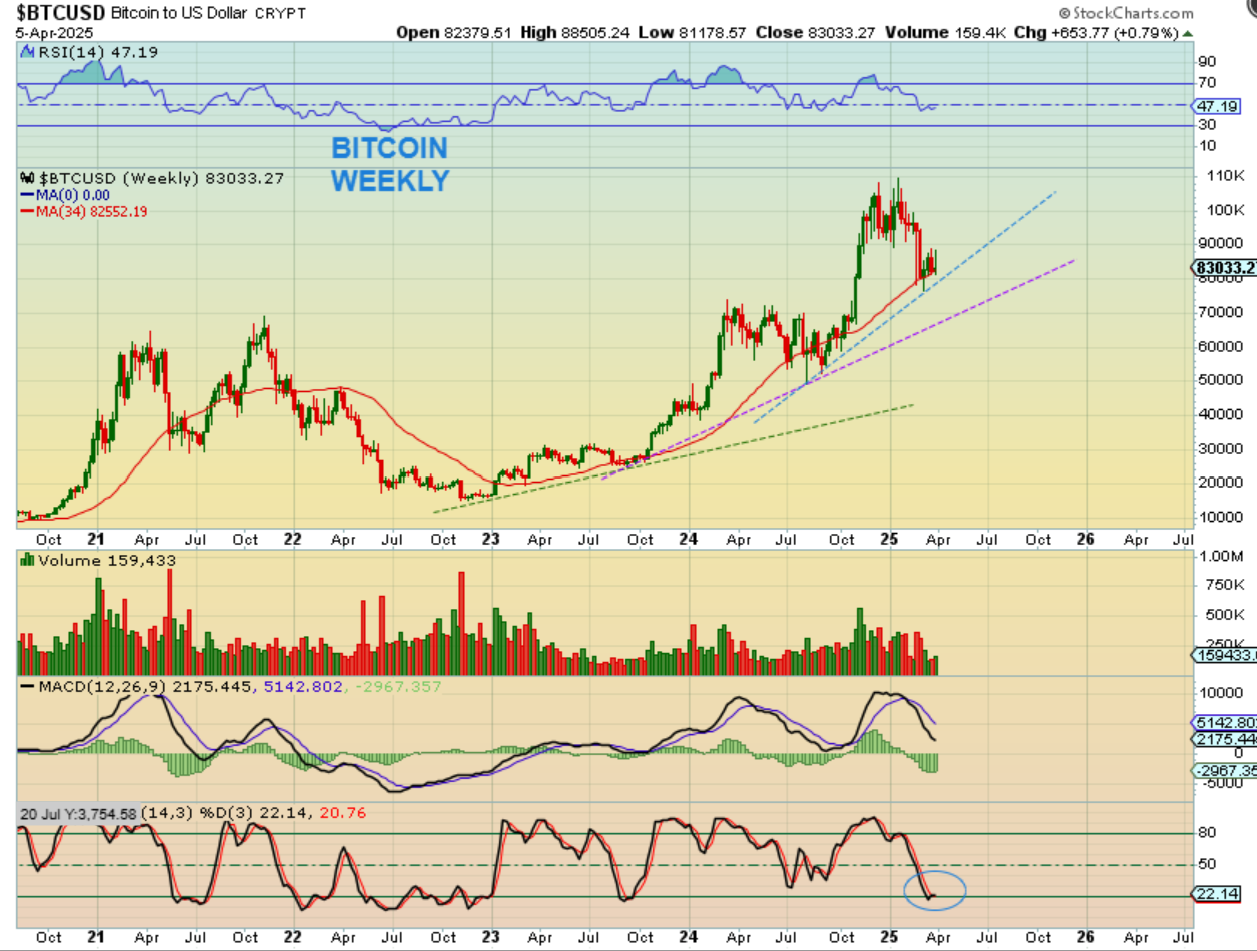
BITCOIN – The weekly chart also does not show signs of that General Market/Oil/Gold and Silver sell off. In fact, Bitcoin was up $654 last week.
.
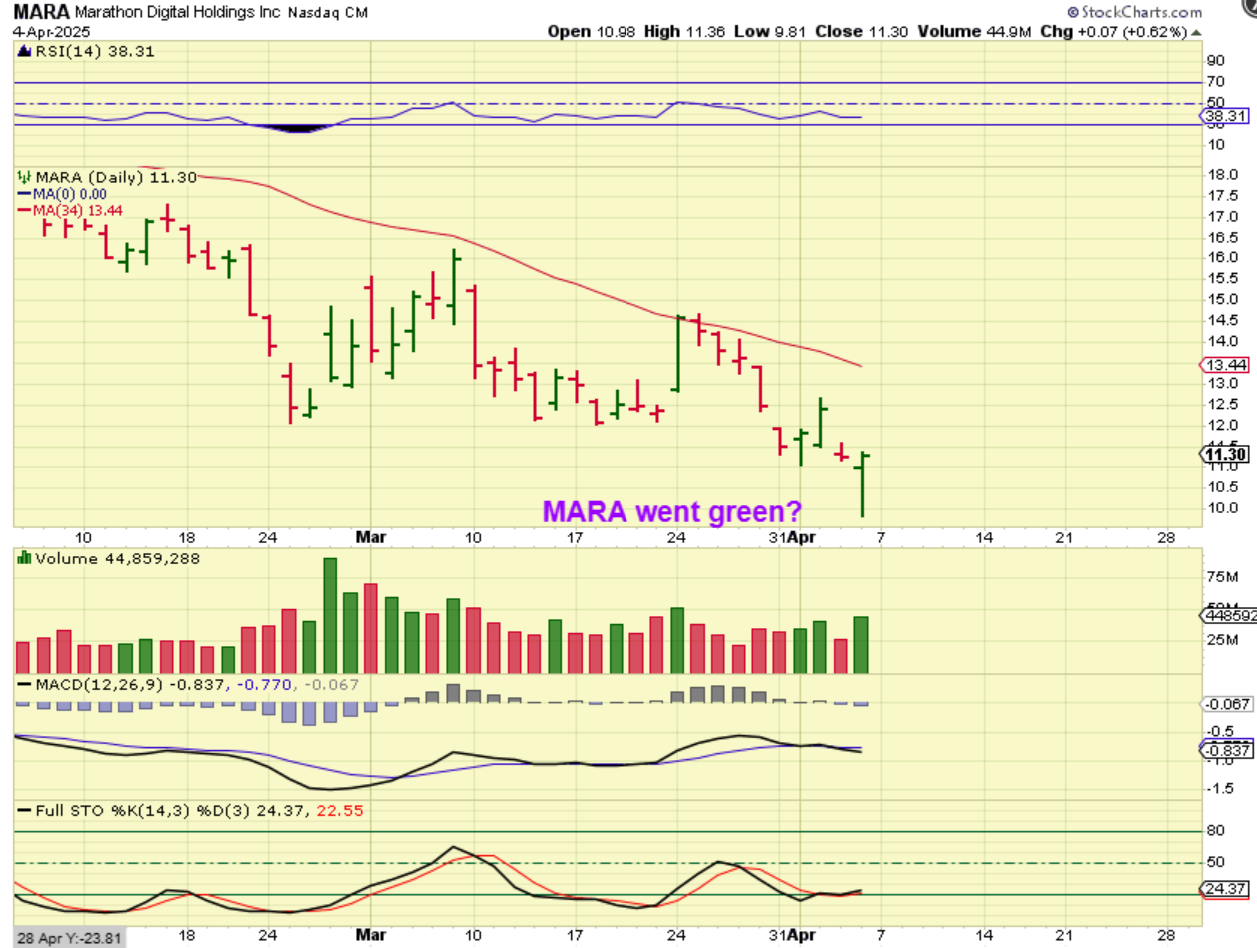
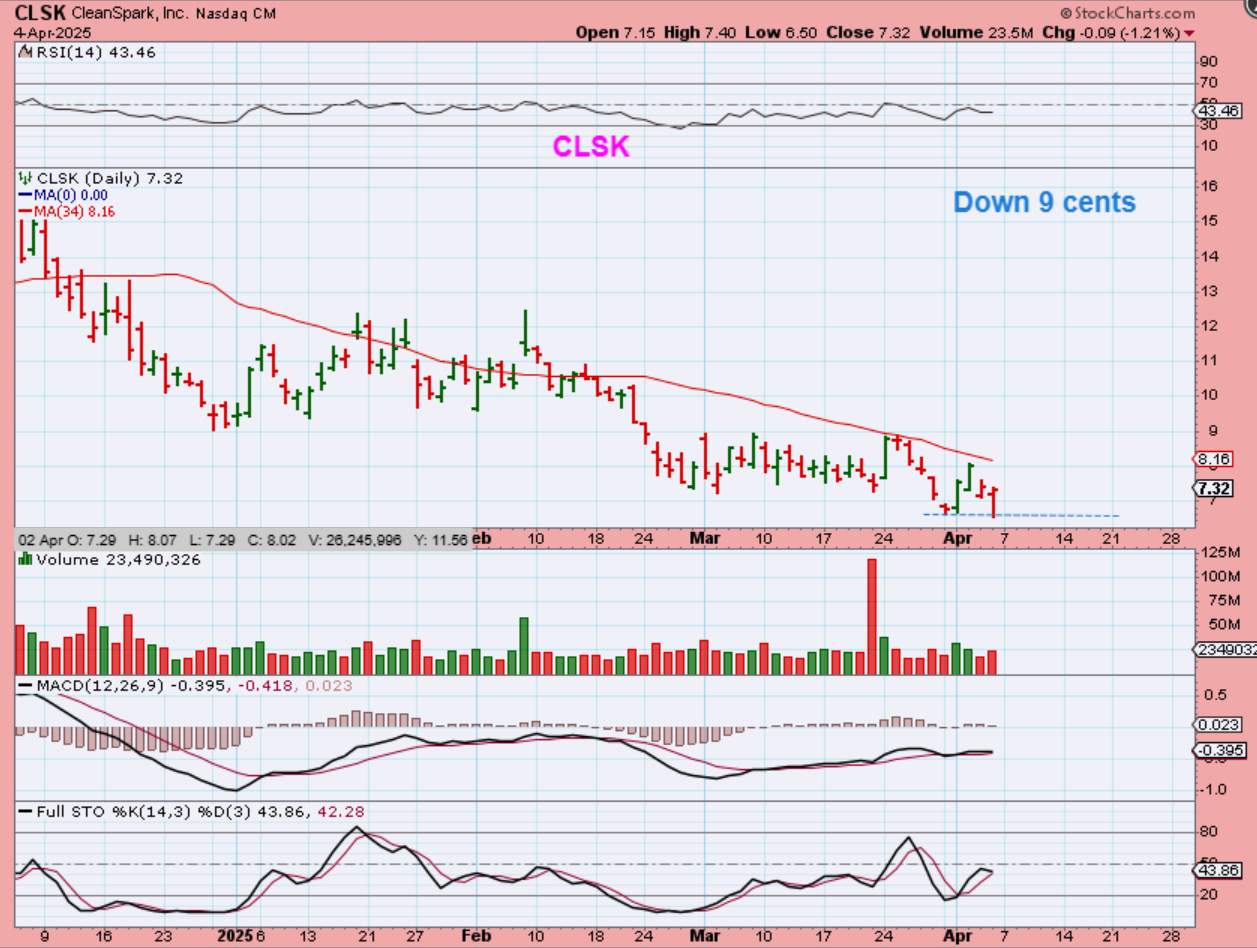
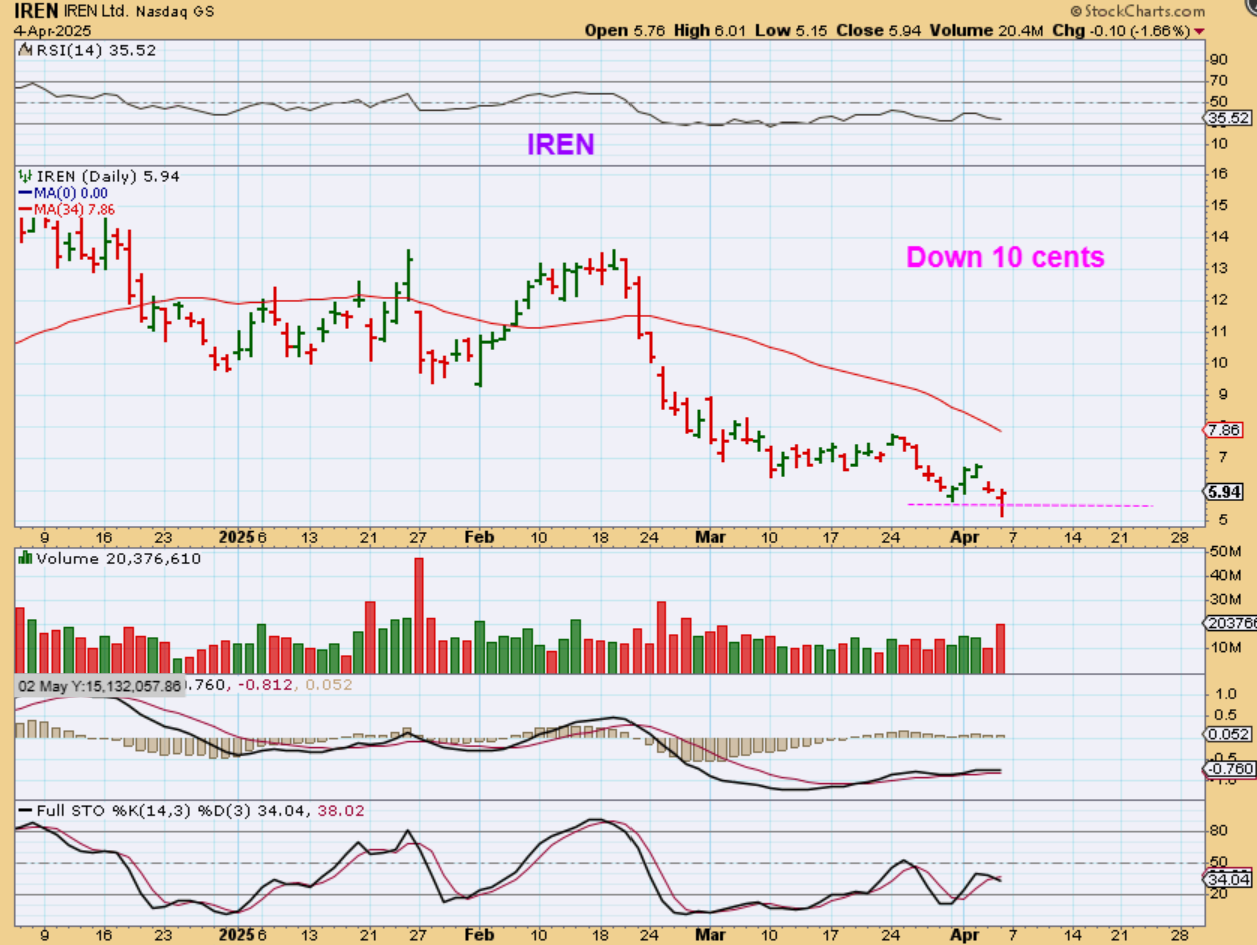
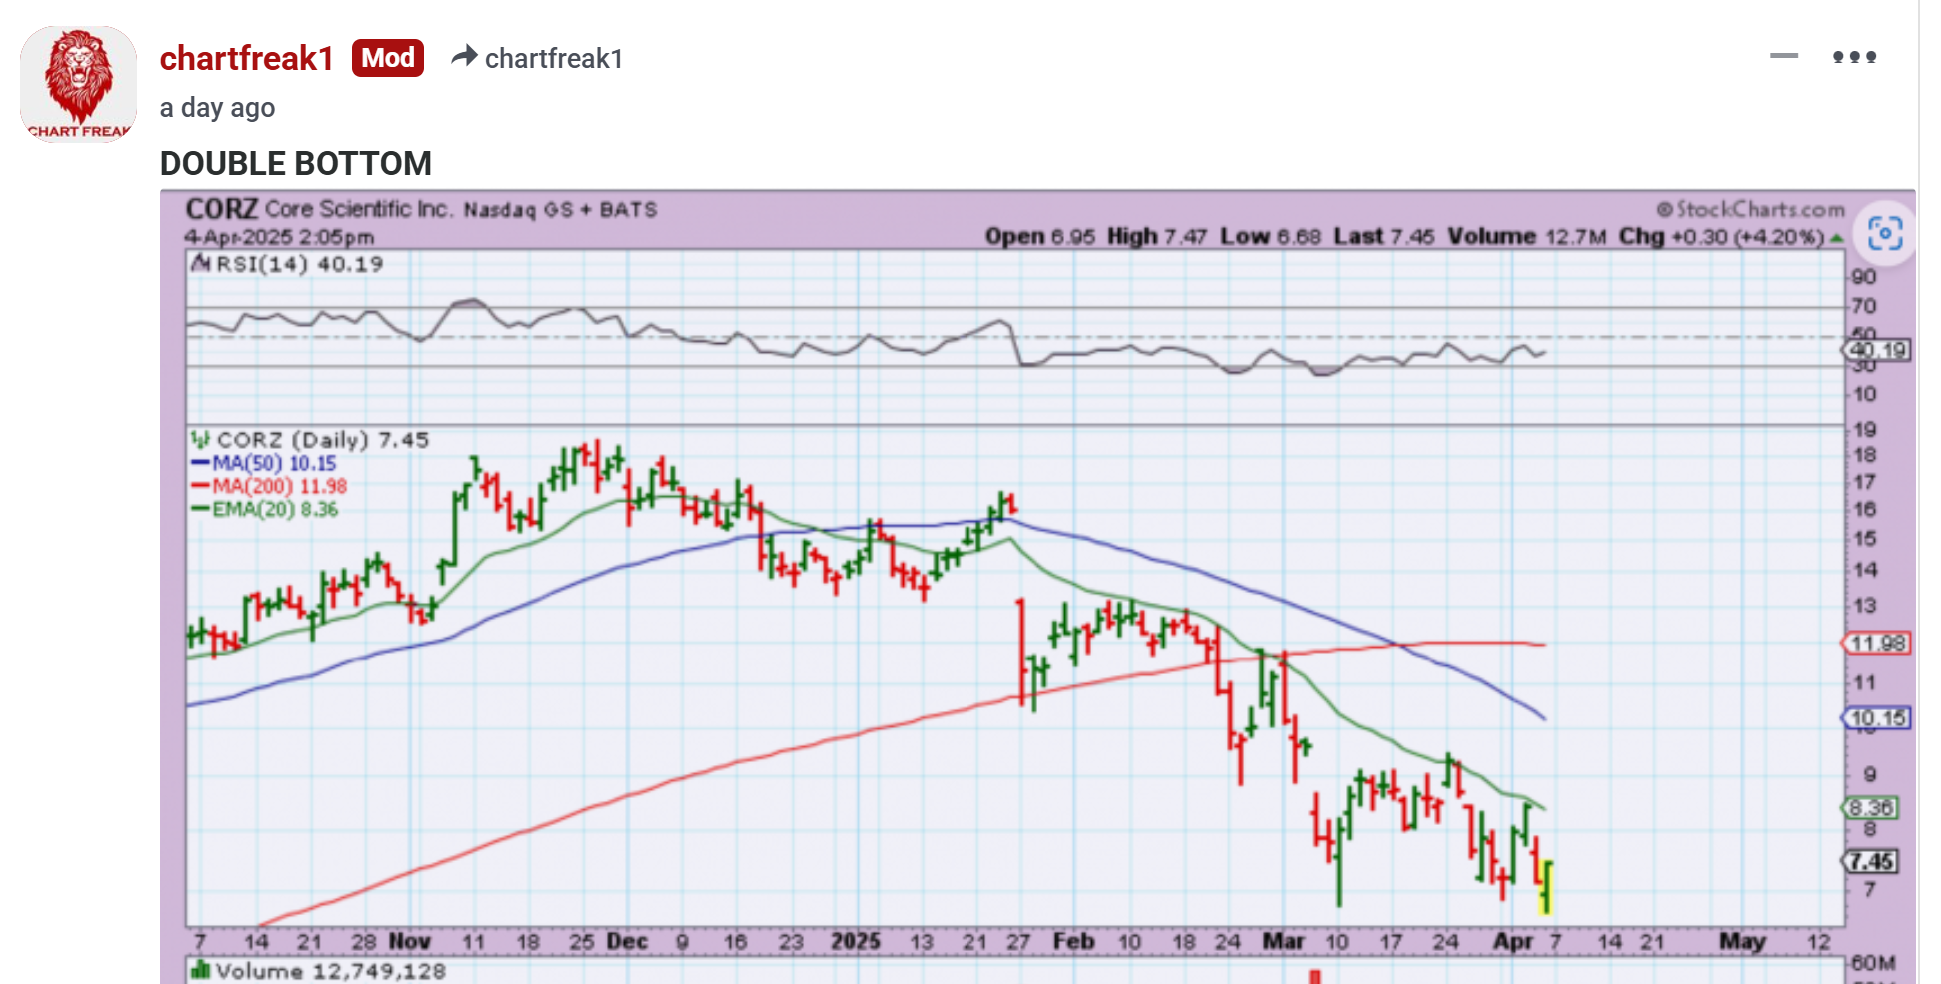
Take note of the fact that the markets sold off and closed AT THE LOWS. Crypto Miners dropped and recovered with reversal candles. That was very interesting, but it was only 1 day, I’d like more evidence of buyers, but that was encouraging. If the general Markets put in an ICL, these might take off. Please see the charts below. I was posting this information in the comments section.
.
Now take a look at some crypto stocks during Fridays absolute thrashing, where the markets closed at the lows.
.
Posted in the comments Friday.
The real winner is MSTR. Higher lows and up 4% during a market beat down.
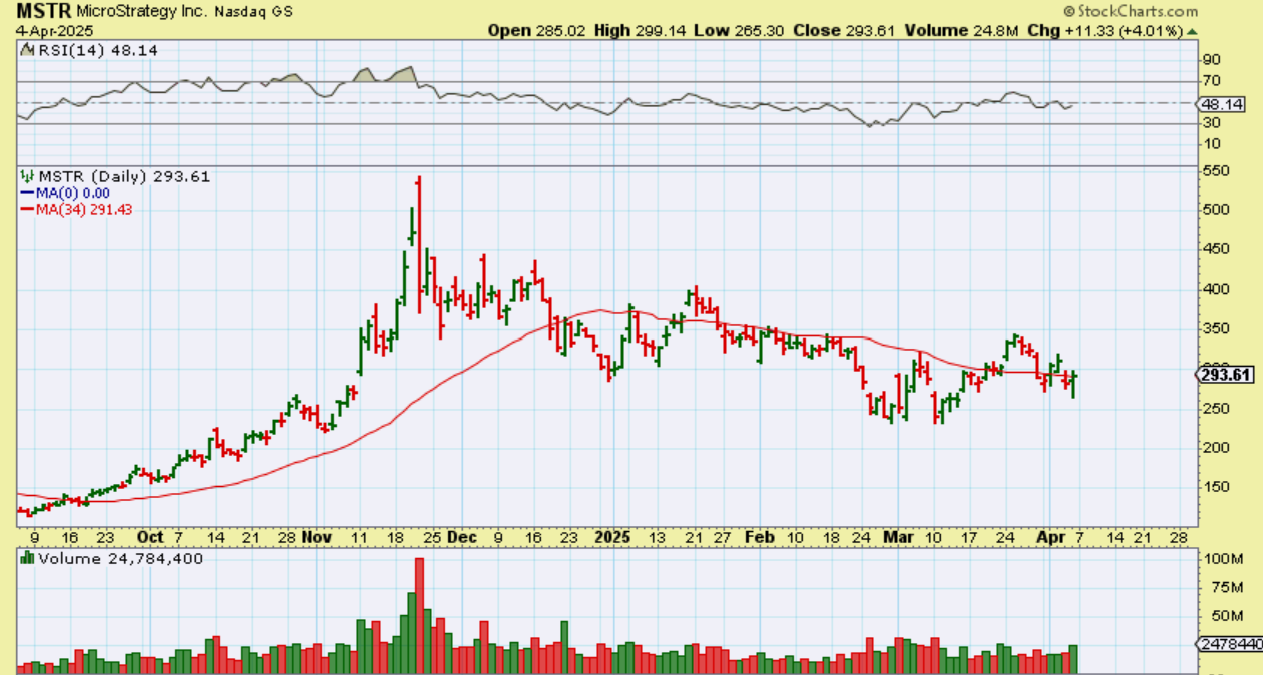
.
When you see an entire sector resisting the sell off, it is worth taking note, especially if we get a bottom or a good bounce next week.
.
We also have the ETFs that have dodged the storminess.