Tuesday March 25th
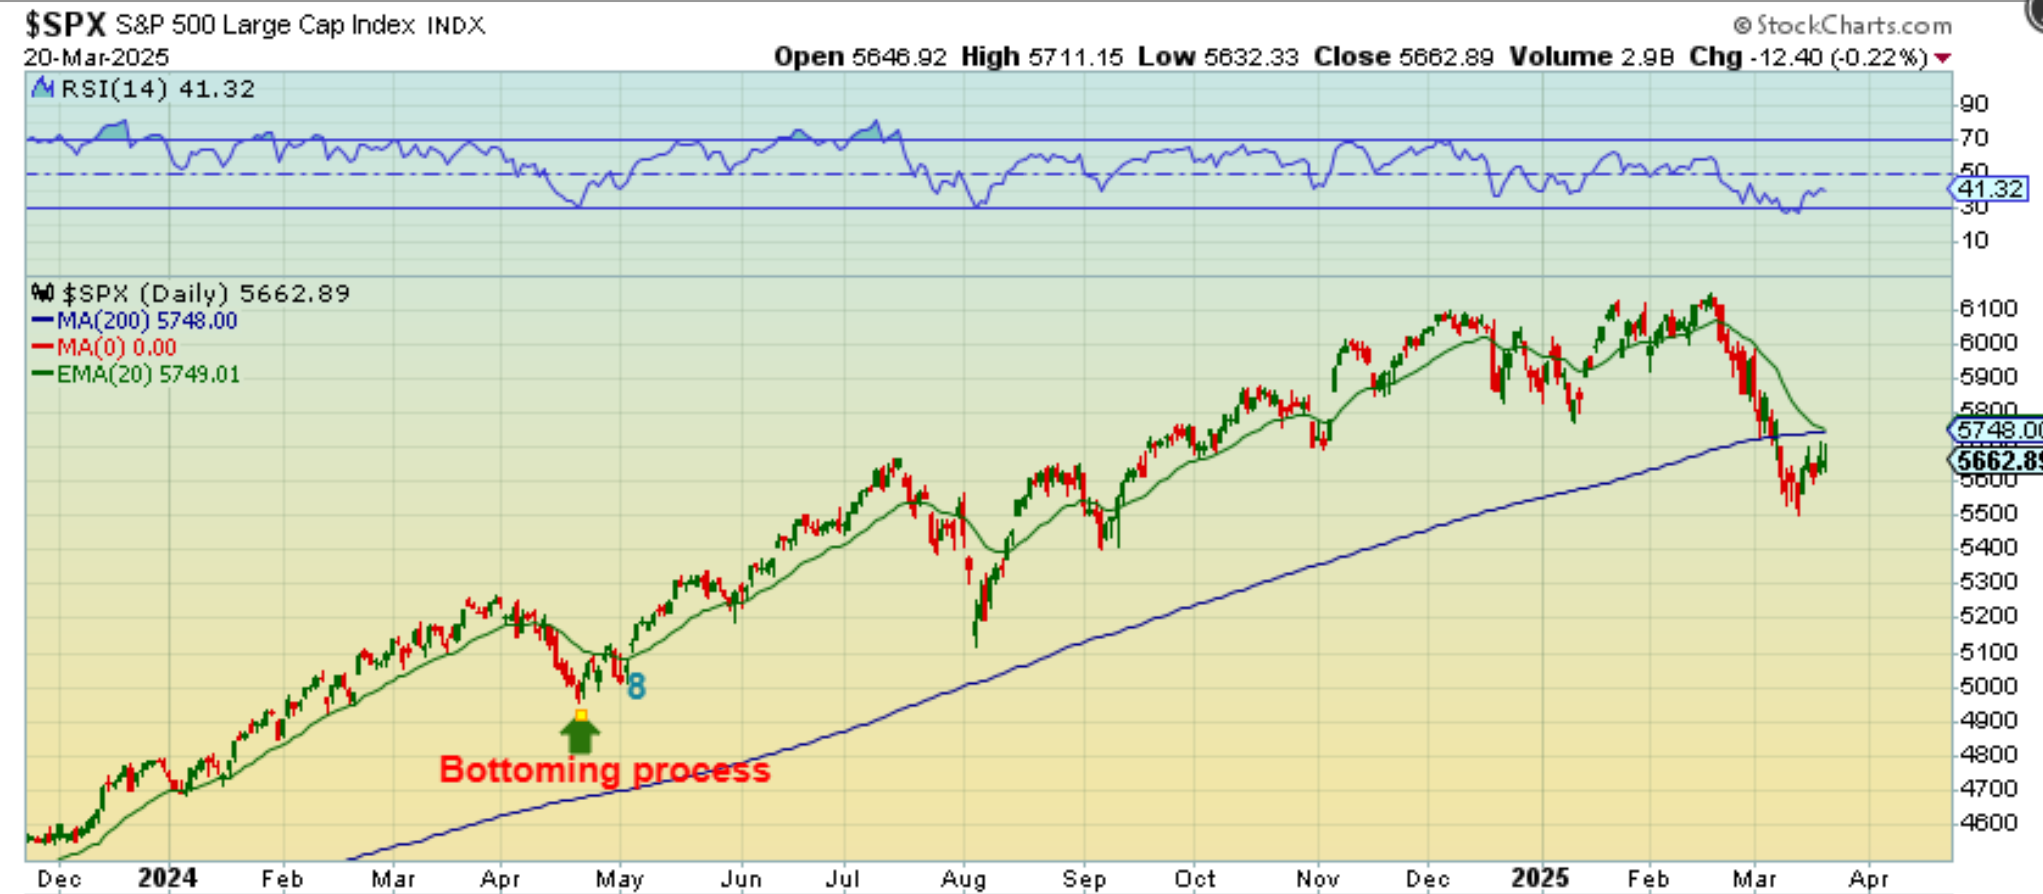
THIS WAS IN THE WEEKEND REPORT AS SOMETHING TO LOOK FOR AND HOPEFULLY FIND. A recovery of the 200sma would be a good start. I said…
The ‘bottoming process’ of April 2014. That bounced, dipped on day 4, bounced again, and dipped on day 8 before breaking higher, so there is time here to move higher, and FRIDAY was an ok day. Now we’ll just need to watch next week and see how this plays out.
.
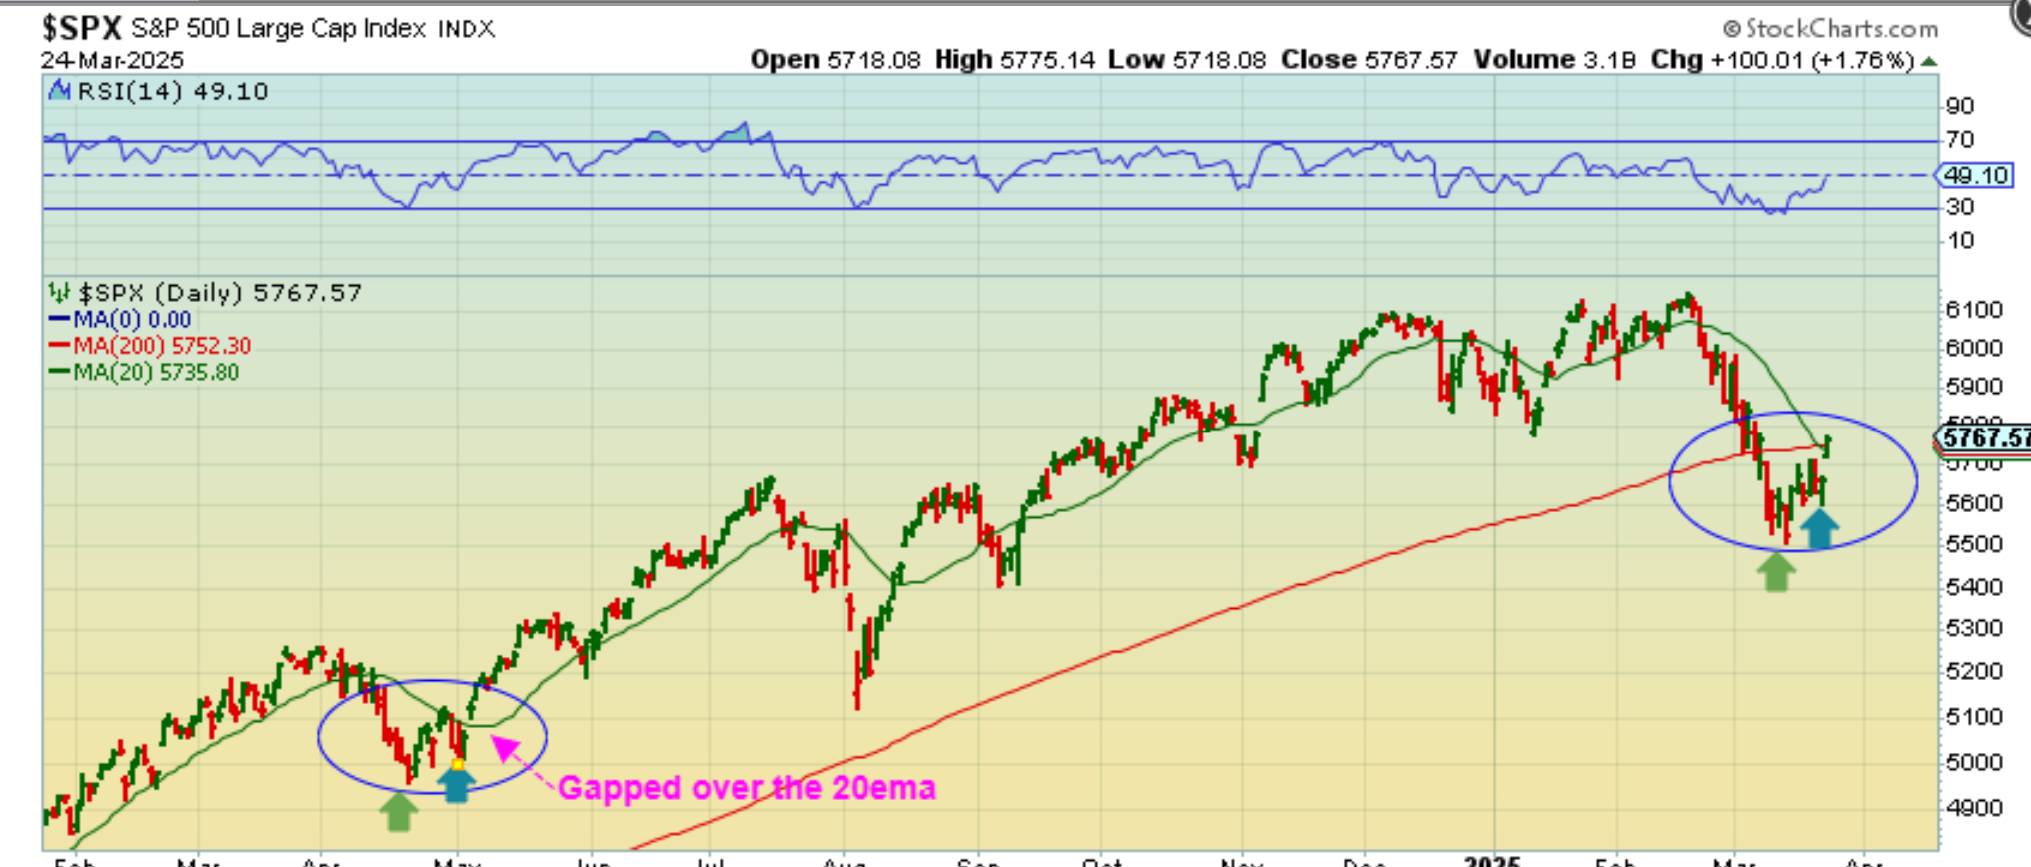
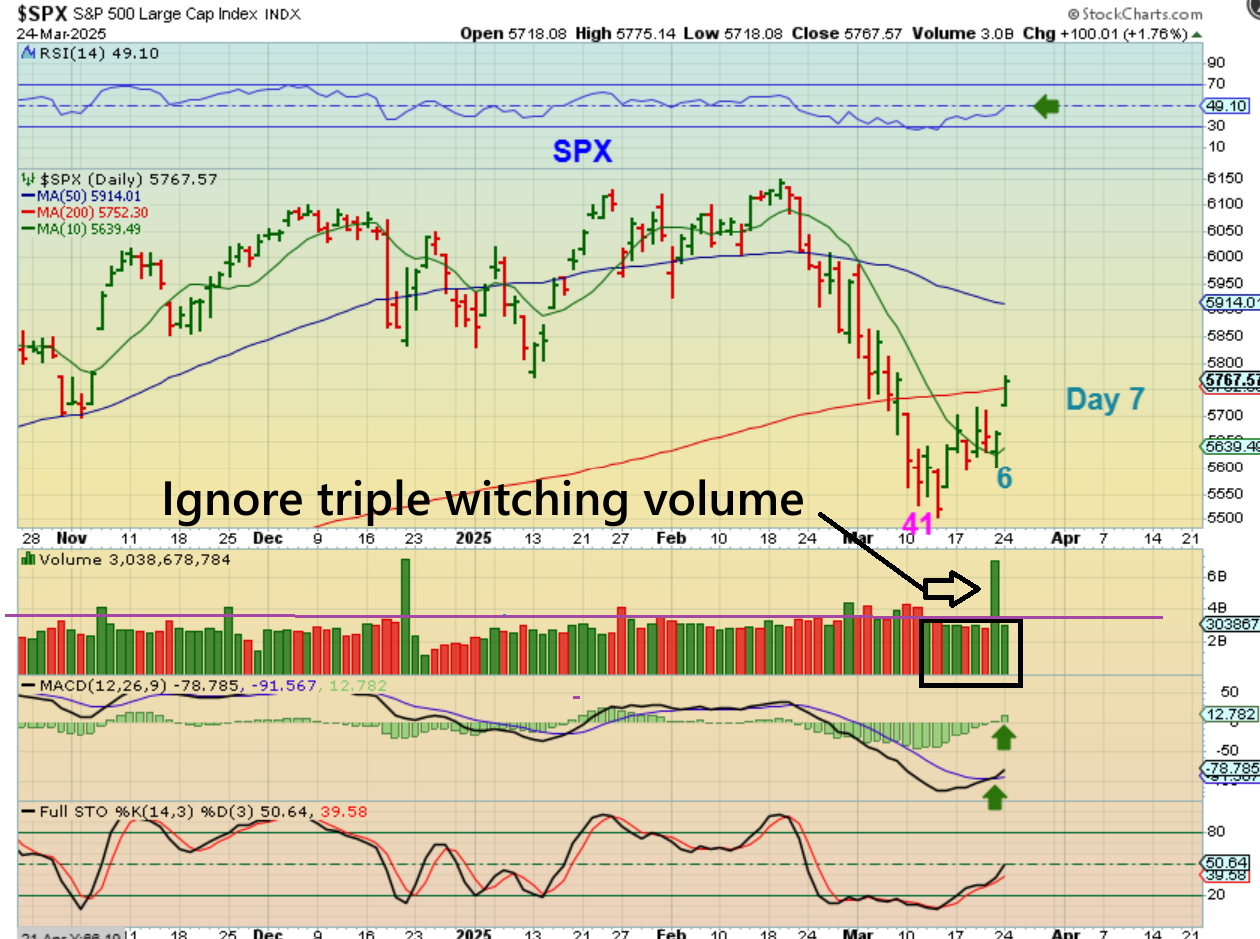
On Monday, day 7, the markets did gap up and over resistance, similar to the 2024 low. We’re off to a good start and need some follow through. 🙂
.
So on Monday day 7, The SPX started to recover the 200sma. The volume was good and some more follow through would be great to see if we can get it this week.
.
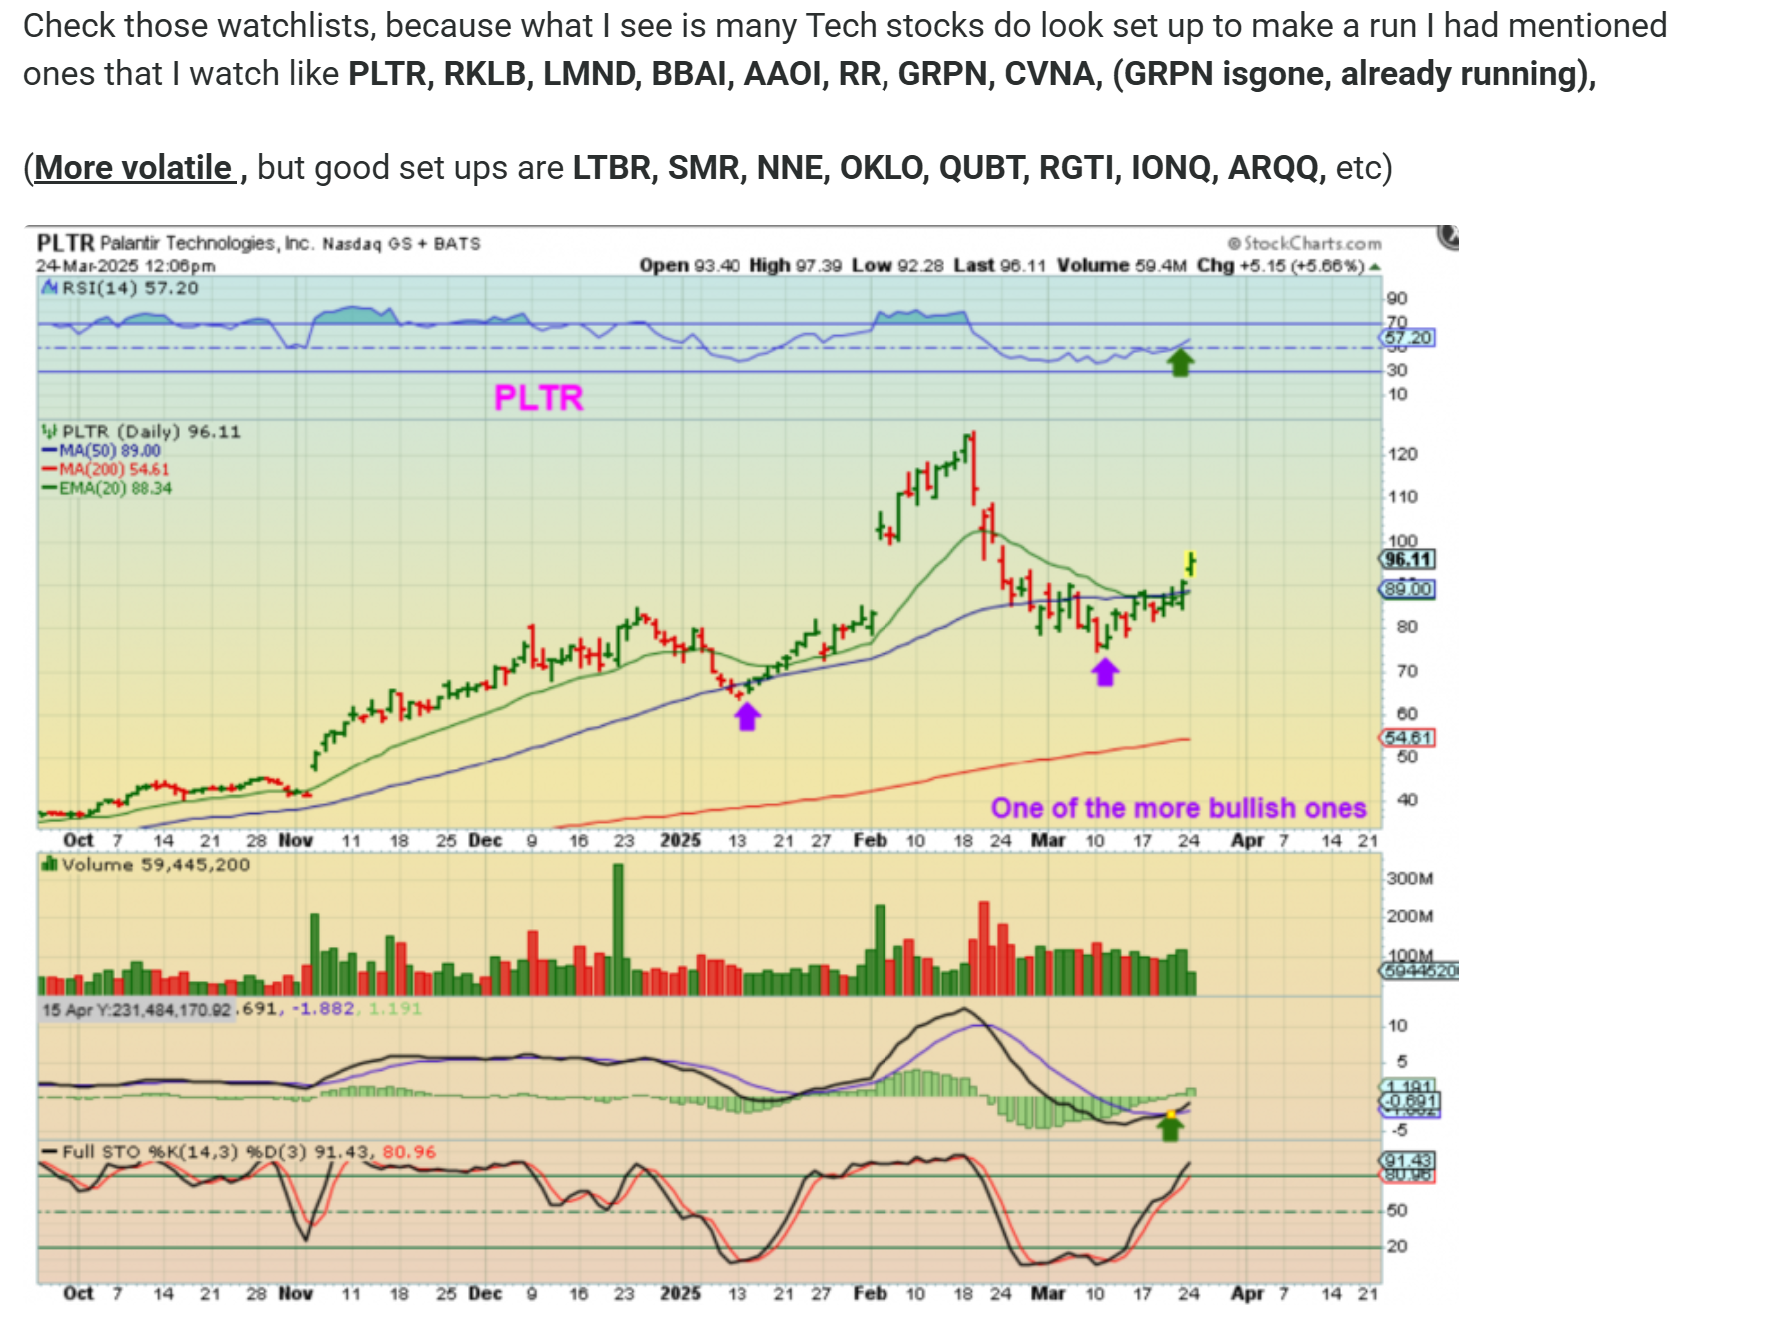
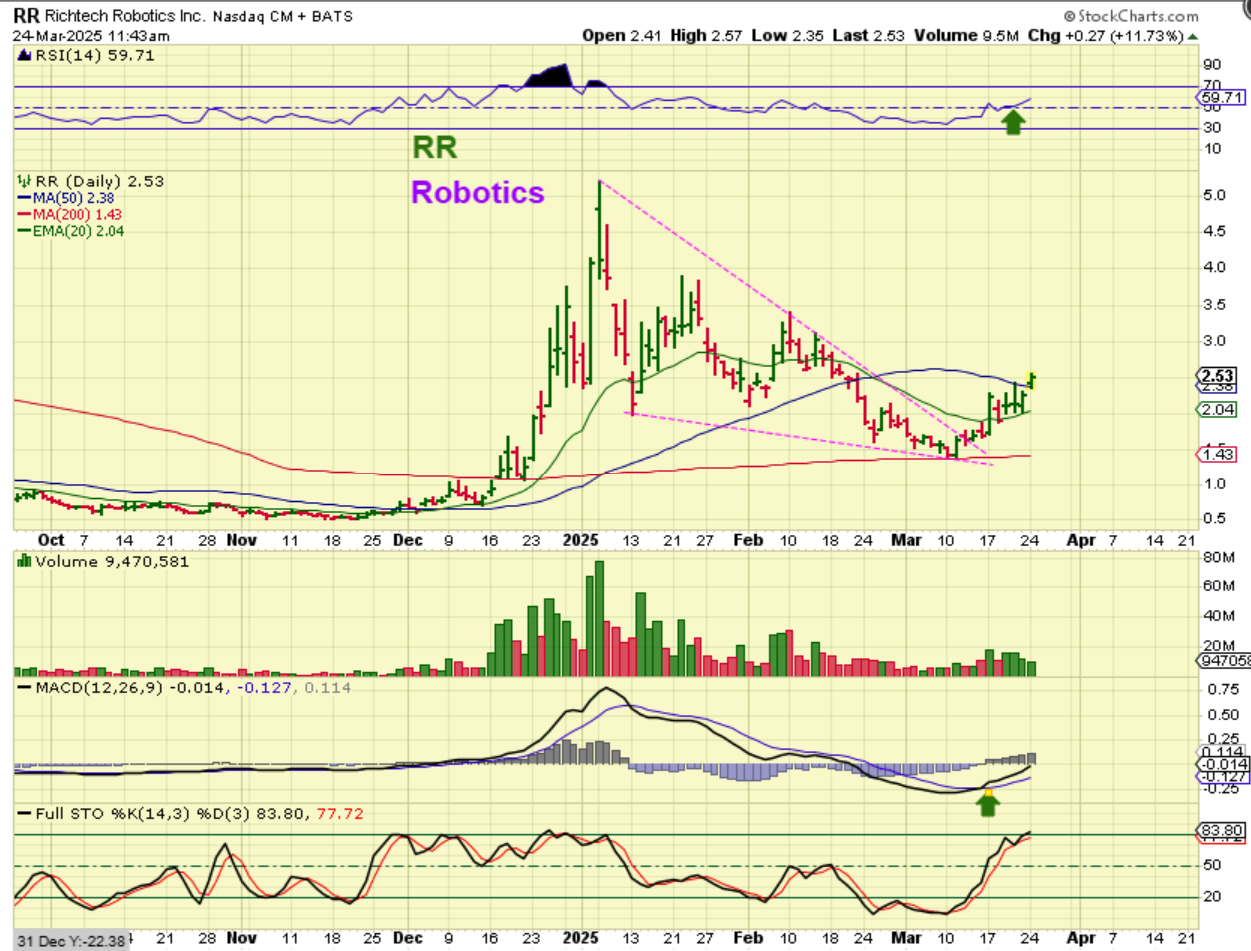
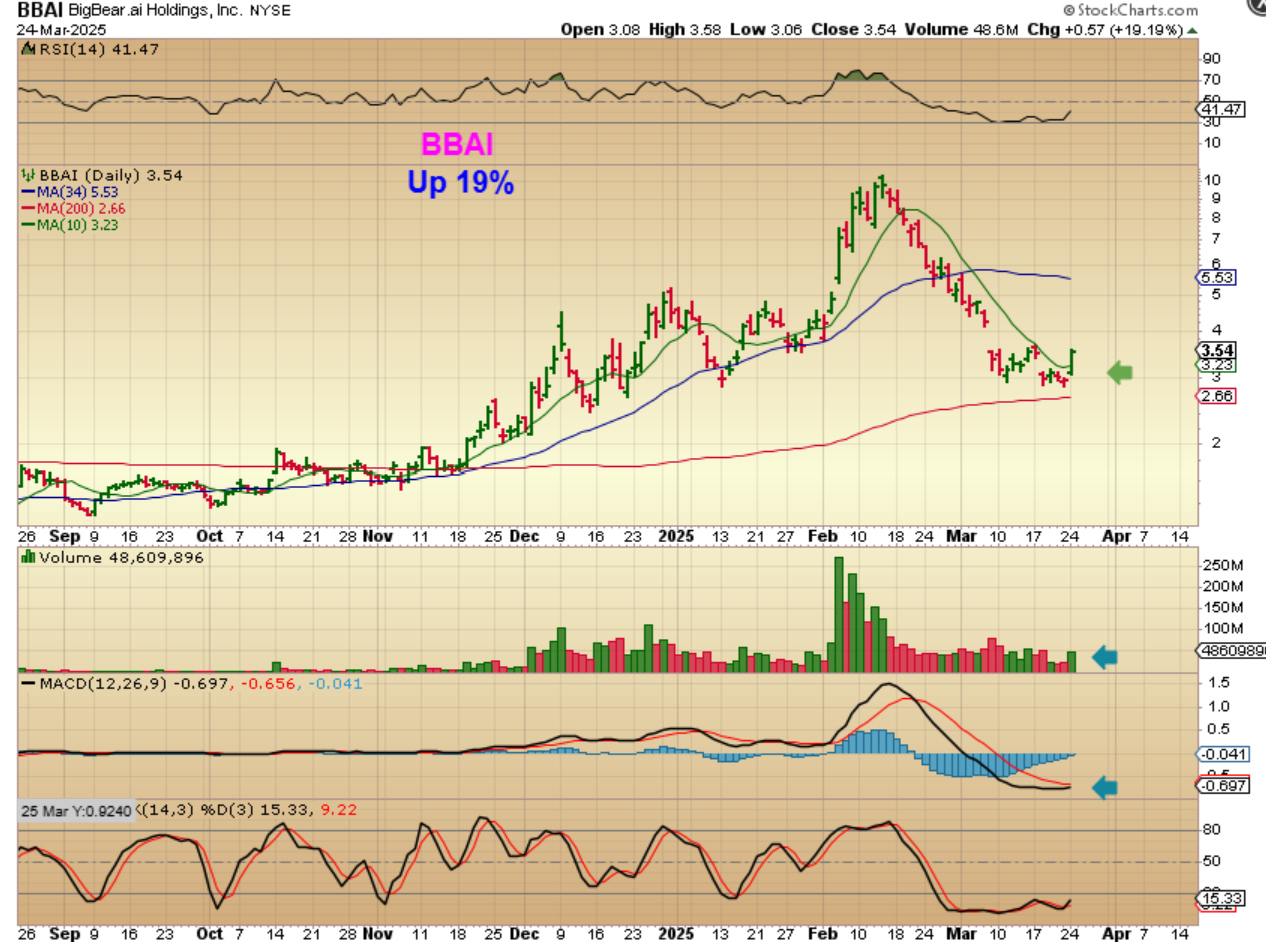
I have also mentioned in past reports that The ICL is the time to watch and even enter the past bullish performers, and I gave a few lists of the ones that I watch. You can buy these at an ICL and raise the stops too, so a quick visit to the charts and a list of some of those is below (and was in the Commenting section Monday).
.
.
RR was up again, and it popped up over the 50 sma and closed up over 15%. This is almost up 100% from the reversal at the 200sma. Very nice.
.
BBAI has been bottoming and so today was the first day out of the lows for BBAI, but it was a big move and in the past this was a big mover. BBAI was up 19%. The Ticker ‘AI” has also moved from $20.50 to $23.50 recently, so AI is perking up.
.
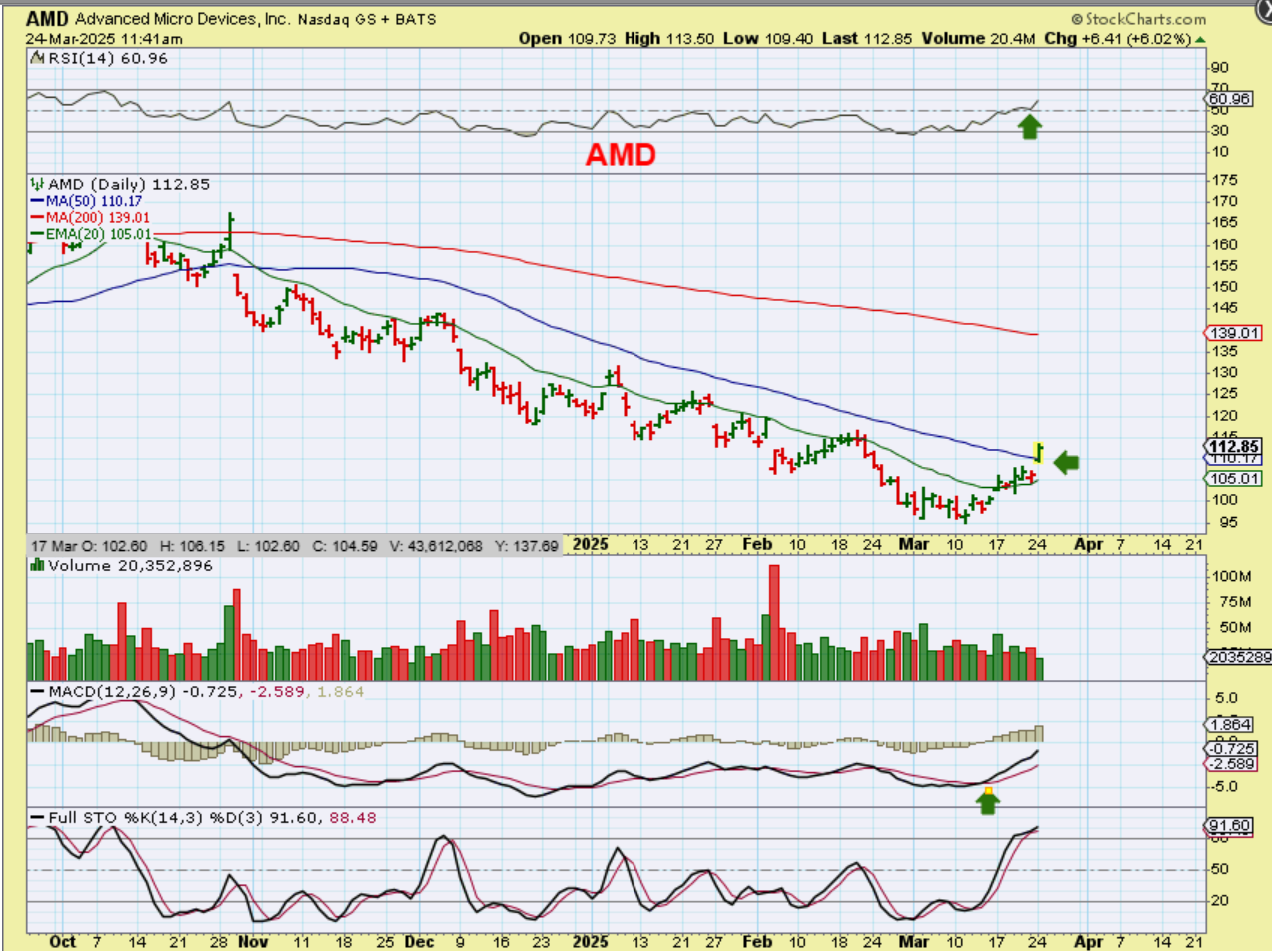
AMD gapped over the 50sma and that is bullish. It closed up a little higher at up 7% and it may be ready to run.
.
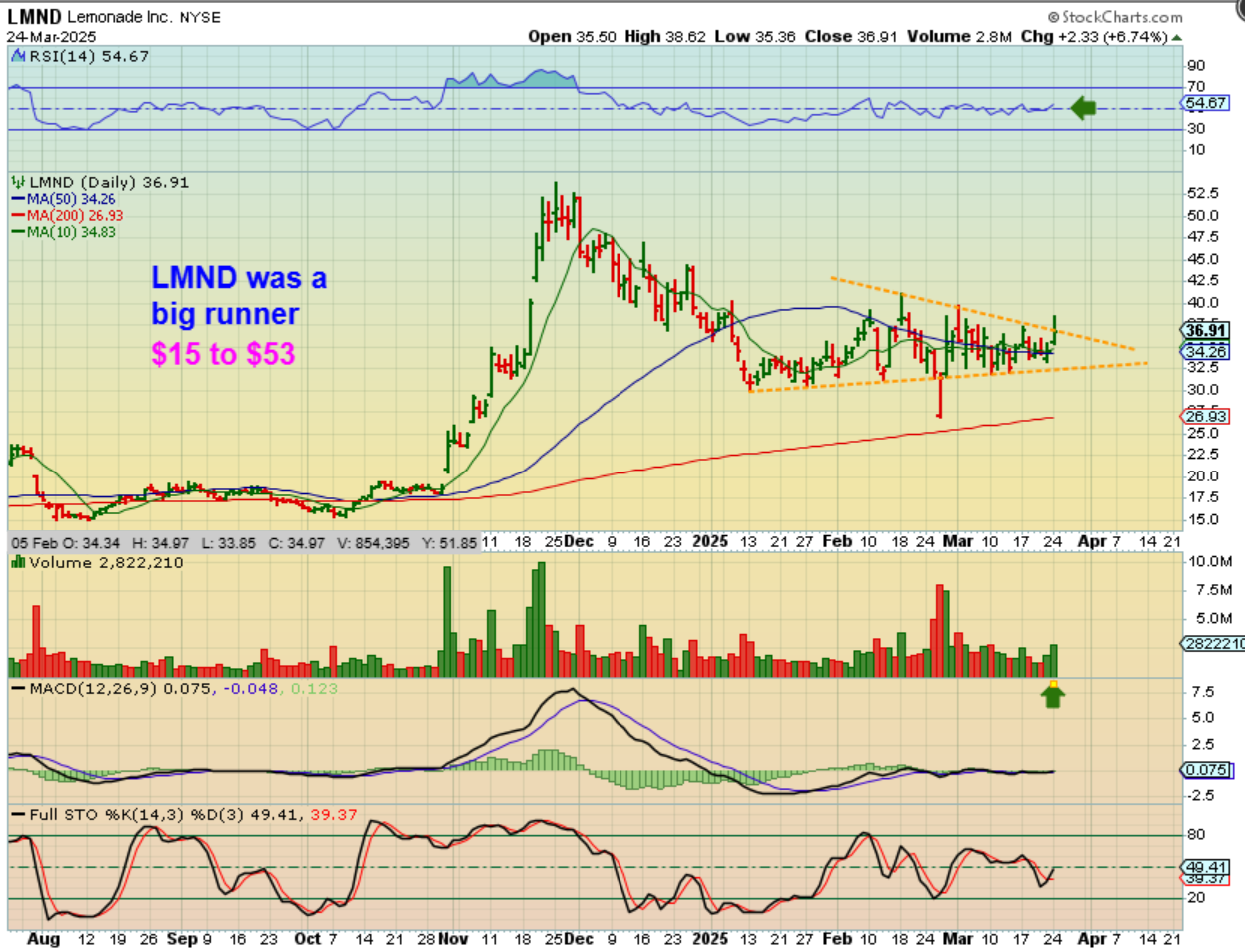
LMND used to make big moves and so far it is chopping sideways basing out, so this may be getting ready to run too. It is important to note here that LMND doesn’t look like it has been selling off with the markets in February and March. It resisted the ICL drop.
.
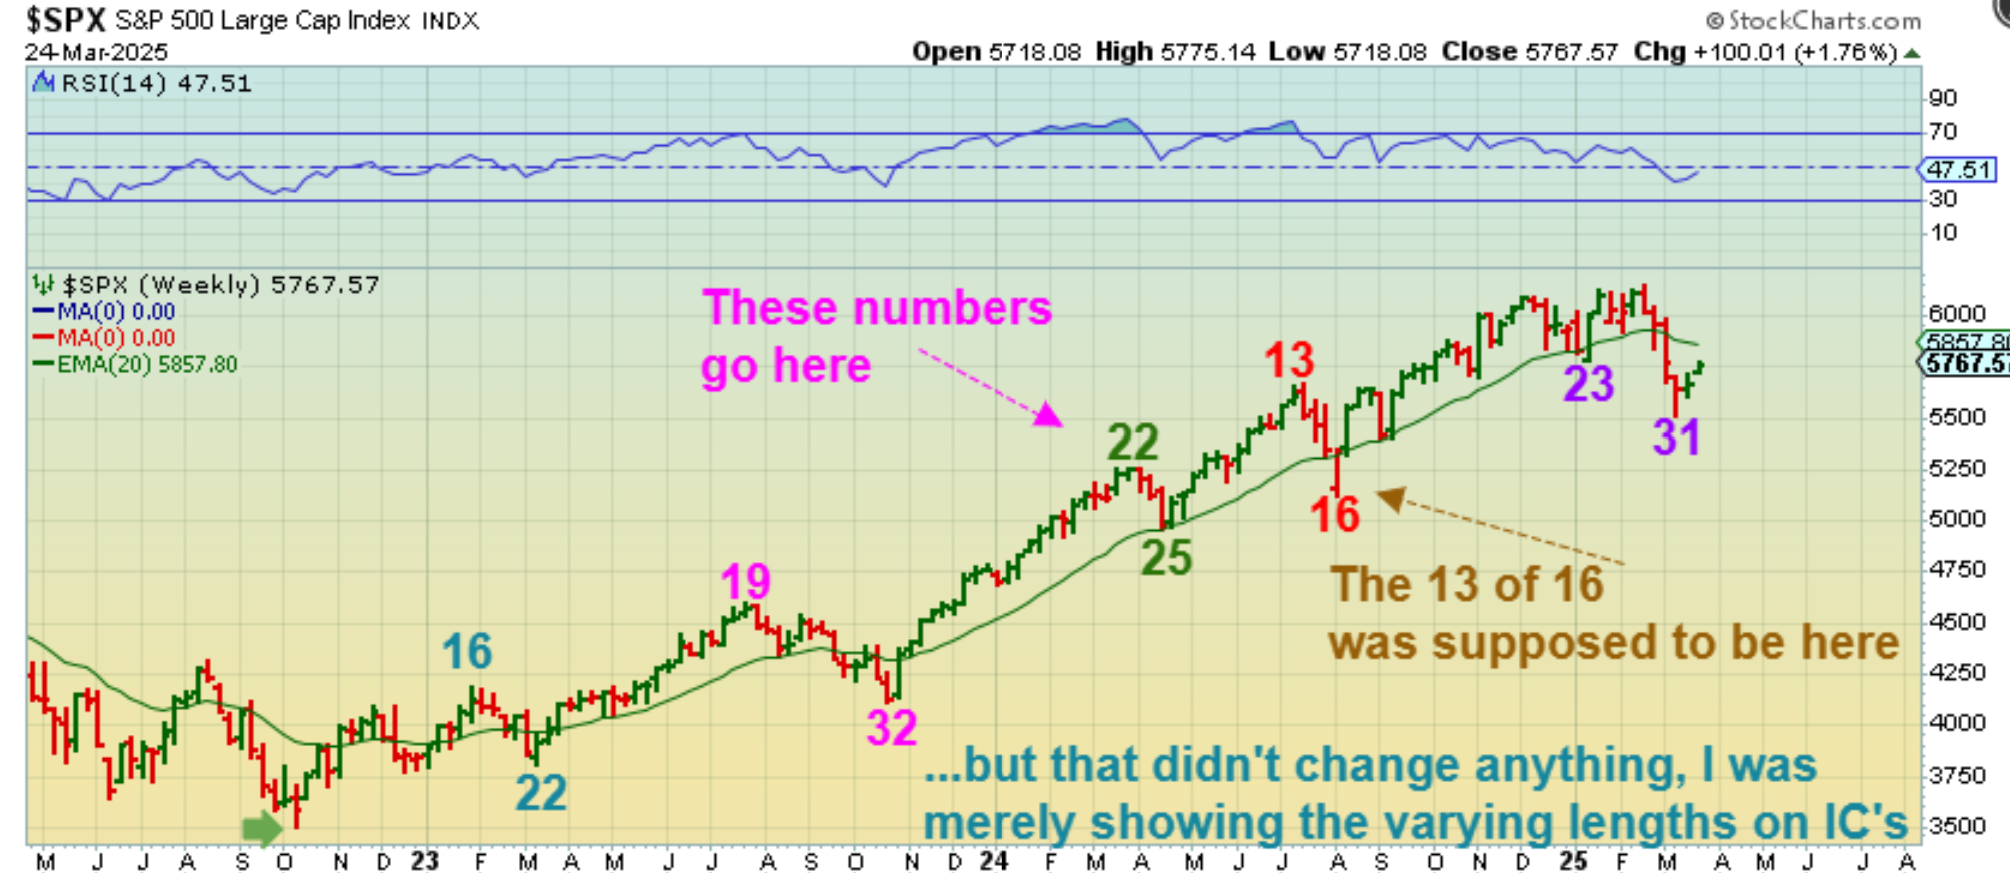
I want to revisit a chart from my weekend report, because I was asked a question about it.
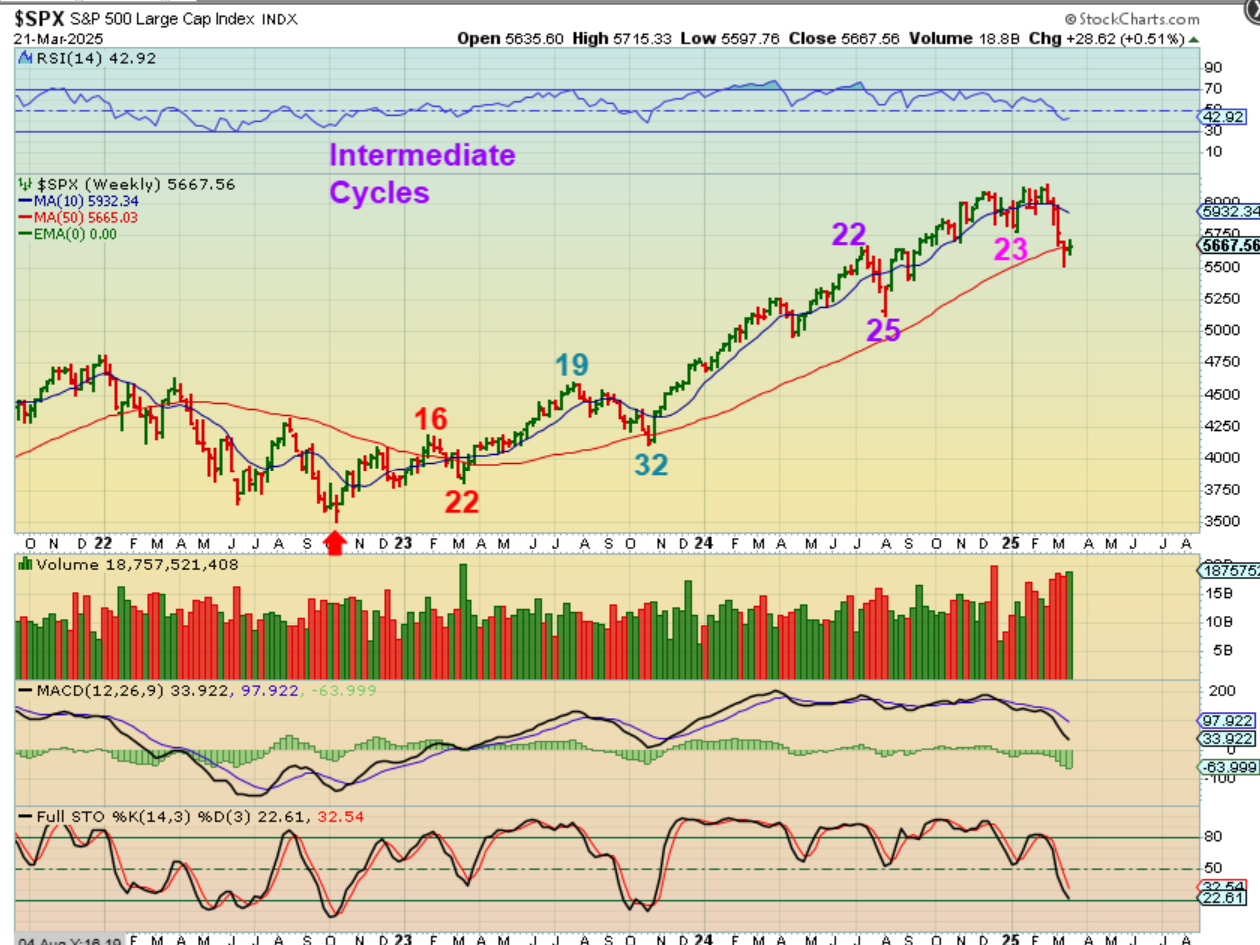
I used this Weekly Chart of the SPX simply to show that we can have long IC’s and short IC’s. Where I drew a week 22 peak and a 25 week low is actually where a 13 week peak and 16 week low. So take the #22 & #25 and shift it back to the prior ICL (That I accidentally left unnumbered) …
.
That 22 week and 25 week mark is correct here, and then it was followed by a short 13 peak, 16 ICL.
That doesn’t change anything, I was trying to show how we can have long and short IC’s. I had counted out the number of weeks using my phone & wrote it on paper to add to the charts later (I cannot annotate charts on my phone). I then added it the chart when at my computer later, so I simply put it in the wrong place by accident. This chart still shows Long and Short IC’s.
.
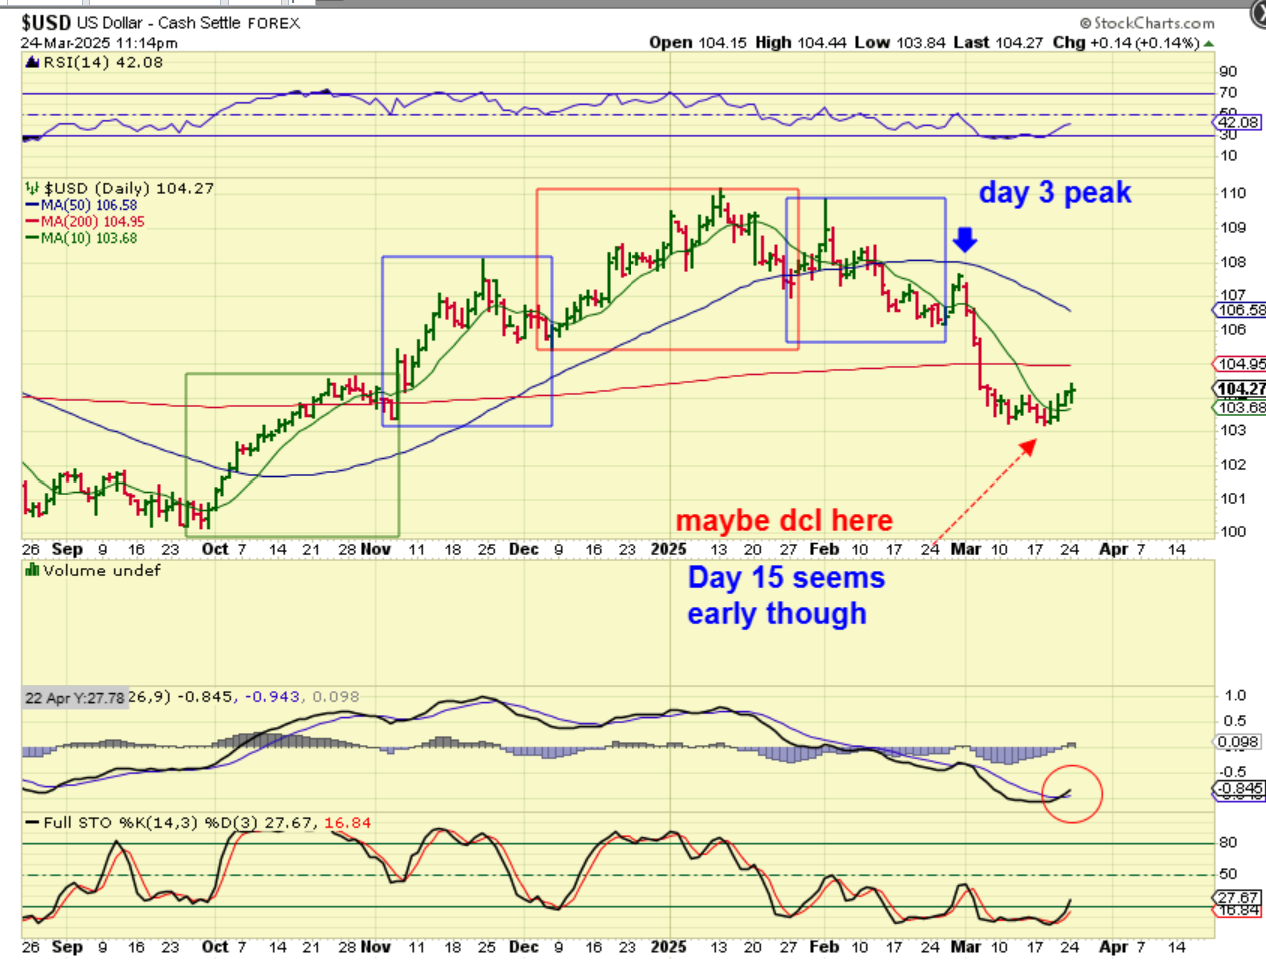
THE USD:
We see 4 daily cycles with an ICL sell off in play. We now possibly have a dcl in place (it does seem a little early at day 15 though, but it could be). When we get that dcl, we then need to see if it is an ICL, because we would be in the fifth daily cycle if this count is right.
.
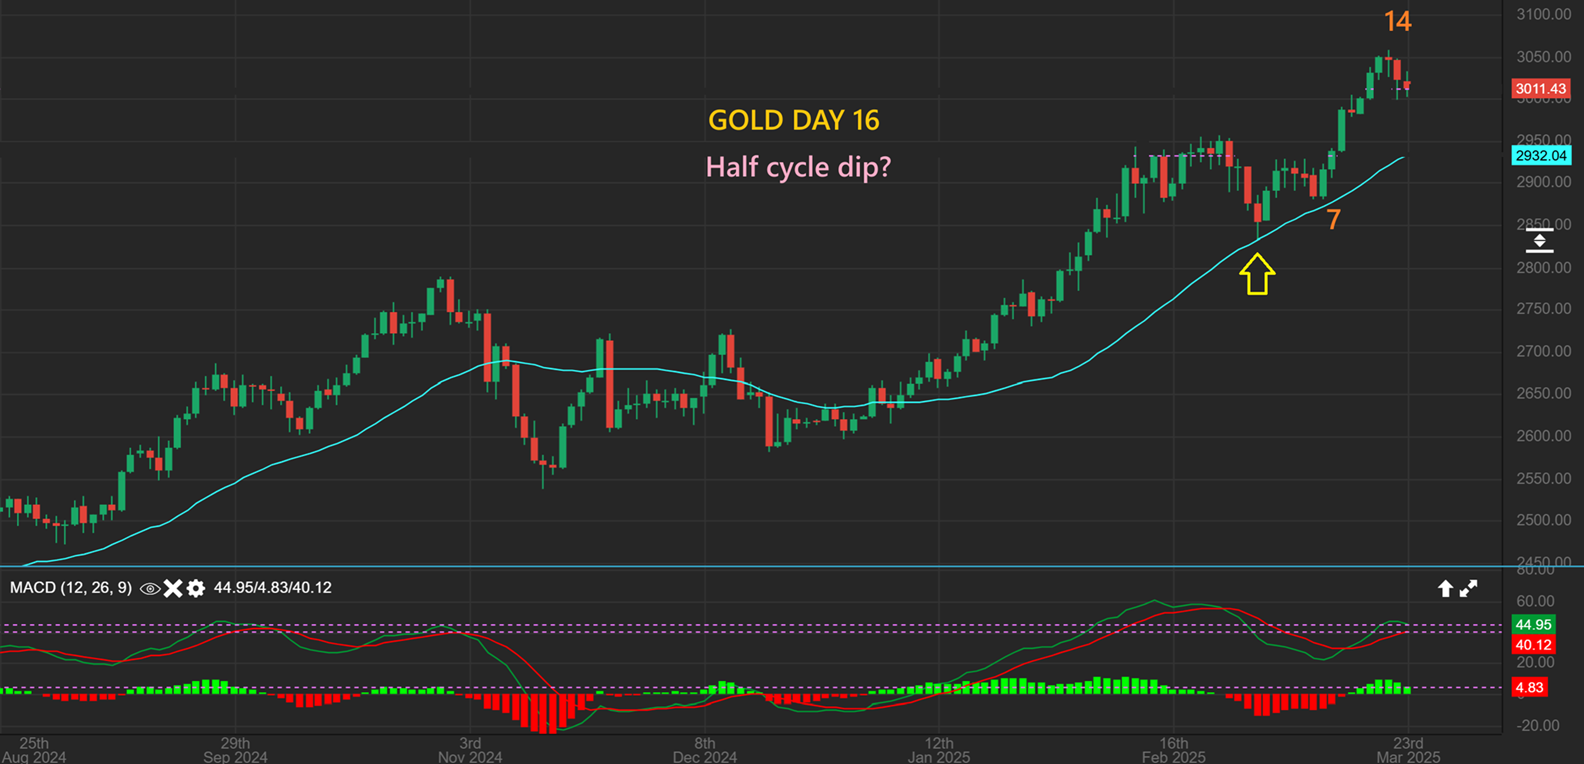
GOLD has peaked on day 14 and traded lower on day 15 & 16. We may simply be dipping into a half cycle low or we could be peaking here because we are now 4 months away from the Nov lows. I had a $3040 target months ago and we just hit around $3050. Those kinds of targets can extend though, so this could do a half cycle dip and then continue higher too, there is no way to know for sure. I also pointed out…
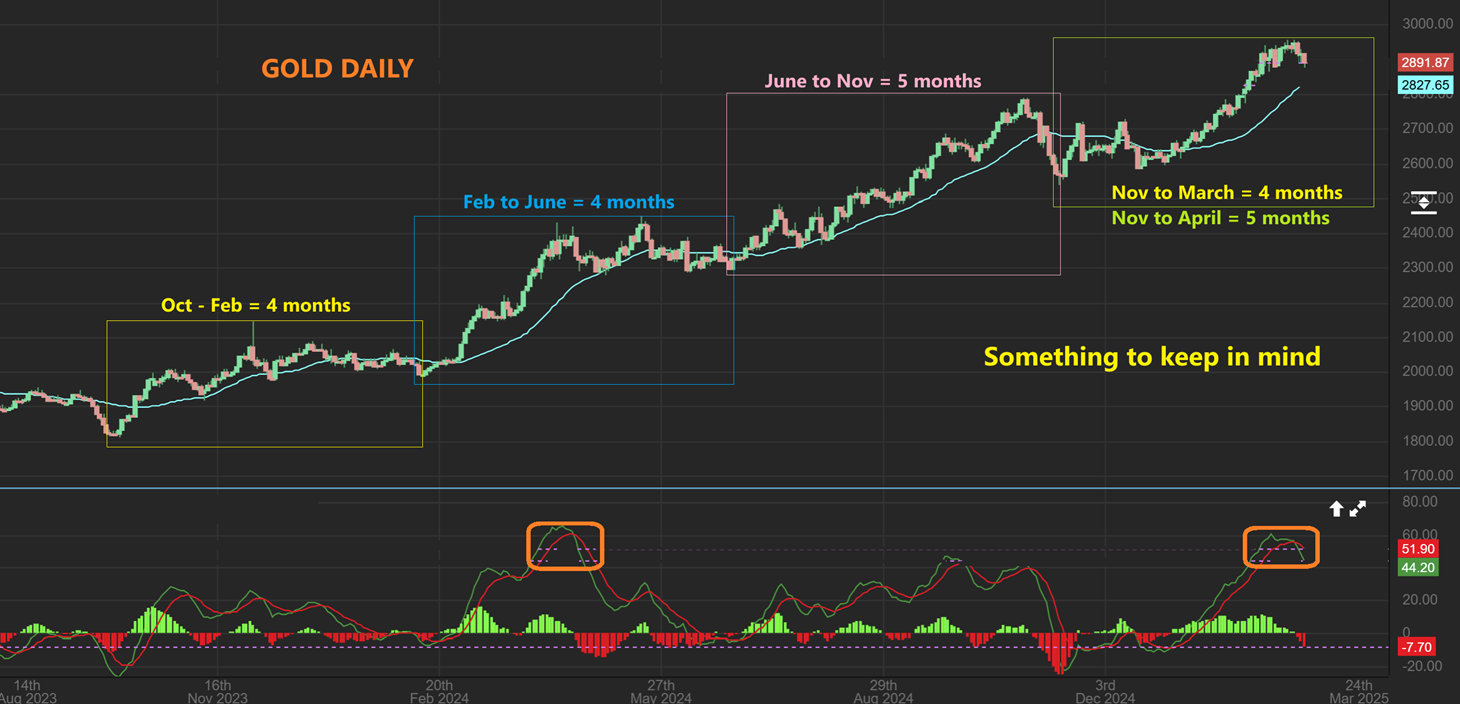
I also pointed out that ‘time period’ with this chart, showing that Gold often ran a 4-5 month Intermediate Cycle.
.
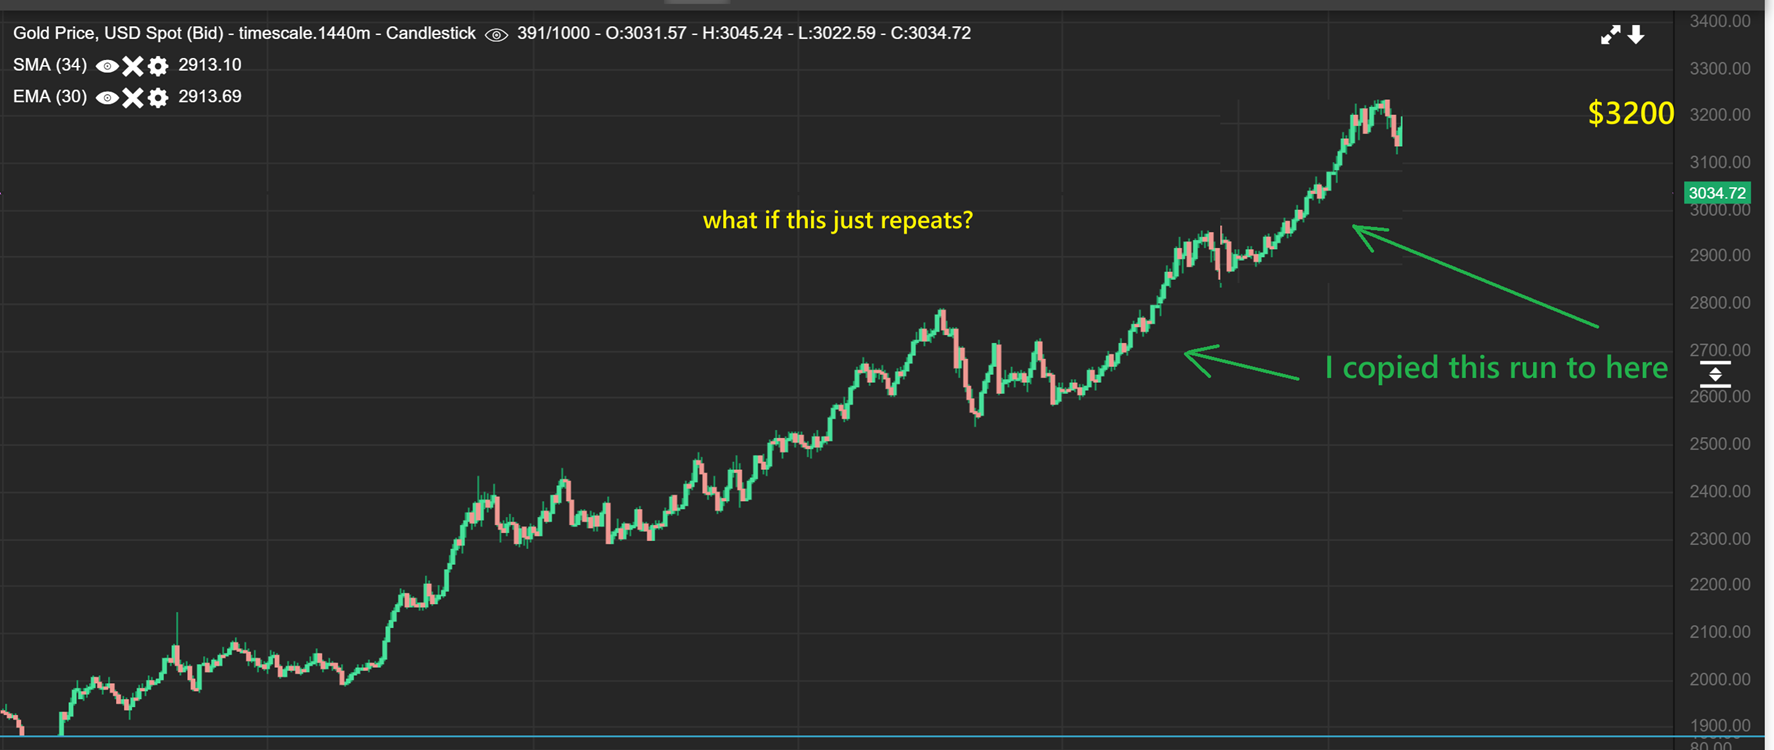
And I used this chart to add that first run on to where we are now and it had much further to run. That kind of a repeat run would push Gold much higher to over $3000, and since Gold is in a Bull Market, surprises may continue to the upside. We just have to let this play out and you can use stops on Miners near support levels or wherever you are comfortable.
.
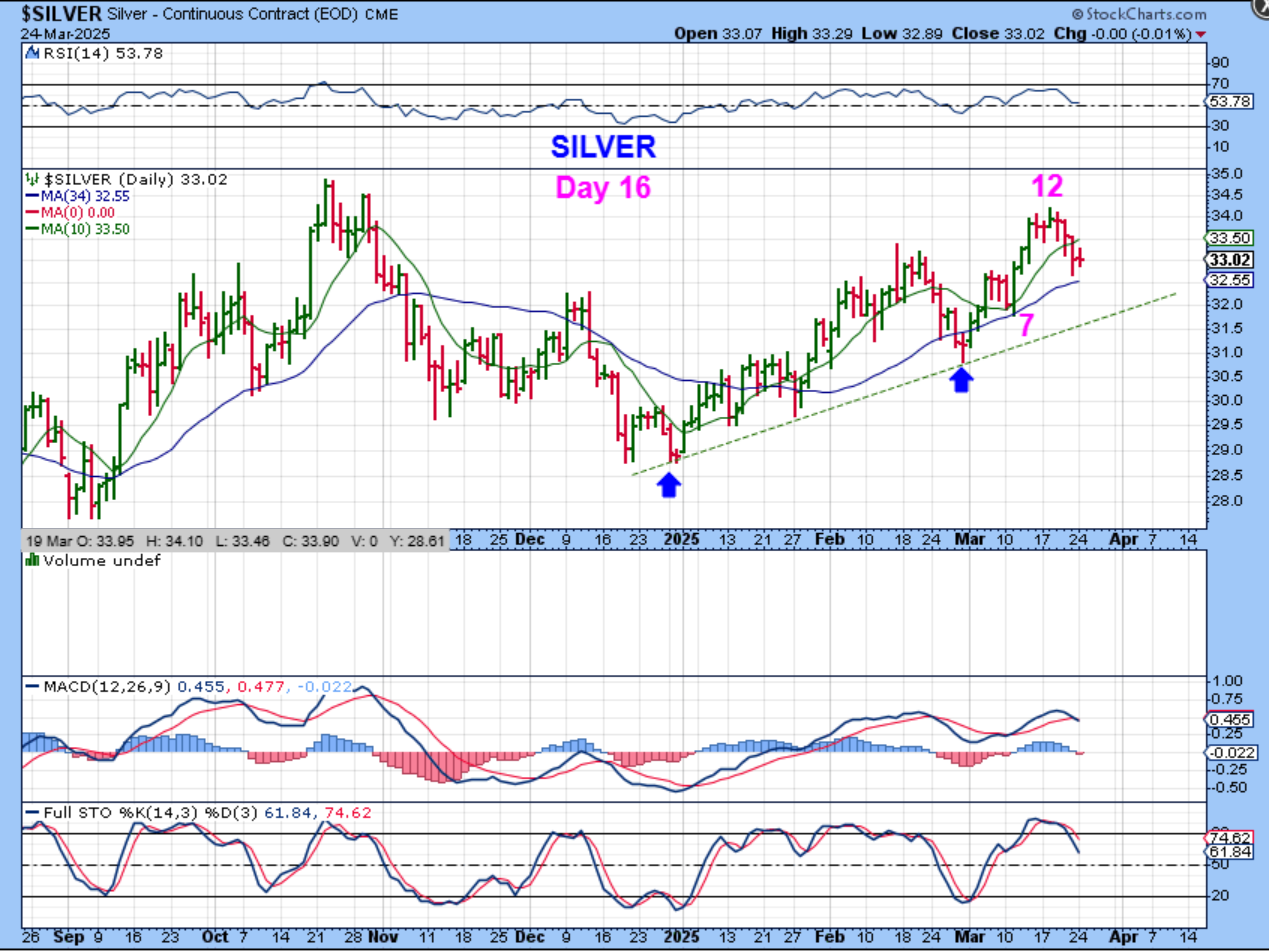
SILVER is on day 16 and has dipped to a support level of the 34 sma. Silver bottomed in December, so this is only 3 months from the ICL and it can run higher, but we’ll have to see how this plays out.
.
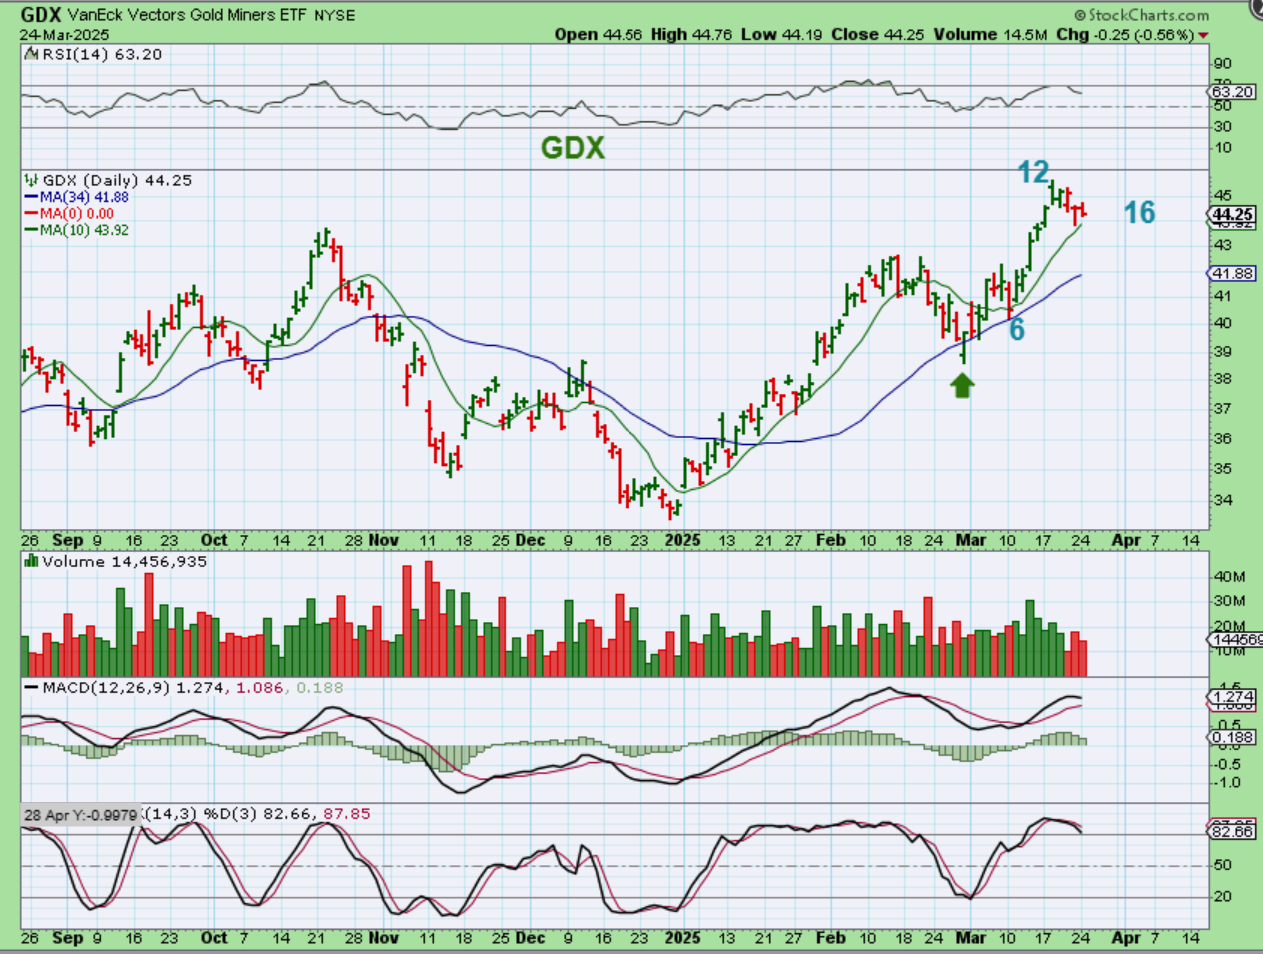
And The GDX is at the same point as Silver, but GDX is not pulling back sharply. This is a mild pullback and may be indicating that another run is ahead. This could turn into a 5 wave run from the dcl. We already see 1-2-3-4.
..
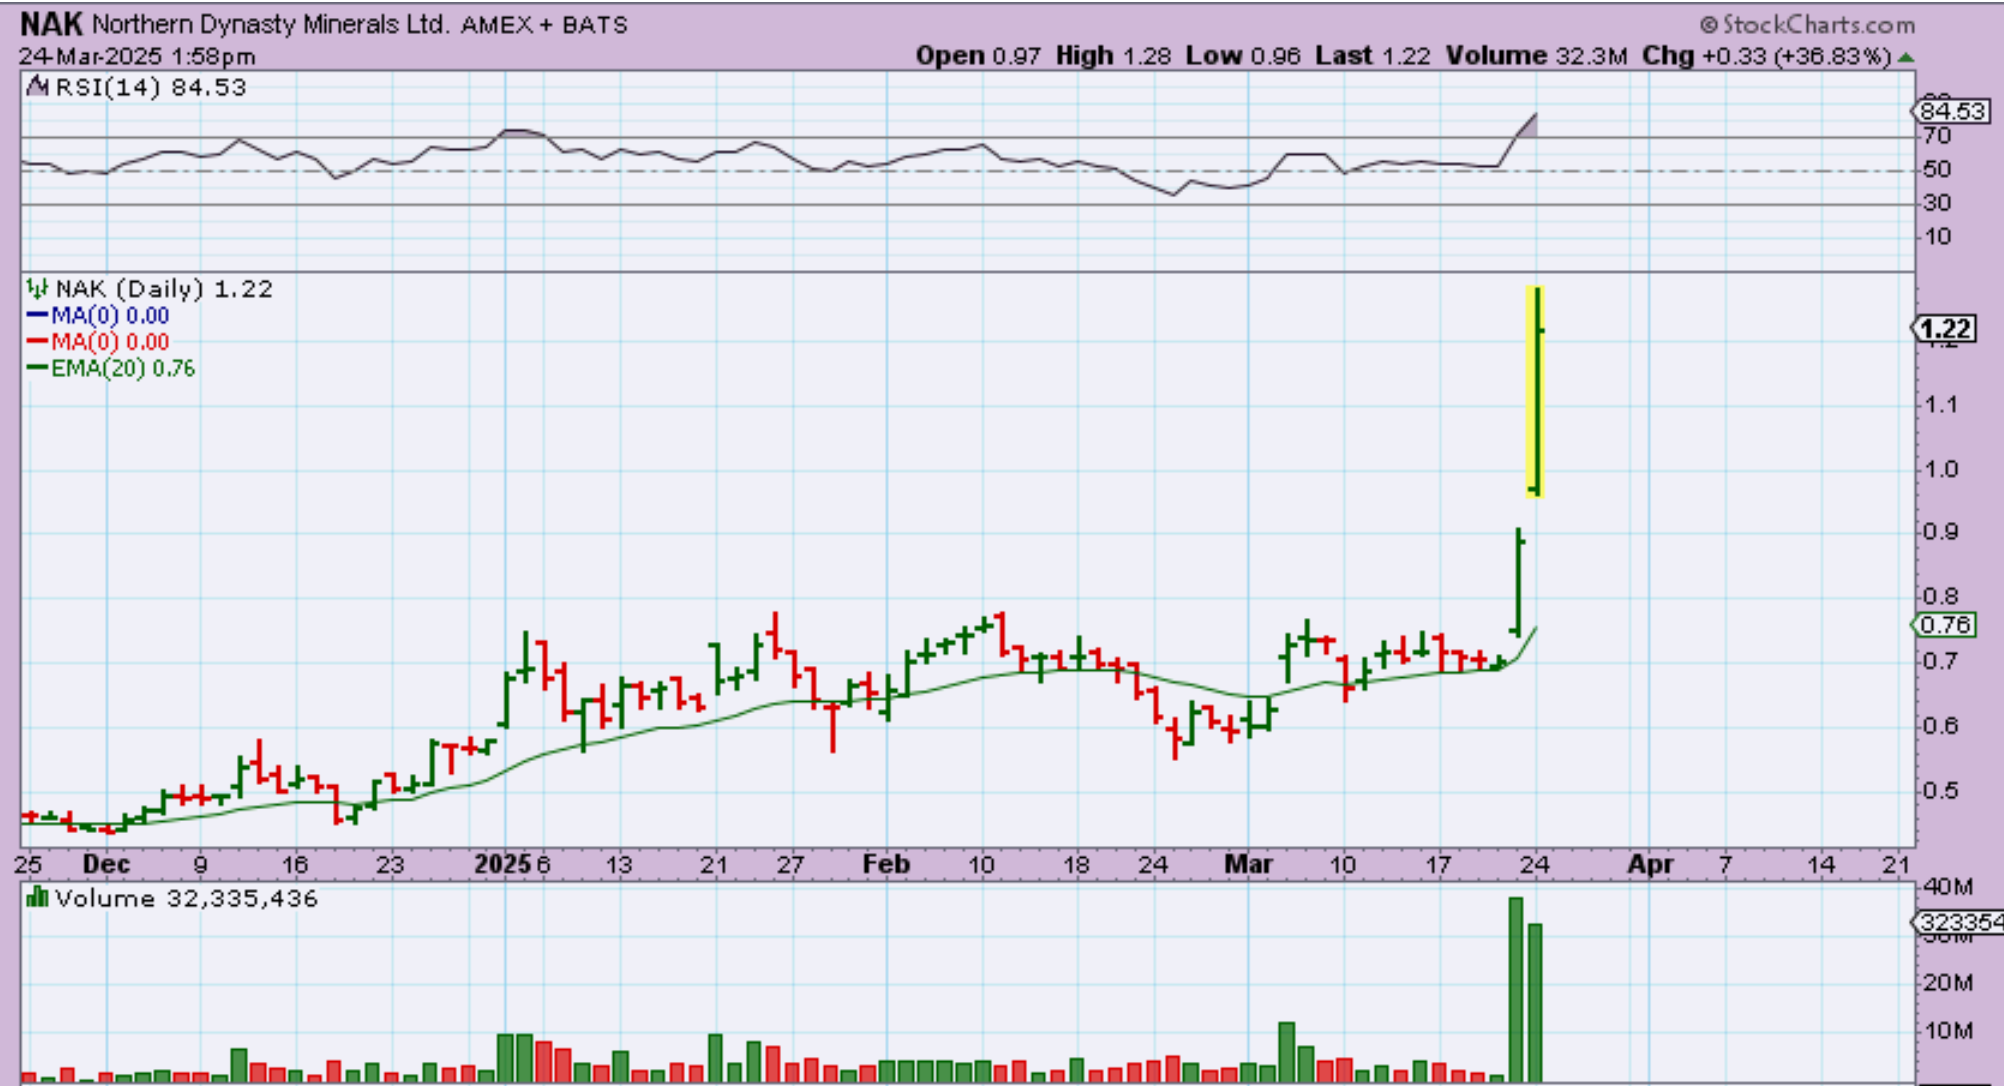
NAK popped 26% on Friday and then Popped another 40% on Monday. It closed up 30%.
..
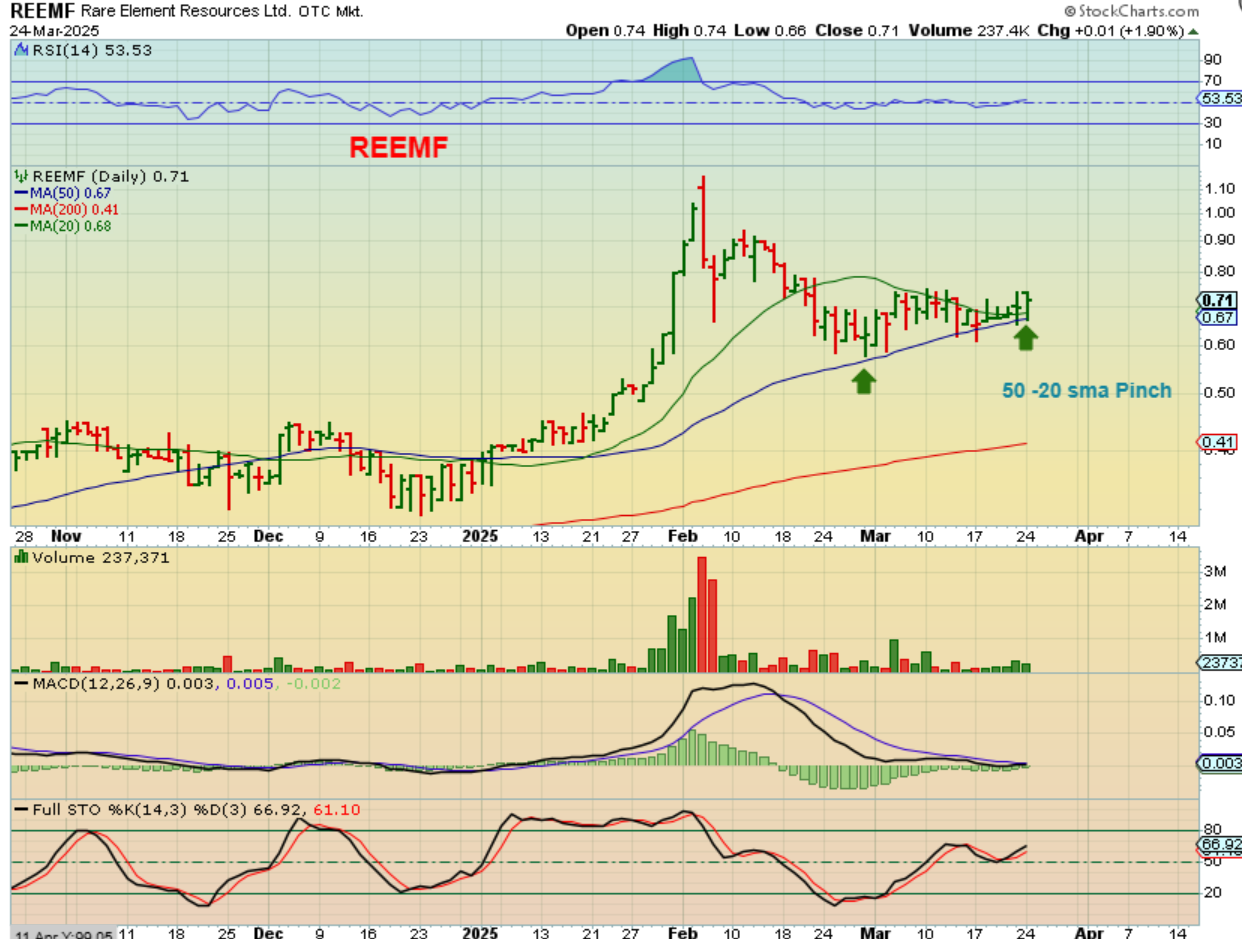
I pointed out Rare Earth Company REEMF in the comments last week. It still looks great, and it could be a ‘Buy & Hold, so I did take a position when it dropped to the 50sma again & bounced, but also…
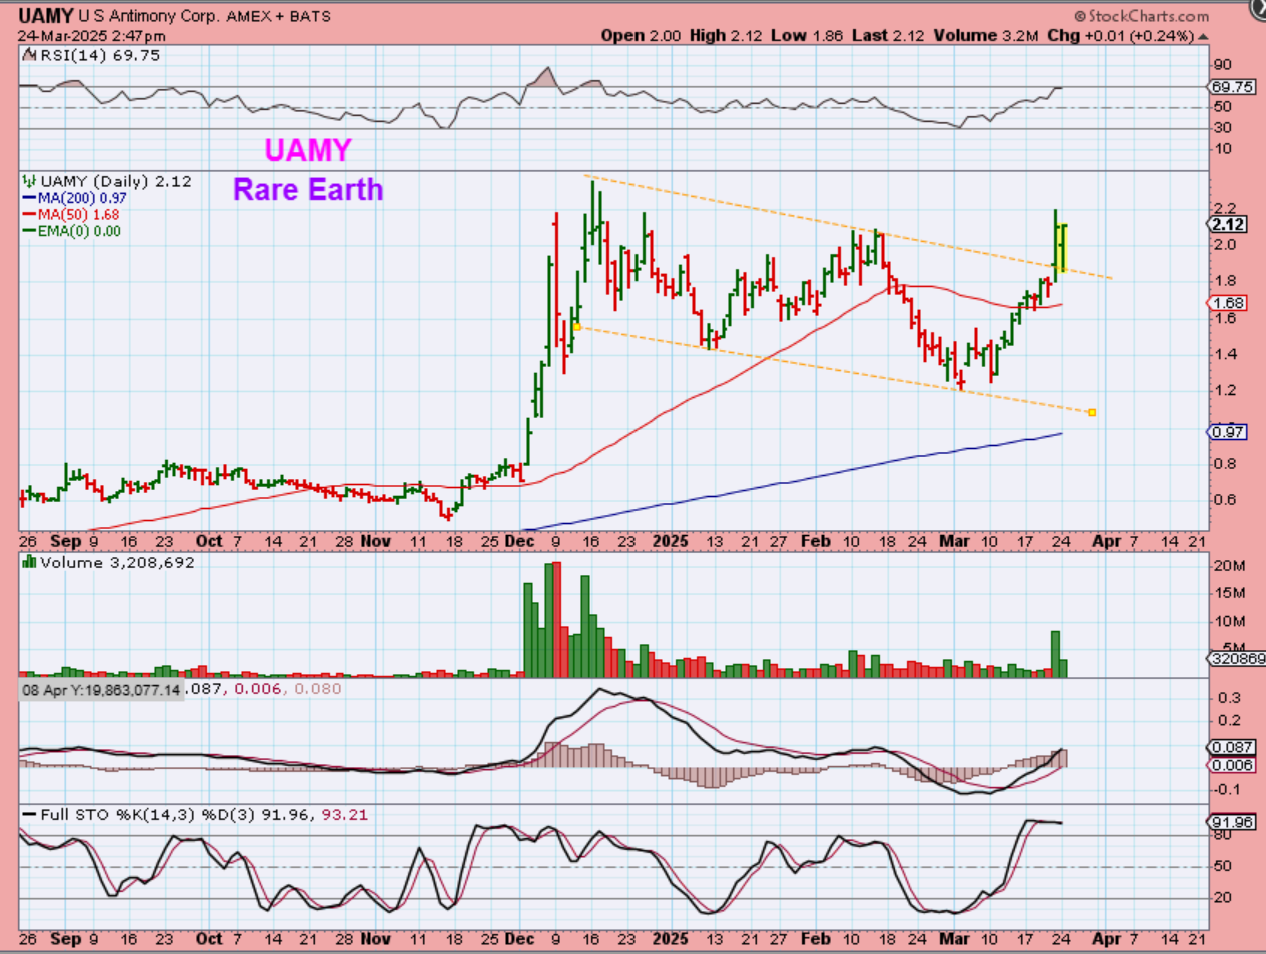
UAMY – I’m wondering if this is the next NAK. It is a rare earth stock that ran big in November-December and has been consolidation. Monday it dropped over 10% and climbed back, so I grabbed this chart.
.
I really liked what the markets did on Monday, because that choppy bottom was getting a bit concerning, masking any strength that the markets may have. Gold and Silver are pulling back mildly, but the GDX is very mild, so we could see another rally there too. Bitcoin also decided to move higher on Monday and the Crypto Stocks popped too. Now what I’d like to see is follow through, maybe some short covering & buying together to get us running, so we’ll see what Tuesday brings our way. Enjoy your Tuesday trading!
.
~ALEX
.
In the weekend report: I said…
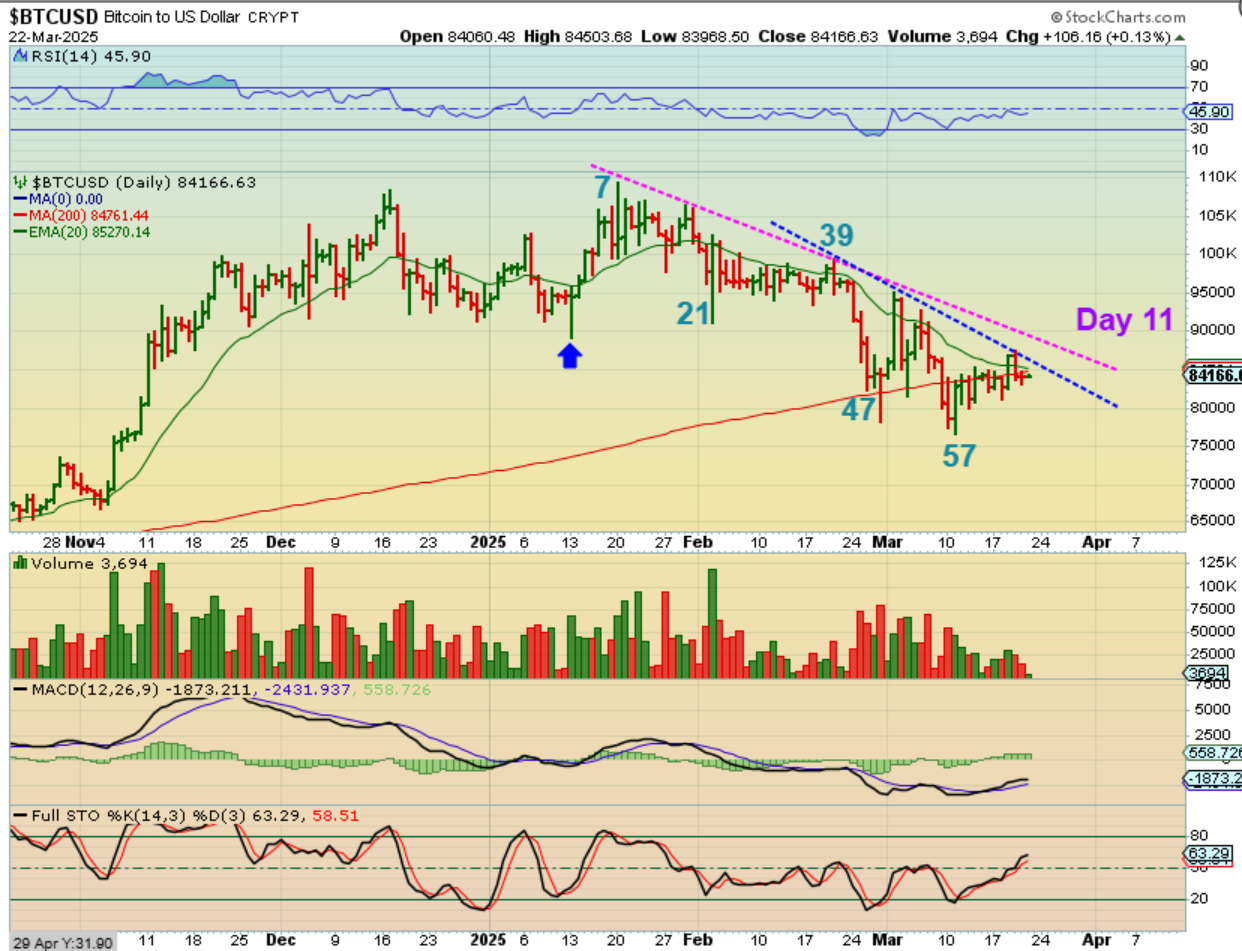
BITCOIN –
1. I have us showing a day 57 low and that it very good for the expectations of a 60 day low.
2. Bitcoin is not gaining traction yet. Is it waiting for the general markets? Possibly.
3. If it breaks these downtrend lines and closed above the 20 ema, I expect it to start running higher
.
BITCOIN moved higher on Monday and pushed above that 200sma and the 20 ema. Let’s zoom in…
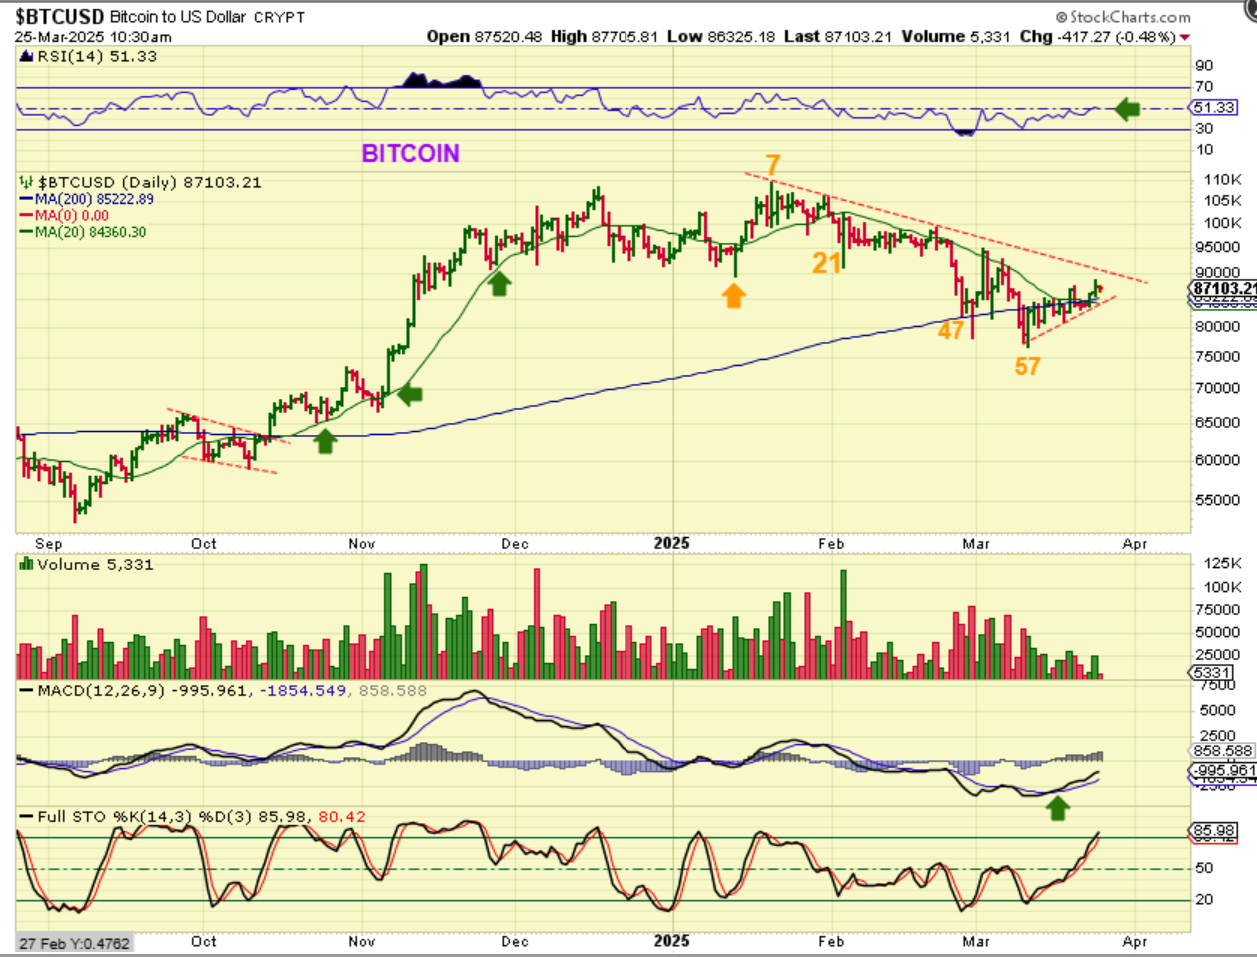
.
BITCOIN is above the 20 ema and is on day 14 today, so that is 14 of a possible 60 day run. We have a lot of ‘time’ to make good gains if Bitcoin decides to run higher and leave this choppiness behind.
.
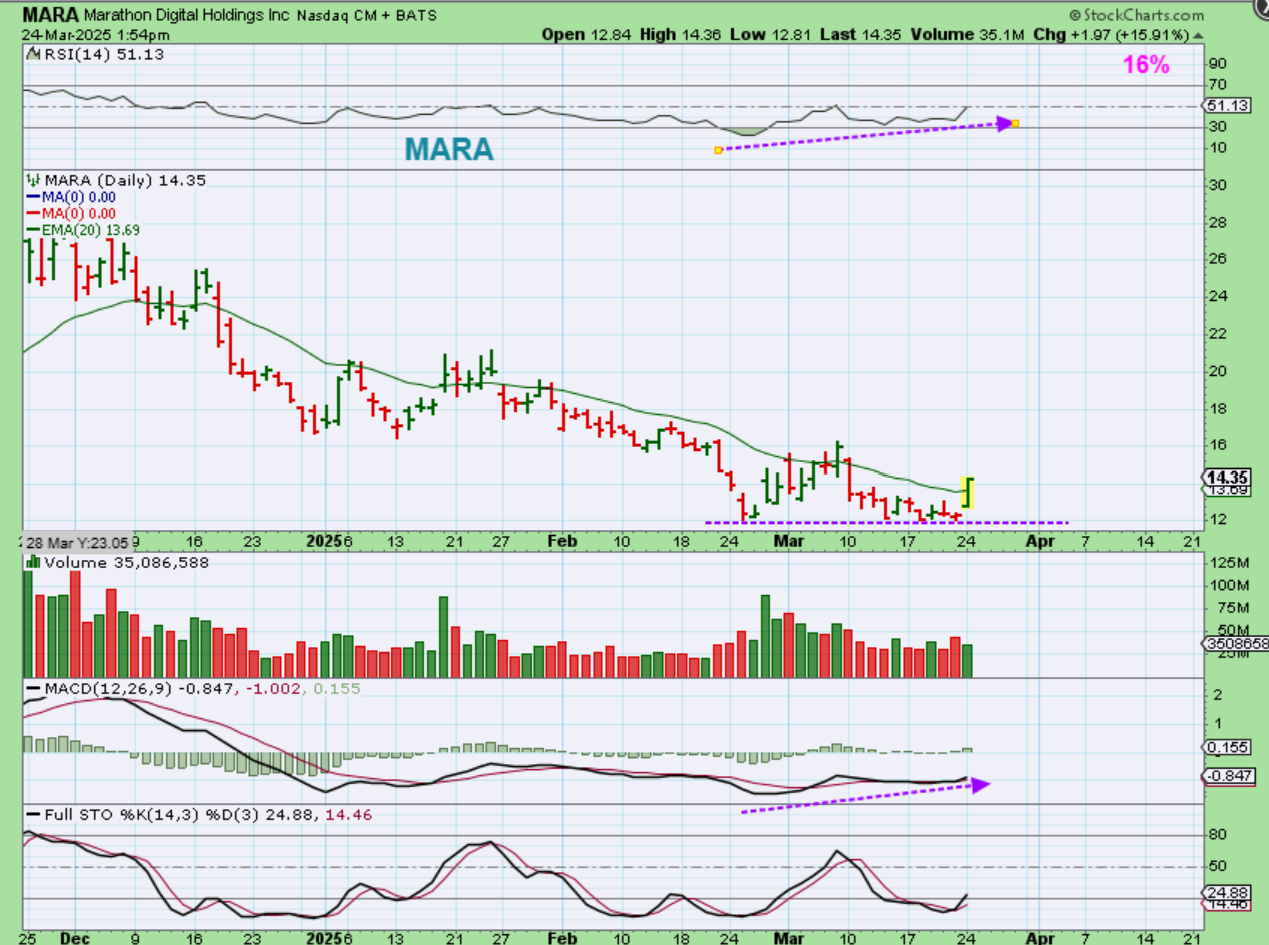
MARA Monday a.m.: MARA and the other crypto stocks gapped open and climbed steadily higher with the general markets running too. I grabbed this chart before lunch time. At $14.13 it was at a downtrend line and moving any higher would breakout from that wedge, but then it has the 50sma overhead…
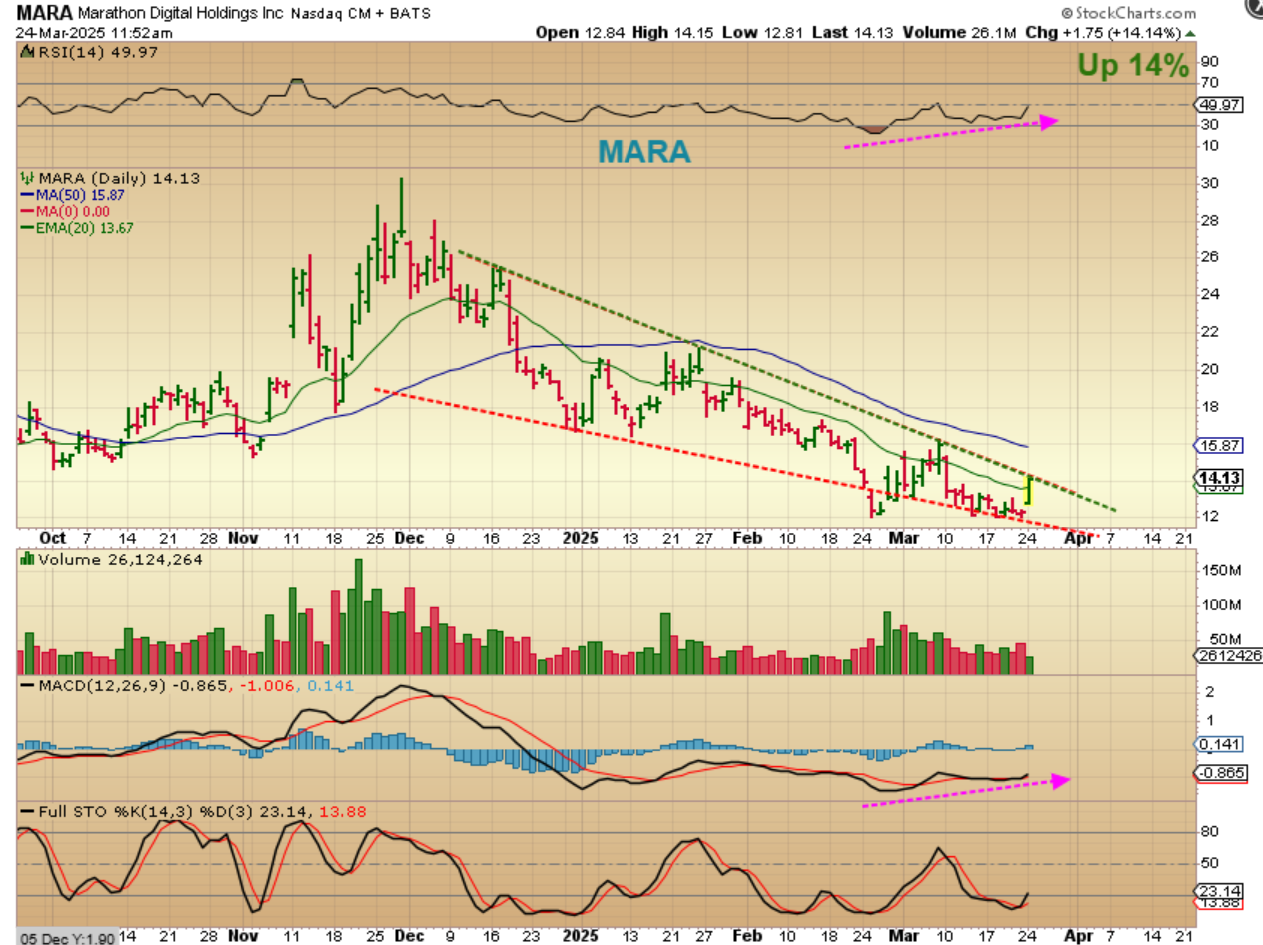
.
MARA continued higher to $14.35, up 16%, so it should be above the triangular wedge. Would it hold the gains? It actually continued higher and closed up at $14.61, up 18%, so it added to the gains into the close.
.
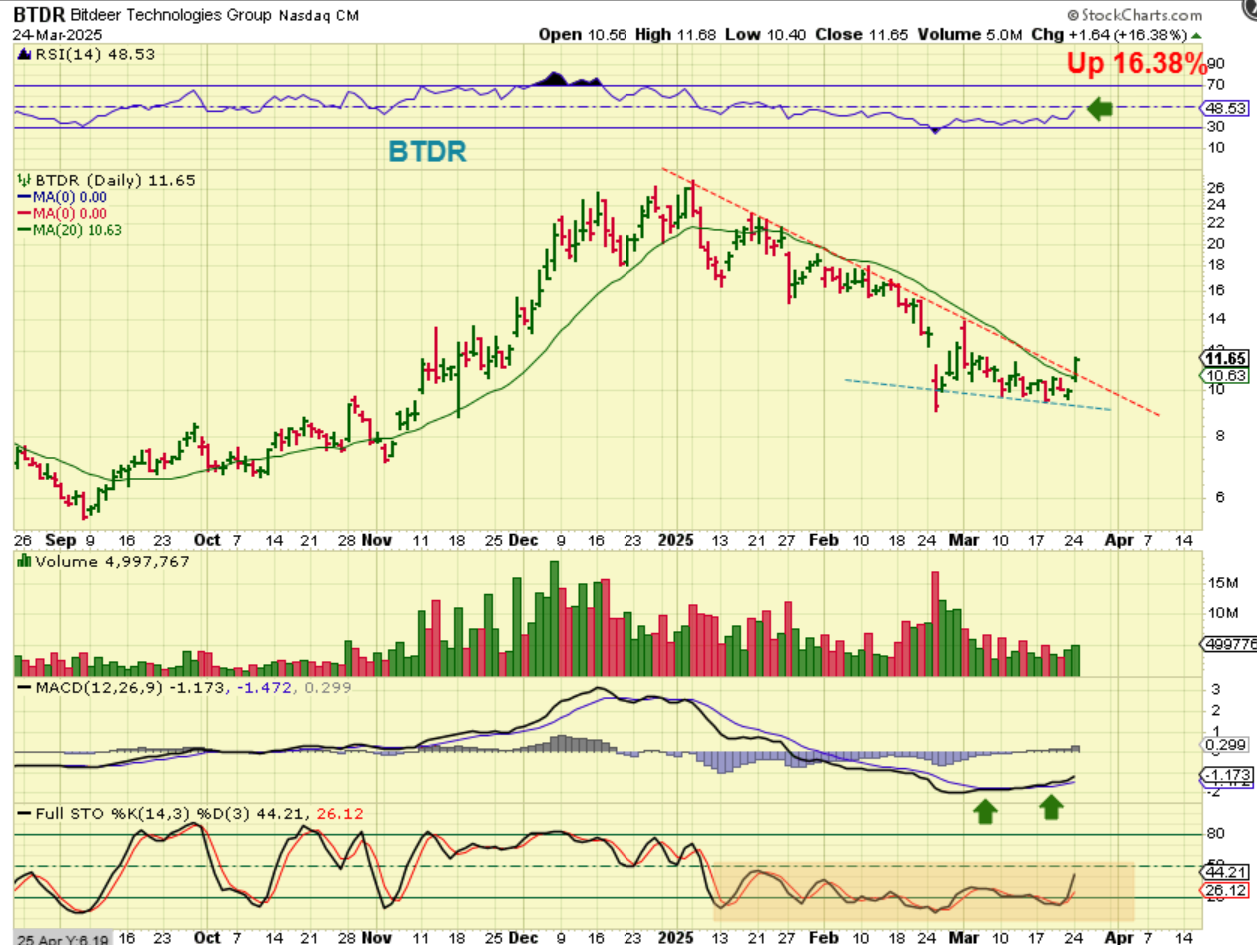
BTDR was right at the lows, but the RSI is almost 50% already and the MACD crossed upward, so breaking this wedge is a bullish move. These stocks are quite oversold and have plenty of room to run if Bitcoin can continue higher. The 2024 rallies were excellent gainers!
.
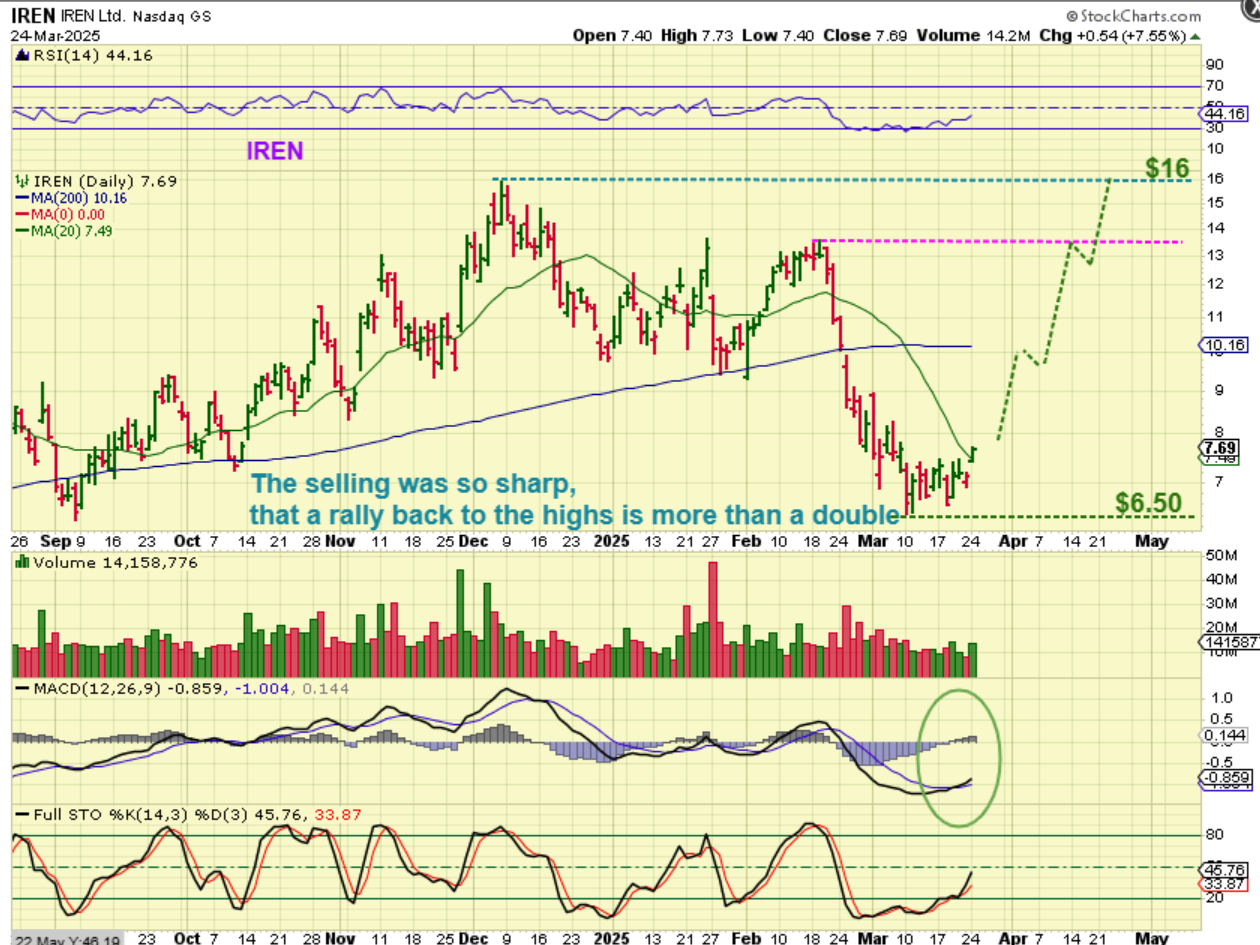
IREN crashed during that Bitcoin sell off, so you can see that stocks like this could double or triple if they get to recover former highs.