February 1st Weekend Report
.
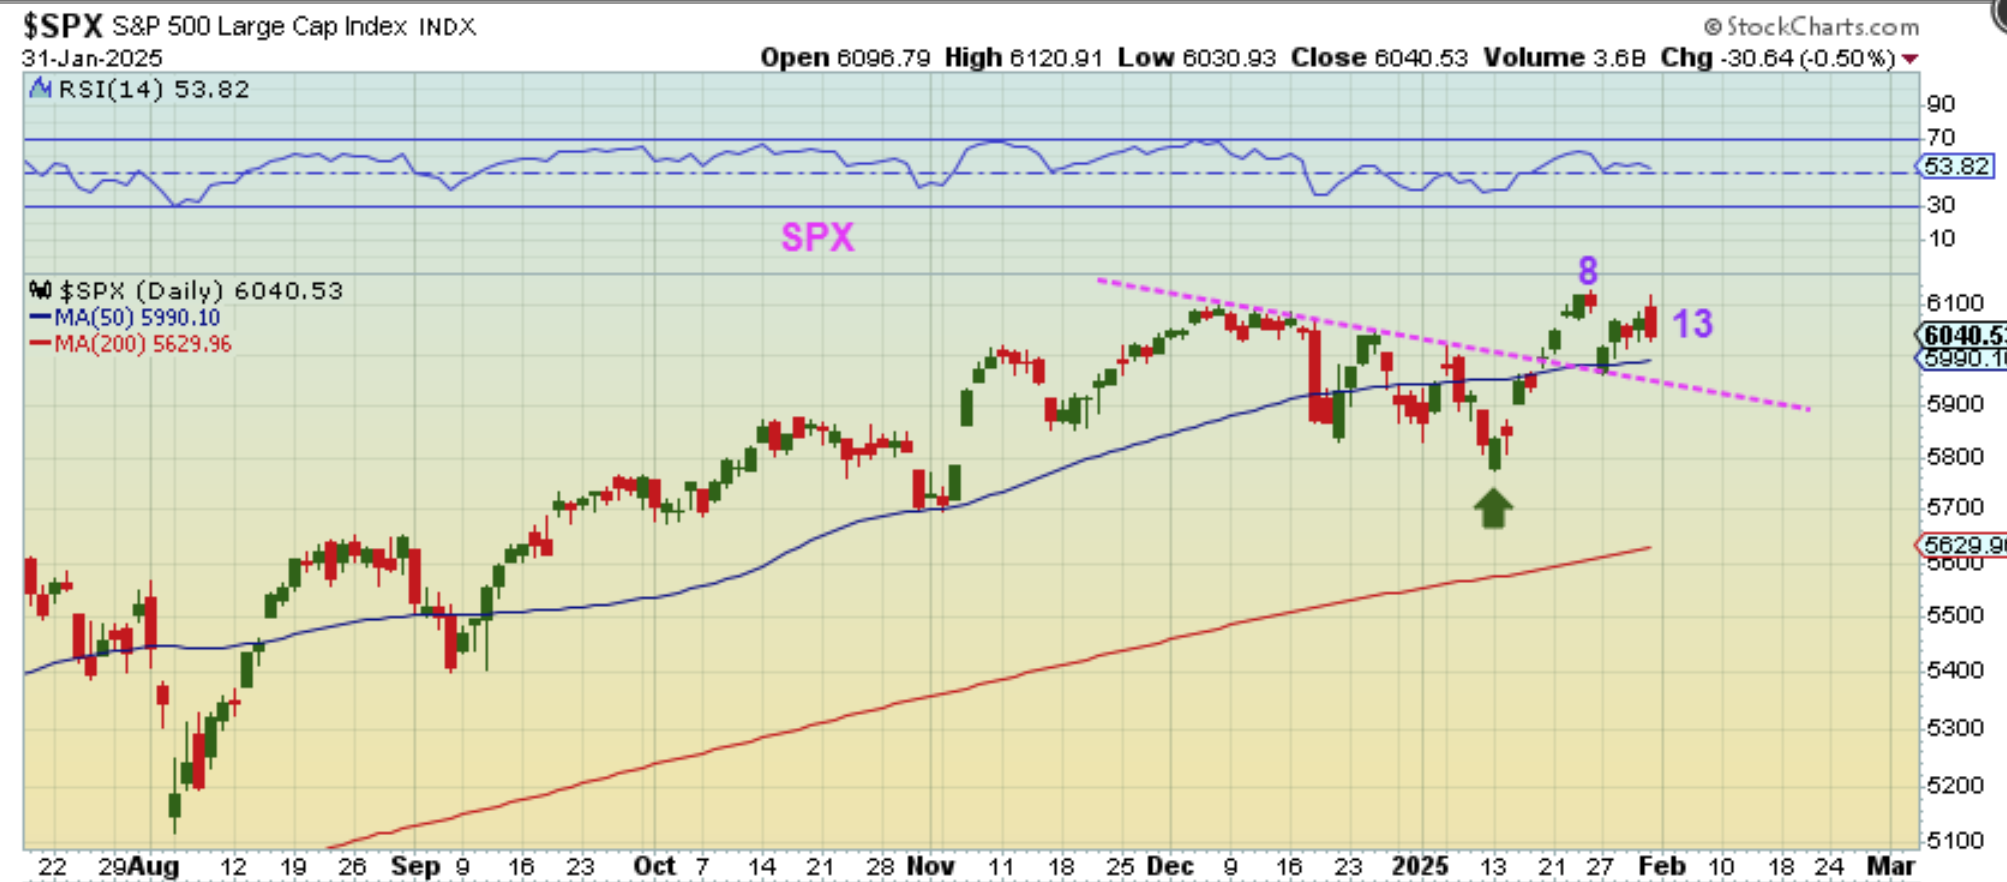
SPX DAILY DAY 13 – The markets moved higher during Fridays trading, but Trumps mention of Tariffs again toward the end of the day caused a sharp selloff (again). The SPX closed down $30, but the cycles are not damaged.
.
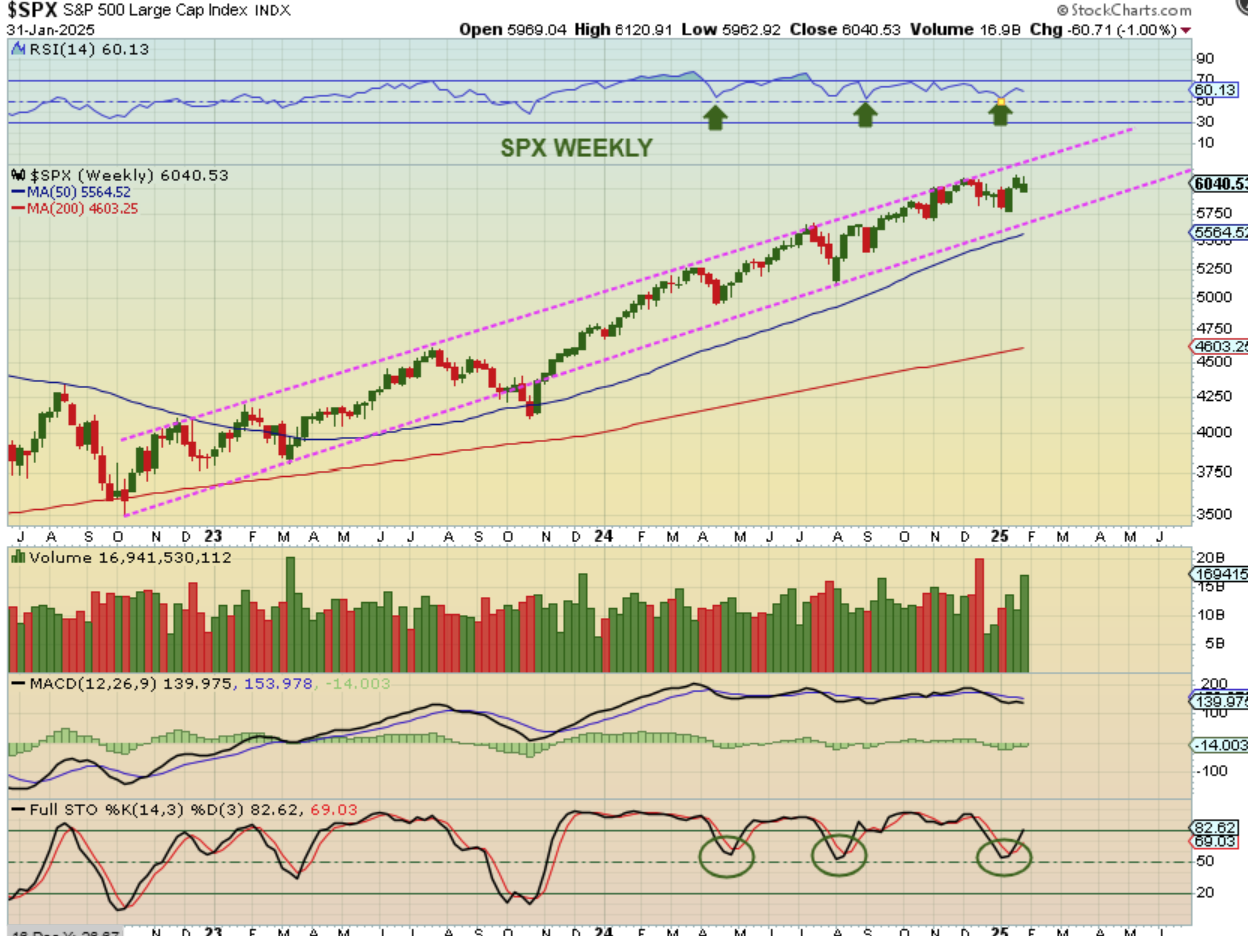
SPX WEEKLY – The selloff into the ICL was Mild, similar to what we had in April of 2024. It didn’t reach the lower trendline either time. The stochastics looks very similar.
.
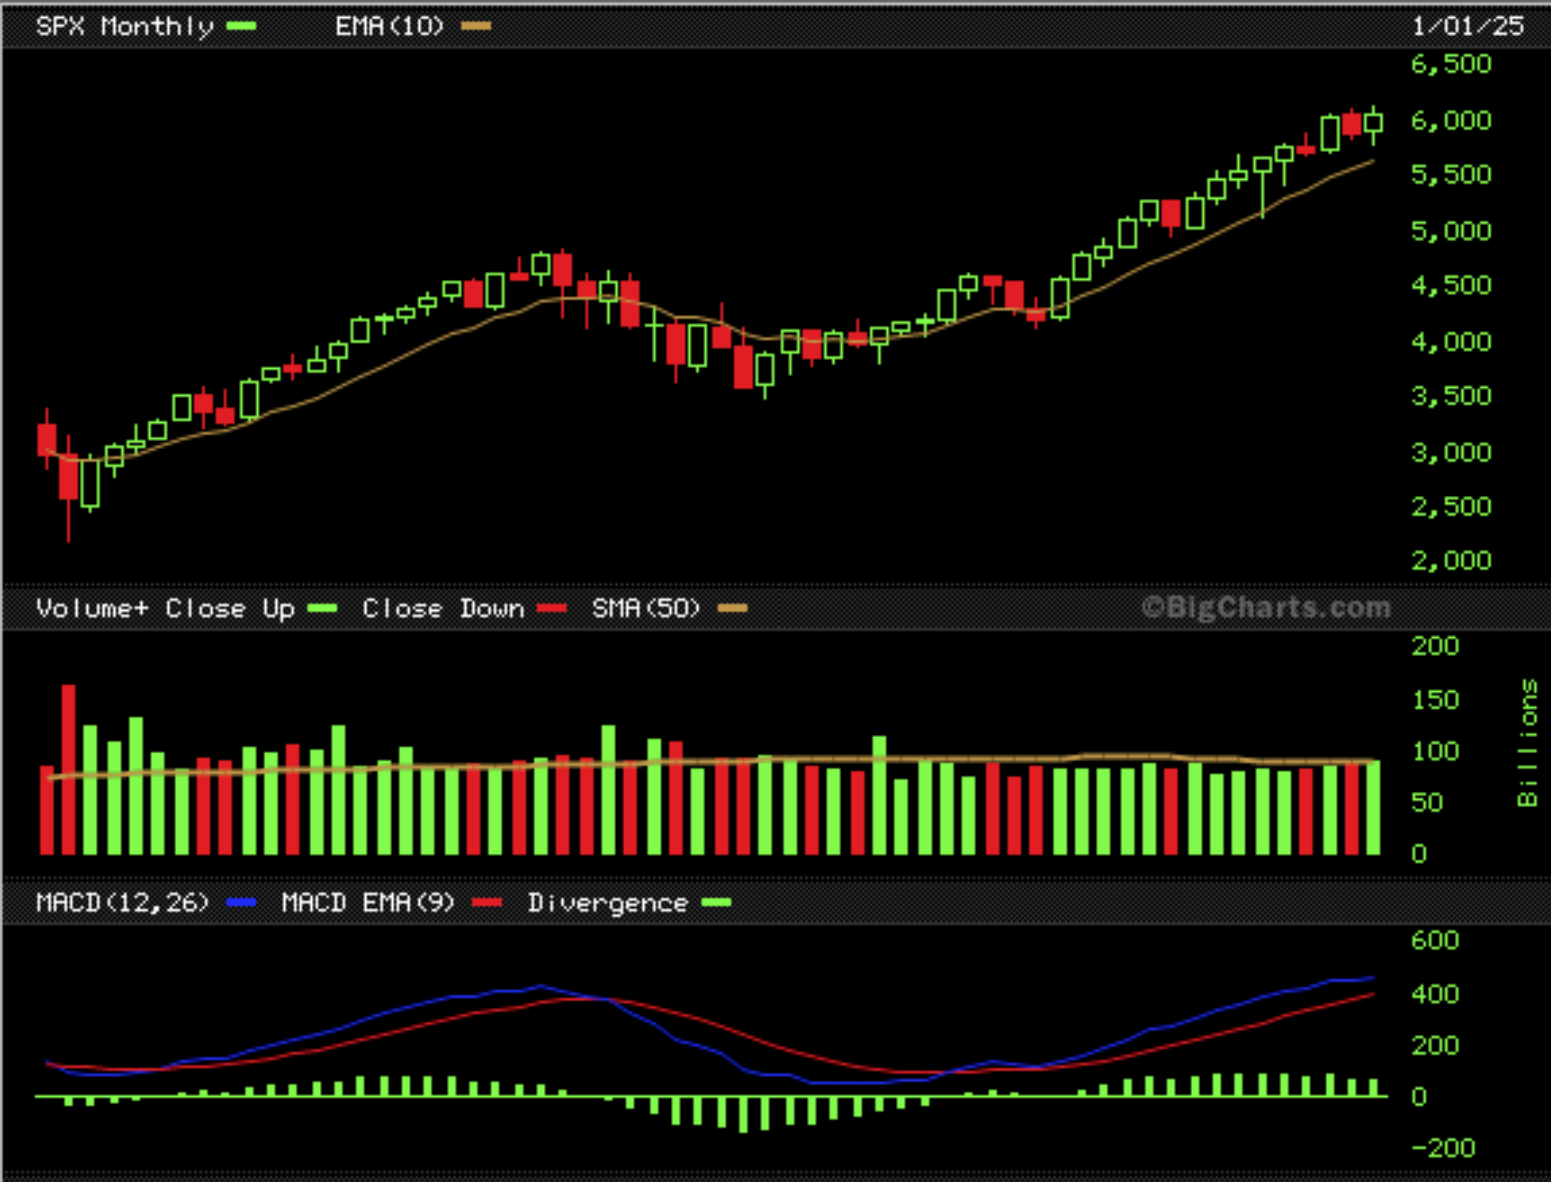
THE SPX 5 YEAR MONTHLY CHART speaks for itself. It looks like a cup and handle during the 2022 sell off and it has been running higher along the 10 month ma since then. The General Markets remain bullish.
.
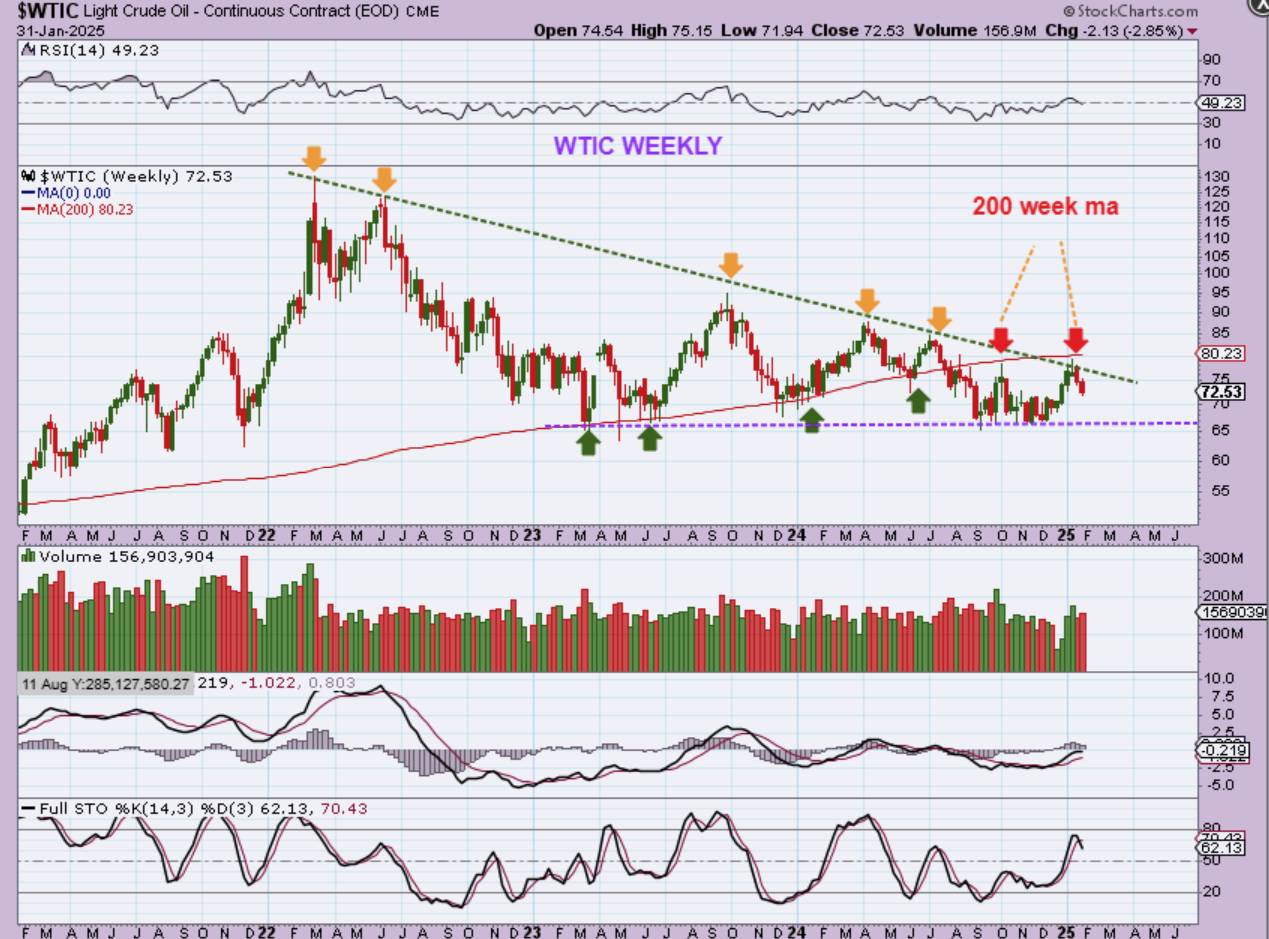
WTIC WEEKLY – Oil did have a nice run higher once it escaped from all of the choppiness at the lows. Now it has run into longer term resistance and is pulling back into a dcl. It may then seek out an ICL with the next daily cycle, if it cannot escape from Oils Apex. I also noticed resistance at the Red Arrowed 200 week ma. Oil can still breakout upside – or – down.
.
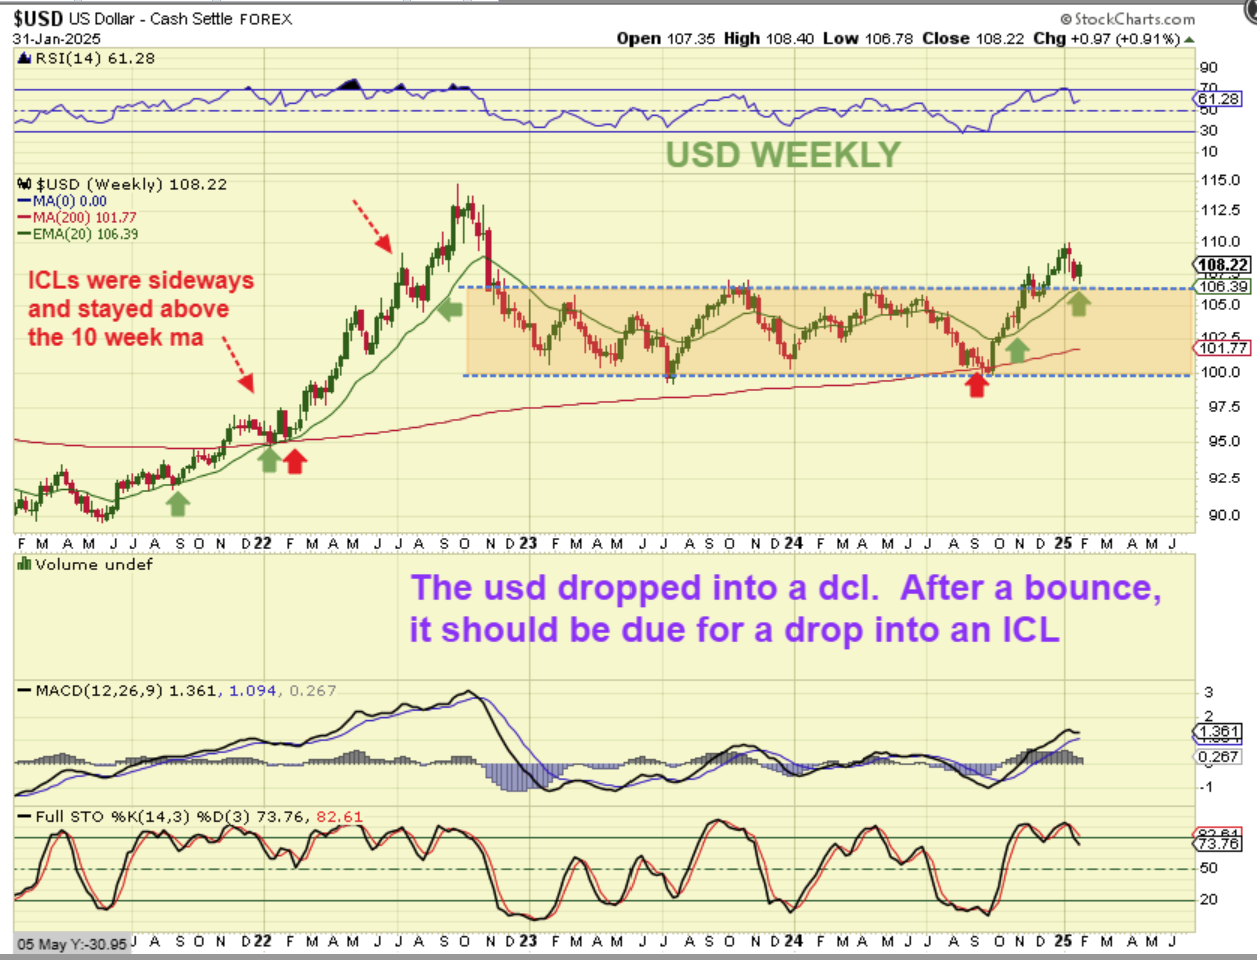
USD WEEKLY – We have 3 daily cycles higher and this 4th one may become L.T. and roll over. In the very strong rally of 2021-2022, the ICLs stayed above the 20 week ma (I wrote 10 on the chart, but that was a fat finger mistake-I meant to hit the 2). We’ll watch for that after a bounce and the next dip takes place.
.
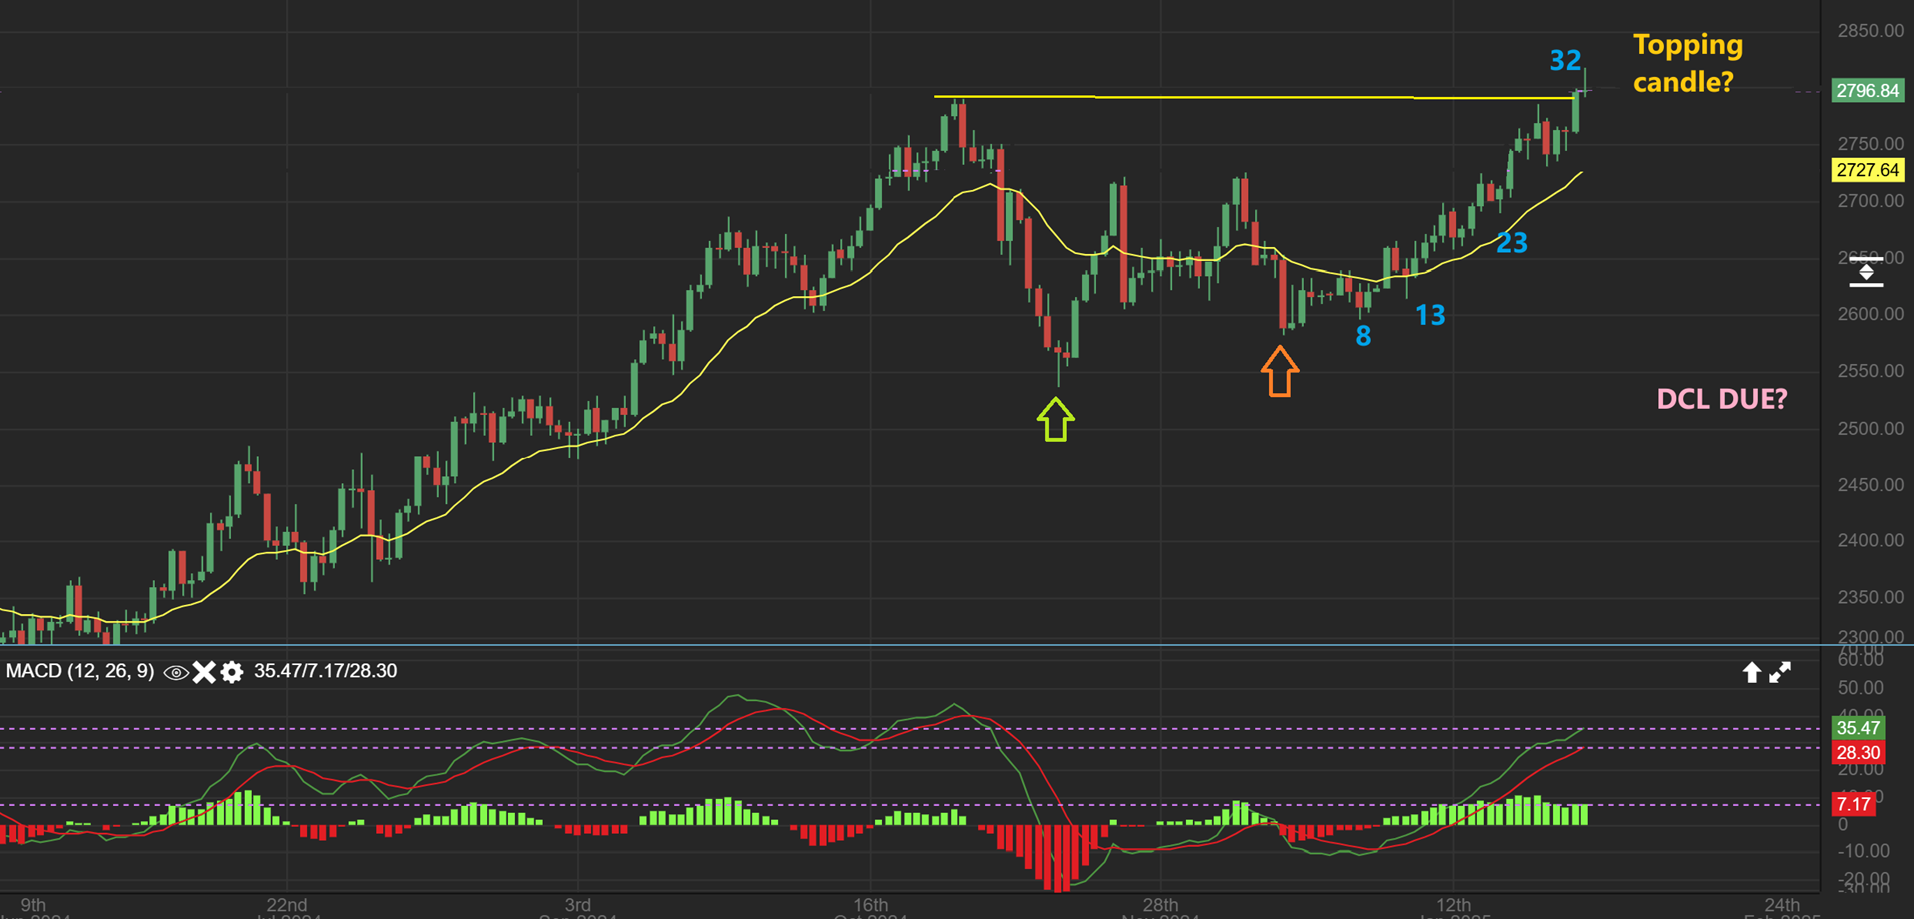
GOLD DAILY –
1. Using SPOT Gold we would be on day 32 with a possible reversal candle. A drop to a dcl from here should be short lived (I do not think that the last 1 day dip was the dcl).
2. Using stockcharts it shows Gold as only on day 27, but that is certainly still within the timing for a drop into a dcl. Buy that dip!
.
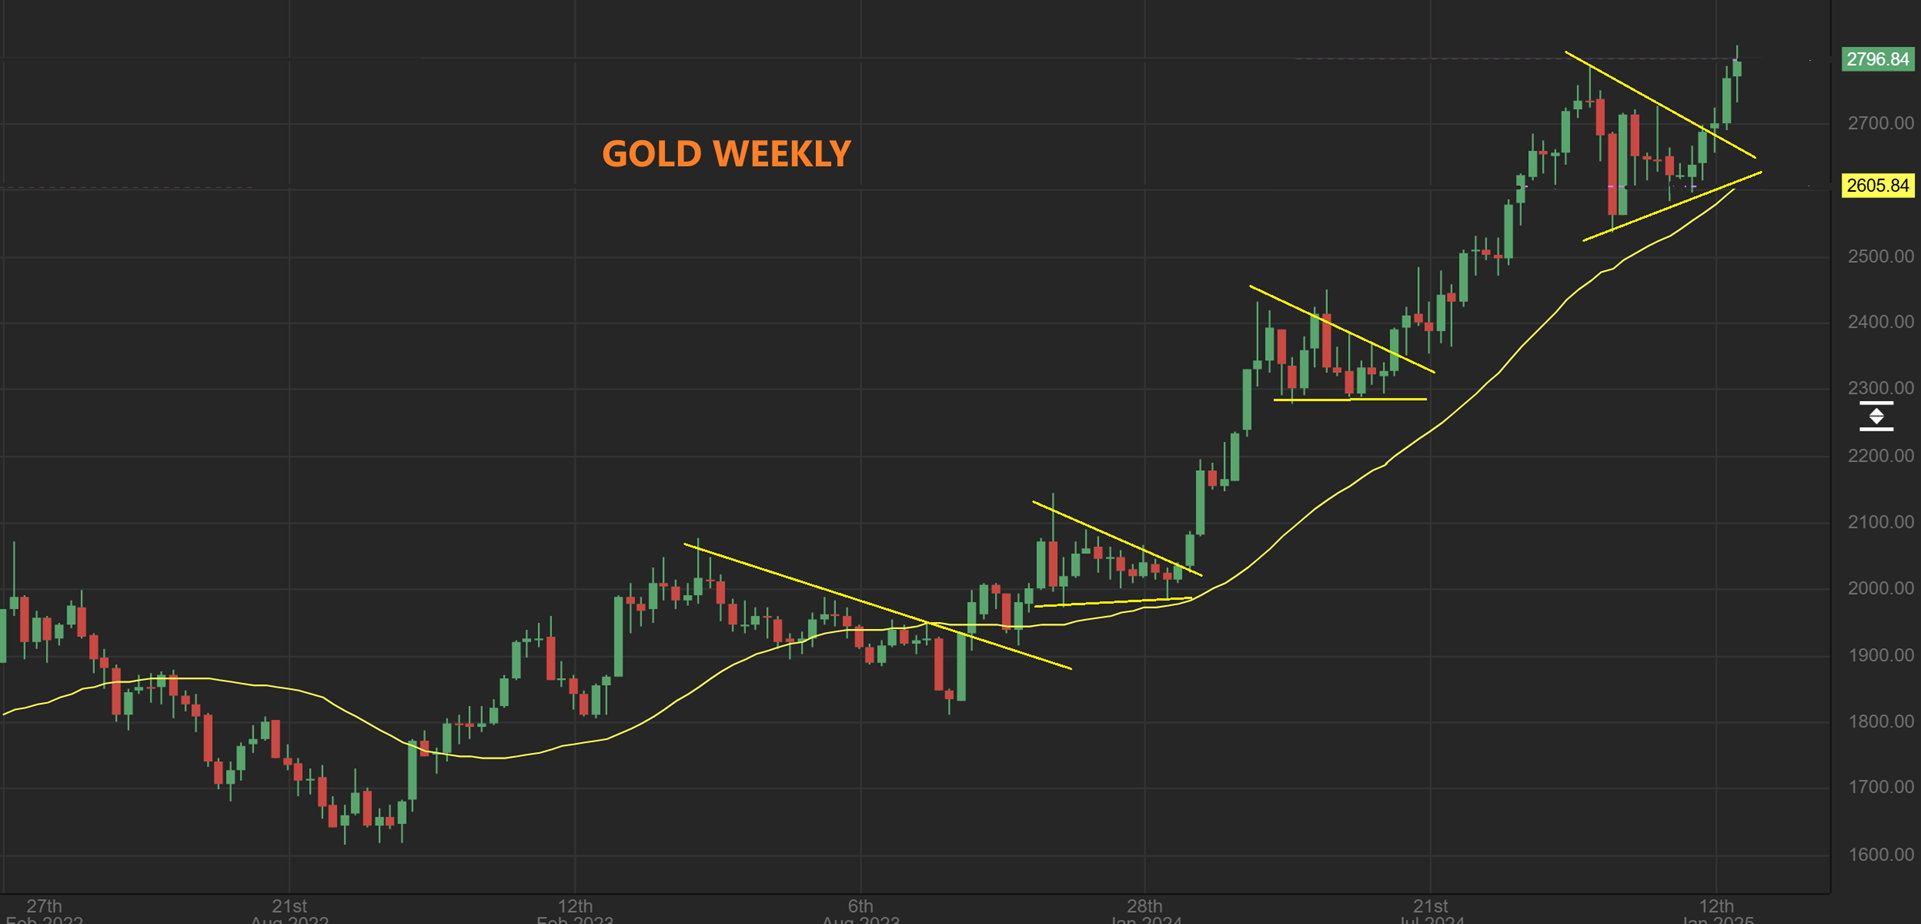
THE GOLD WEEKLY CHART gives us the view of the Triangles that keep forming when Gold gets choppy and puts in a mild sideways ICL.
.
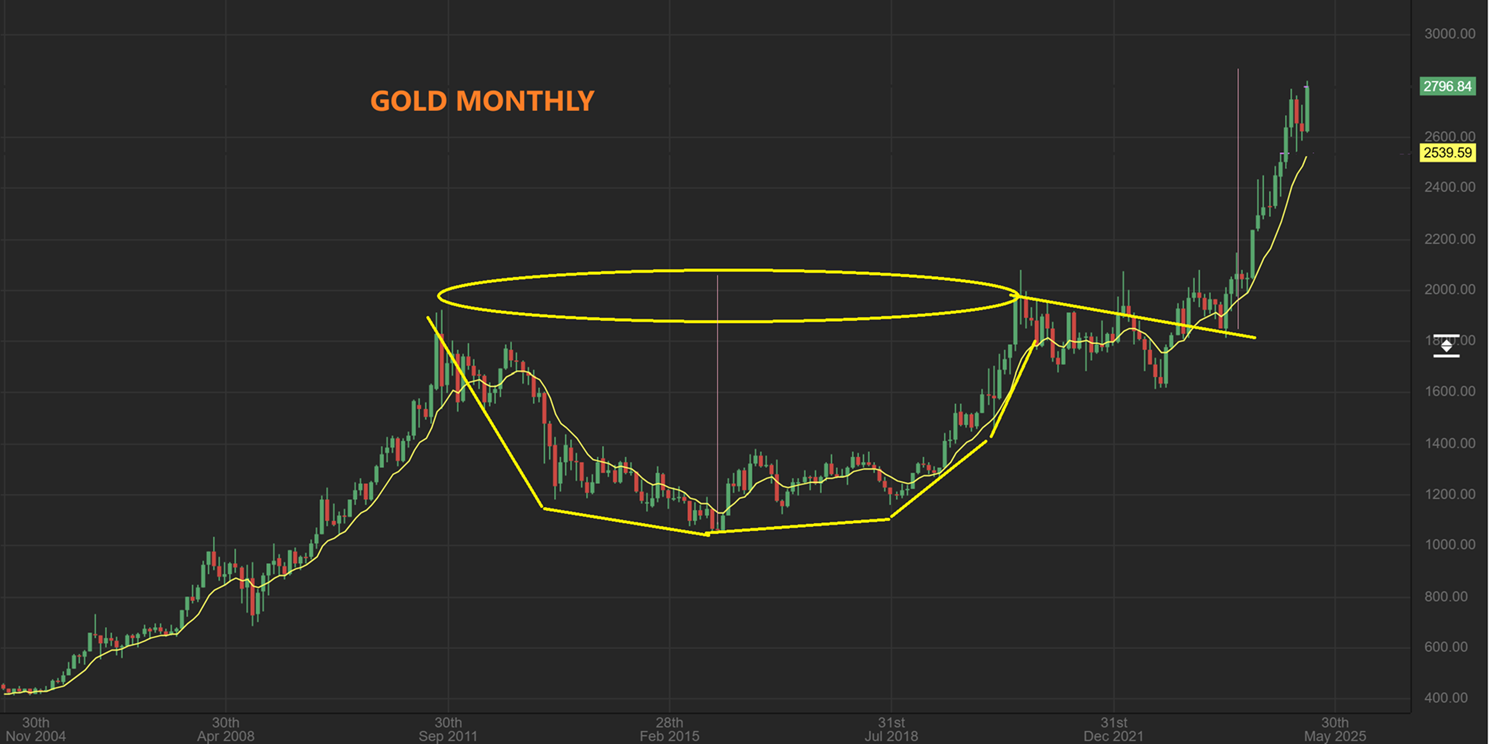
THE GOLD MONTHLY CHART shows that bullish Cup and handle that broke out and has been rallying. The price projection depends on where you place the measured move, but $3000 is likely.
.
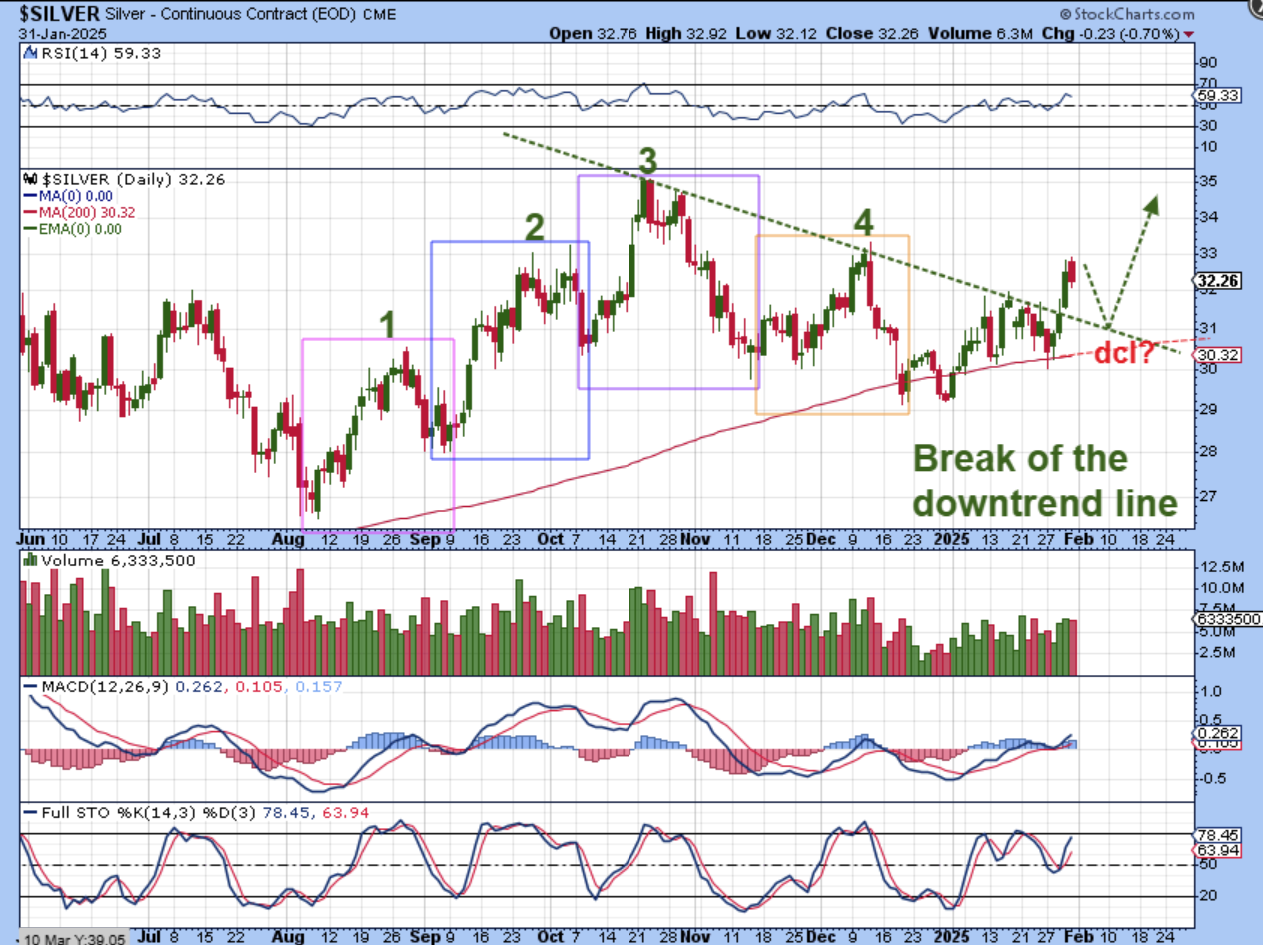
SILVER DAILY – Silver had 4 daily cycles and I was wondering if we’d get a 5th to take us lower into an ICL, but price held up along the 200sma and a trendline break usually indicates that the ICL is in place. Silver broke that trendline this week and a drop into a dcl could give us a back test and a BUY if it happens that way.
.
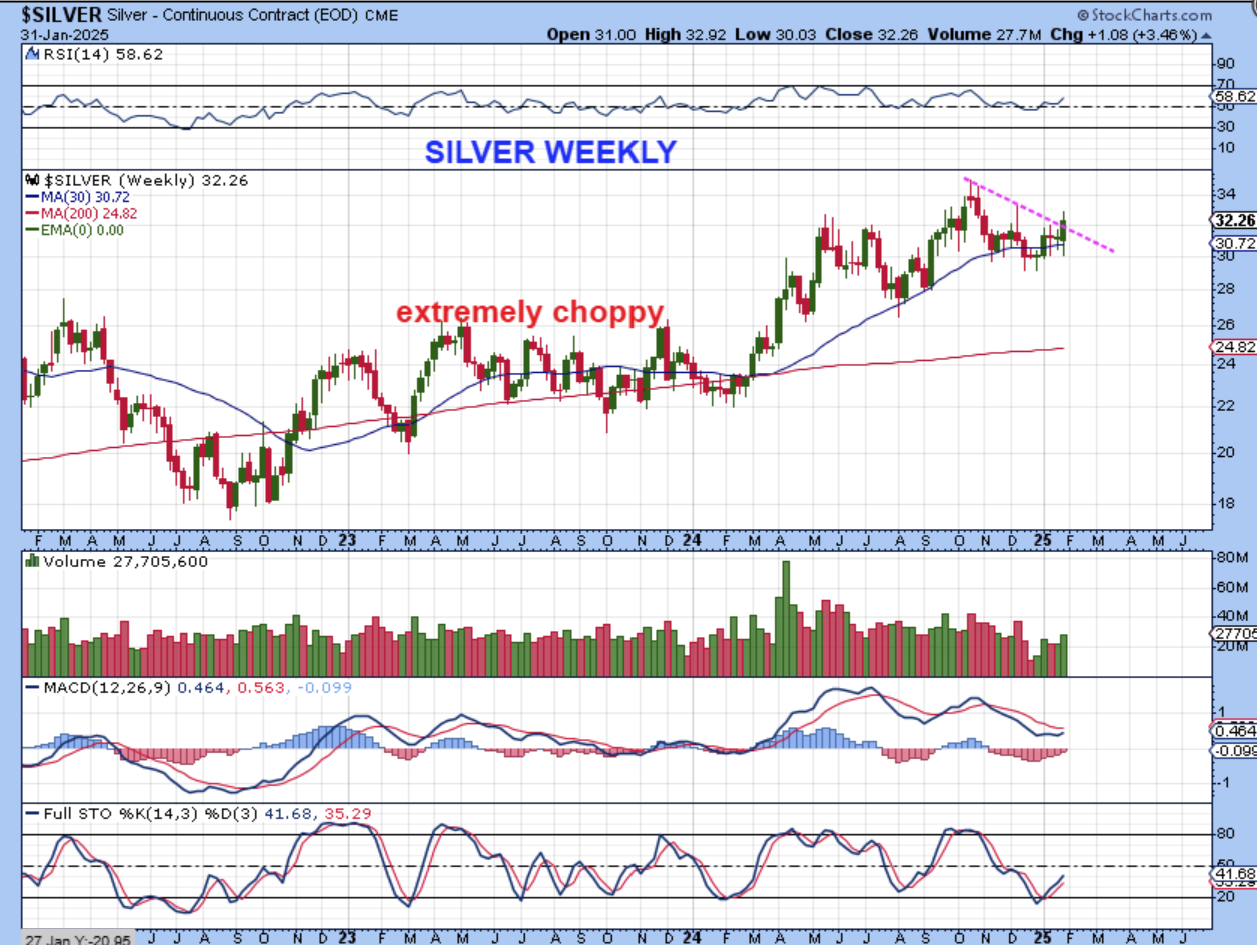
THE SILVER WEEKLY CHART has Silver regaining the 30-week ma and breaking that downtrend too.
.
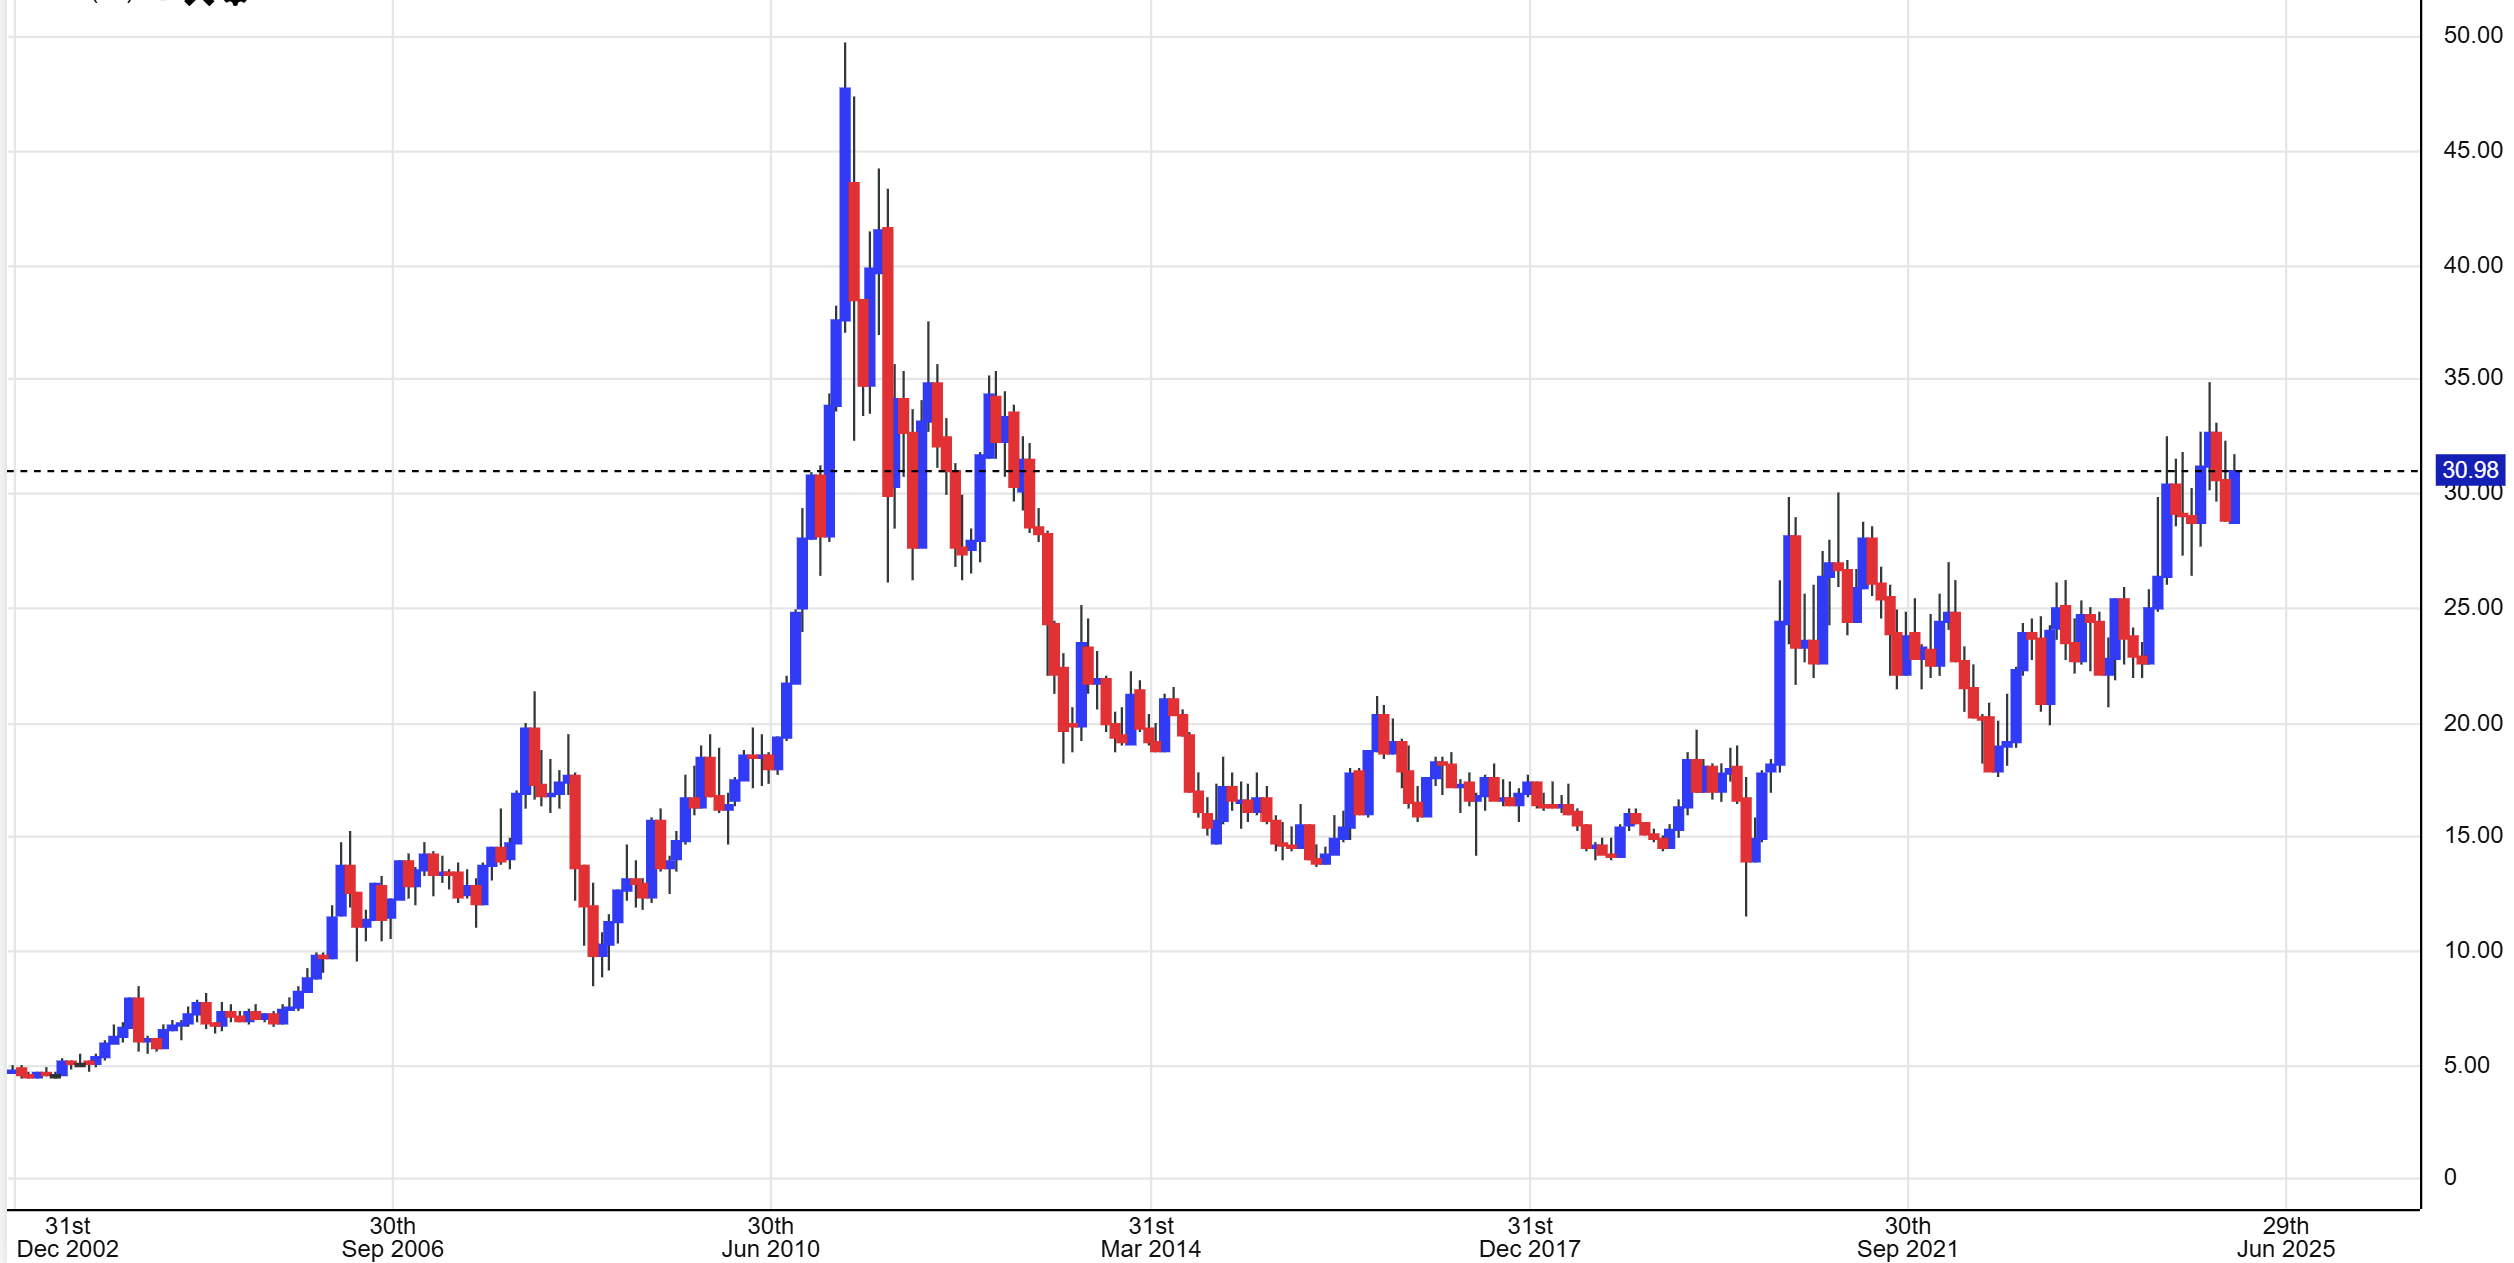
SILVER MONTHLY – January was a Green Month, and if this was just the start of a move out of an ICL, then the next daily cycle could do really well.
.
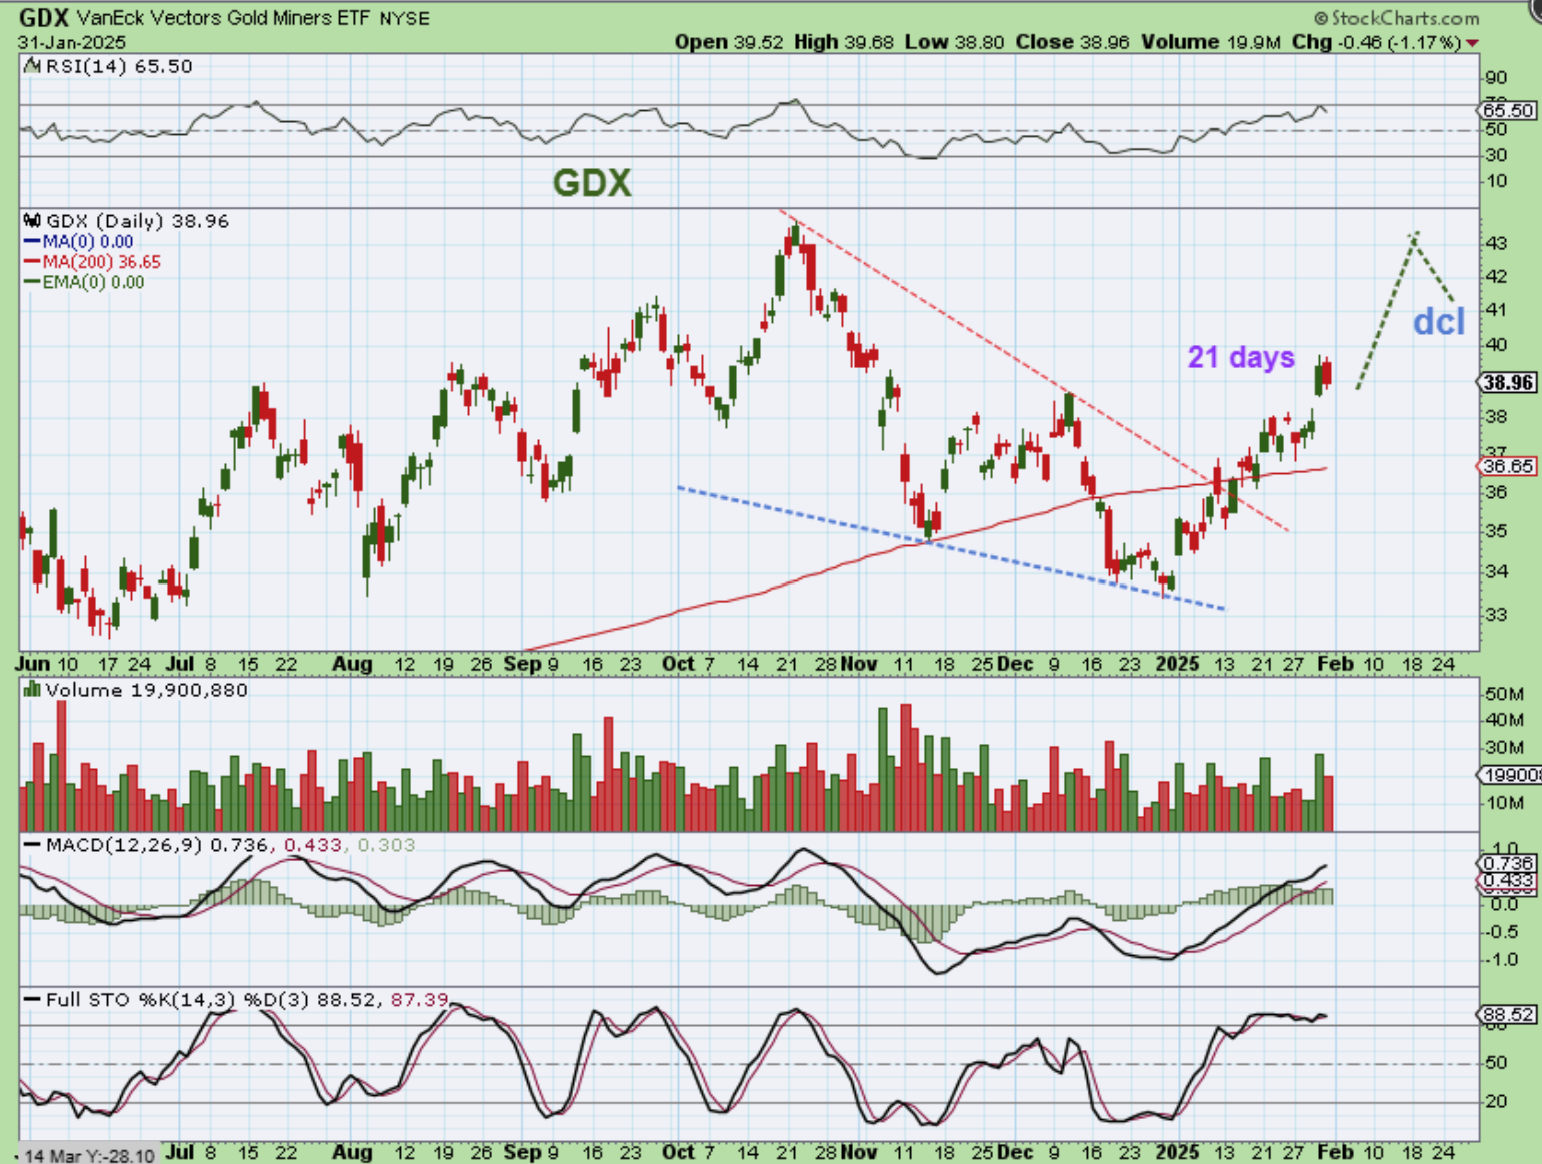
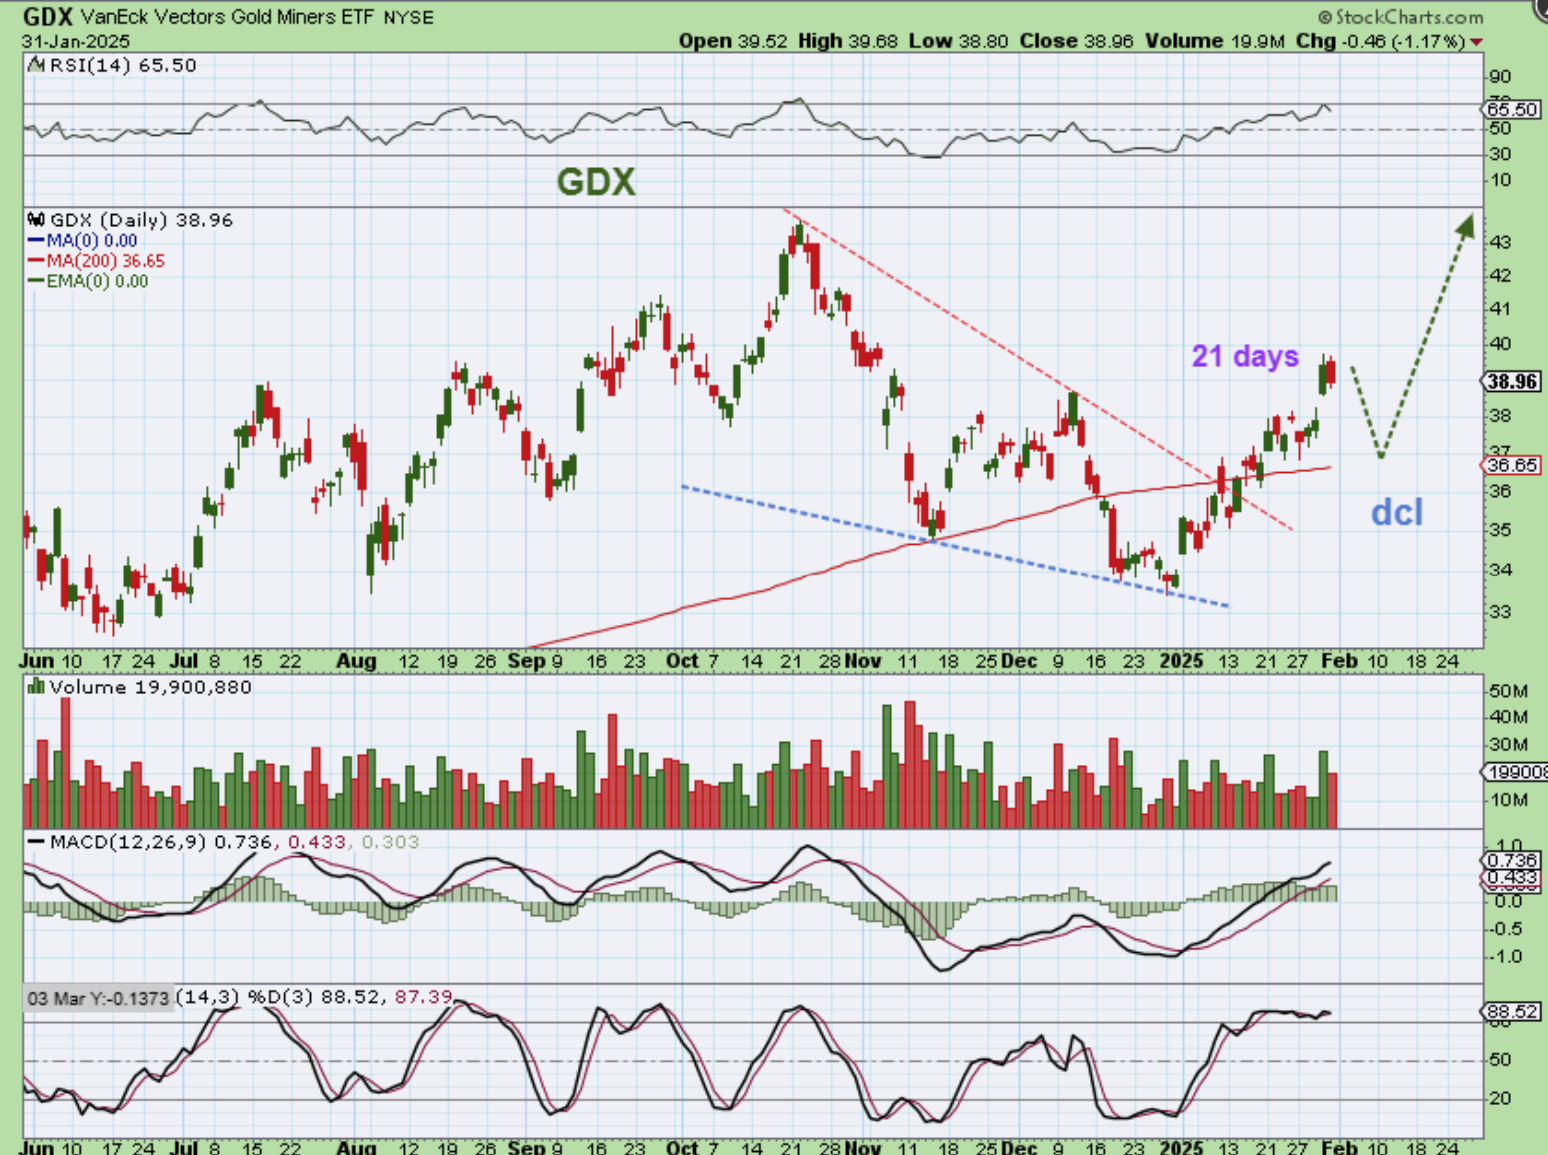
2 Scenarios for THE GDX DAILY CHART
.
GDX #1– GDX bottomed later than Gold so it looks like it is only on day 21 and could continue higher. I drew that here, but to be honest, I think that if Gold and Silver pull back into a dcl now, GDX will follows. That is scenario #2 and it seems more likely…
.
GDX DAILY #2 – If Gold and Silver dip, I just think that the Miners will dip too, so I am drawing a dcl at the 200sma, and THAT would be a great place to buy or add to a basket.
.
The big picture for just about everything remains bullish so far. We have had some sharp drops intraday in the General Markets here and there, but the cycles are easily within proper parameters, and the Charts are not damaged technically at all. February should present some dcls and 2nd daily cycles and I am hoping that those really pick up the pace, especially in Silver stocks and Gold stocks that lagged a bit. Bitcoin remains bullish too, I’ll cover that briefly below, enjoy your Weekend everyone!
.
~ALEX
.
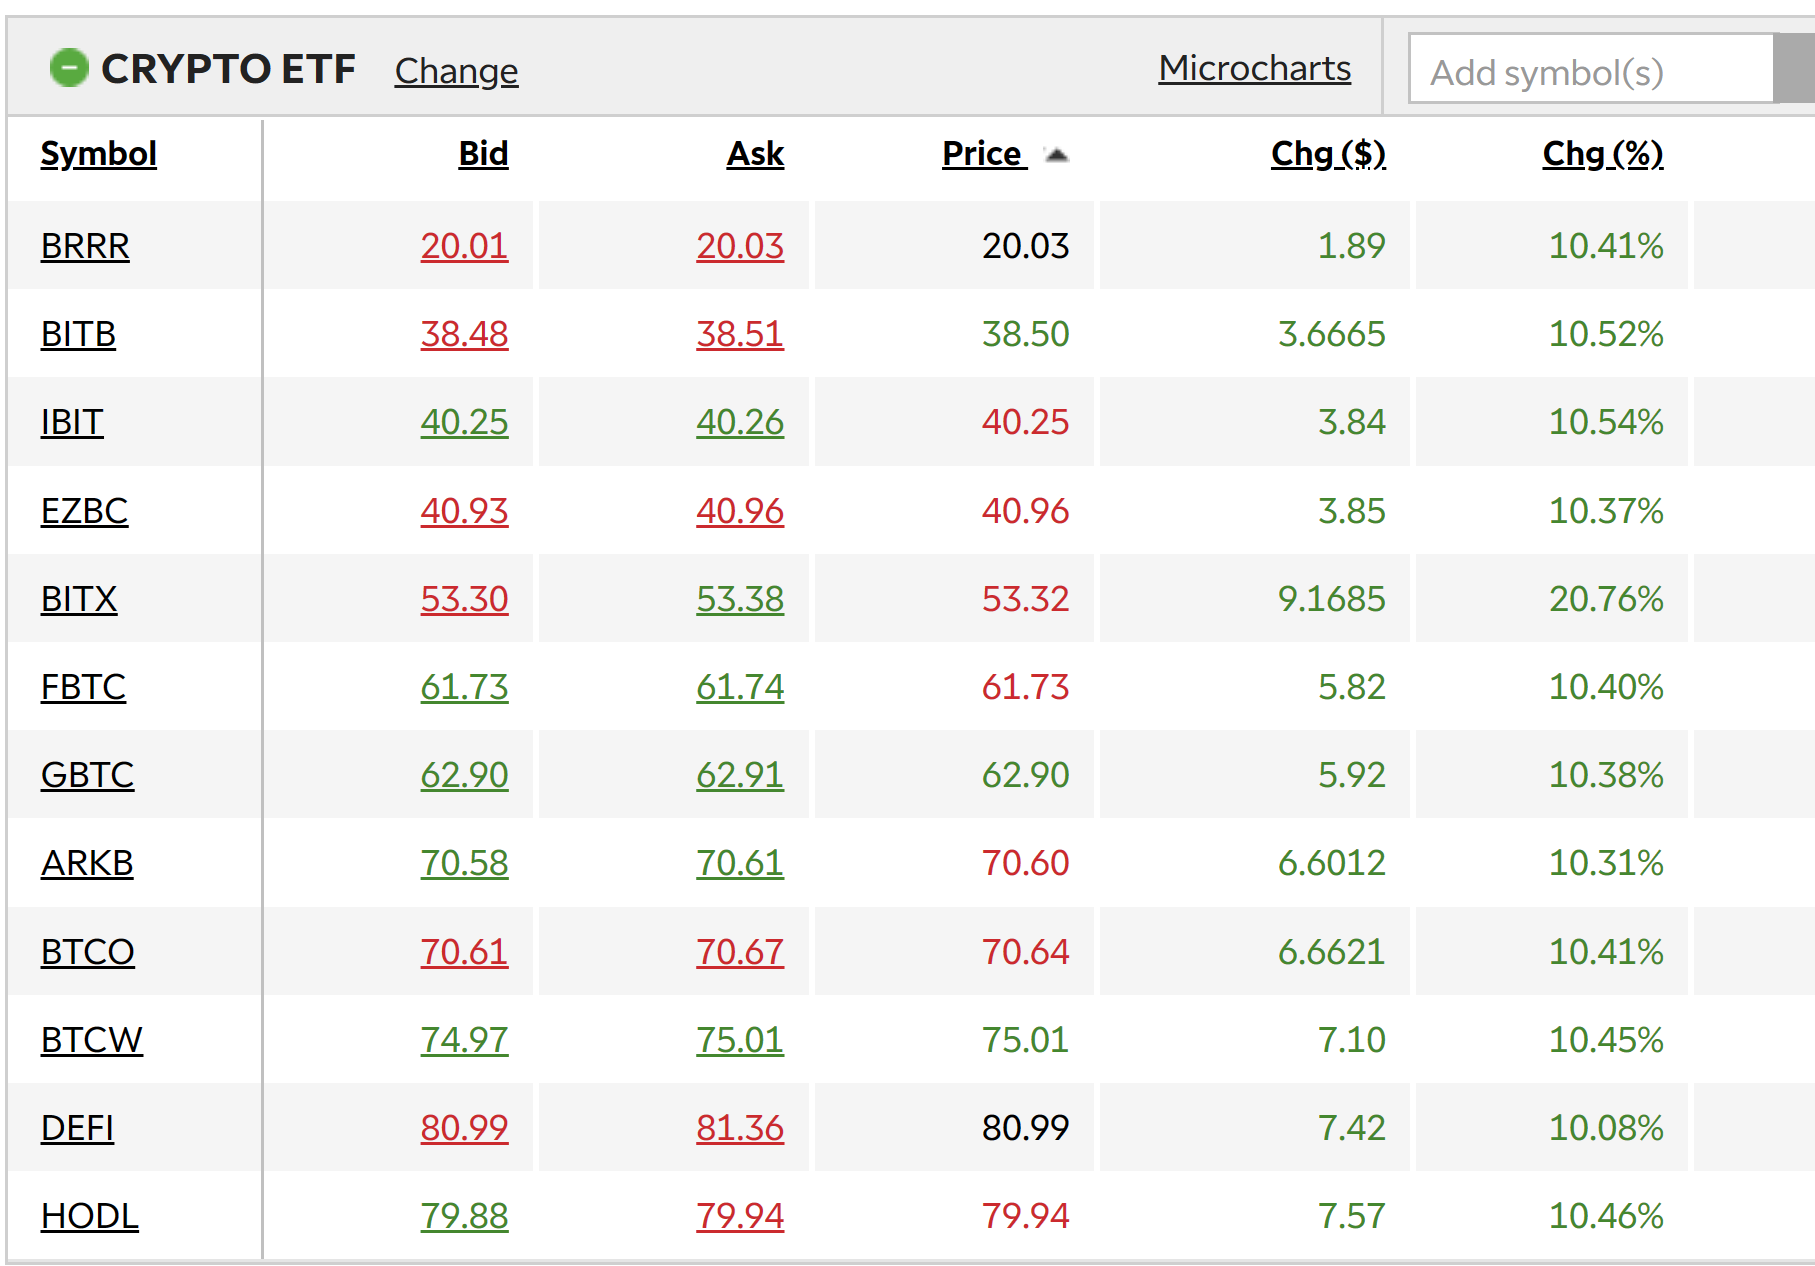
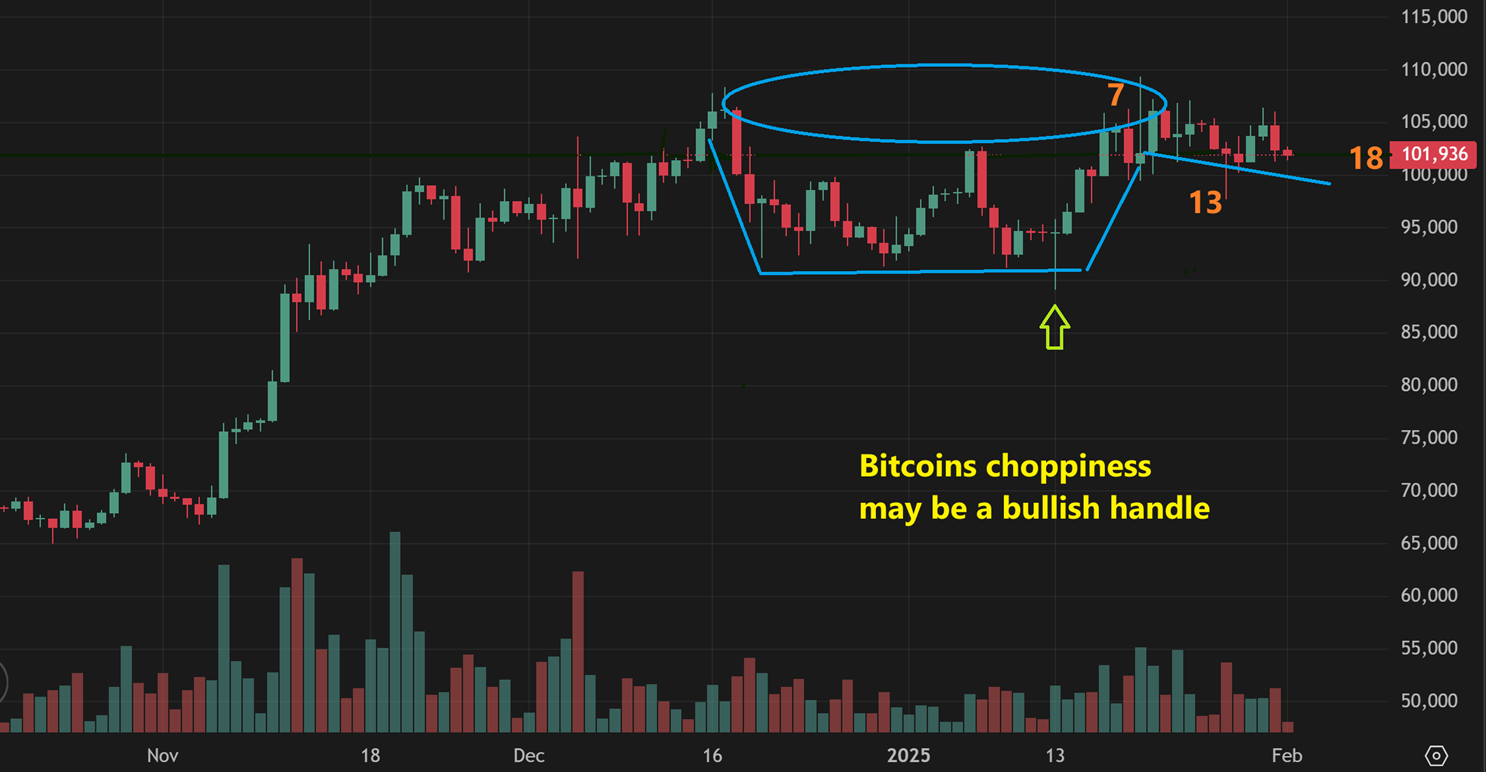
Bitcoin has been chopping sideways, but I did forewarn that we could see this kind of price action if it puts a handle on the cup formation. That does look to be what is happening here. So Bitcoin has been quite choppy for 2 weeks, but hopefully that ends soon and hopefully cryptominers follow. If not, grab a Crypto ETF.
.
REMINDER :
Crypto ETF Tickers, you may want to write them down and buy the higher volume ones.