Thursday January 16th
Yesterday’s data was the CPI Report, and the markets all rocketed higher after the data was released. The immediate reaction seemed to be that the data points to the need for the Fed to cut rates again in as early as June, after it was rumored that the Feds may not need to cut until late 2025. Todays data is jobless claims, hopefully we get even more follow through. Let’s see what the charts are telling us…
.
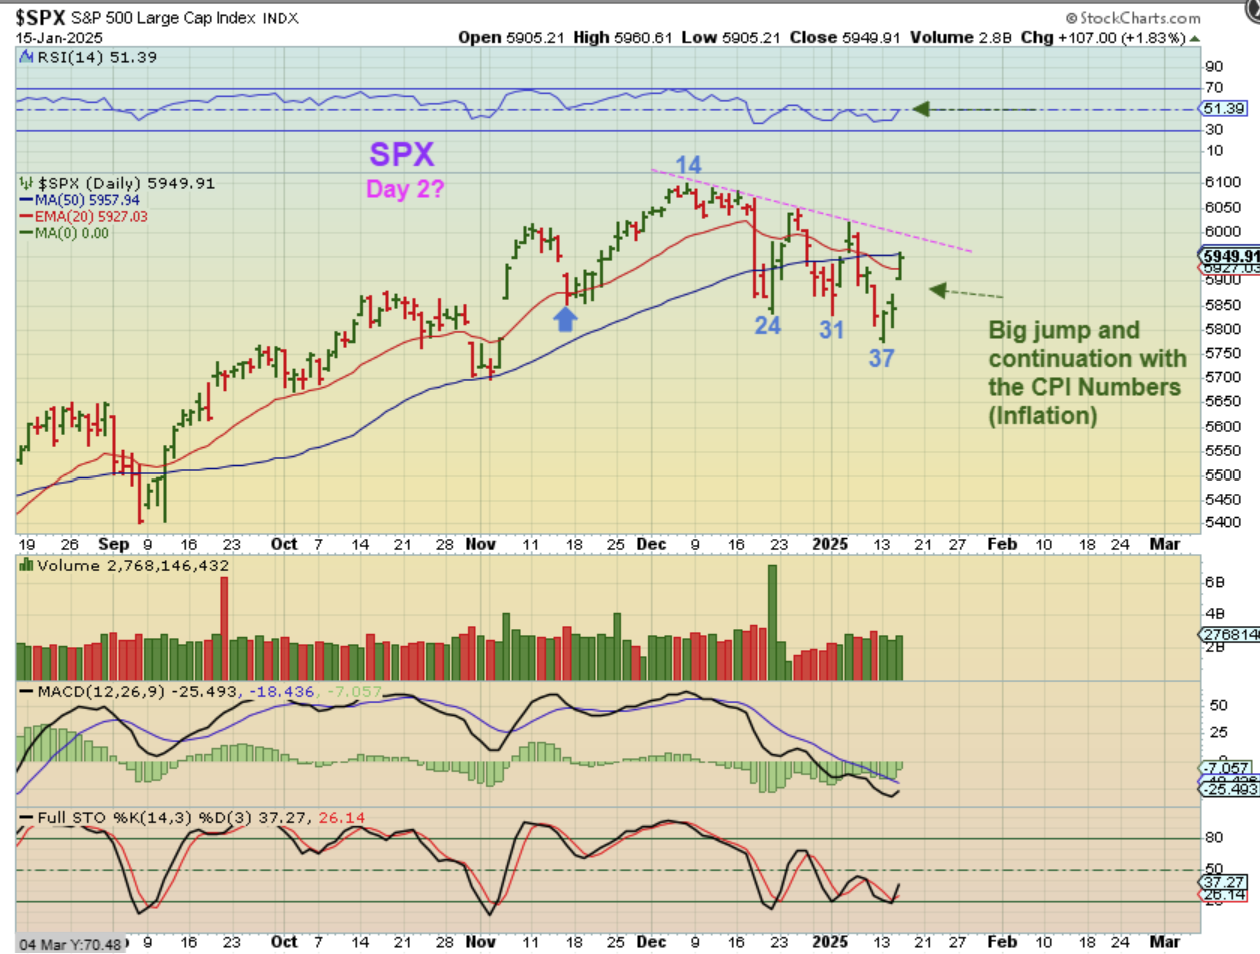
The SPX did gap over the 10sma (not shown) and had the kind of follow through that you like to see, closing at the highs of the day. This is most likely the dcl at day 37, but is it the ICL? I don’t think we’ll know that until price breaks the downtrend. Many Stocks that I follow had a strong reaction too, but are still near the lows, so how do you play this? I’ll discuss that in a moment, but first…
.
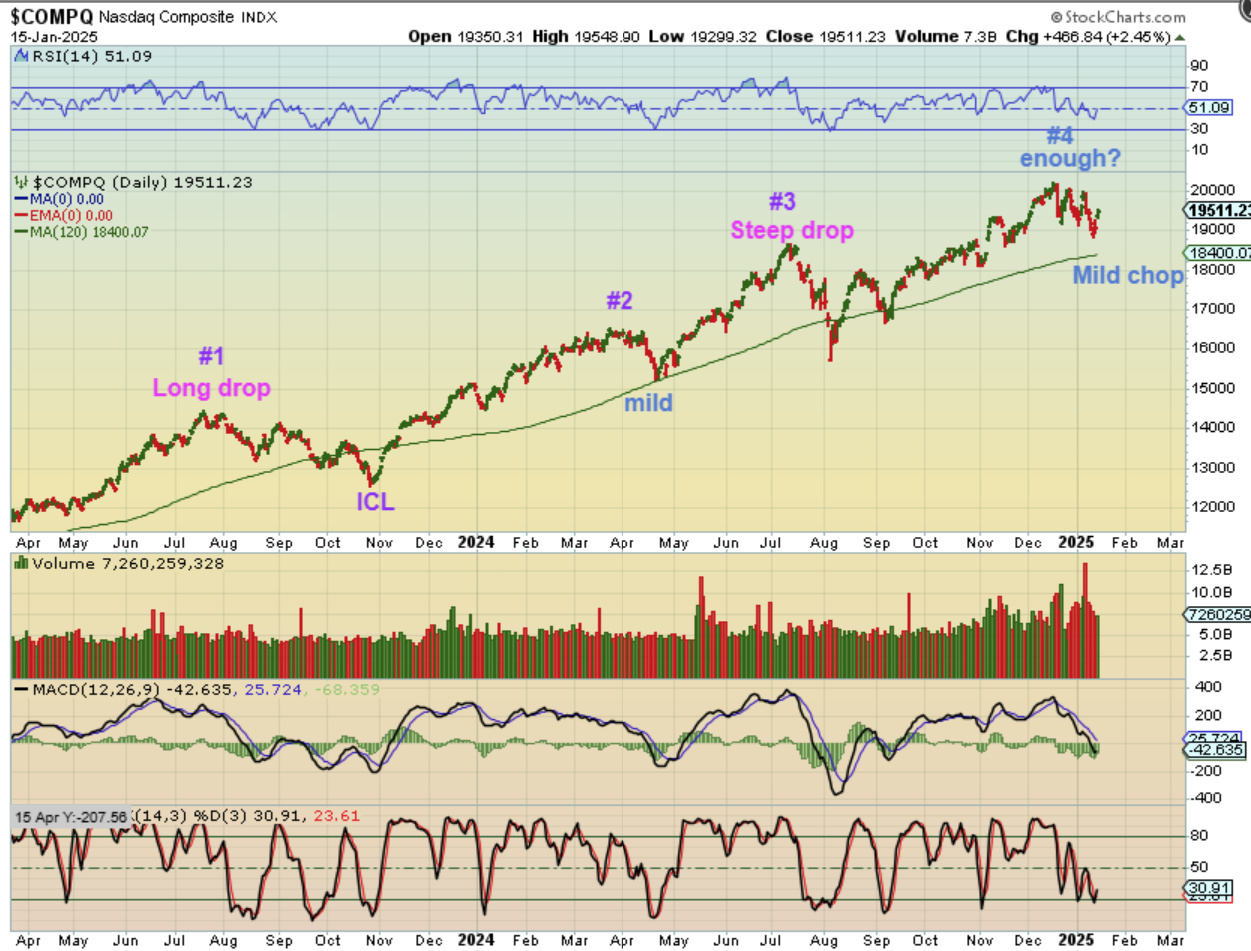
Looking at The NASDAQ we can see several different kinds of ICL dips.
1. The one that I labelled #1 was very long, with several daily cycles. If that repeats, we’ll need at least another daily cycle. We could bounce for 10-15 days and then roll over, so you can trade that with a stop.
2. The one labelled #2 is similar to now, so the drop COULD be enough for an ICL, but I kind of thought that we’d reach the green line. In a strong bull market, we could just continue higher though.
3. The one labelled #3 had a bounce and then a very sharp final drop. If the Jobless claims caused that after our bounce, stops would get hit and we’d have the ICL near the green line.
.
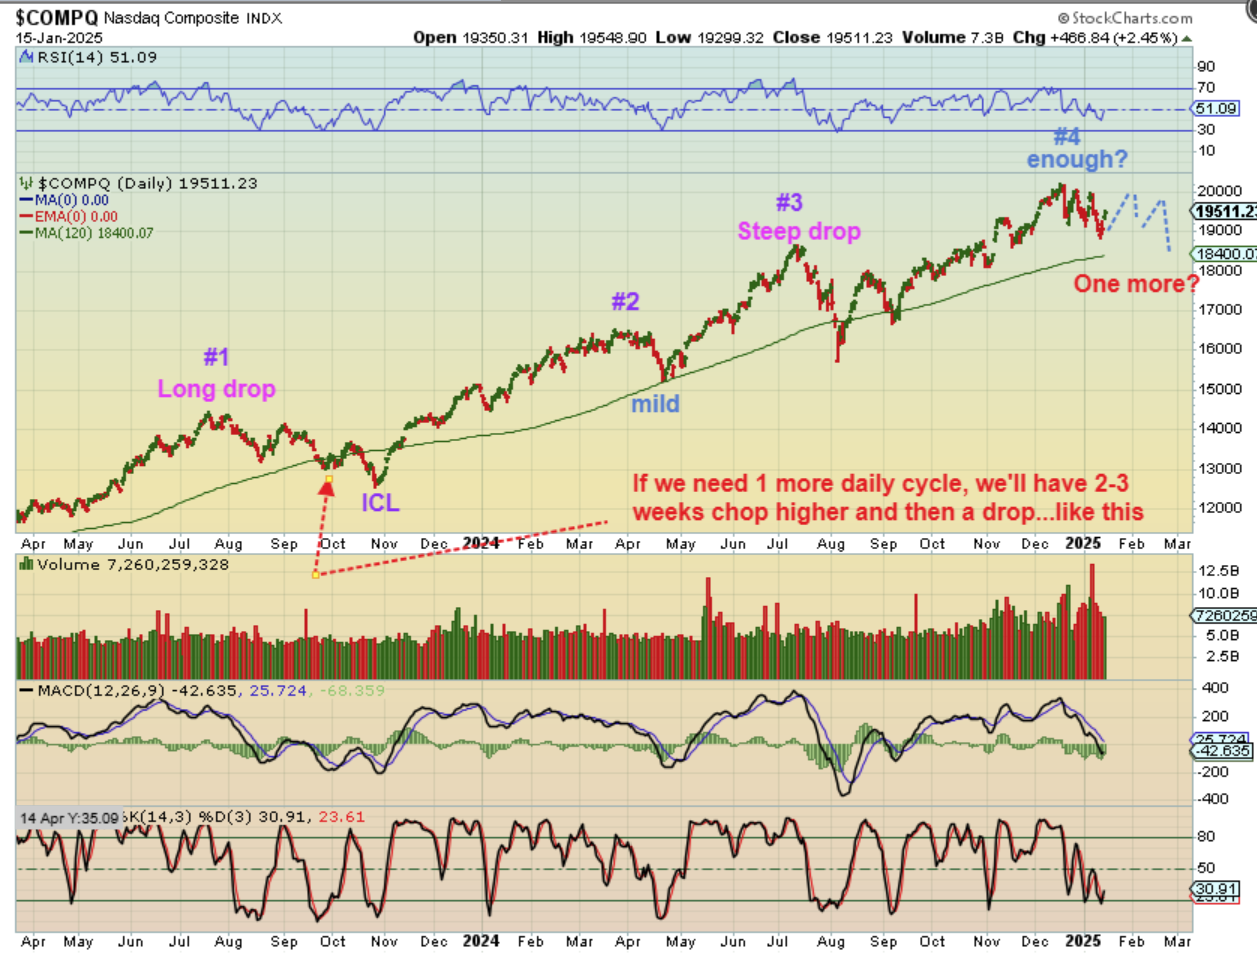
So how do you play this? This was tough with so many lows, bounces, and drops (Very Choppy), but now we are at a day 37 low. Yes, we could drop into the day 45 area, but basically you can buy stocks or etfs with a stop and either we continue to run from here, or we do as I have drawn on the chart below and put in 1 more daily cycle.
.
NASDAQ – One more daily cycle could rally for 10+ days, chop sideways and become L.T. again, and then drop over time. It gets a little trickier if we don’t get that ‘slam down day after day selling’ into day 45, and then a reversal. THAT would be a clear ICL, like #3.
.
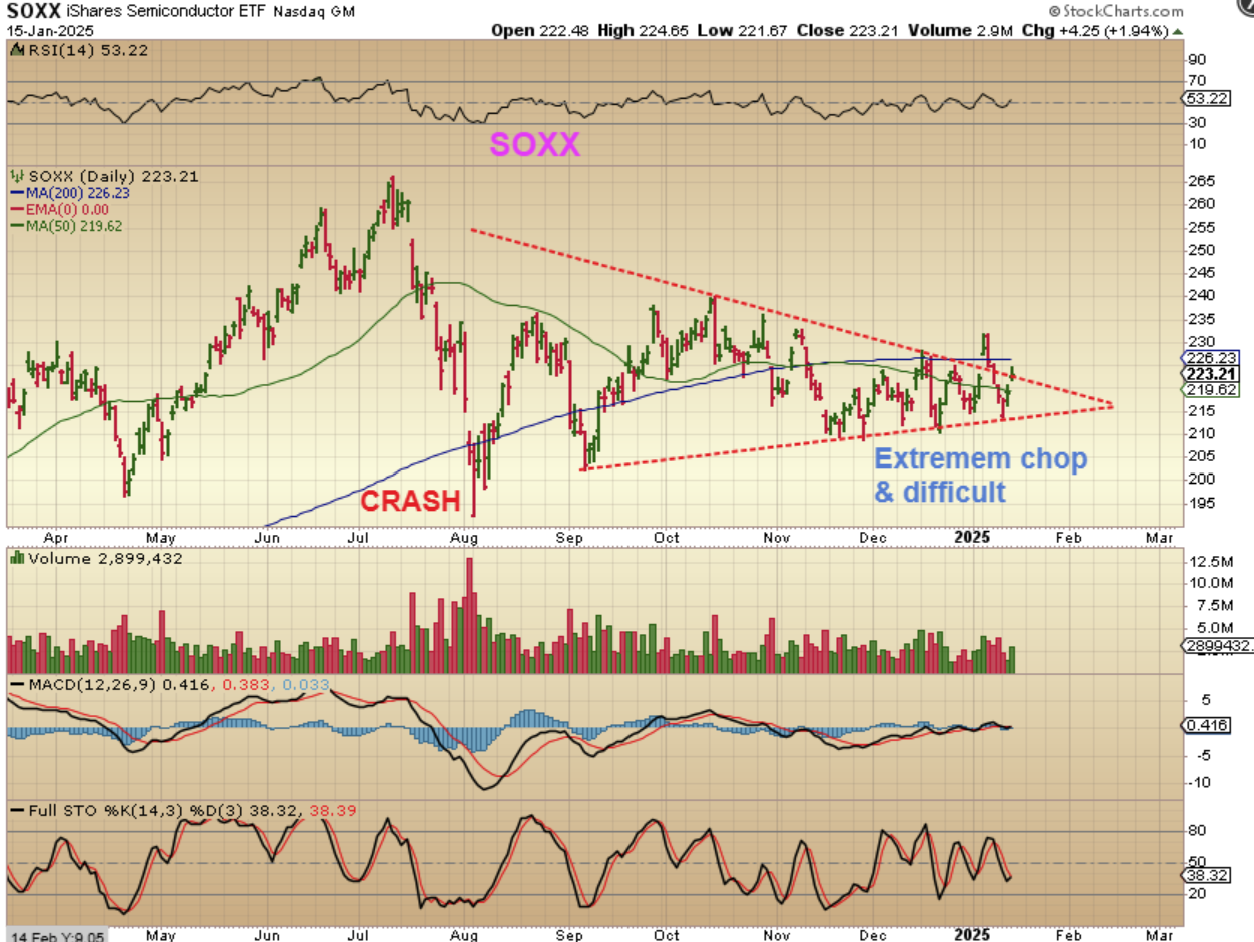
The SOXX is a choppy mess, but it could be doing what Oil did. Chop in an ‘impossible to trade’ mess, and then rally out of the consolidation. In fact, with that in mind, take a look at the choppy SOXX and then let’s go to Oil next…
.
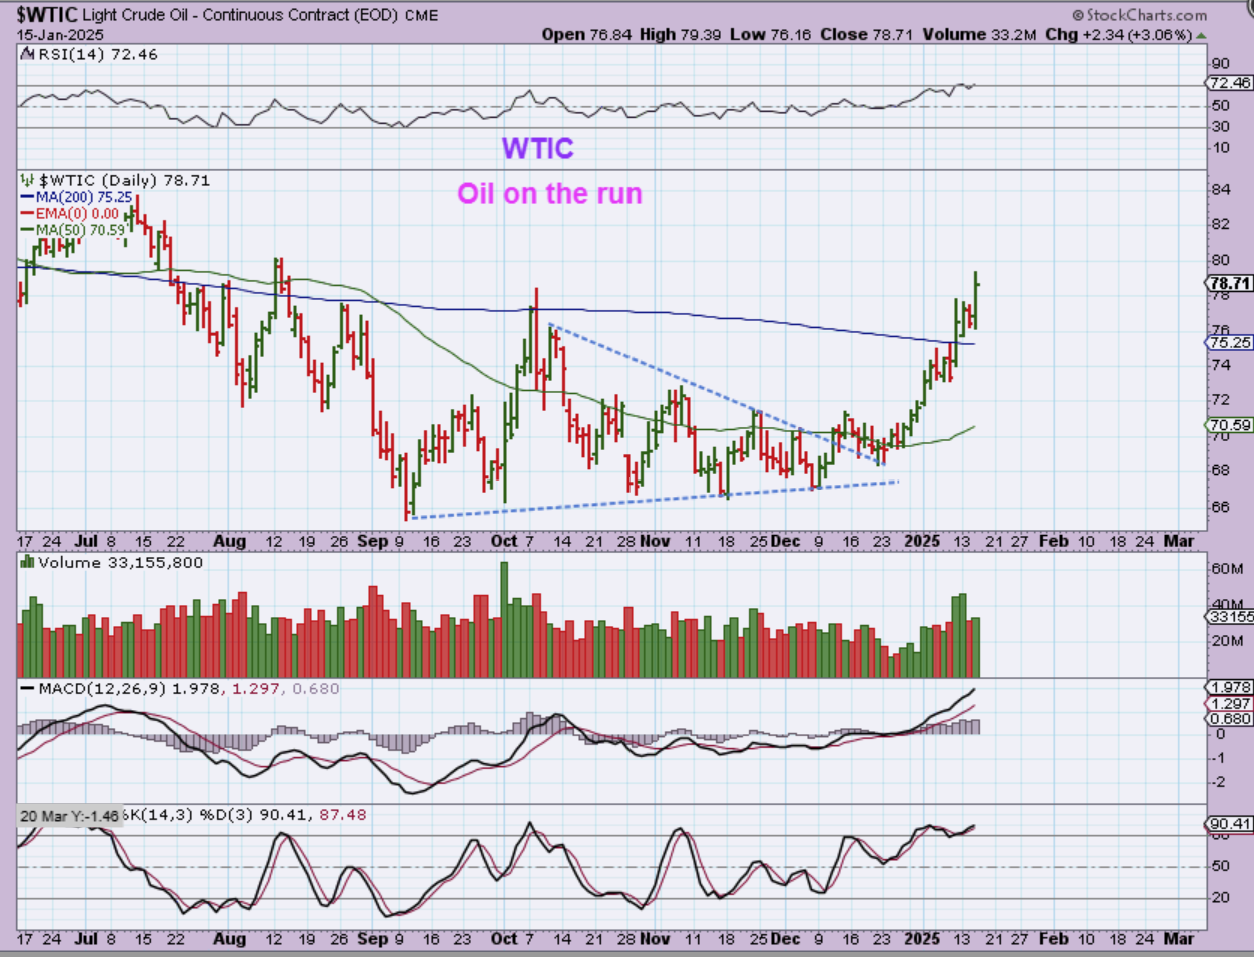
WTIC – Oil definitely chopped like the SOXX, but look at the result when it breaks from that mess. Oil ‘paused’ at the 200sma, but then it burst through it, paused again, and surged yesterday with the CPI release. Gold has also chopped inside of a triangle, so let’s take a Live look at Gold next…
.
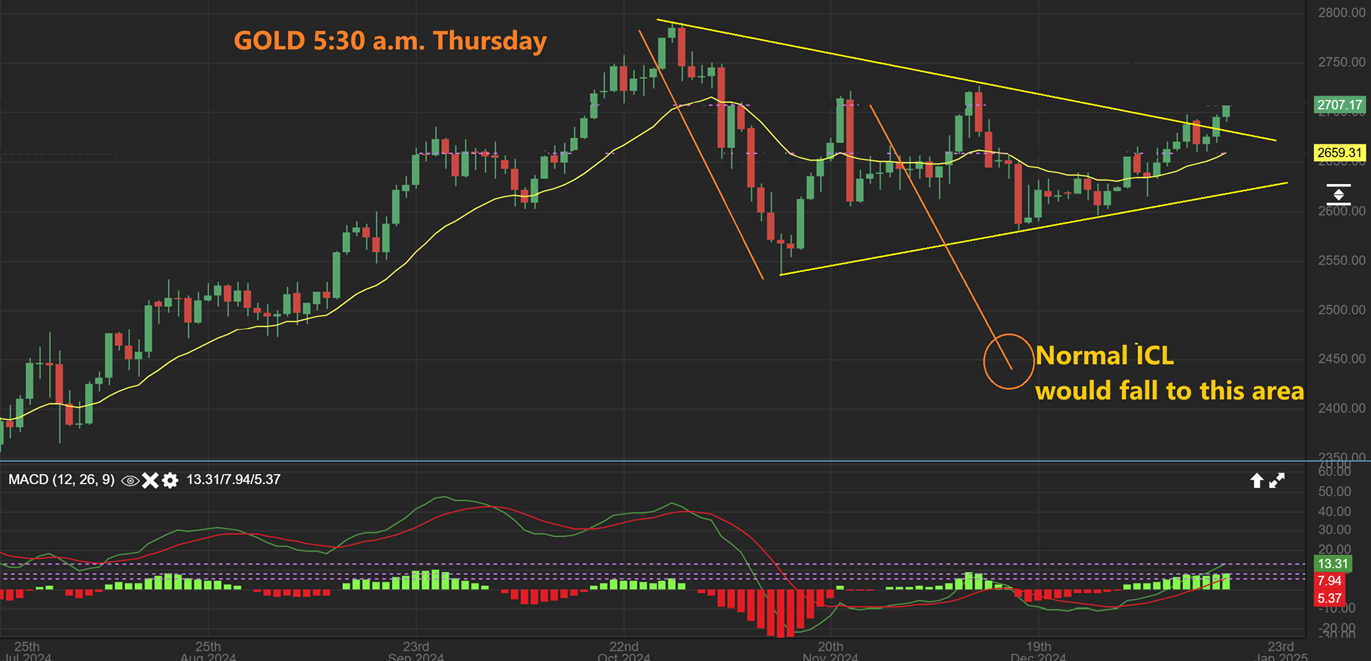
GOLD started breaking out yesterday and has a little follow through this morning.
Note: The triangle prevents the normal deeper drop into an ICL, so often I’ll mark the ICL at the last tag of the triangle – OR– you can just mark the lowest low and then expect an additional daily cycle. So, if we normally have 4 daily cycles, with a peak on the 3rd one, we would now expect that this one will probably have 5 daily cycles from the lowest low, with a peak on the 4th one. EITHER WAY, this should be very bullish for Gold.
.
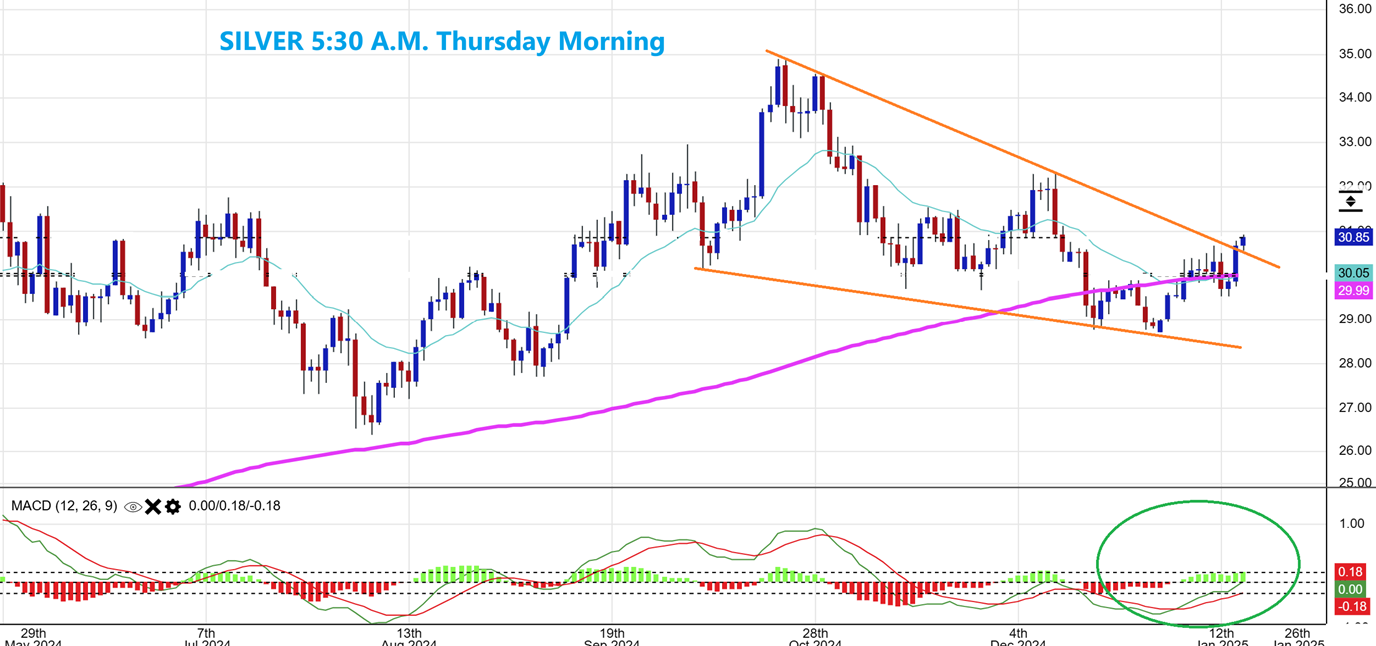
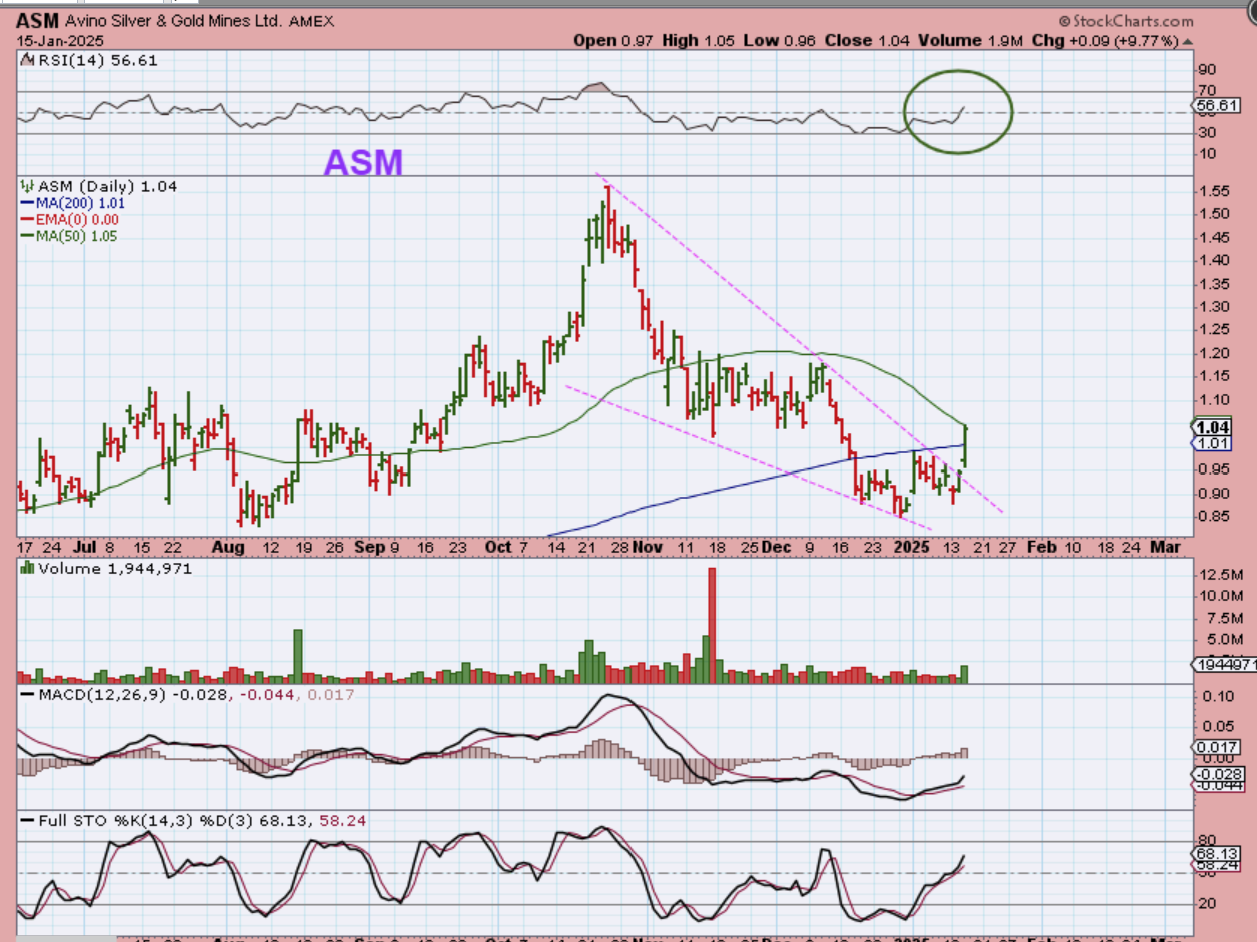
SILVER reached the downtrend yesterday, and this live shot from this morning shows Silver breaking out from that downtrend. Silver did NOT put in a triangle, so it did drop to new lows and now has a bullish descending wedge. I’ll be honest, I didn’t like the way some silver stocks acted yesterday, but 1 day is not enough to draw a conclusion. AG, FSM, PAAS. & EXK were red with silver up nicely, SSRM, CDE, MAG, and ASM were green for example, with MAG and ASM looking the best yesterday. We’ll see what today brings.
.
MAG and ASM looking the best yesterday.
ASM was lagging a bit, but it broke the downtrend yesterday and gave us a 10% gainer day. It really should try to run back to the highs & then some, over time.
.
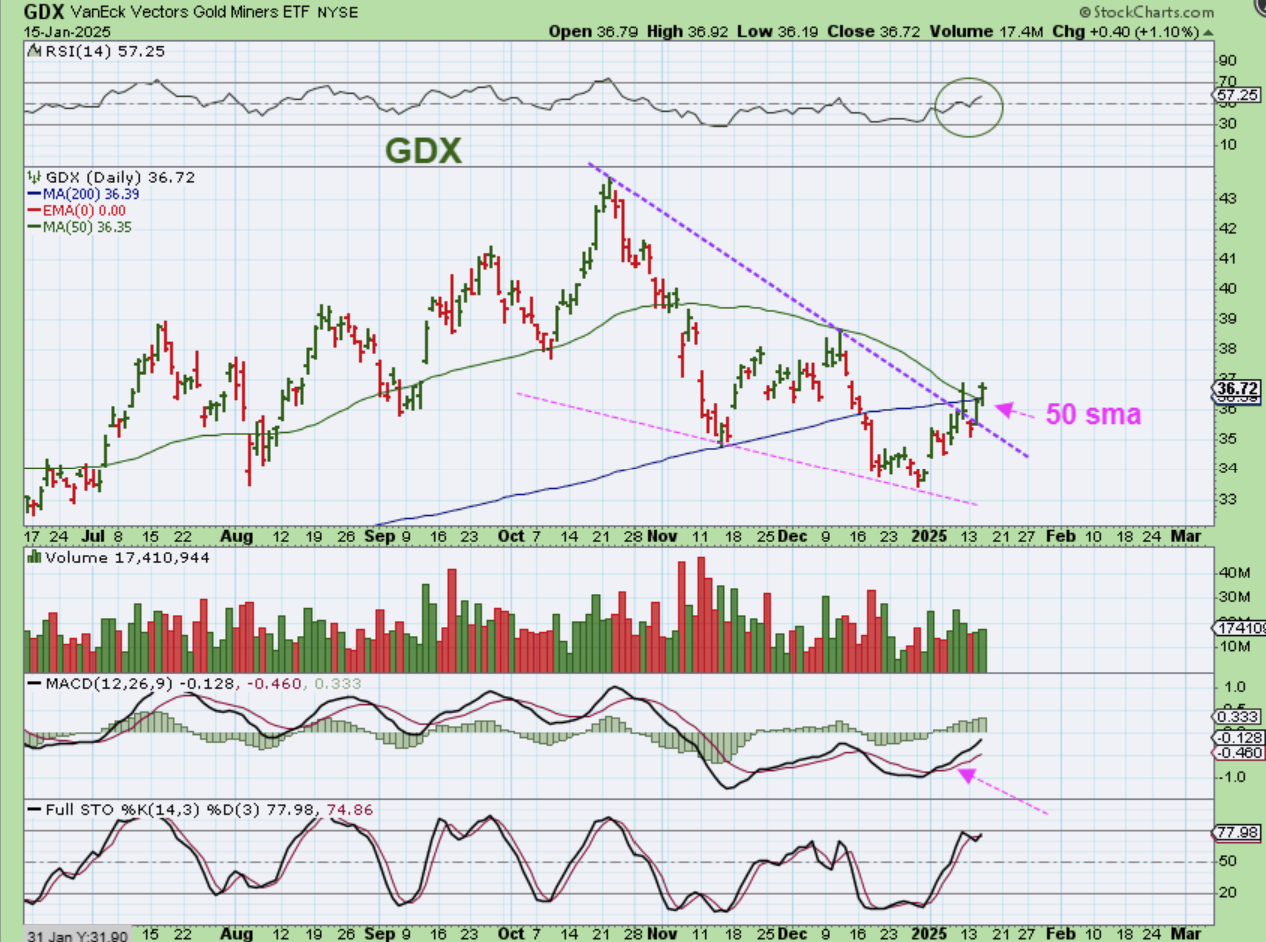
GDX popped, dropped and closed the gap, and then continued higher at the end of the day. I like the gap fill and the move over the 50 sma and downtrend, but only a 1% gain with Gold and Silver moving nicely higher yesterday? I guess its giving people time to climb on board. It is a bullish set up.
.
Today we’ll see what the jobless claims does, if anything. The reaction to the CPI Numbers was bullish in all sectors, including Bitcoin. It would be nice if the Jobless Claims report adds to that rally. I’ll cover Bitcoin below. Enjoy your Thursday trading!
.
~ALEX
.
.
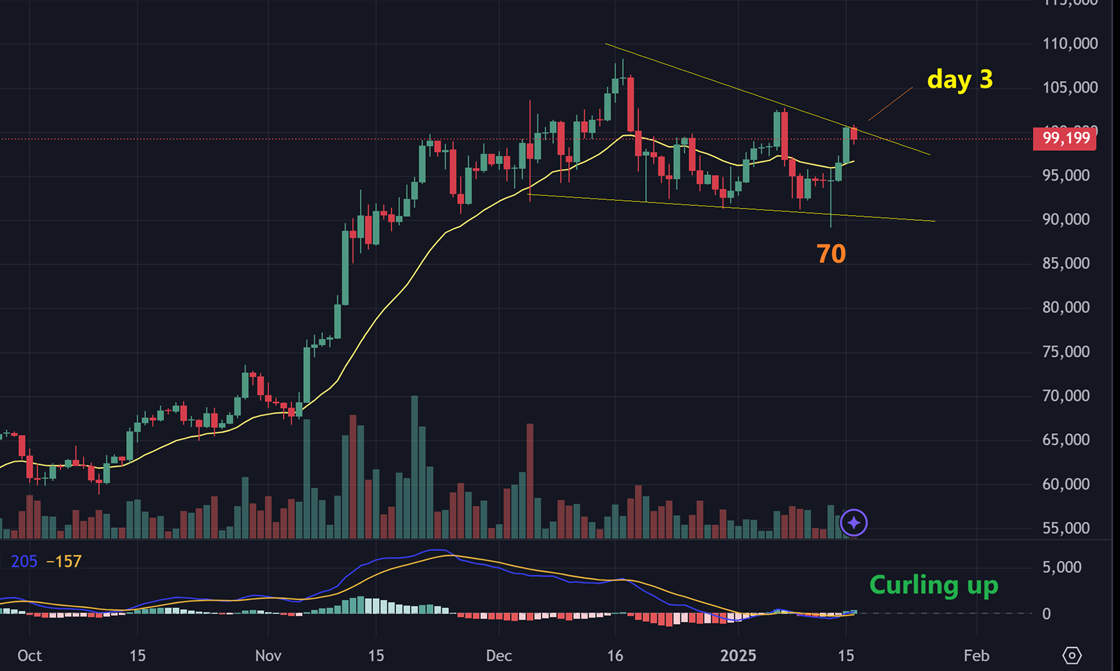
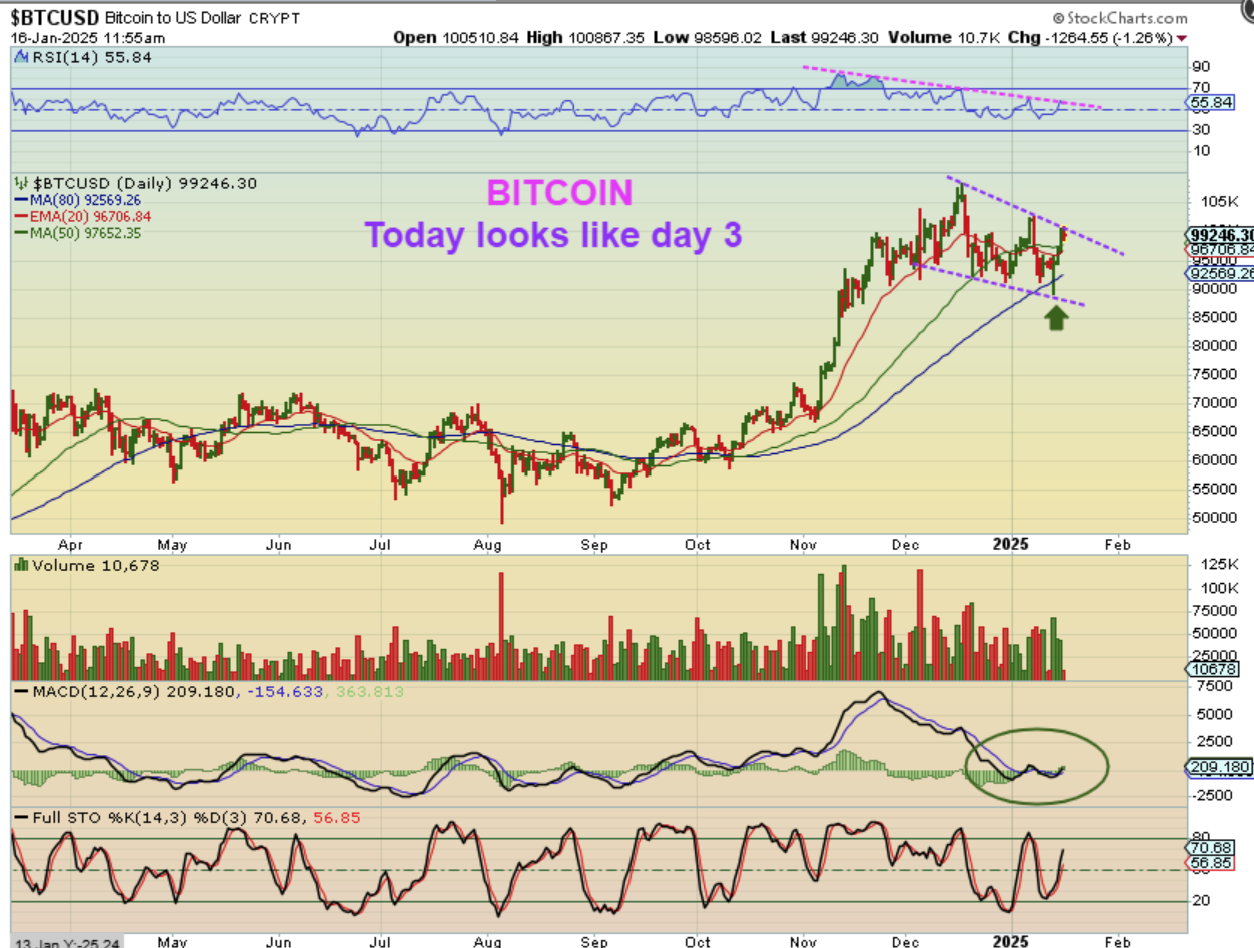
BITCOIN is on day 3 and has reached a resistance point and paused. It can pull back further and be fine, but Bitcoin is known to be very strong, so it also could just power through much sooner than later.
.
BITCOIN: The bigger picture is a very bullish looking set up, if it breaks out higher. So far, the crypto stocks are very volatile, but they are acting correctly (possibly because the General Markets were running higher too).
.
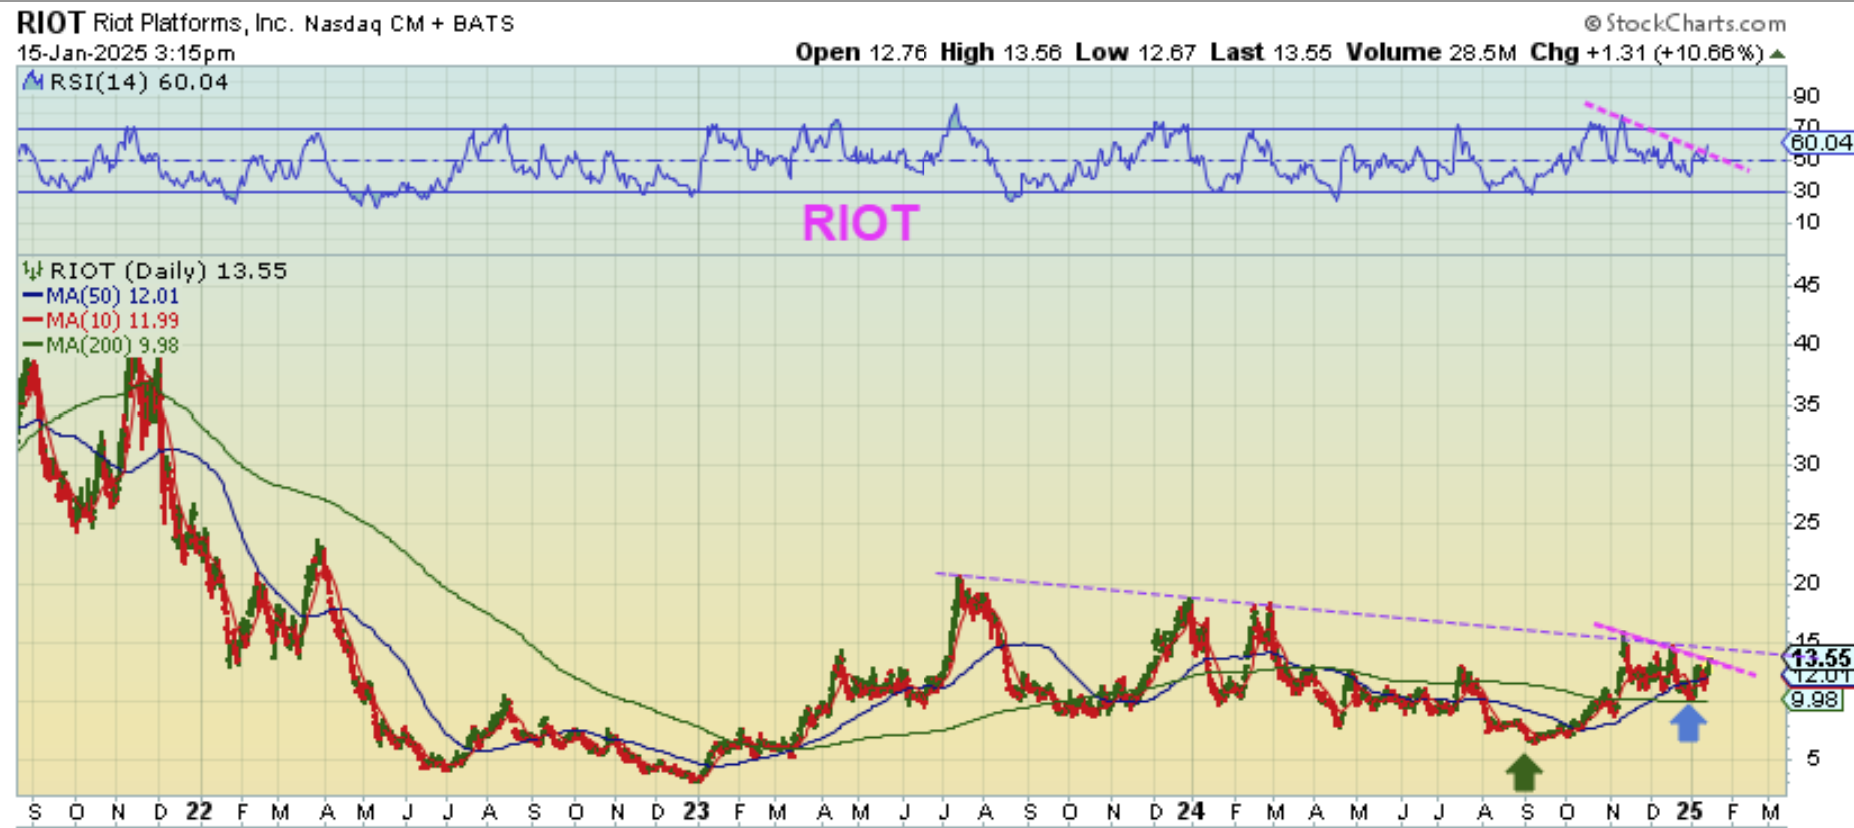
I pointed out RIOT as bullish recently, saying that when Bitcoin dropped to a new day 70 low, RIOT put in a higher low. Well, right in line with Bitcoin, it is also at resistance. When Bitcoin breaks out, RIOT may follow. Notice the MACD.
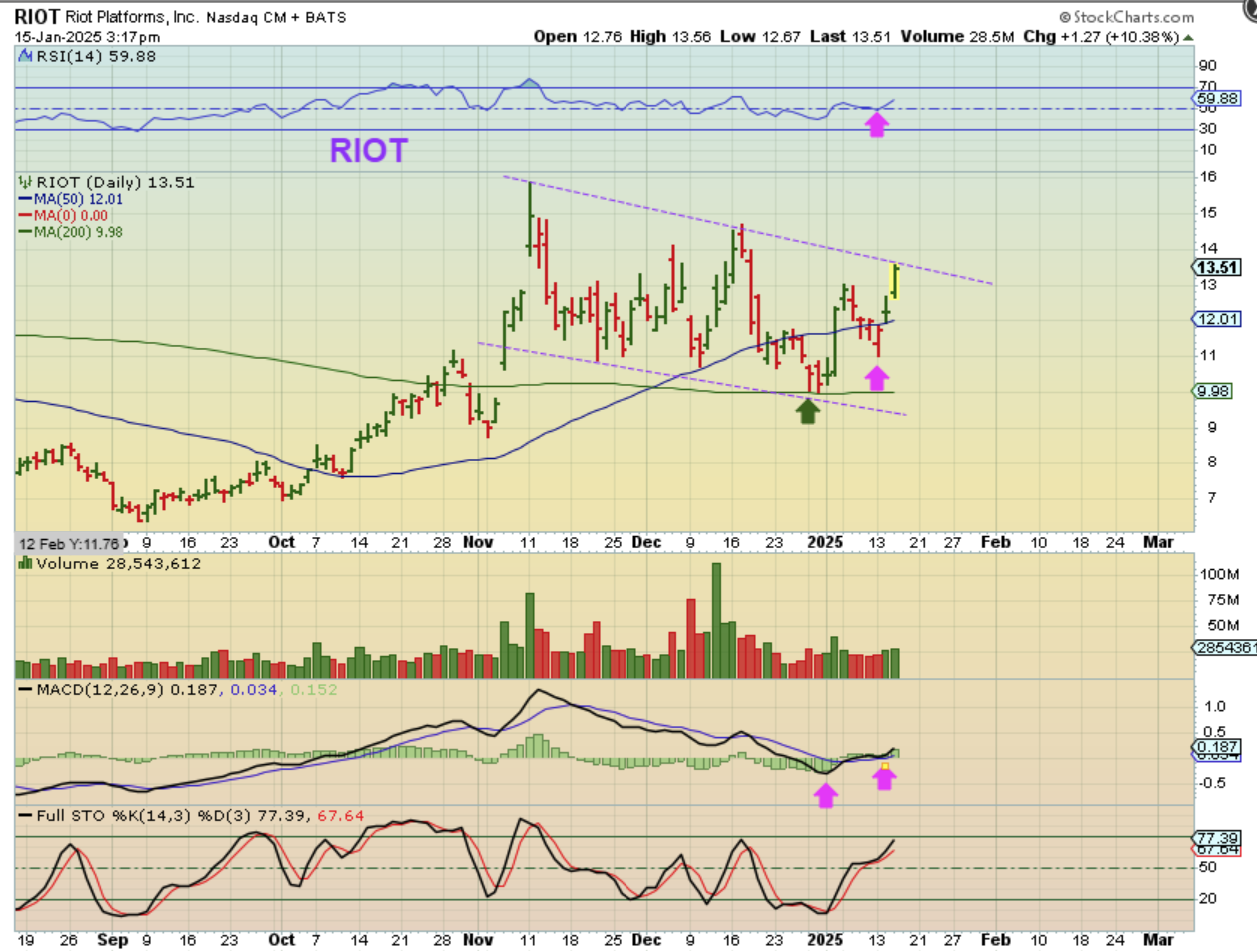
.
RIOT has a large base that it has formed (many of these actually do), so keeping an eye on the bigger picture can help with the volatility shorter term. If Bitcoin runs to $120,000+, this may start to trend higher over time too.