Tuesday January 7th – Discussing Dips
It appears more and more likely that the election in the U.S. has changed some of the markets’ actions. I also discussed this in the recent reports and the weekend report. Everything remains bullish that was bullish, but when I say that things are changing, it seems that the pull backs and consolidations may be shorter. More buyers seem to be buying again, so this is going to be a bit of a longer report to try to review some of that again.
.
In the weekend report I discussed how the markets acted after the last election year. I said that it is possible that this could repeat, and it meant either very mild ICLs, or just very long intermediate cycles. Very bullish conditions. We saw one that seemed to last all year following the election. The weekly chart simply rode the 20 ema. I wrote…
,
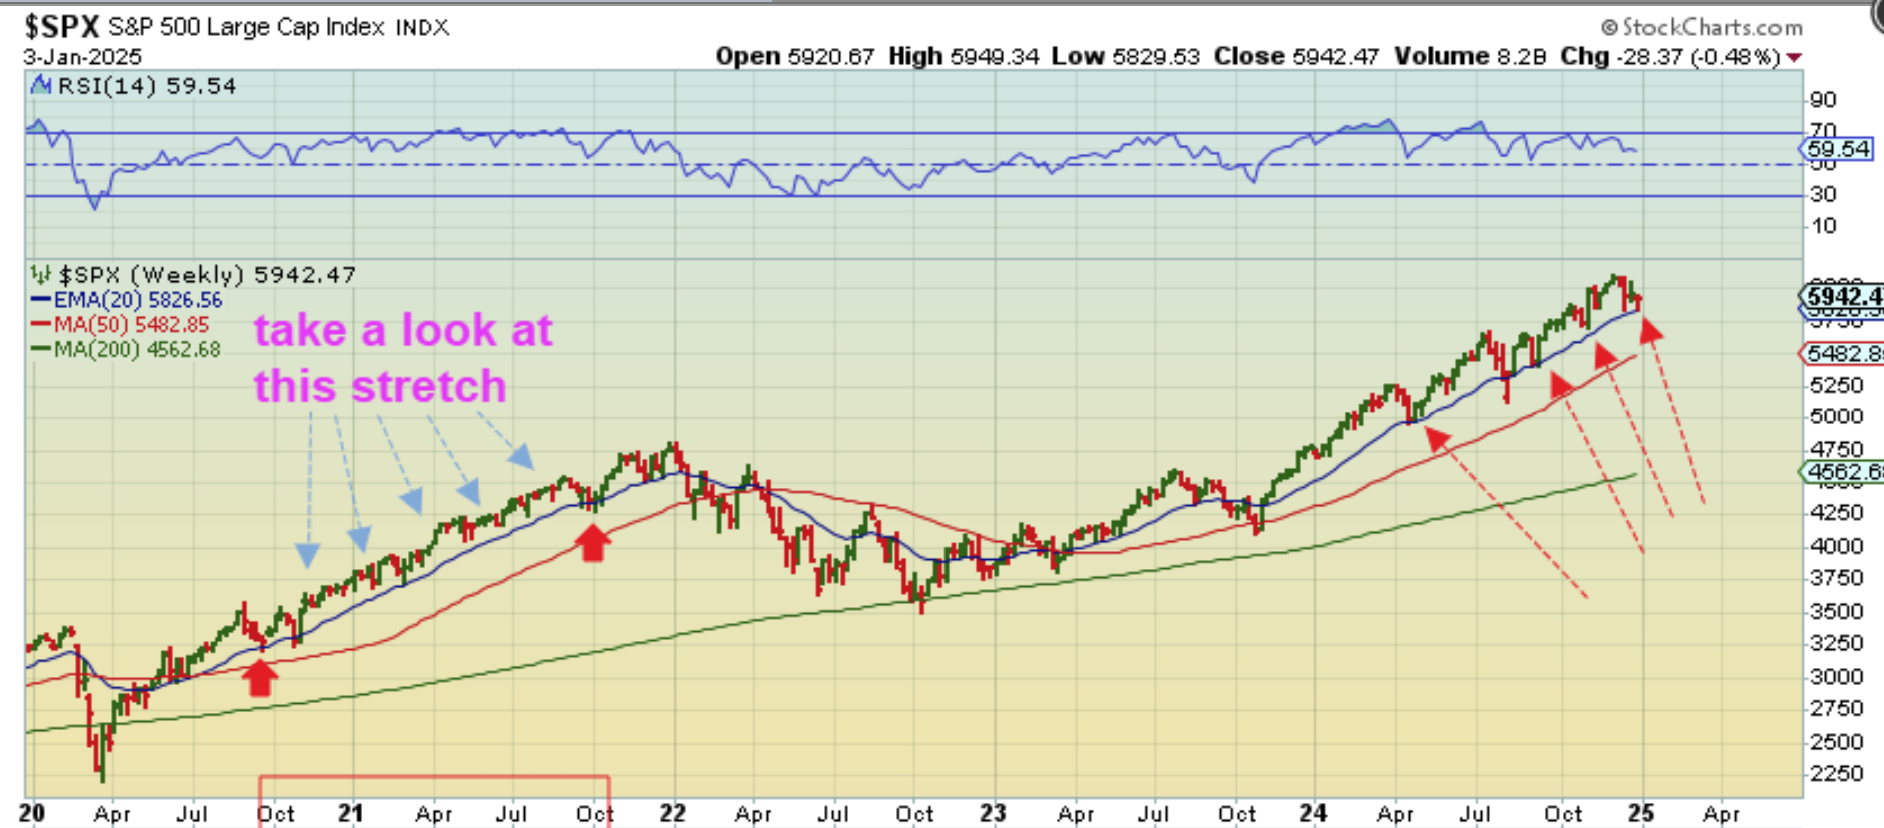
SPX WEEKLY – 2020 and 2024 were election years. I wanted to compare that with now and was surprised at what I found:
1. Look at October 2020 and that post-election rally into 2021.
2. That rally in 2021 didn’t give a solid slam down ICL for about a year, right? It dipped to the blue 20ema weekly line, and really that is all that we are seeing now. SO that raises the question:
3. Could 2025 rally in a similar way that 2021 did? I’d say maybe it could, but you can still just buy the dcl with stops in case we do roll over in a couple of weeks into the ICL drop.
.
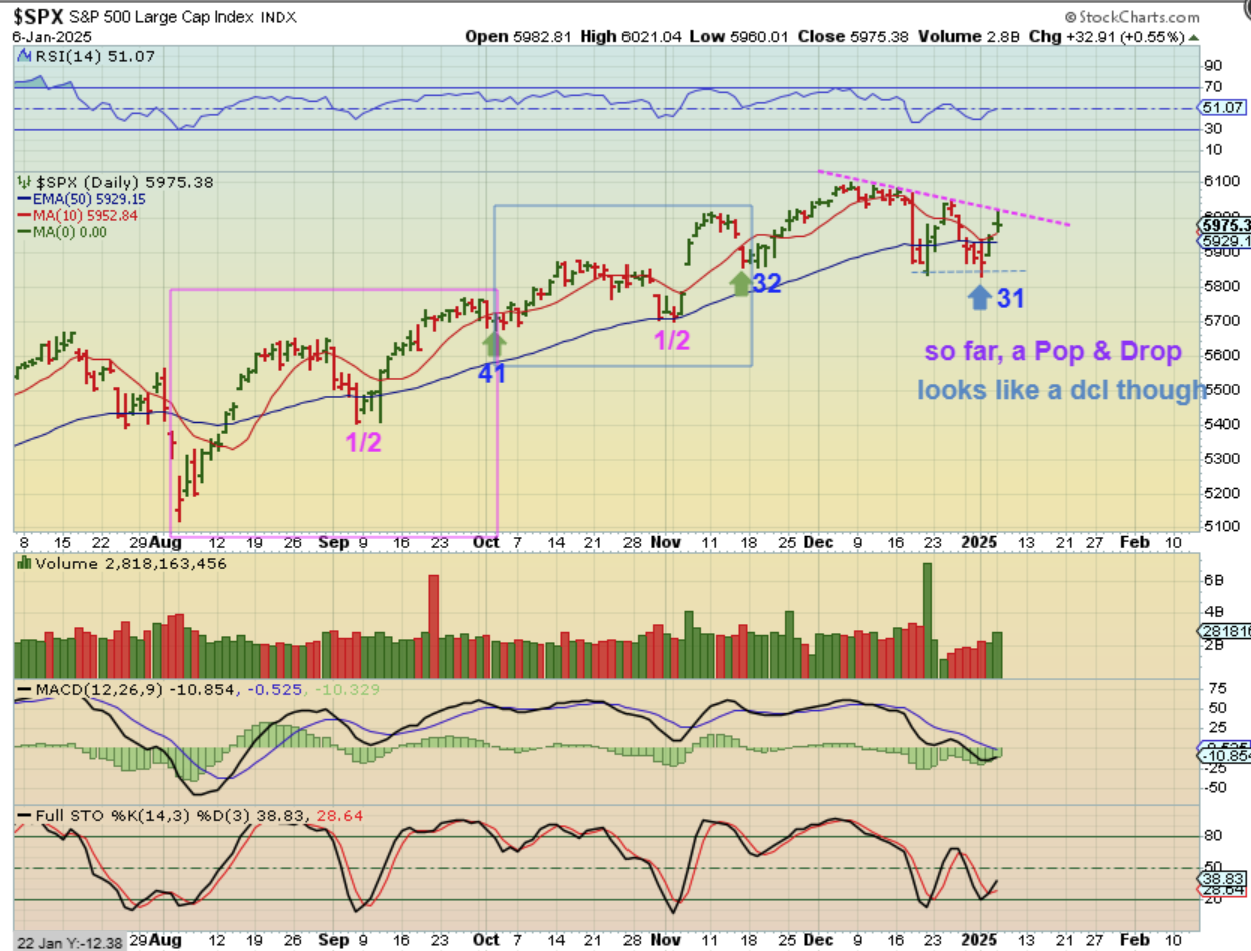
On Monday The SPX gapped open higher, rallied even higher, and then sold off into a doji. I think that this indicates that we now have a day 31 dcl, similar to our last one. I want to discuss the stocks next…
.
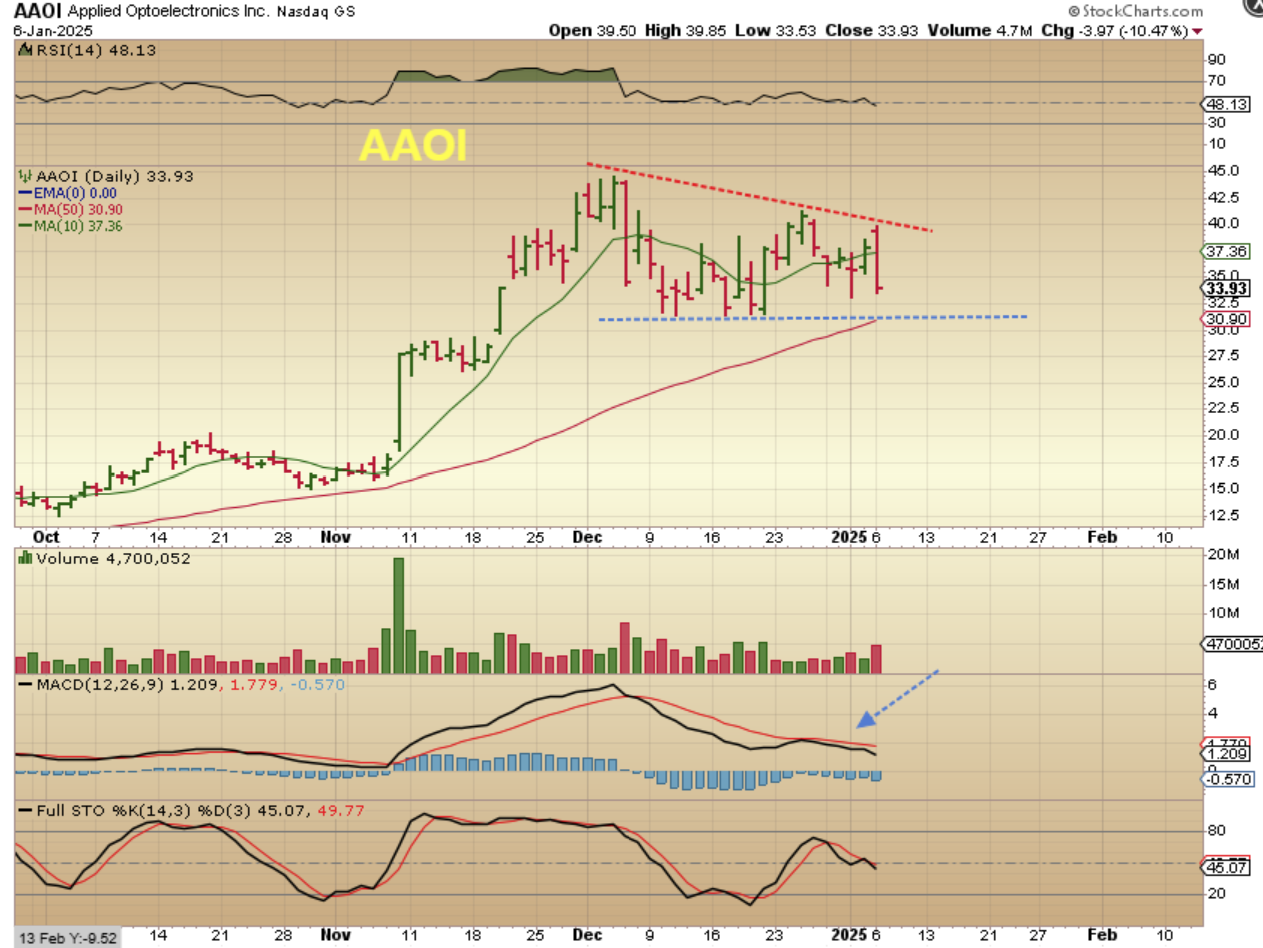
AAOI – I have liked this company for trading and I have pointed out that I wanted to watch some of these stocks that just recently became strong bulls. AAOI, SOFI, RKLB, PLTR, AFRM, XMTR, etc etc, ran swiftly recently. Those, along with the other longer-term bulls like AMZN, NVDA, GOOG, AAPL, NFLX, etc etc could be monitored for lows at support and possible entry. AAOI gapped up and sold off yesterday.
.
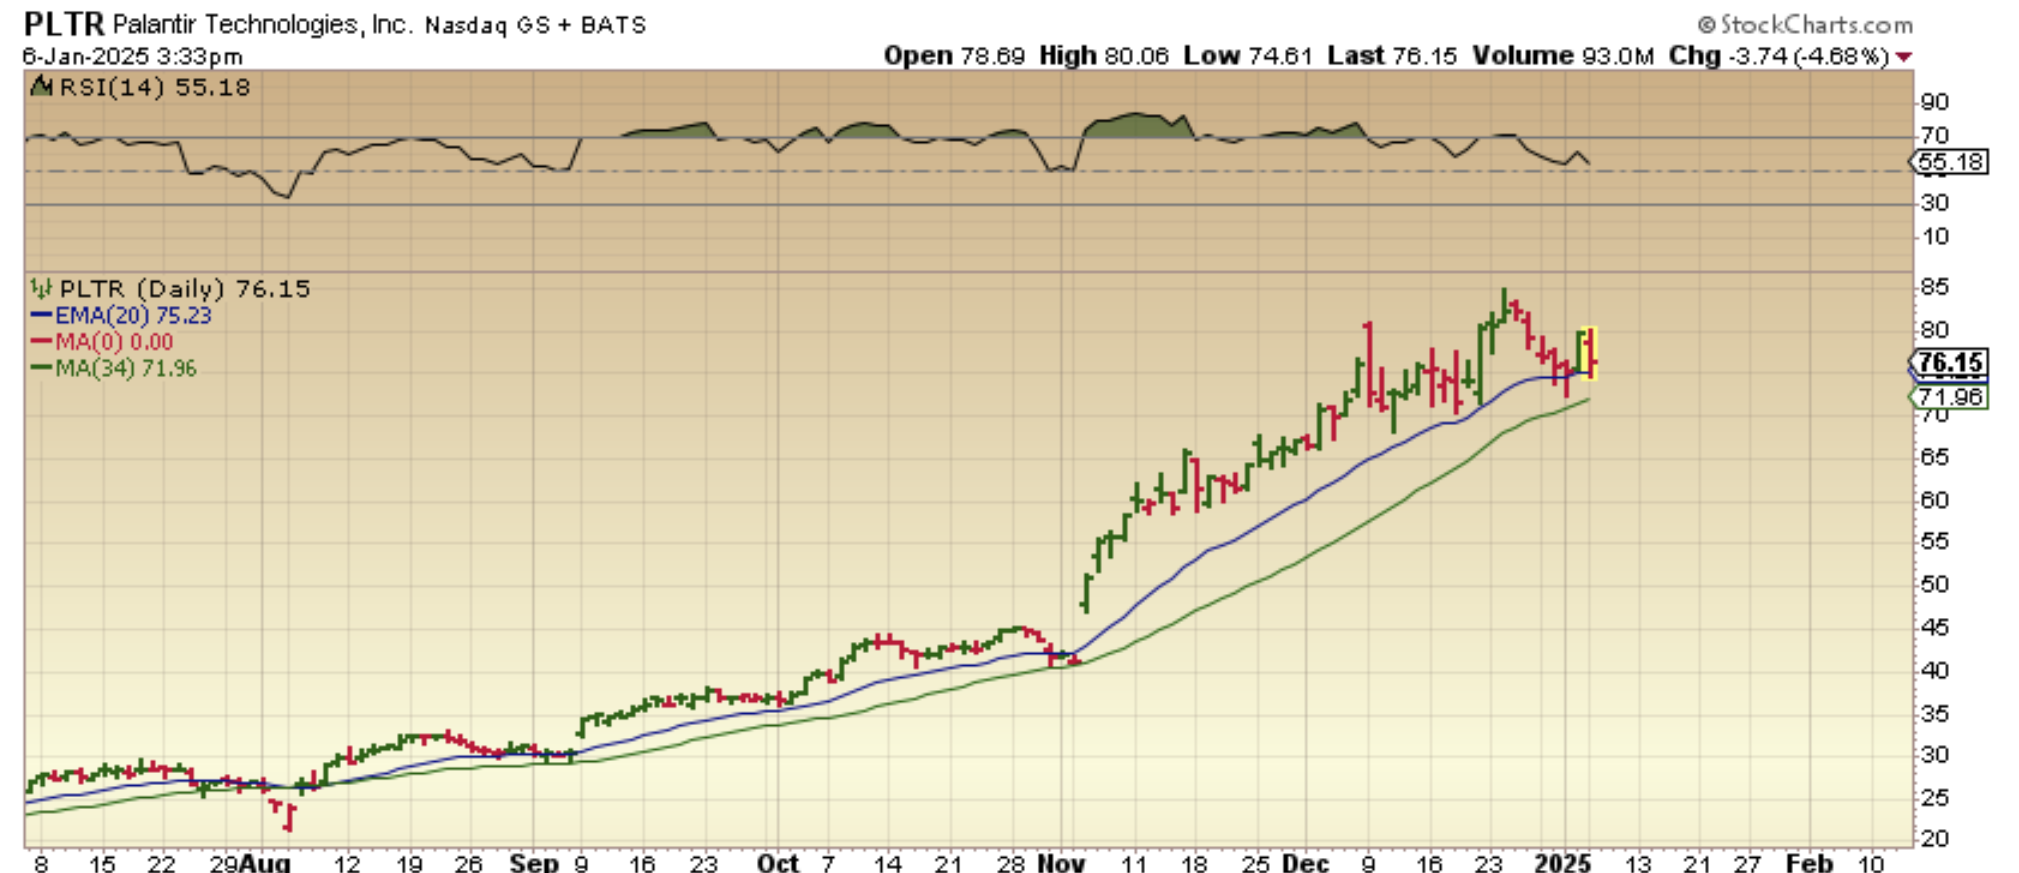
PLTR sold down to the 20ema. Is it possible that after the recent extremely strong run, these new recent swift runners are going to consolidate the gains rather than run again? It is possible, so it will be monitored. Also…
.
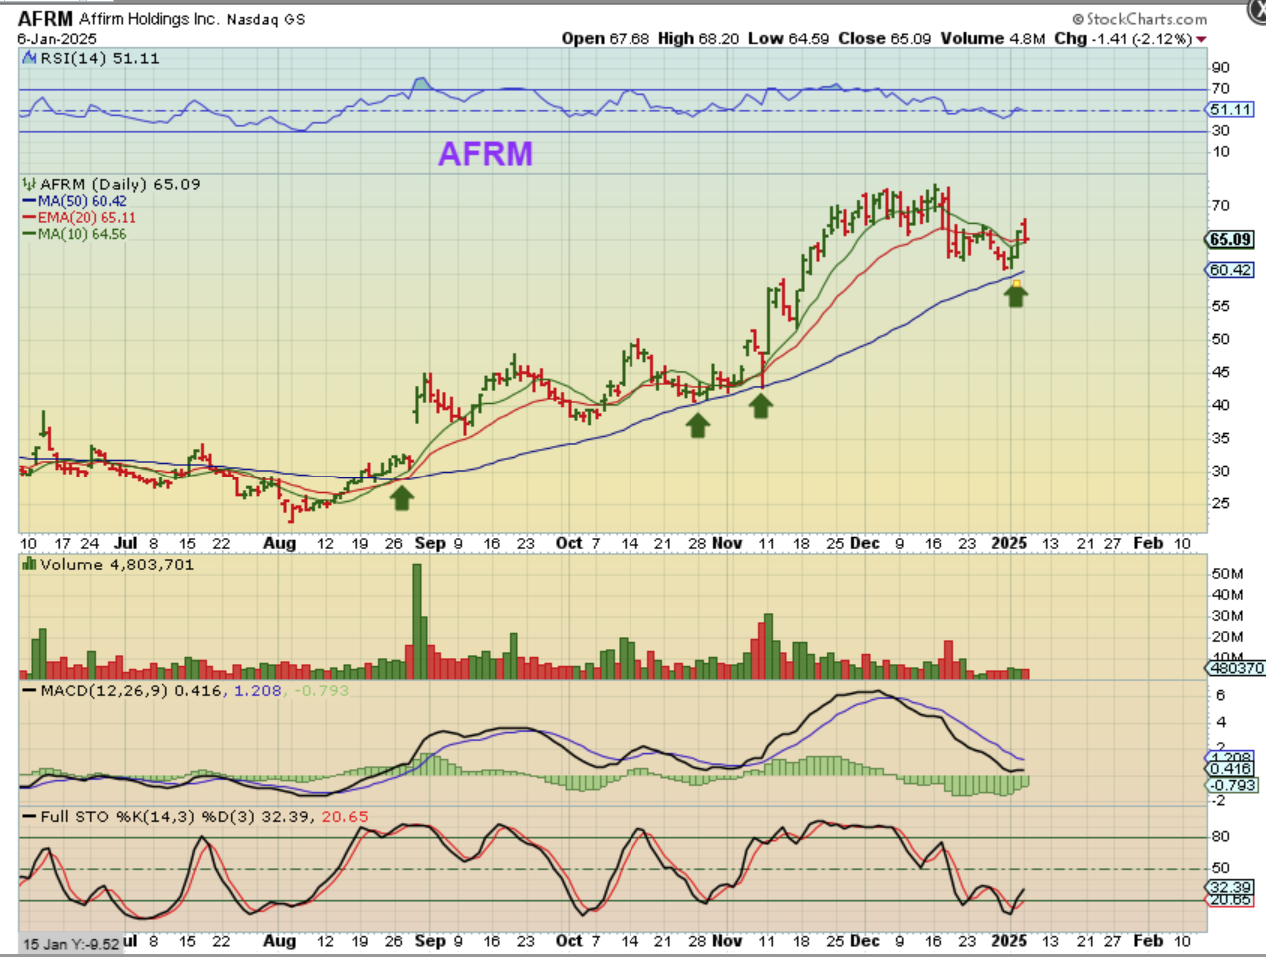
AFRM ran from $25 to $70, but it consolidated on the way. That helps to keep it bullish. After another November rally, it gave us another small sell off or consolidation to the 50sma. It does still look good and could be a buy with a stop, so what about some of the other ones that already sold off or consolidated like this one?
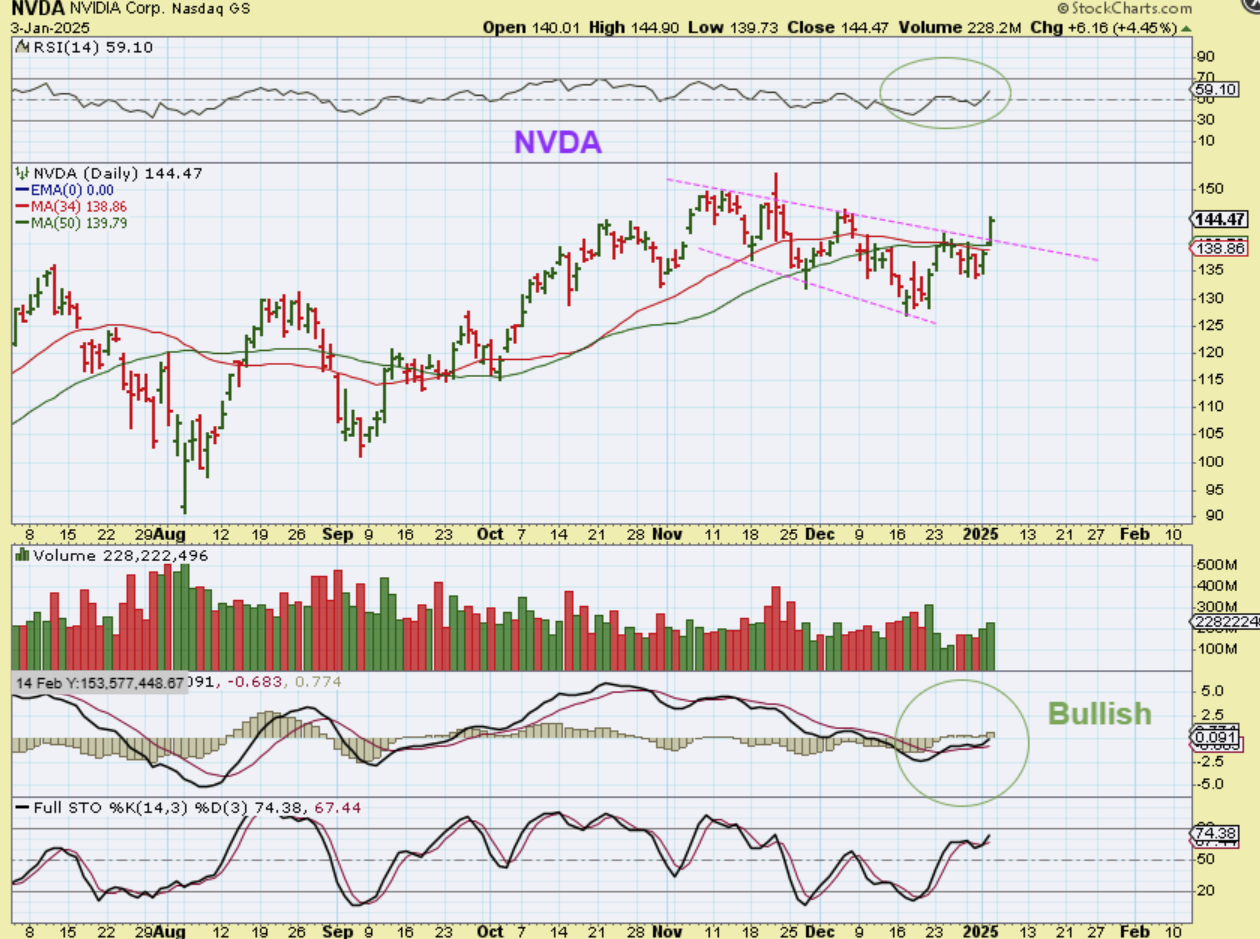
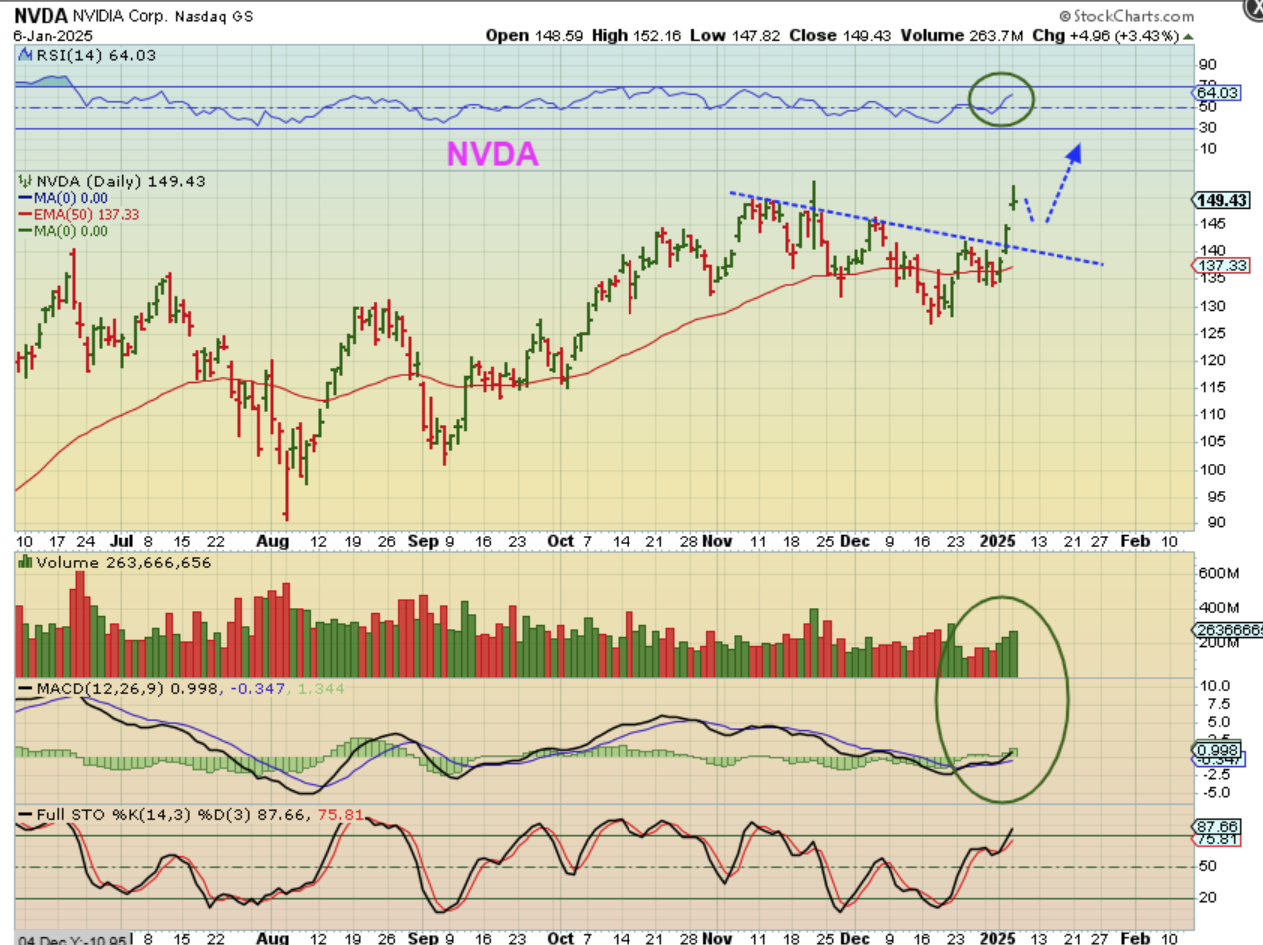
.I already pointed out that NVDA consolidated for 2 months and then broke the downtrend on Jan 3rd. And …
.
NVDA was up another 5% yesterday, but started to pull back with the Markets, so it does look good and may do a gap fill as a buy opportunity. We can work our way into these stocks if you haven’t taken position yet, but wanted to.
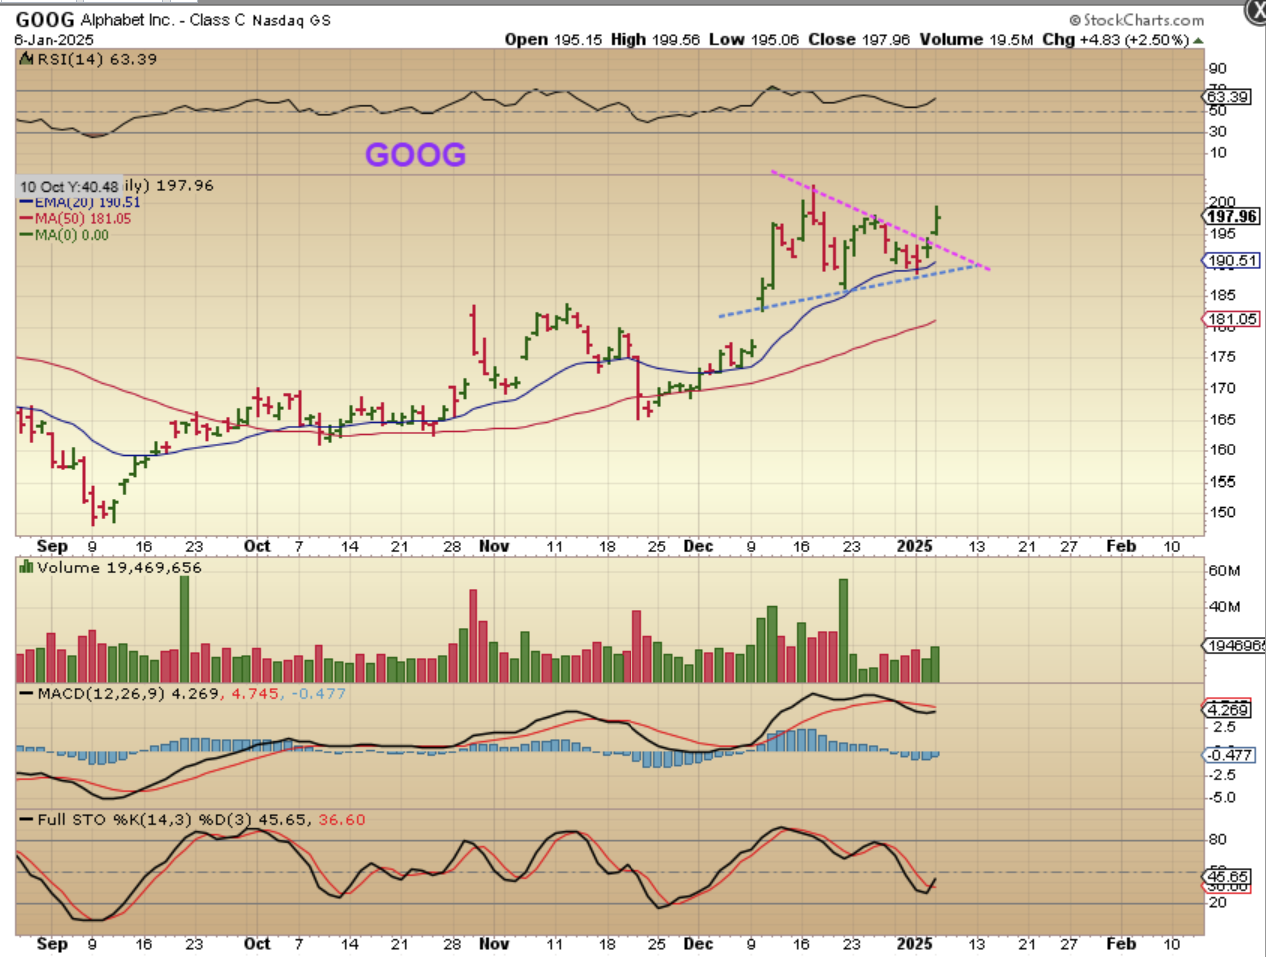
GOOG, AAPL, AMZN, etc did break higher yesterday too. They have small consolidations already, so they may be ready to run again.
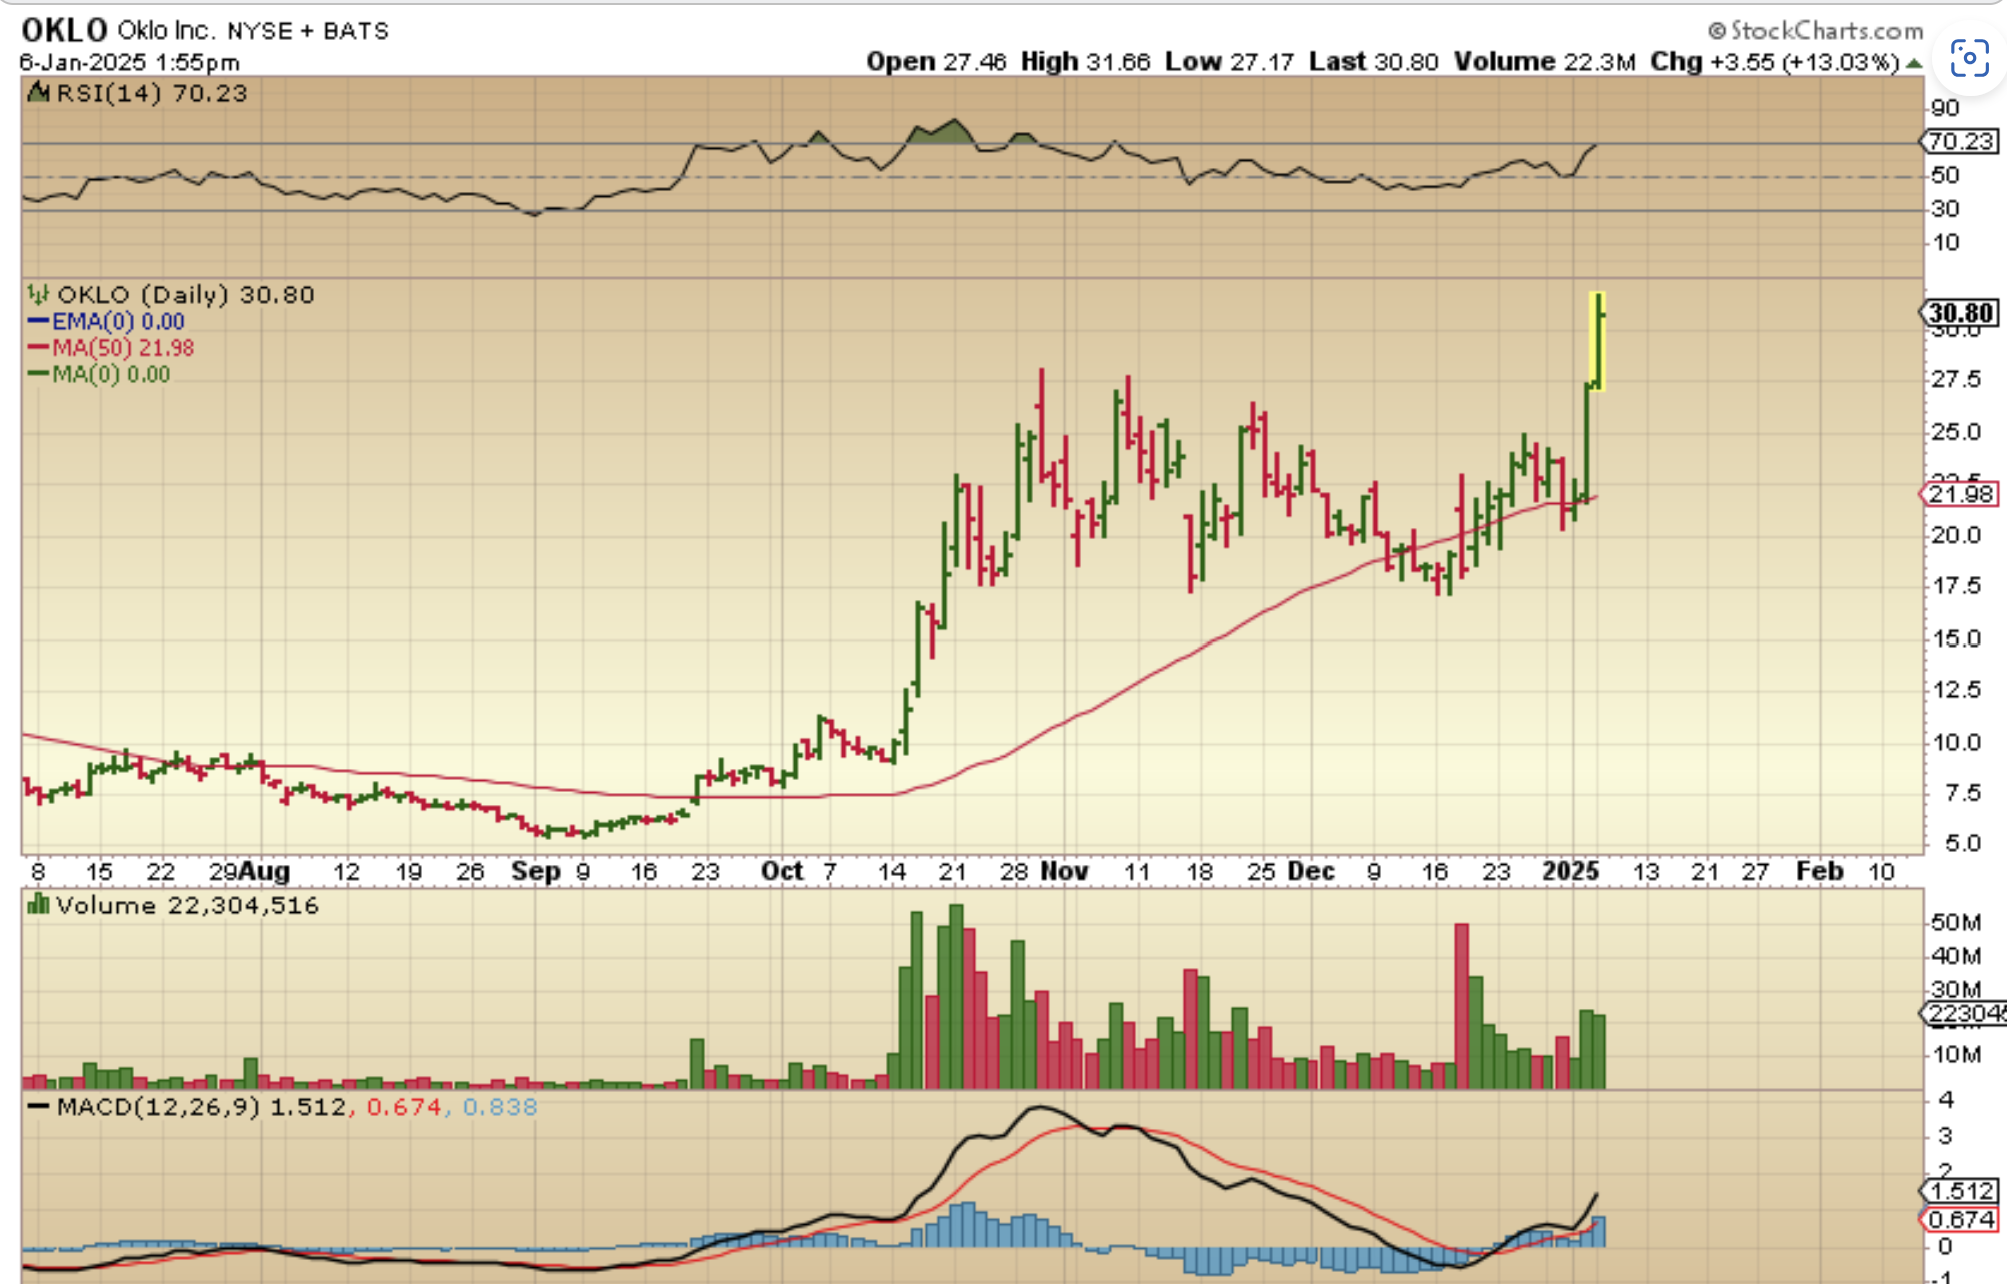
OKLO had a huge choppy consolidation, but it broke out Friday (with same sector stocks like NNE, SMR, LTBR, etc) and did have follow through on Monday. These move in extremely big ways, so if you didn’t buy a breakout, you may need to patiently wait for a dip. NNE and SMR look good after consolidations too.
.
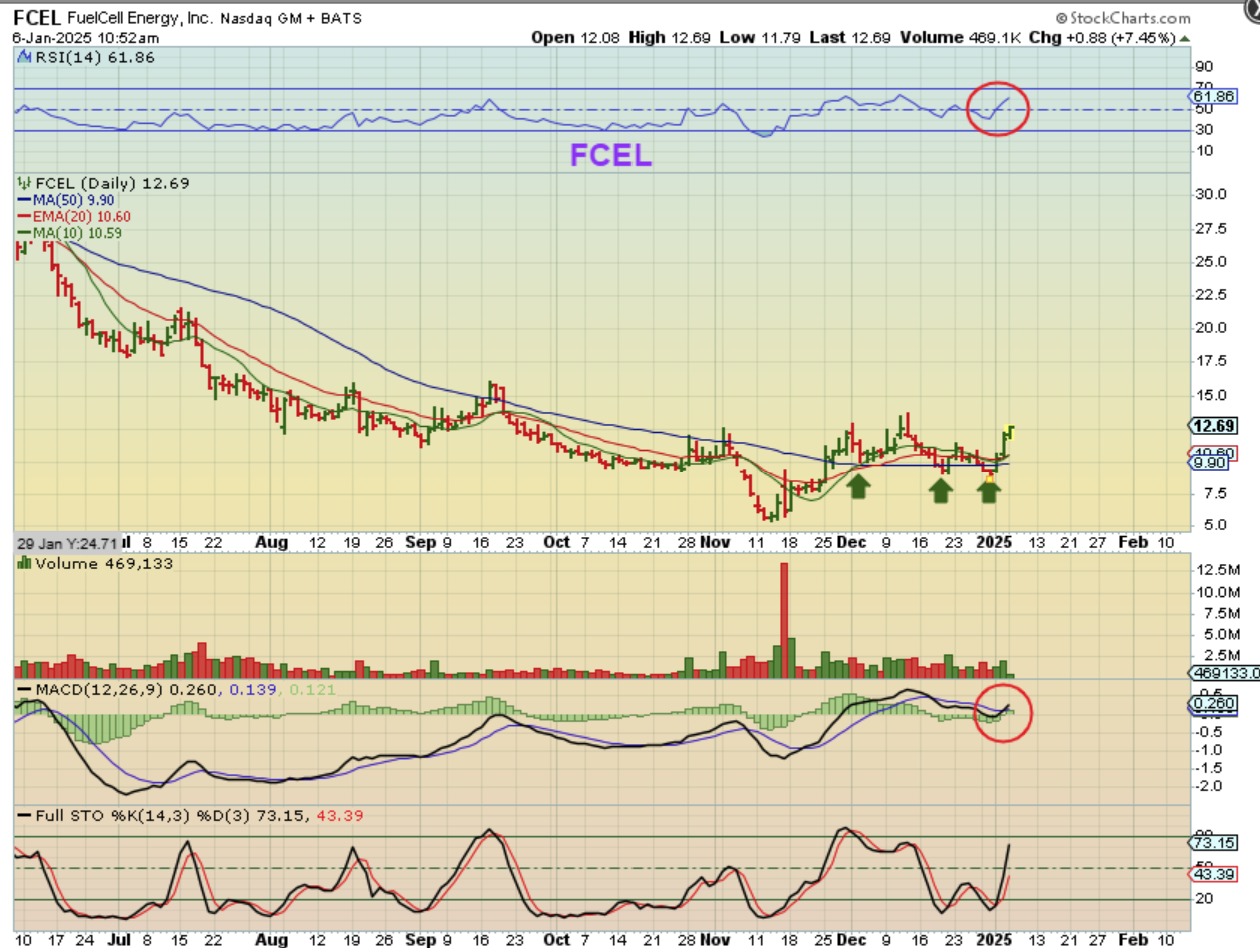
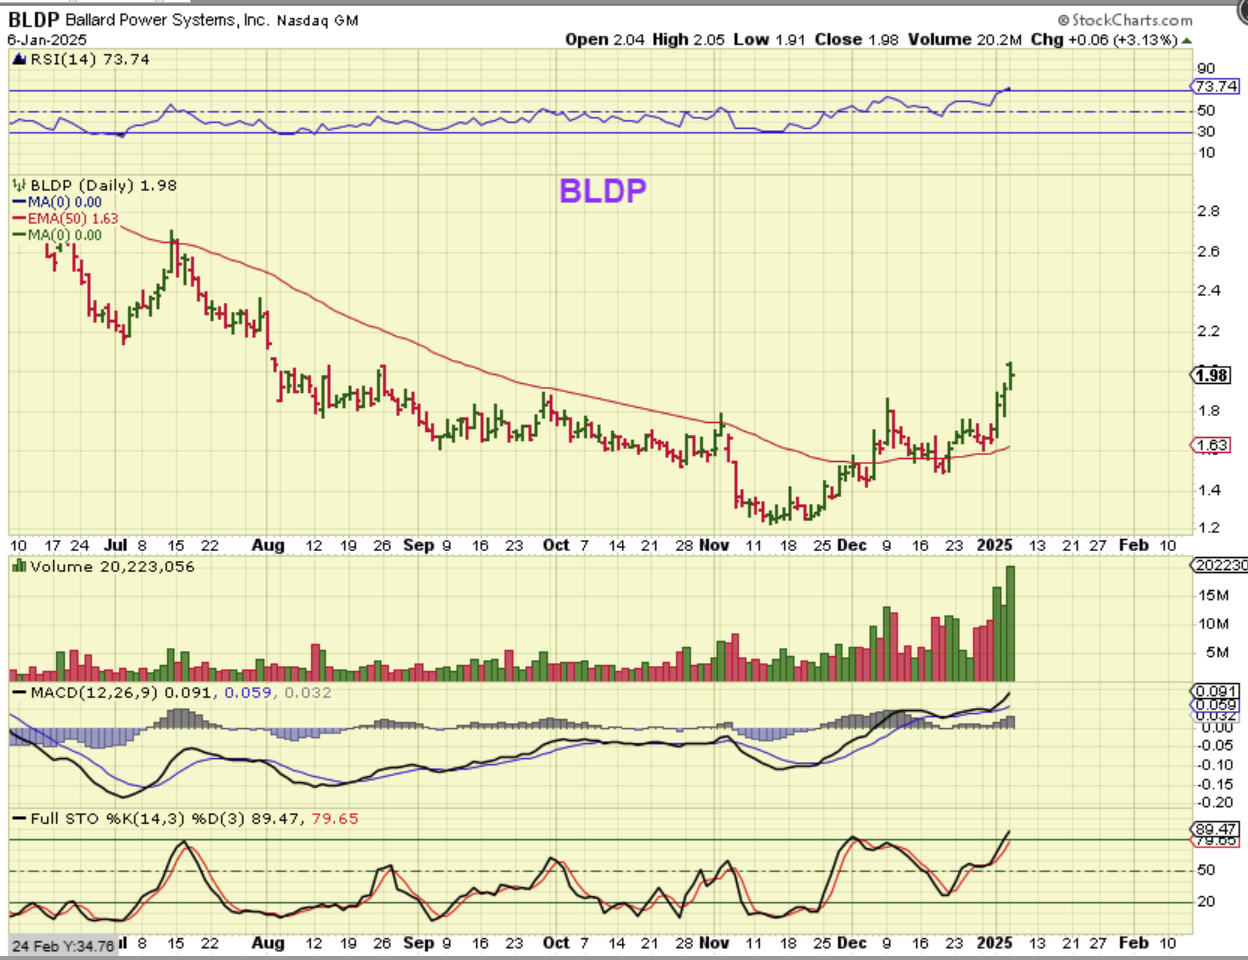
FCEL was a buy at $6 for us, and honestly remains a ‘Buy & hold’ as it consolidated around the 50sma. It ran from $6 to $12, consolidated, and could run again. The sector of clean energy has been Popping. GEVO, PLUG, BLDP, CLNE, etc. In fact…
.
.
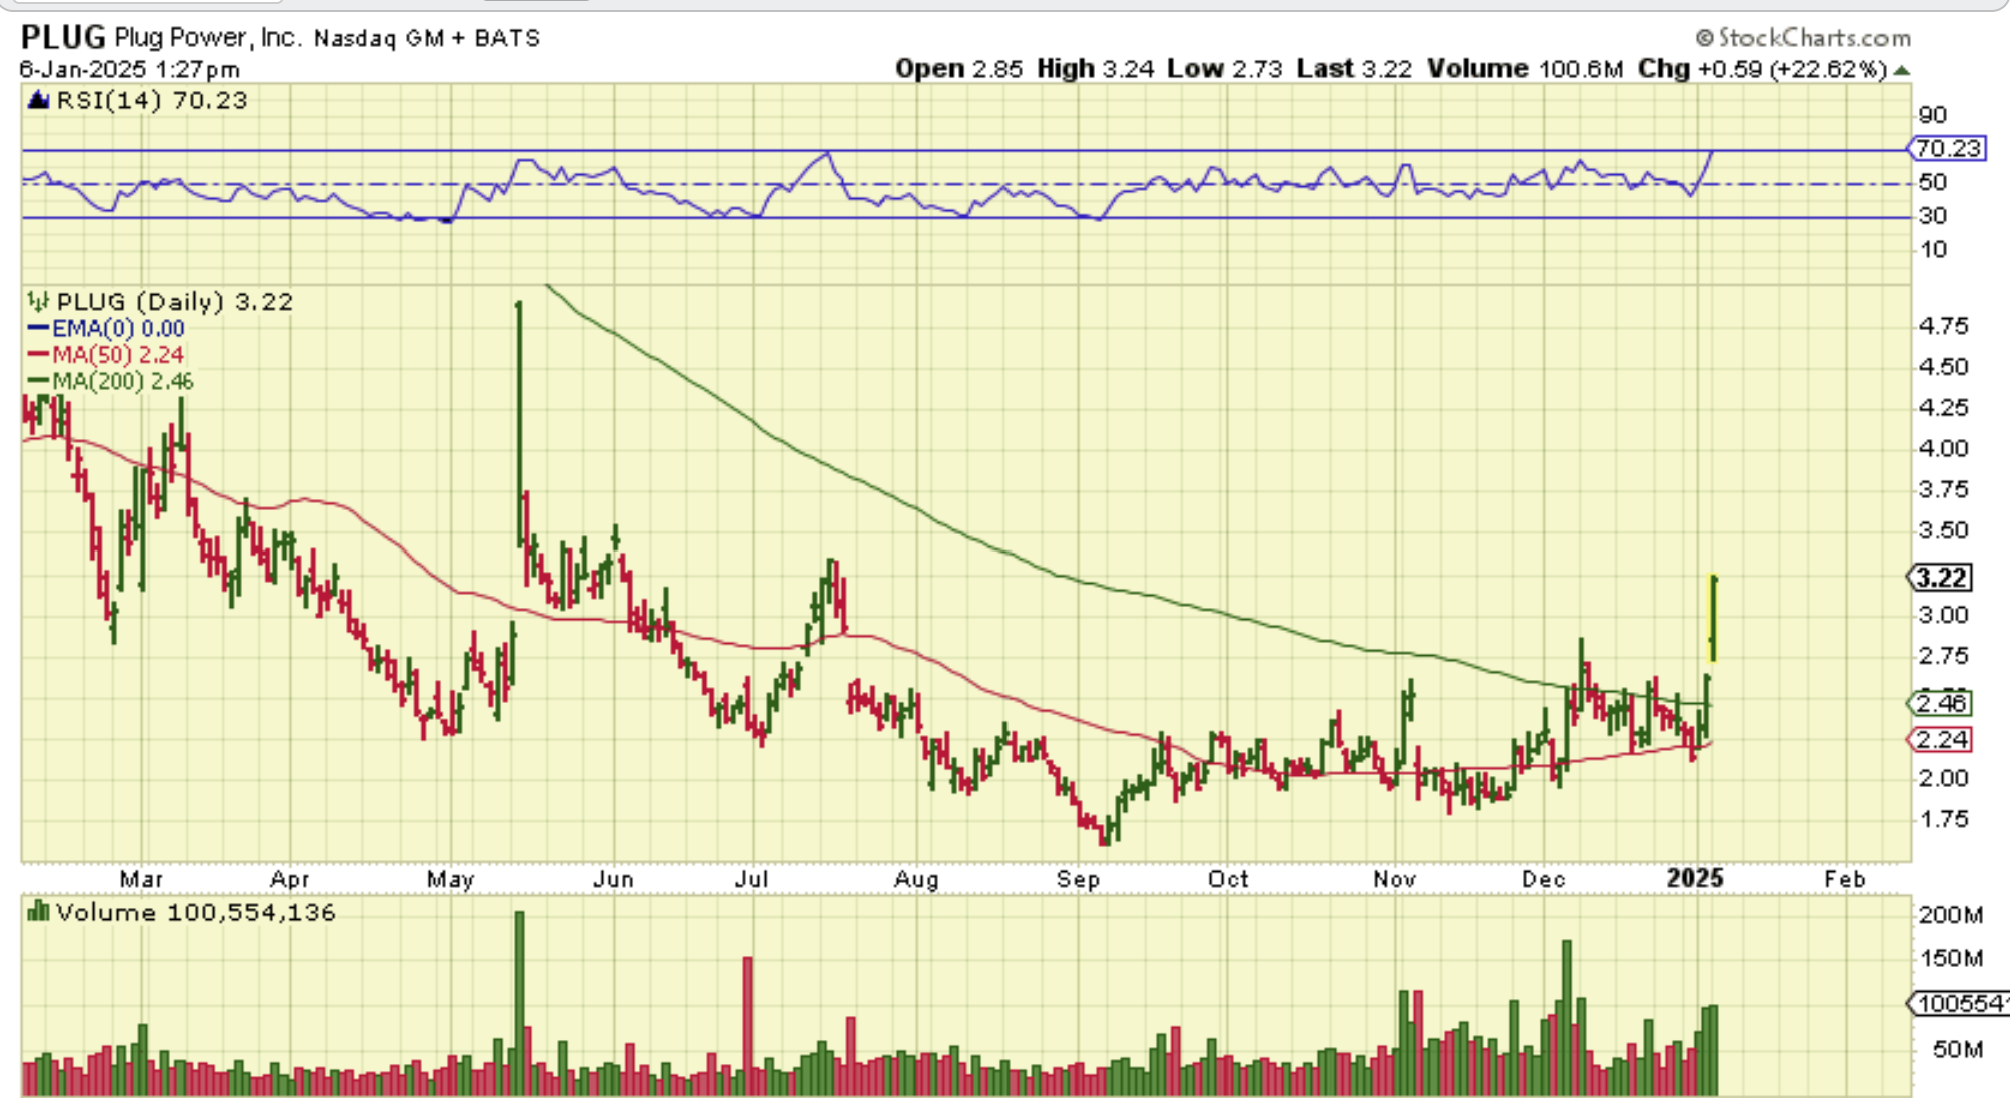
PLUG broke out Friday and continued higher Monday, so this sector looks good.
In fact….
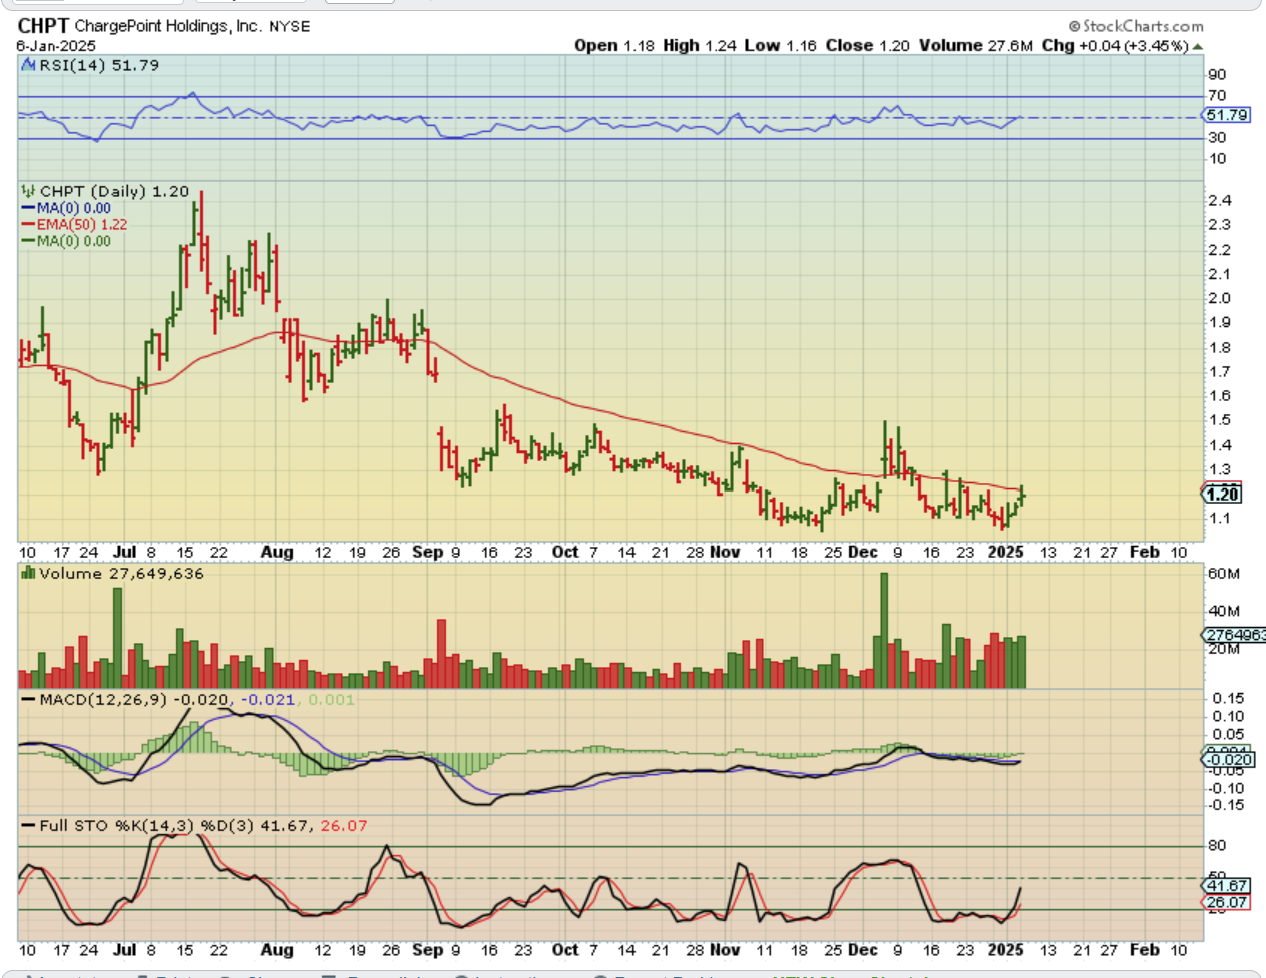
BLDP broke the 50ema, back tested it, and started to run again last week. Buy the dips. So if this is ready to run, what about CHPT?
CHPT does look set up to break out too. Notice what it did when it broke the 50sma last June. It broke out in December but returned under the 50sma with the recent dcl selling. I think that it could be ready to go now that a dcl seems to be in place.
,
And next, this is really something odd!
.
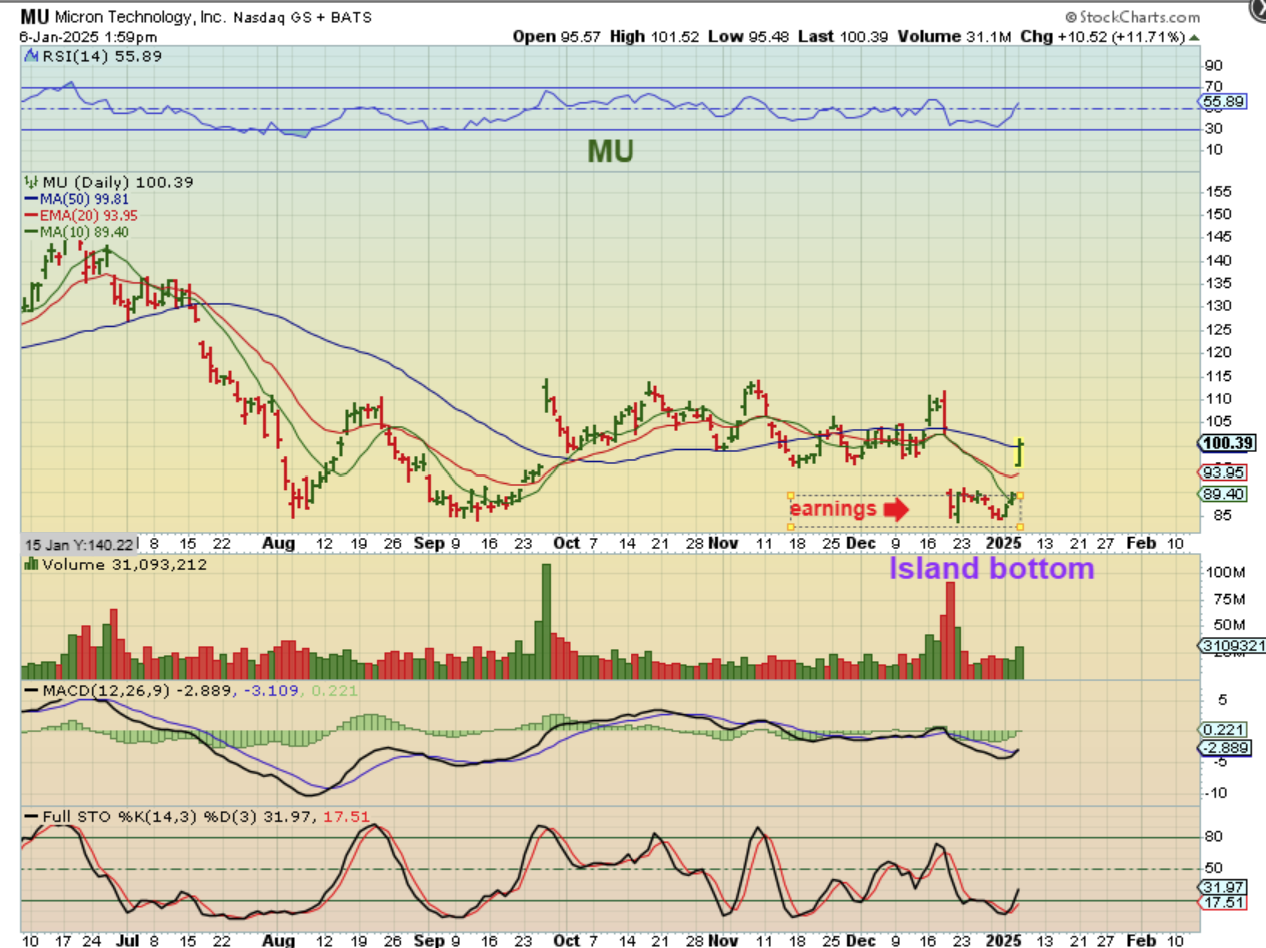
MU (semiconductor) crashed with earnings in December, built a base, and then yesterday it gapped up and was up over 12% at one point. This is a bullish island bottom and it could continue to run higher, but the real oddity here is that…
.
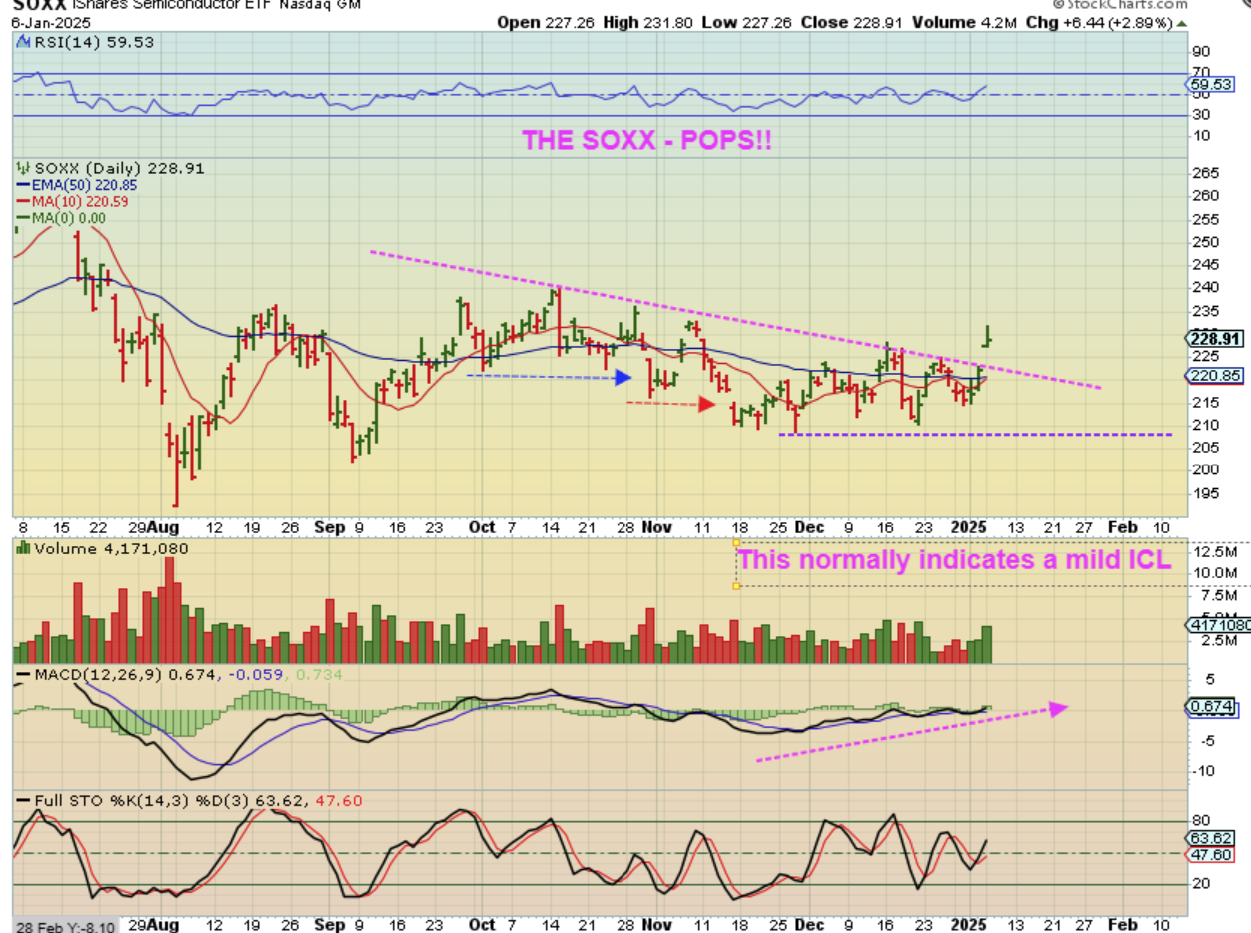
THE SOXX also gapped up over the downtrend and THIS would indicate that those ‘failed daily cycles’ and the series of ‘lower highs and lower lows‘ should be ending. In other words, this is ‘indicating’ that the downtrend for the SOXX has ended with a very Mild ICL. THAT almost seems impossible and was very unexpected, but it may match what we saw in 2020 during that election year.
.
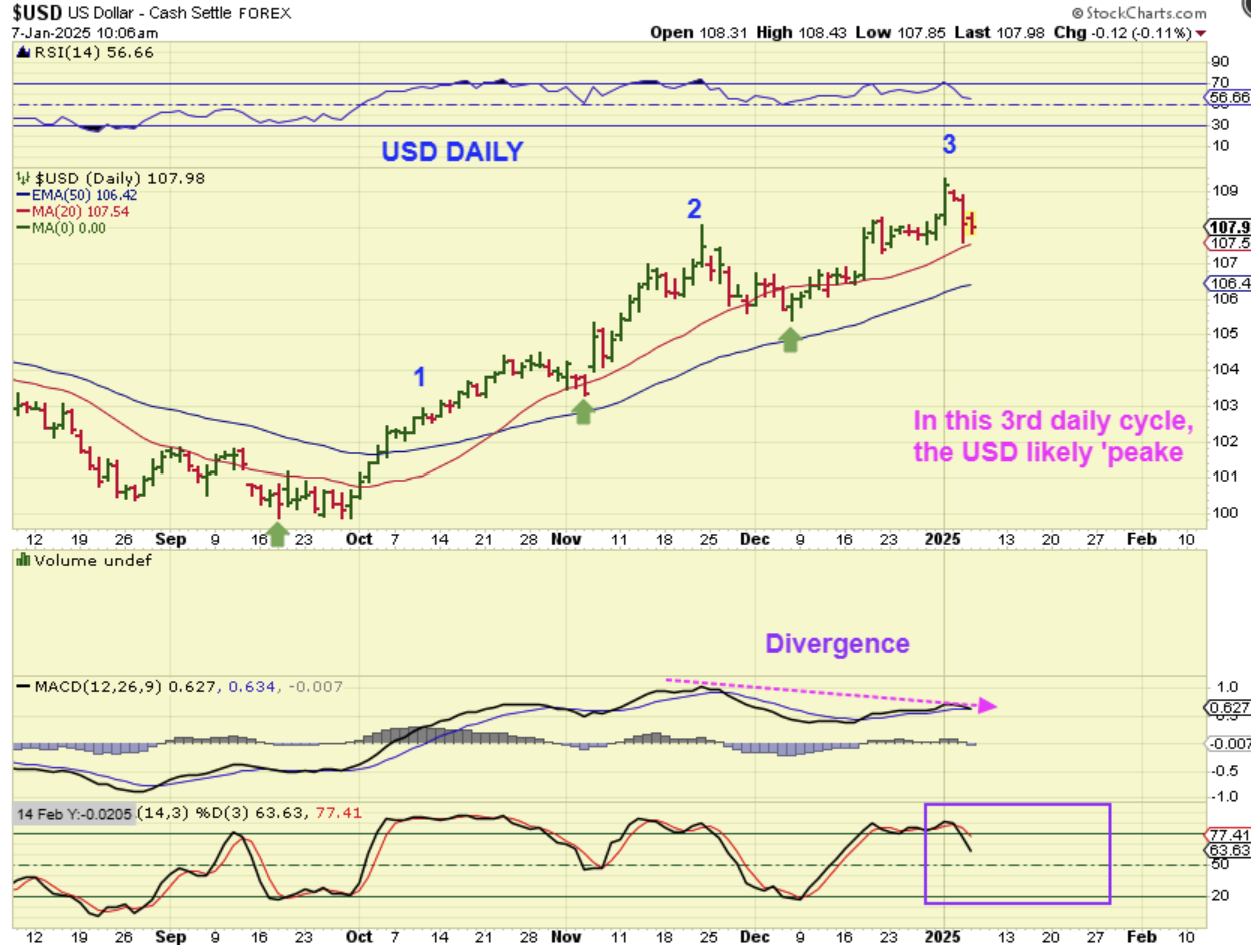
The USD dropped down to the 20ema and seems to have ‘peaked’ last week. The MACD was flashing divergence at the recent new highs.
.
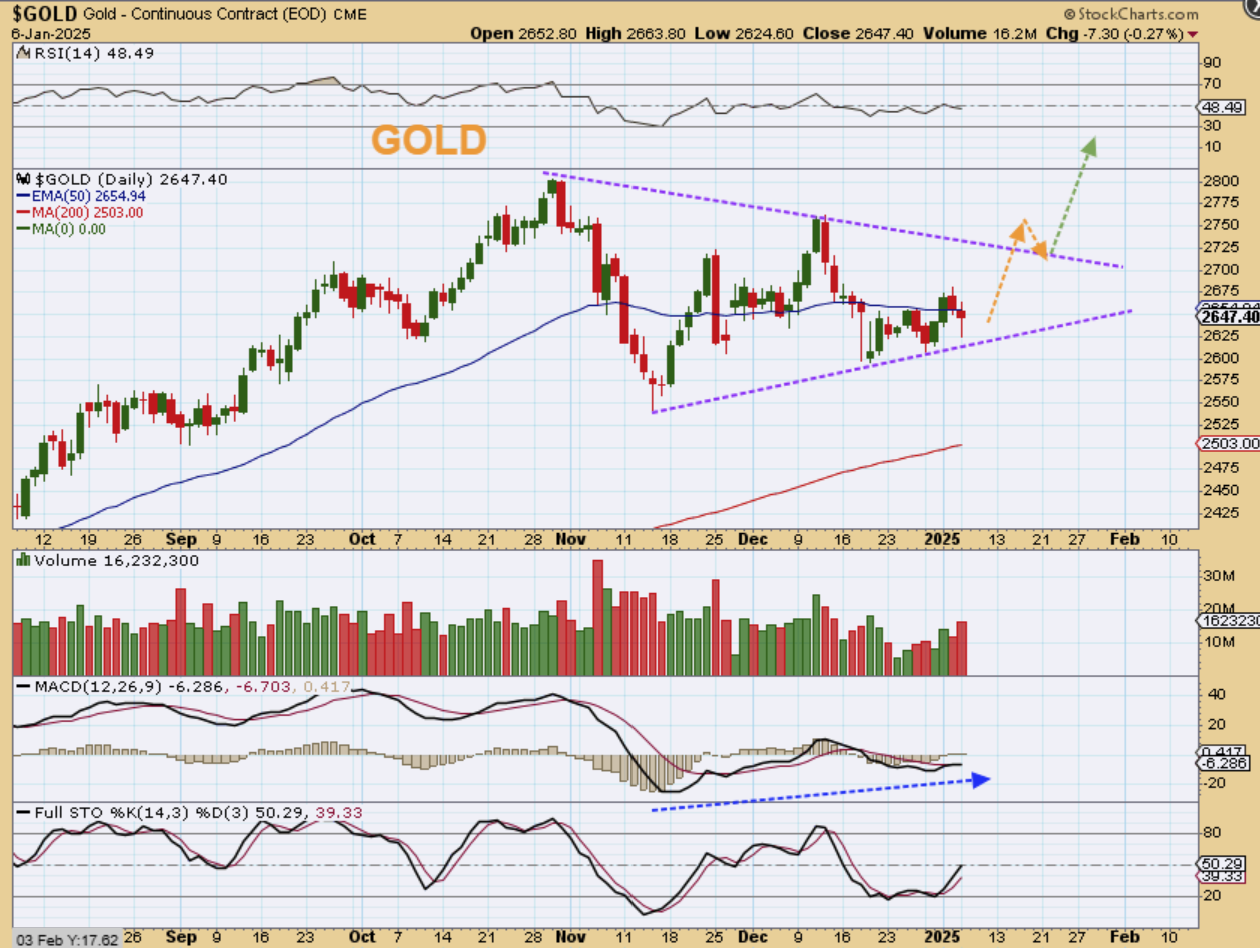
GOLD continues to trade inside of a large triangle. These often form after a long run as a consolidation and triangles often lead to a continuation of that rally.
.
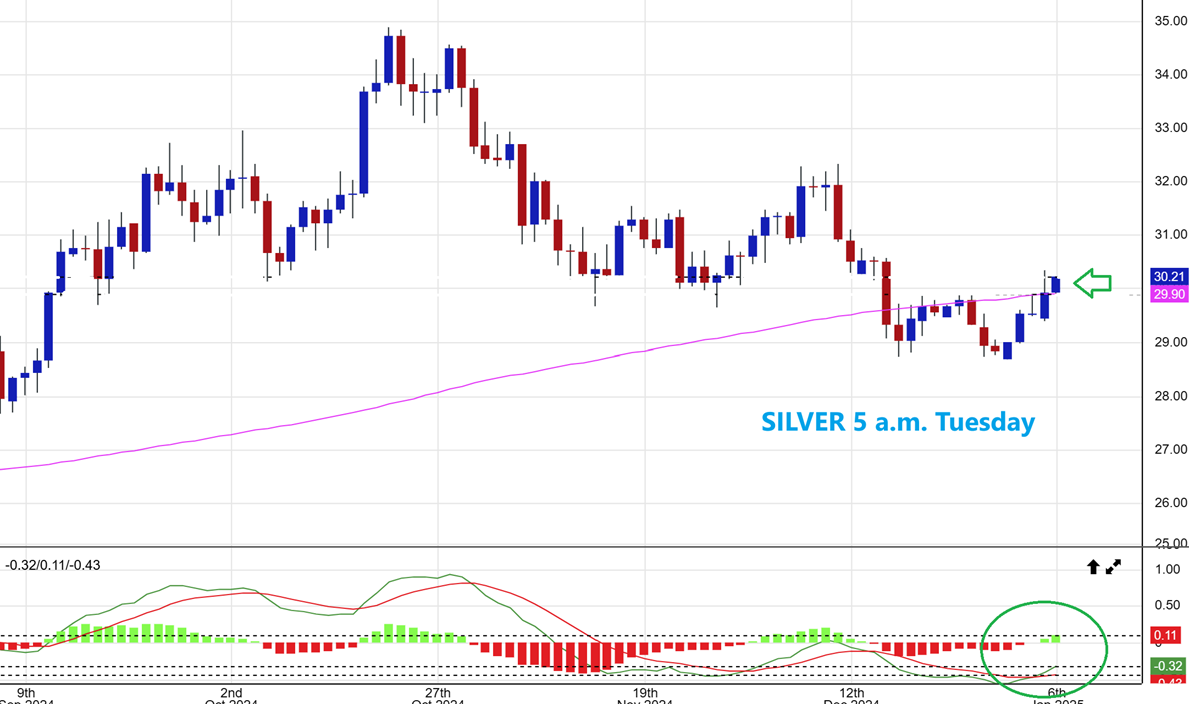
SILVER 5 a.m. Tuesday morning: Silver moved above the 200sma and the 20 ema yesterday, but then gave up the gains by the close. It is moving up over that area again today and we do have a MACD cross upward, so it is a bullish set up. As I write this morning, Gold and Silver are up a little.
.
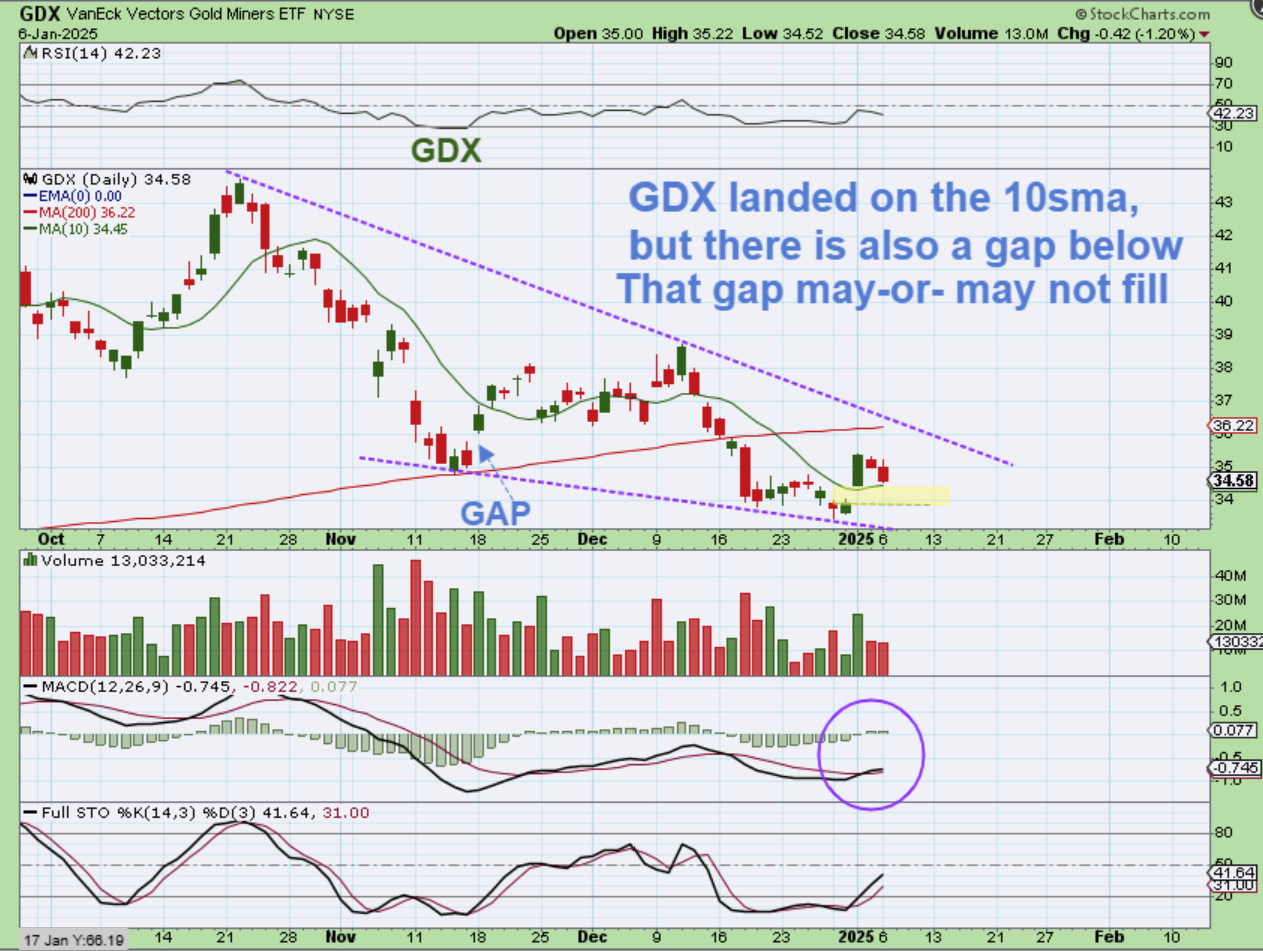
GDX sold down to the 10sma on Monday. We’ll see if that holds and avoid the gap fill. I am also pointing out a gap in November that didn’t fill, so it does happen. Currently Gold & Silver are higher this morning too.
Reminder:
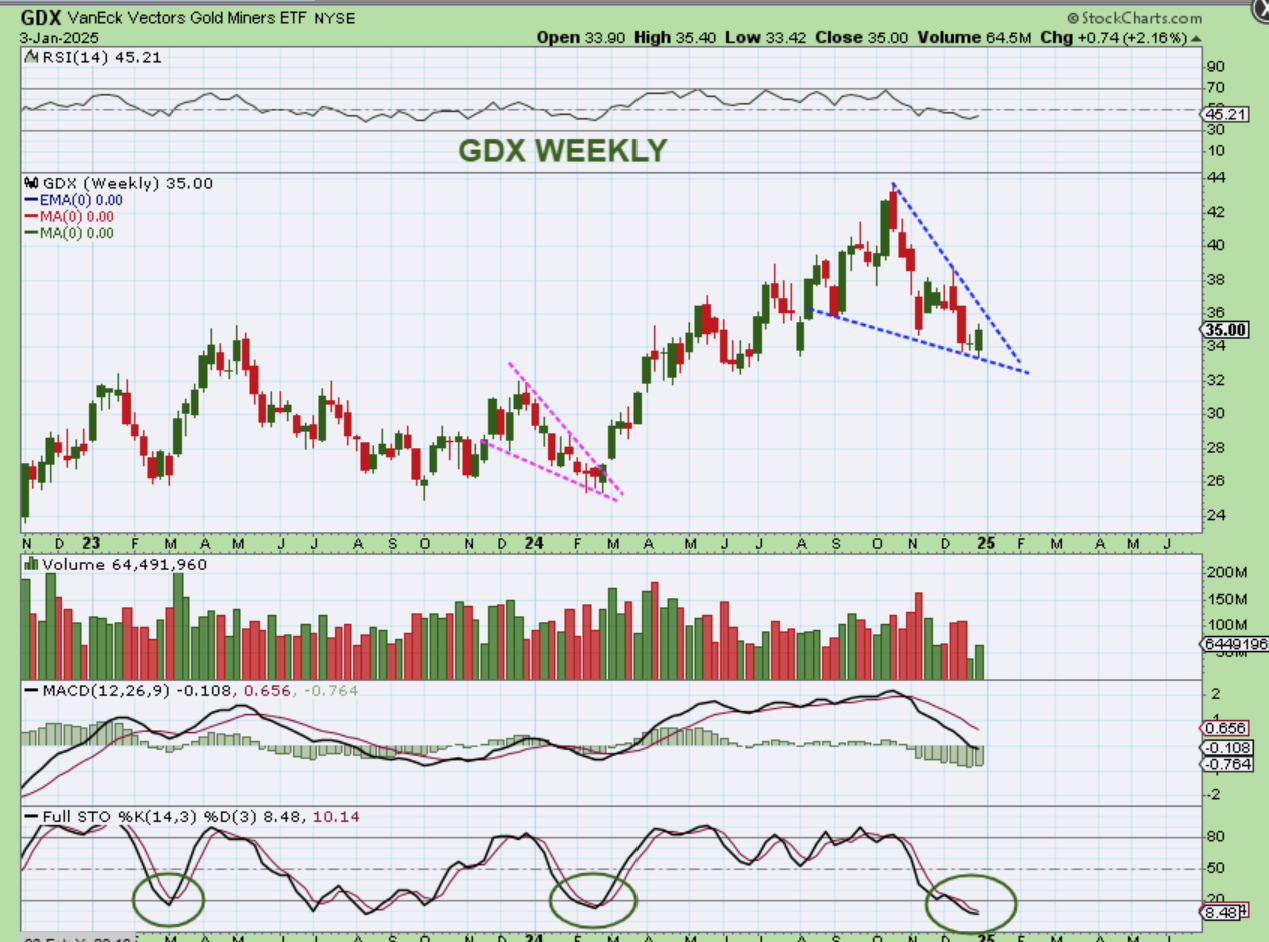
GDX WEEKLY- The Miners may be ready to push higher too. This bullish descending wedge is running out of room in the Apex and if Gold has an ICL and a move higher in the 2nd daily cycle is taking place, I see Miners reacting positively. They did look good last week and since they are at the lows, you can buy with a stop.
.
.
We have seen some choppiness in recent weeks, but those consolidations can lead to a breakout higher. Right now, the bullish sectors remain bullish, and many areas look set to continue higher over time, as seen in the above report. Enjoy your Tuesday trading and I’ll discuss the bullish Bitcoin set up below too.
.
~ALEX
.
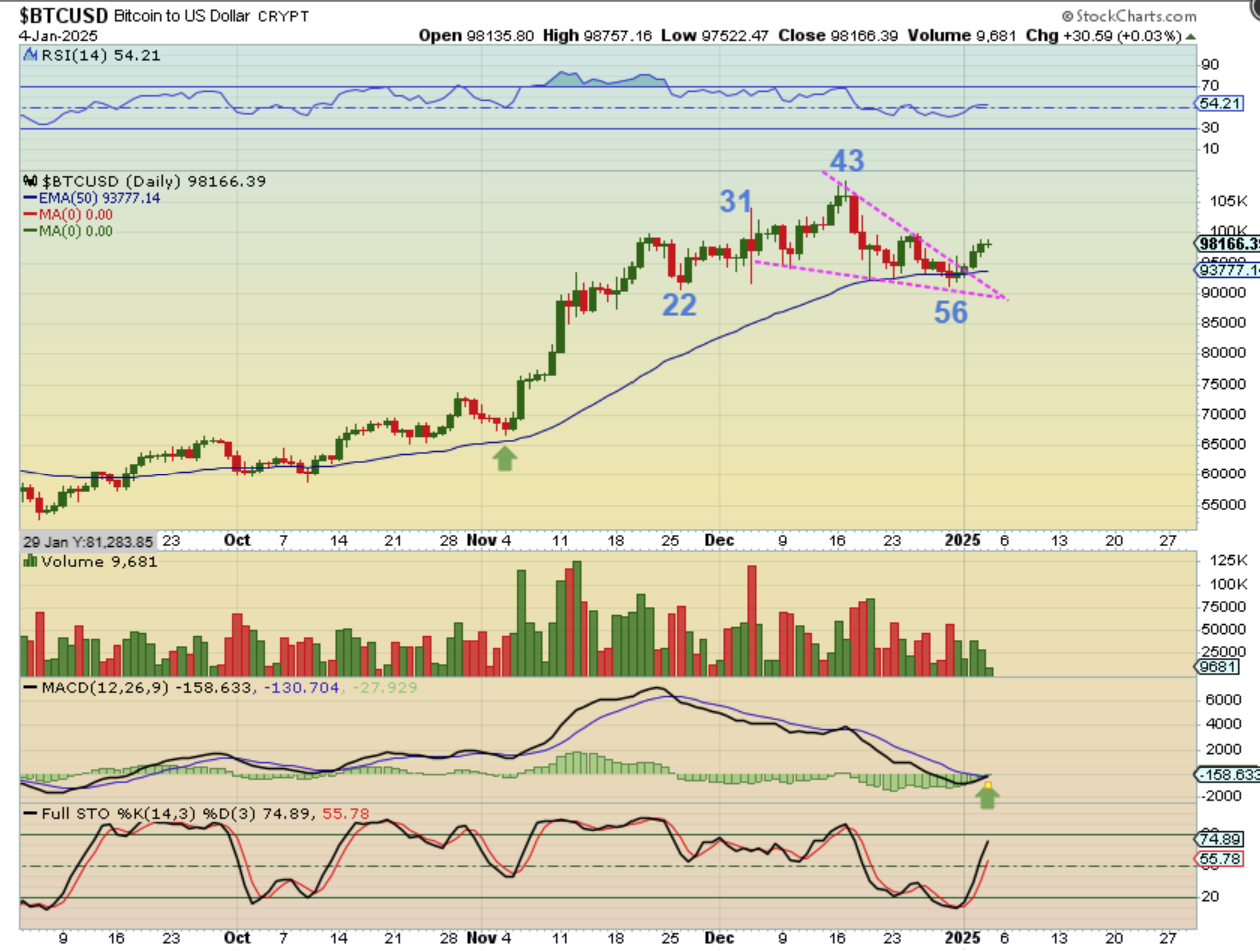
From the weekend report: Cycle counts from Fridays trading saw us at day 4-5.
Bitcoin put in a low at day 56 and broke out from a bullish descending wedge. With that downtrend break and reversal at the 50 ema, the crypto stocks seemed to finally respond bullishly on Friday. Let’s hope for follow through and a continuation on the run.
.
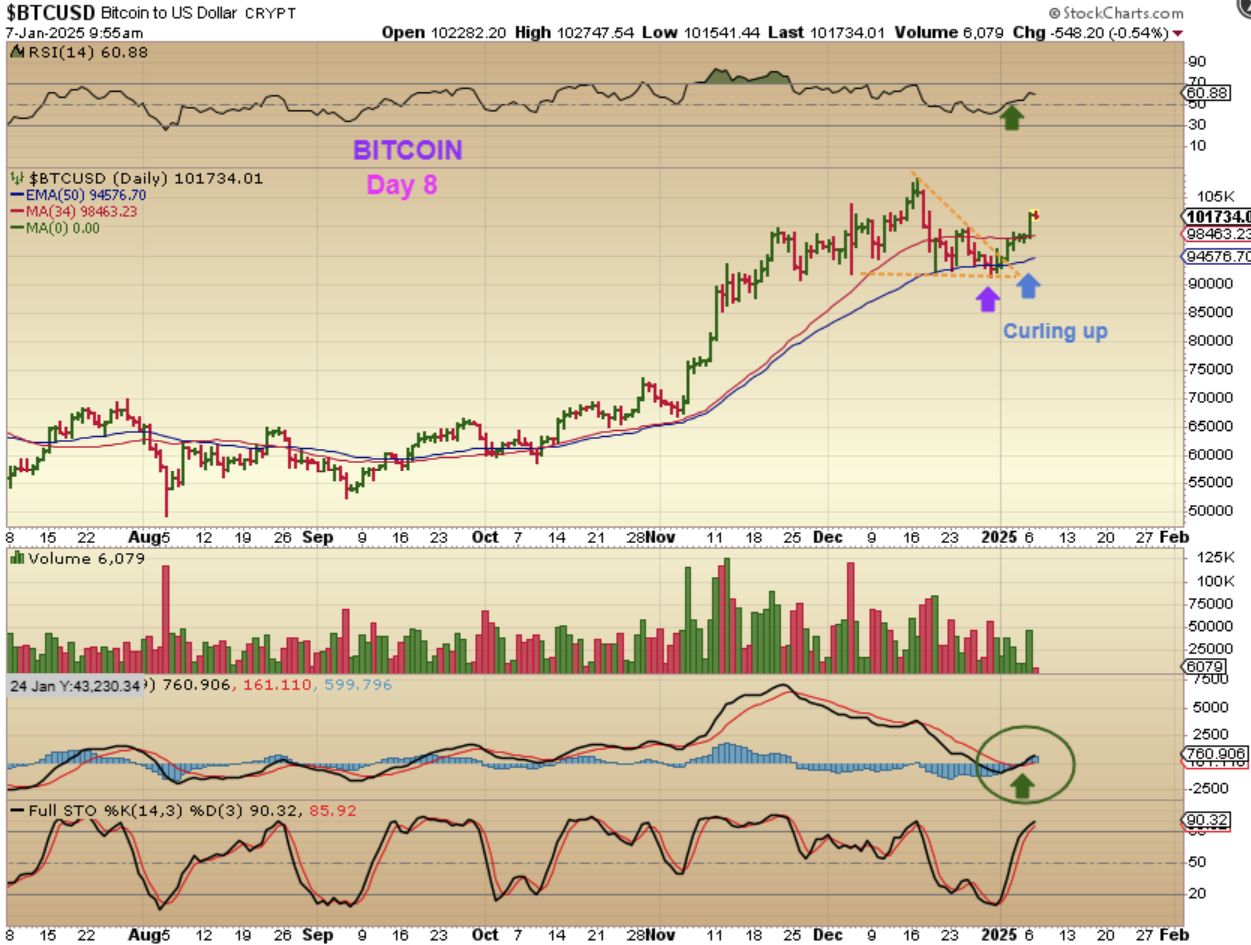
BITCOIN popped on Monday day 7. Crypto stocks do seem to be following the move higher this time.
.
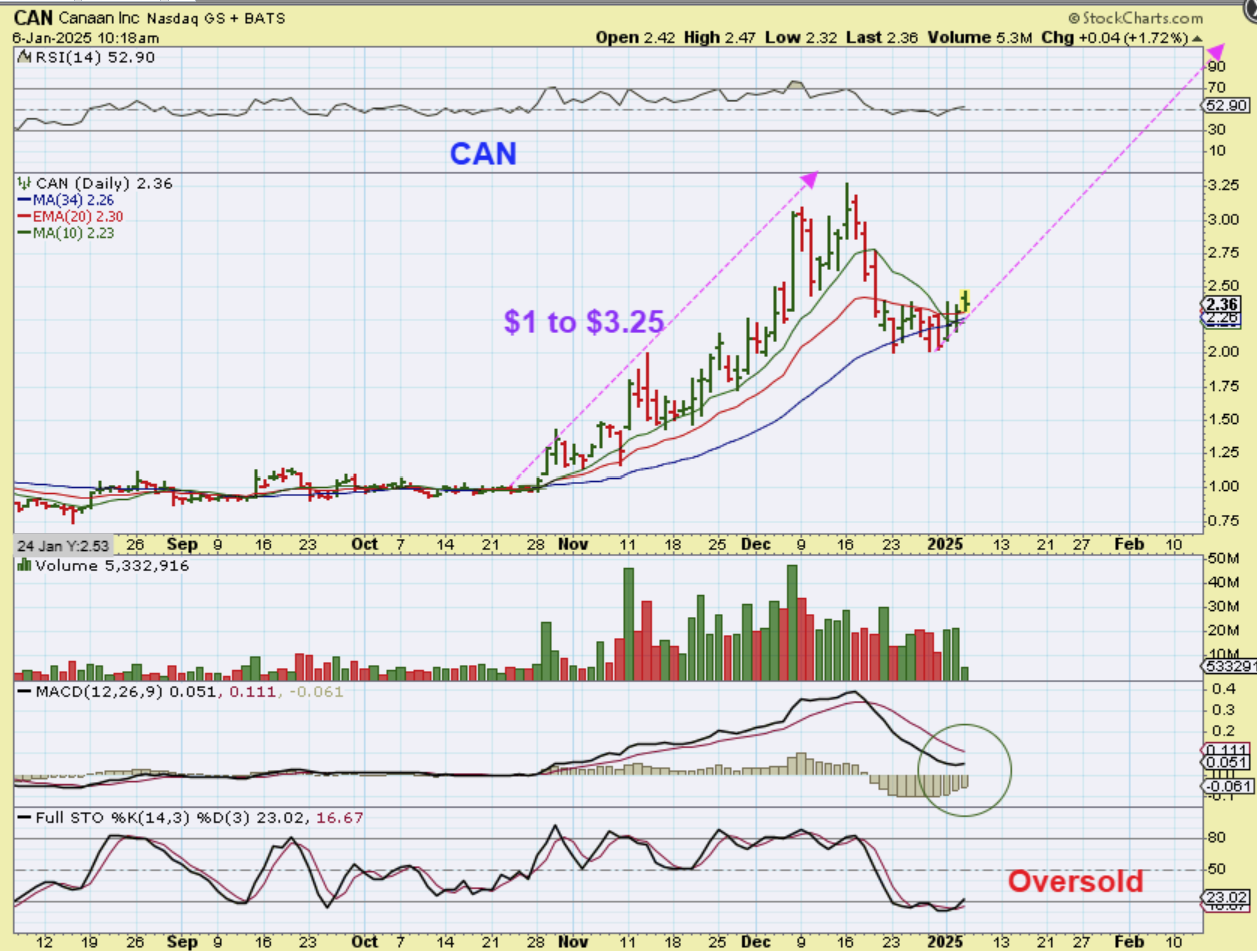
CAN had a solid run from October to December and then pulled back with Bitcoin. It isn’t quite running strong here, but it could put in another leg higher, so I was pointing this set up out as low risk with a stop at $2.
.
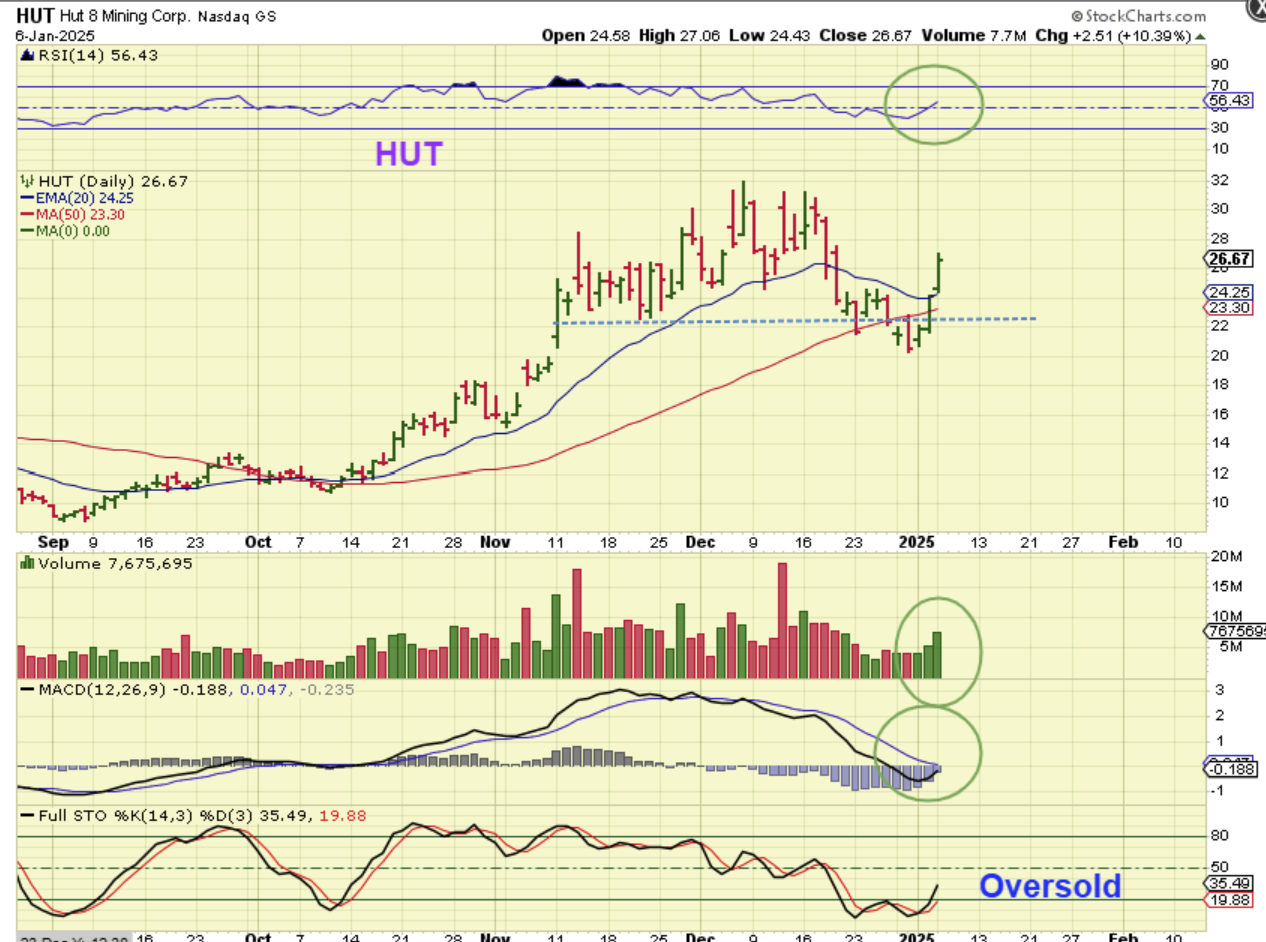
HUT has actually rallied with Bitcoin, gaining 10% Friday and 10% Monday. Bitcoin may pullback today, so HUT may pull back today.
.
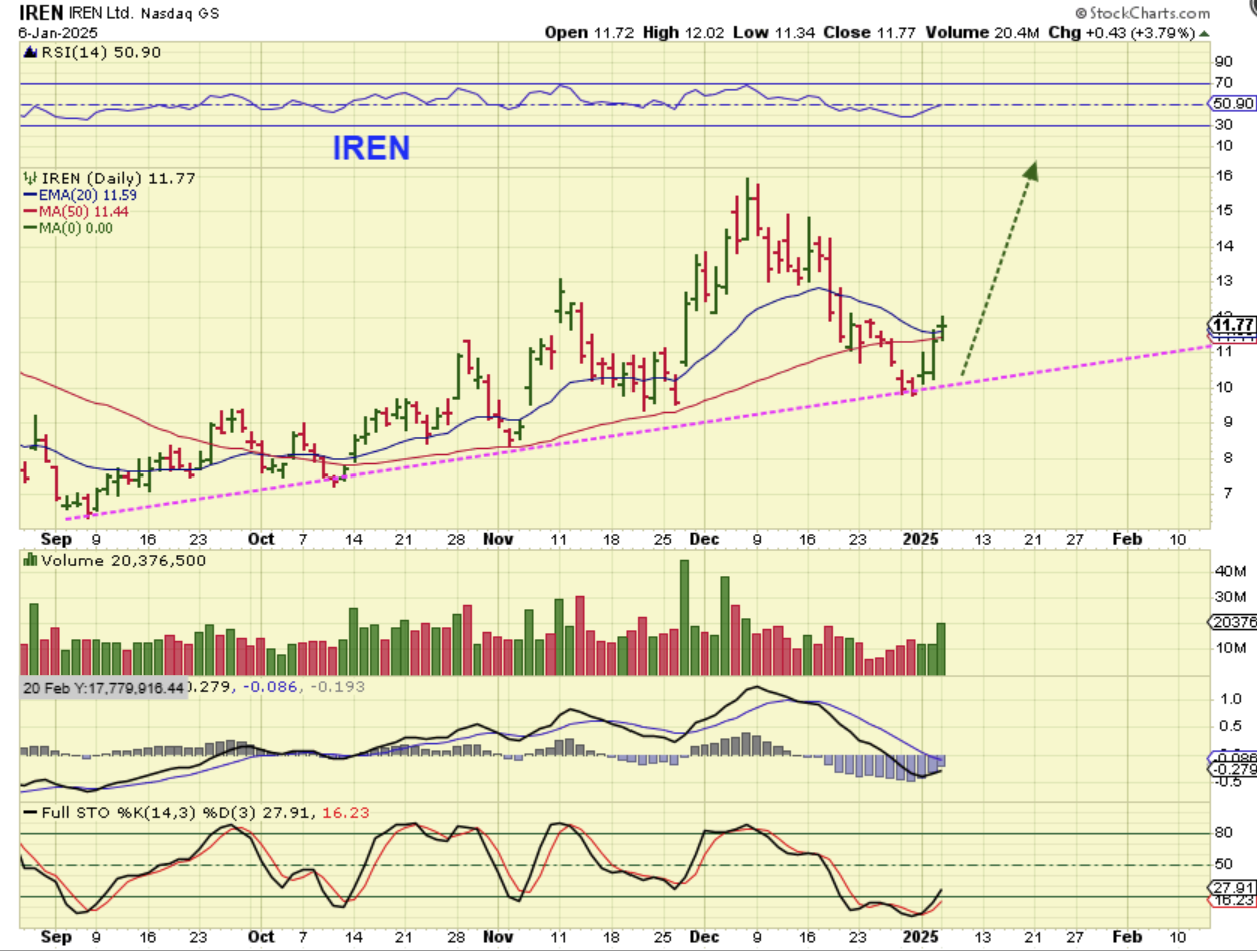
IREN, CIFR, CLSK, RIOT, MARA, BTBT, etc also look to have put in a reversal after a rather sharp drop in December. They can be choppy, but you can see from past runs that they do tack on the gains over time. It is a very tough ride at times though.