November 24th Weekend Report
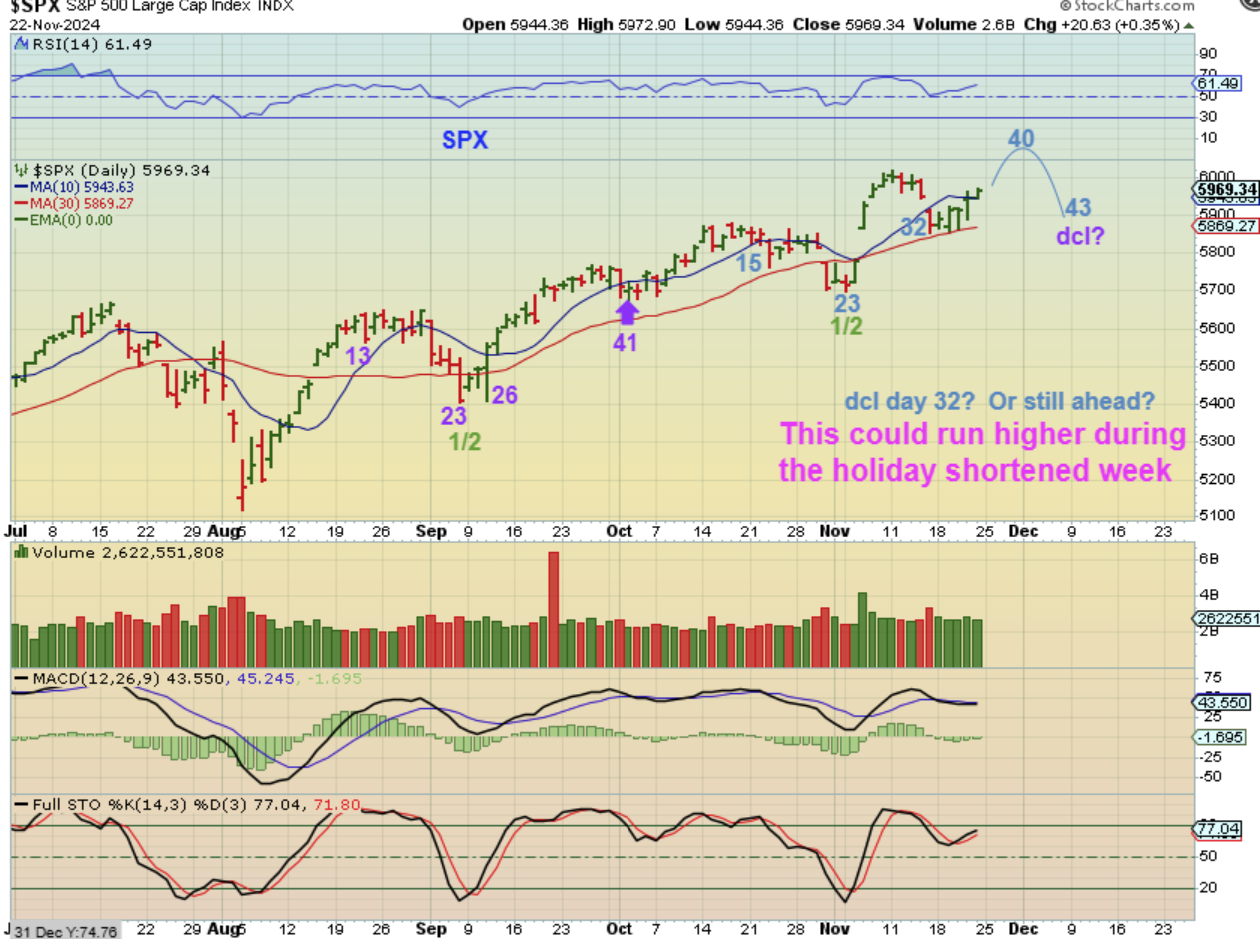
Note: The upcoming week is a holiday shortened week of trading with the markets closed all day Thursday and only being open until 1 p.m. ET on Friday. Let’s take a look at the current market setups…
.
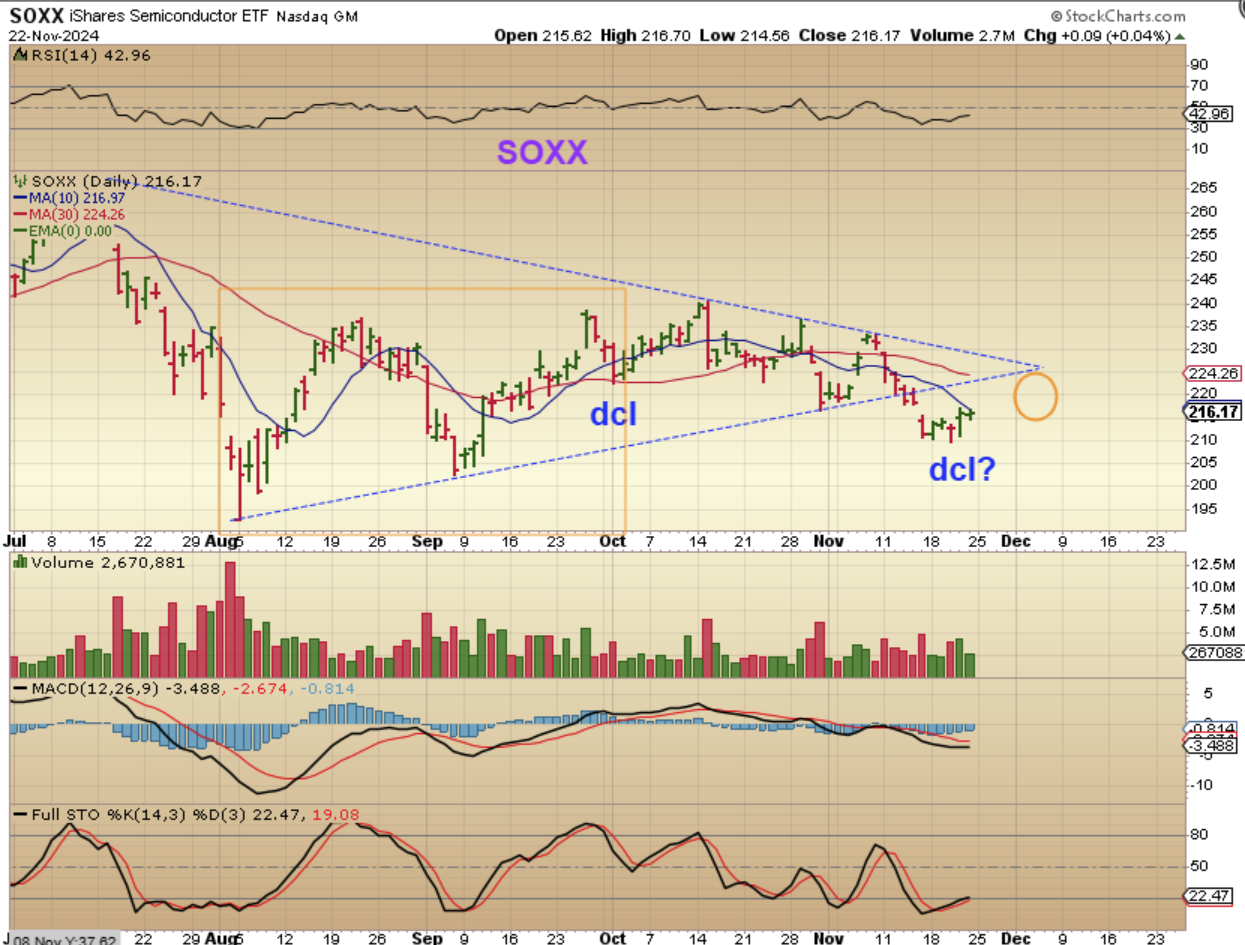
SPX DAILY – It is not clear if we have a day 32 dcl or if it still lies ahead, since the last daily cycle was 42 days long. So far the price action remains healthy and bullish, and it closed above the 10sma, so we may have a dcl in place. The SOXX is still concerning however.
.
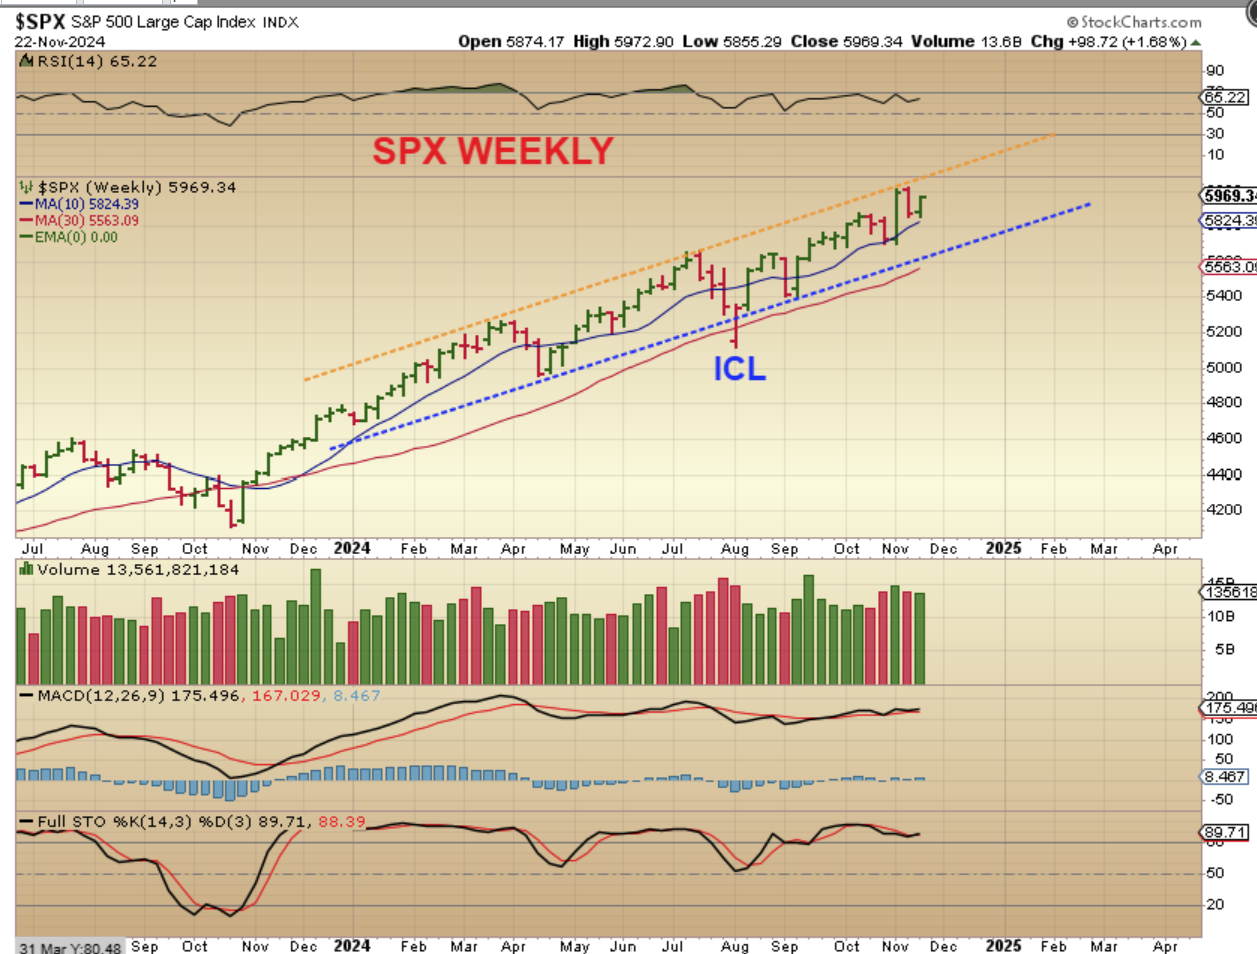
SPX WEEKLY – Holding above the 10 week ma is a bullish run.
.
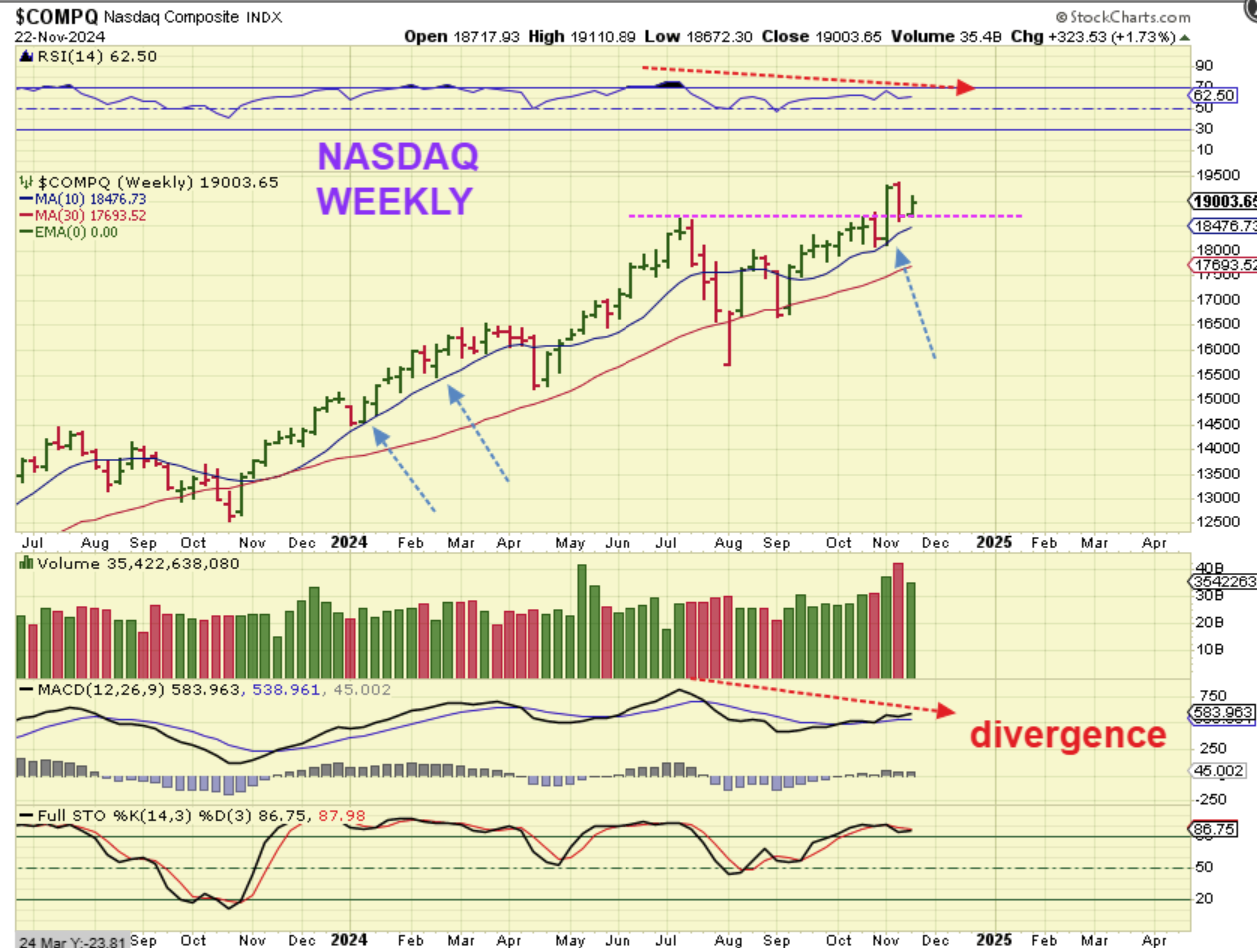
NASDAQ WEEKLY – The Nasdaq back tested the breakout and is at higher highs than it was during the July peak, but we do have some divergence. That can be cured by a push higher and more chop, or it could mean that the run is weakening.
..
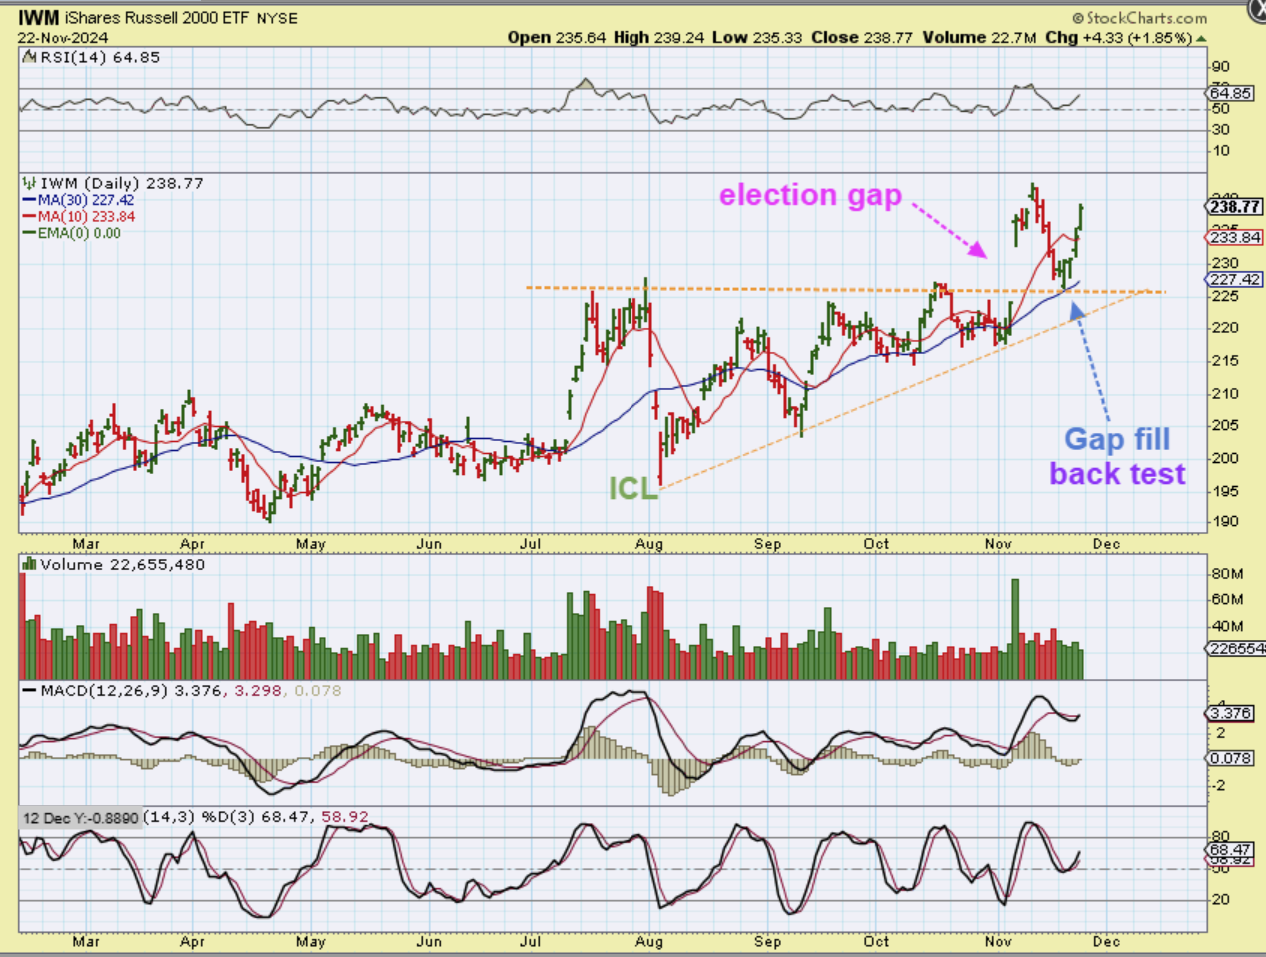
IWM DAILY – Here we see a very choppy move higher out of the August crash ICL.
1. As the IWM approached the highs it became very choppy and then it Gapped open in a big way after the election results were announced.
2. After gapping higher and trading for a couple of days, it sold off quickly and filled that gap, back tested that breakout, and then reversed higher again this week. Thursday and Friday were good for the IWM.
.
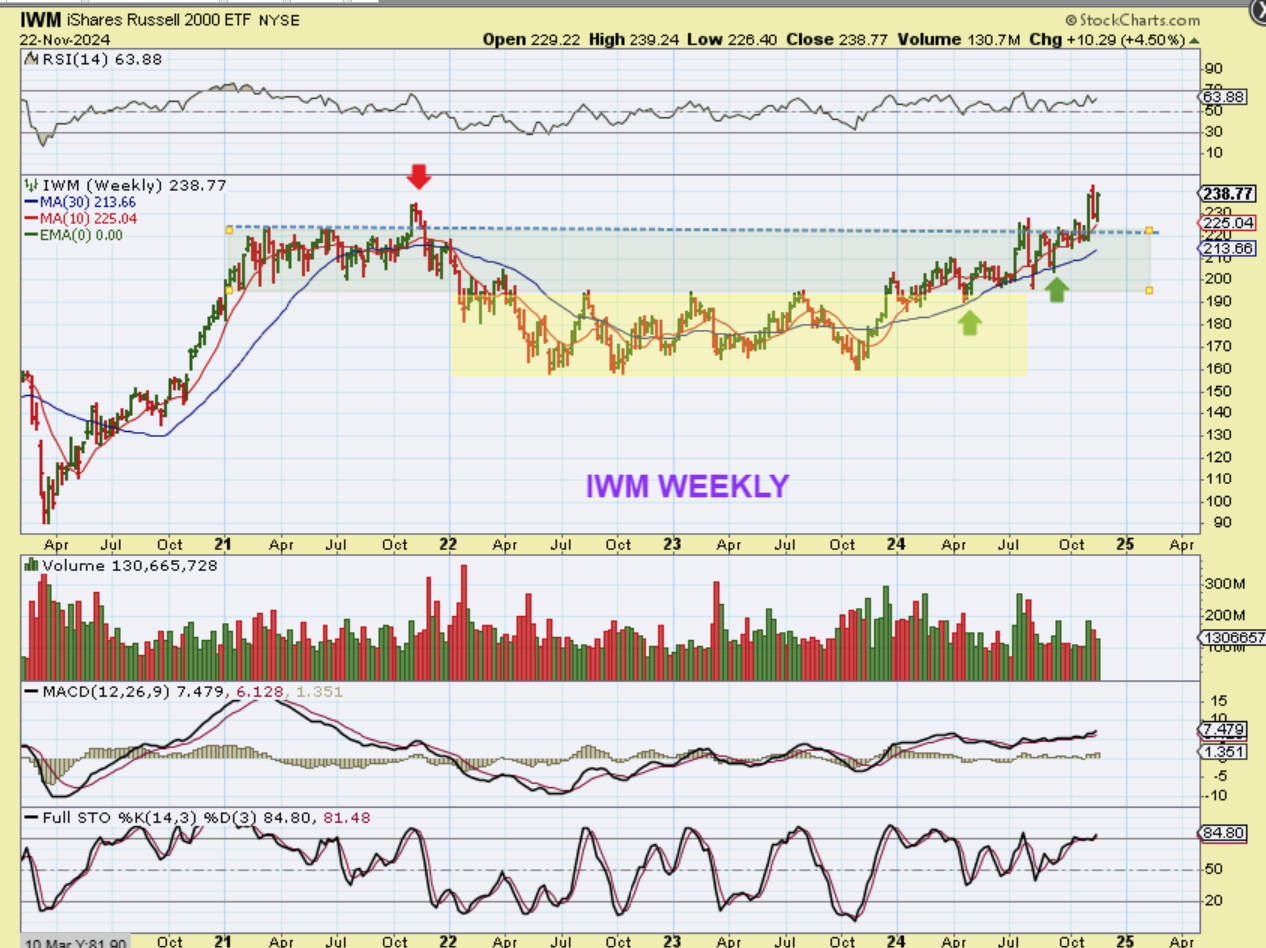
IWM WEEKLY – In 2021 the IWM gave us a false break out and sold off for over 6 months (Red arrow). It based out for years and started to rise up from last Oct to now. This push higher gave the IWM a 4% gain this week, and it does look like a real breakout this time, so we’ll see how this plays out. Again, my real problem is with the SOXX and the idea that it could become contagious, but for now the IWM looks like a breakout and a stop would be at the 10 week ma.
.
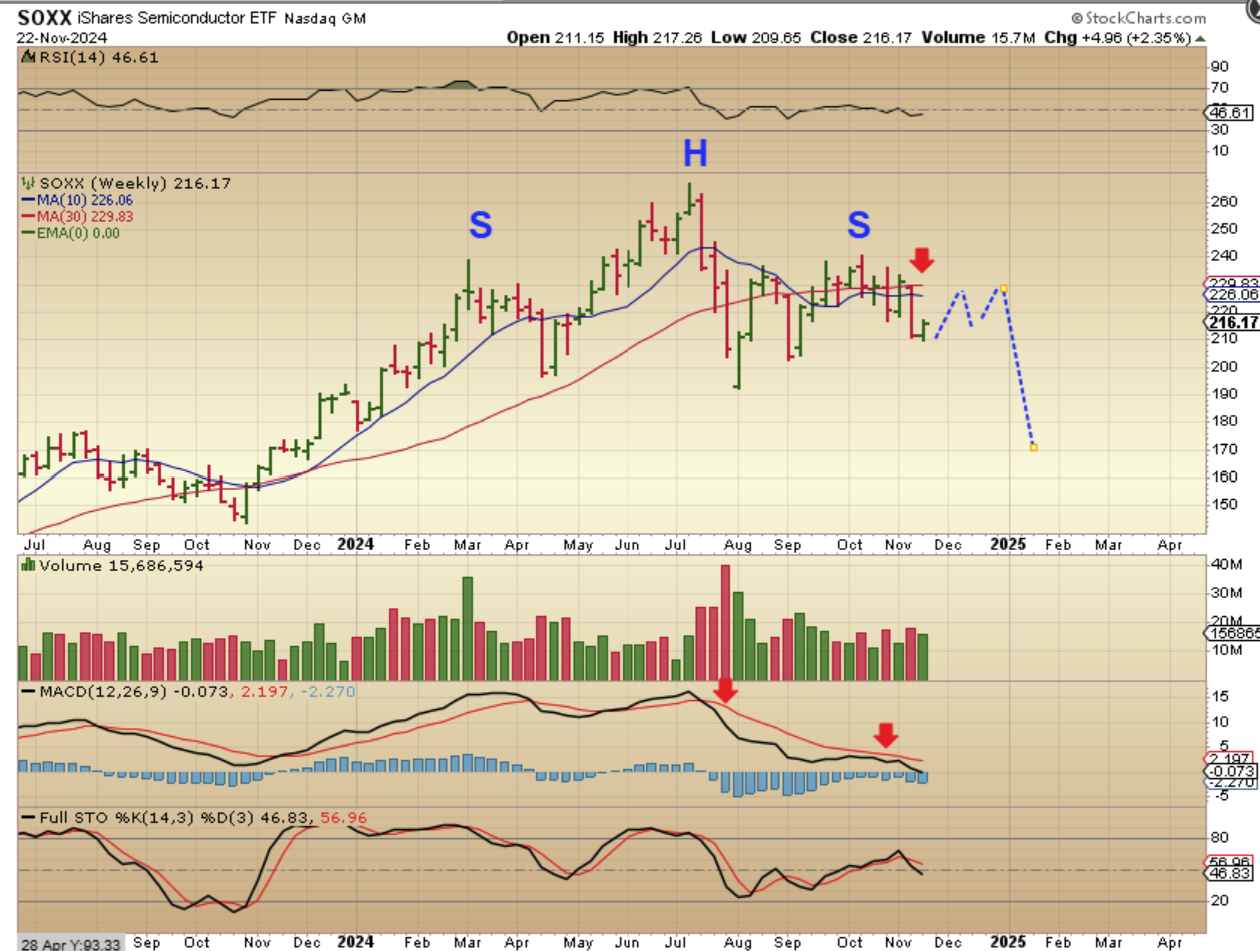
As you all know, The SOXX is a failure and it started to make lower highs and lower lows from October to now. The lowest low of that drop happened this week, while the SPX, QQQ, IWM are at recent highs.
.
So with the SOXX WEEKLY, I have been pointing out the H&S that seems to be forming. We should bounce out of a dcl and then we’ll see what happens, but resistance for the SOXX is in the 226 – 229 area.
.
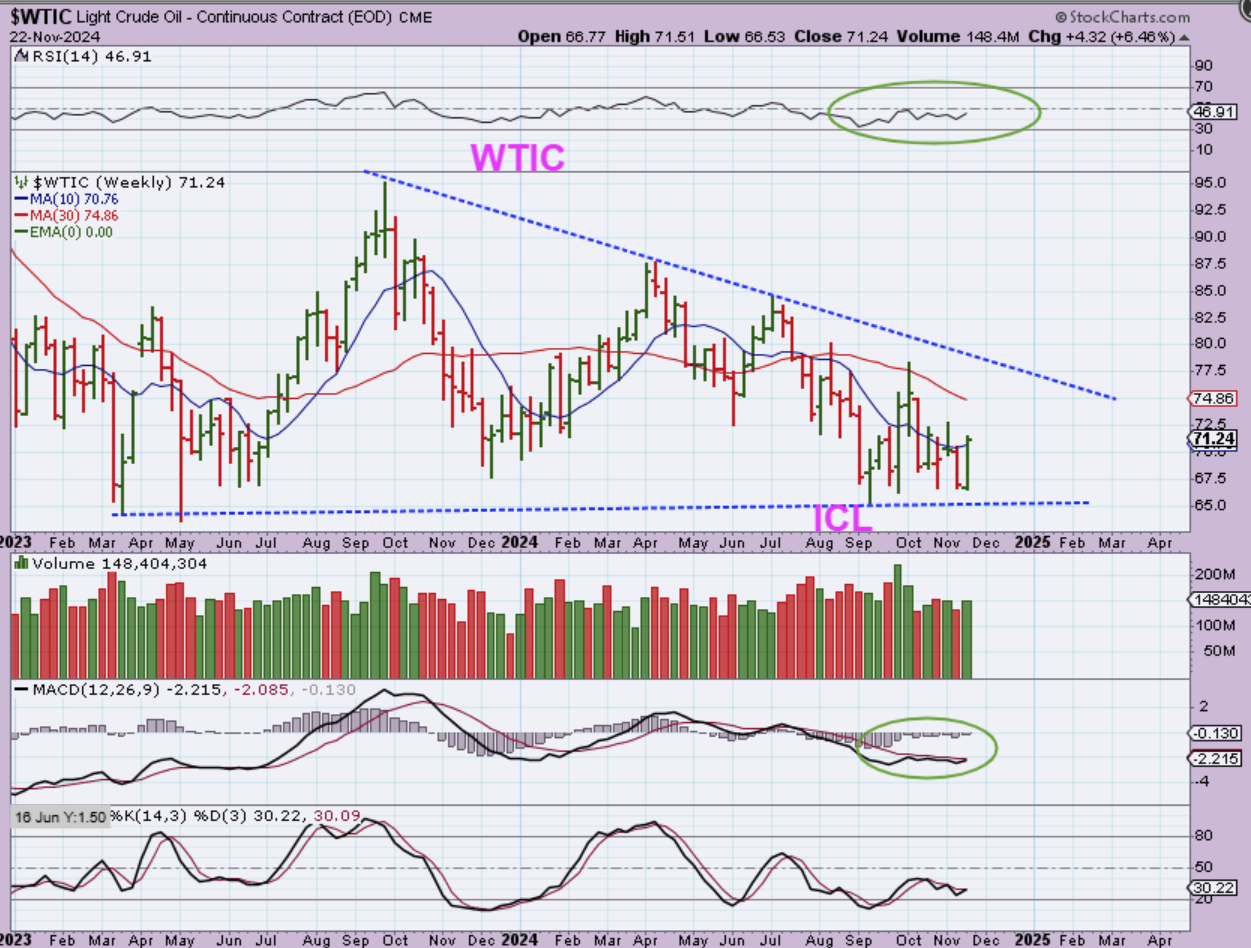
WTIC WEEKLY – Oil reversed with a higher low and was up 6.46% this week. I have been discussing that Oil looks to have bottomed because the Oil stocks definitely bottomed back at Oils September lows. Oil has been choppy and weak, but it is considered a buy now. Oil stocks may be the better buy though.
.
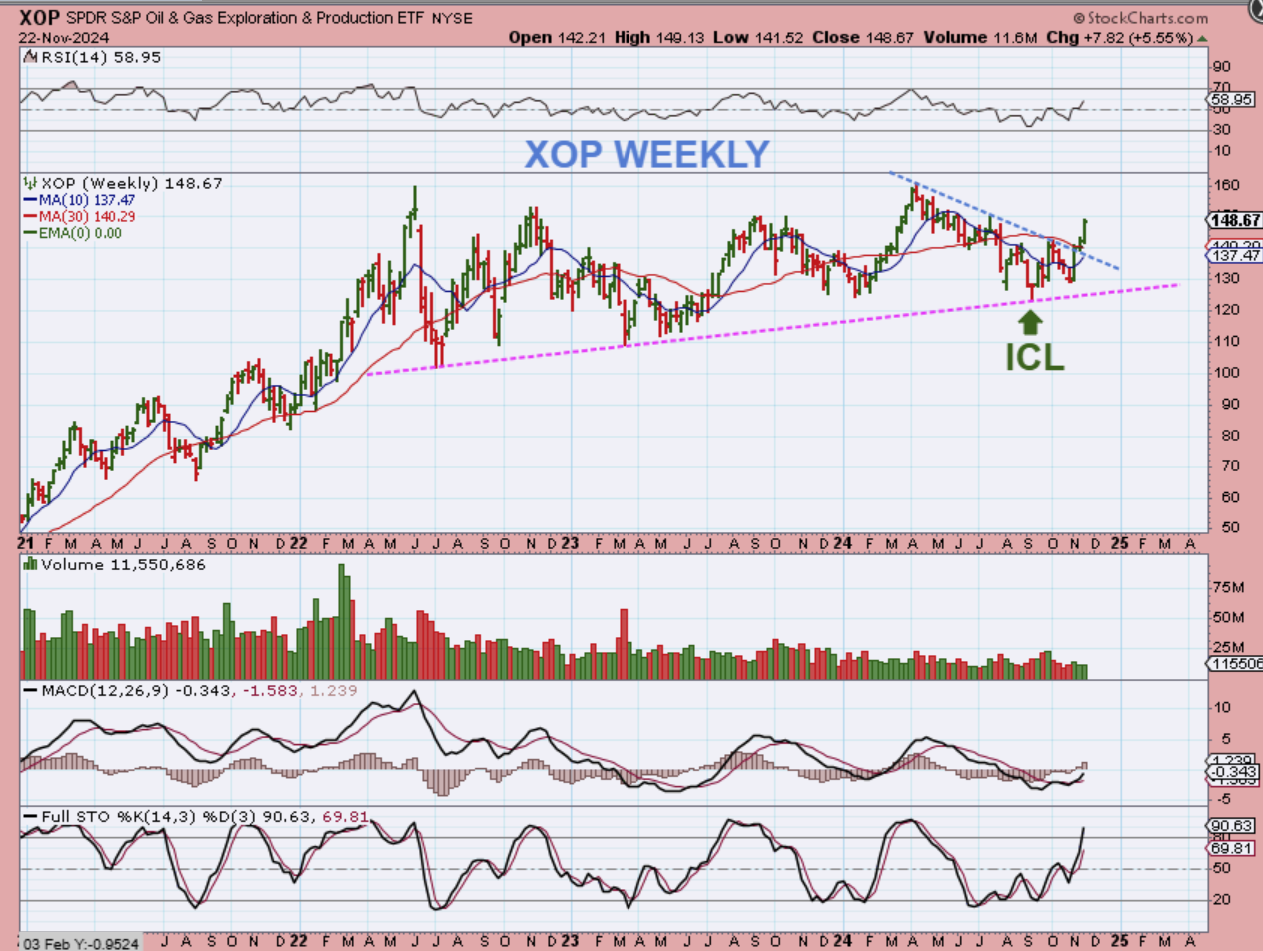
XOP WEEKLY – So with Oil bottoming in September and then dropping back to test that low, Oil stocks pulled back in October but then quickly reversed higher. Last week the XOP broke out from a downtrend and Oil stocks look progressive.
.
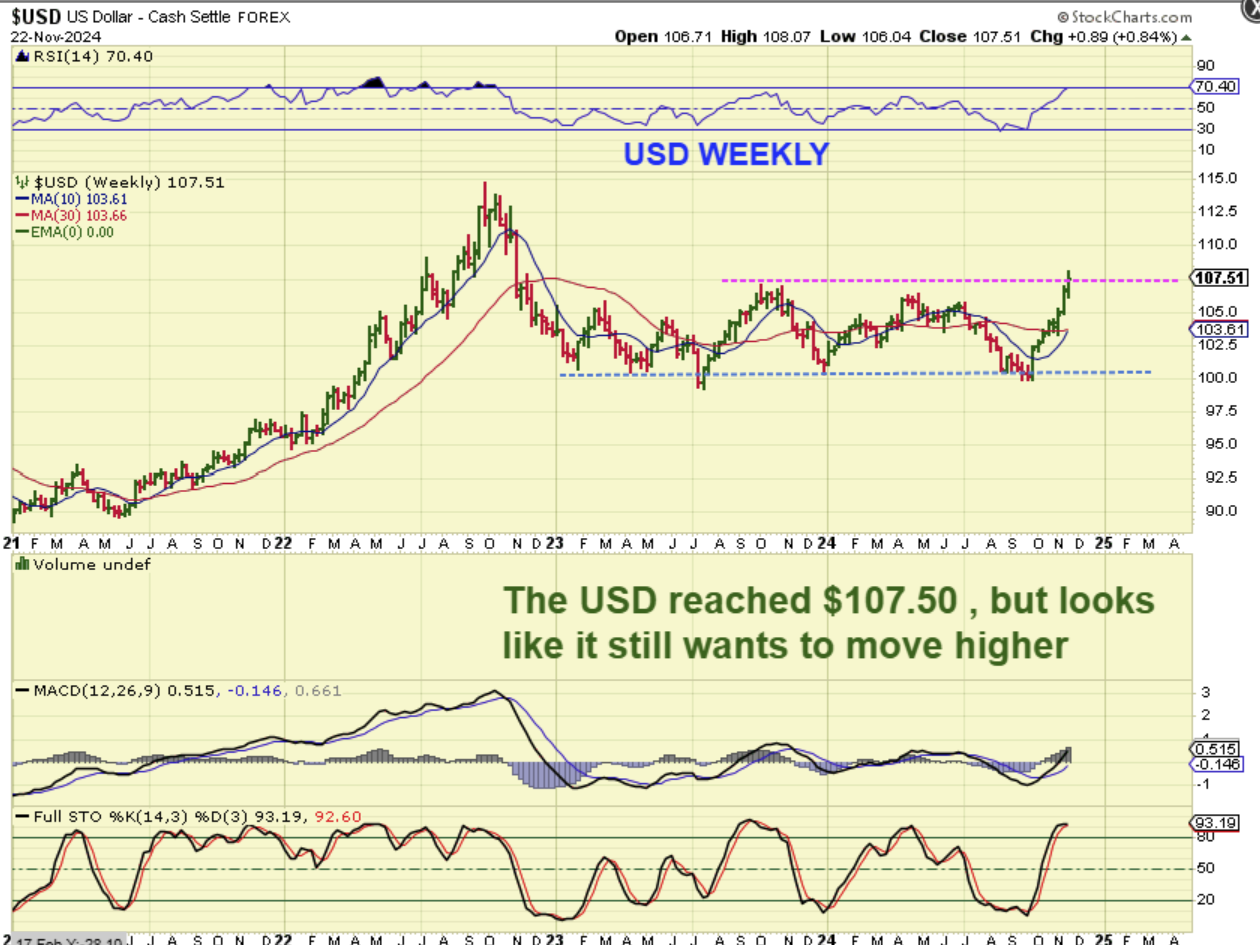
USD WEEKLY – The USD blasted out of the ICL and has been very strong. The good thing is that it is not affecting Golds bullish set up. I had a $107.50 target for it, but it hit $108 last week and closed at $107.50, so it is possible that this is breaking out and can continue higher. Again, this push is NOT weakening Gold.
.
The USD, GOLD, SILVER, and The Miners are not acting normal as of last week, so let’s start by breaking them down one by one.
.
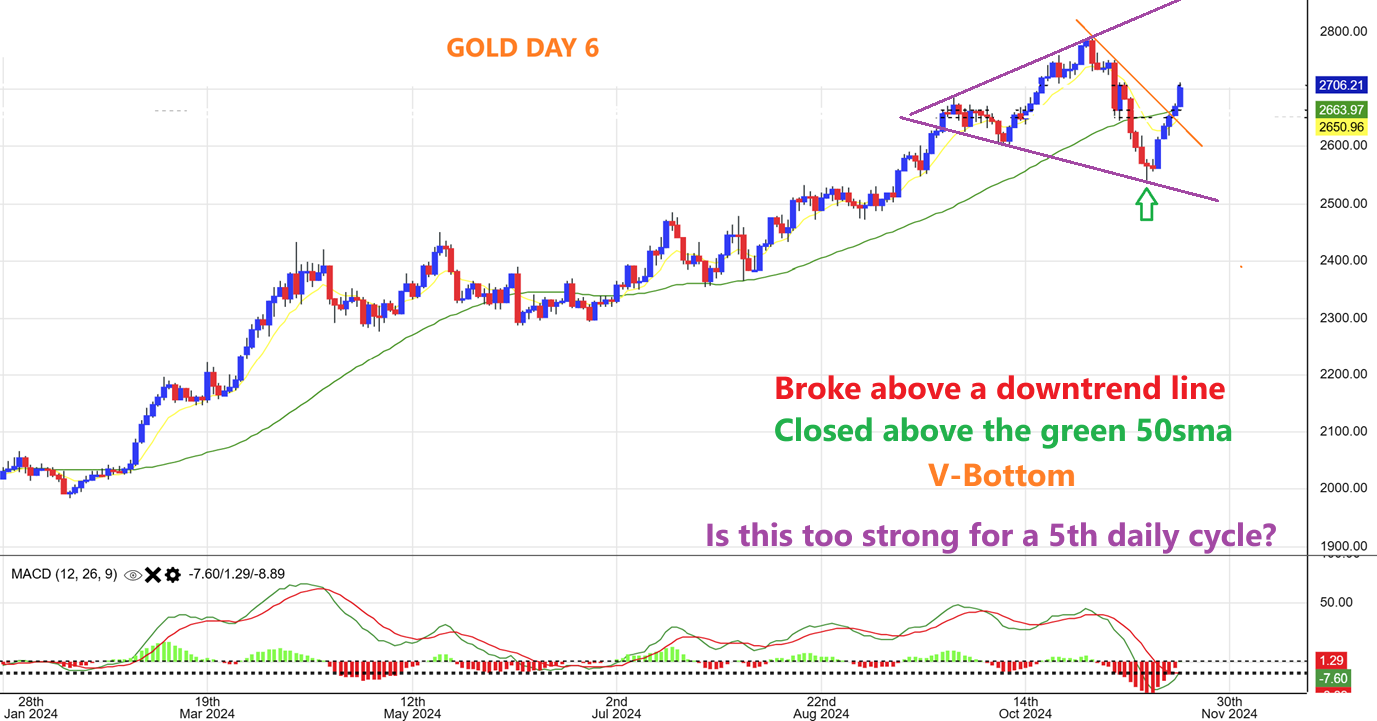
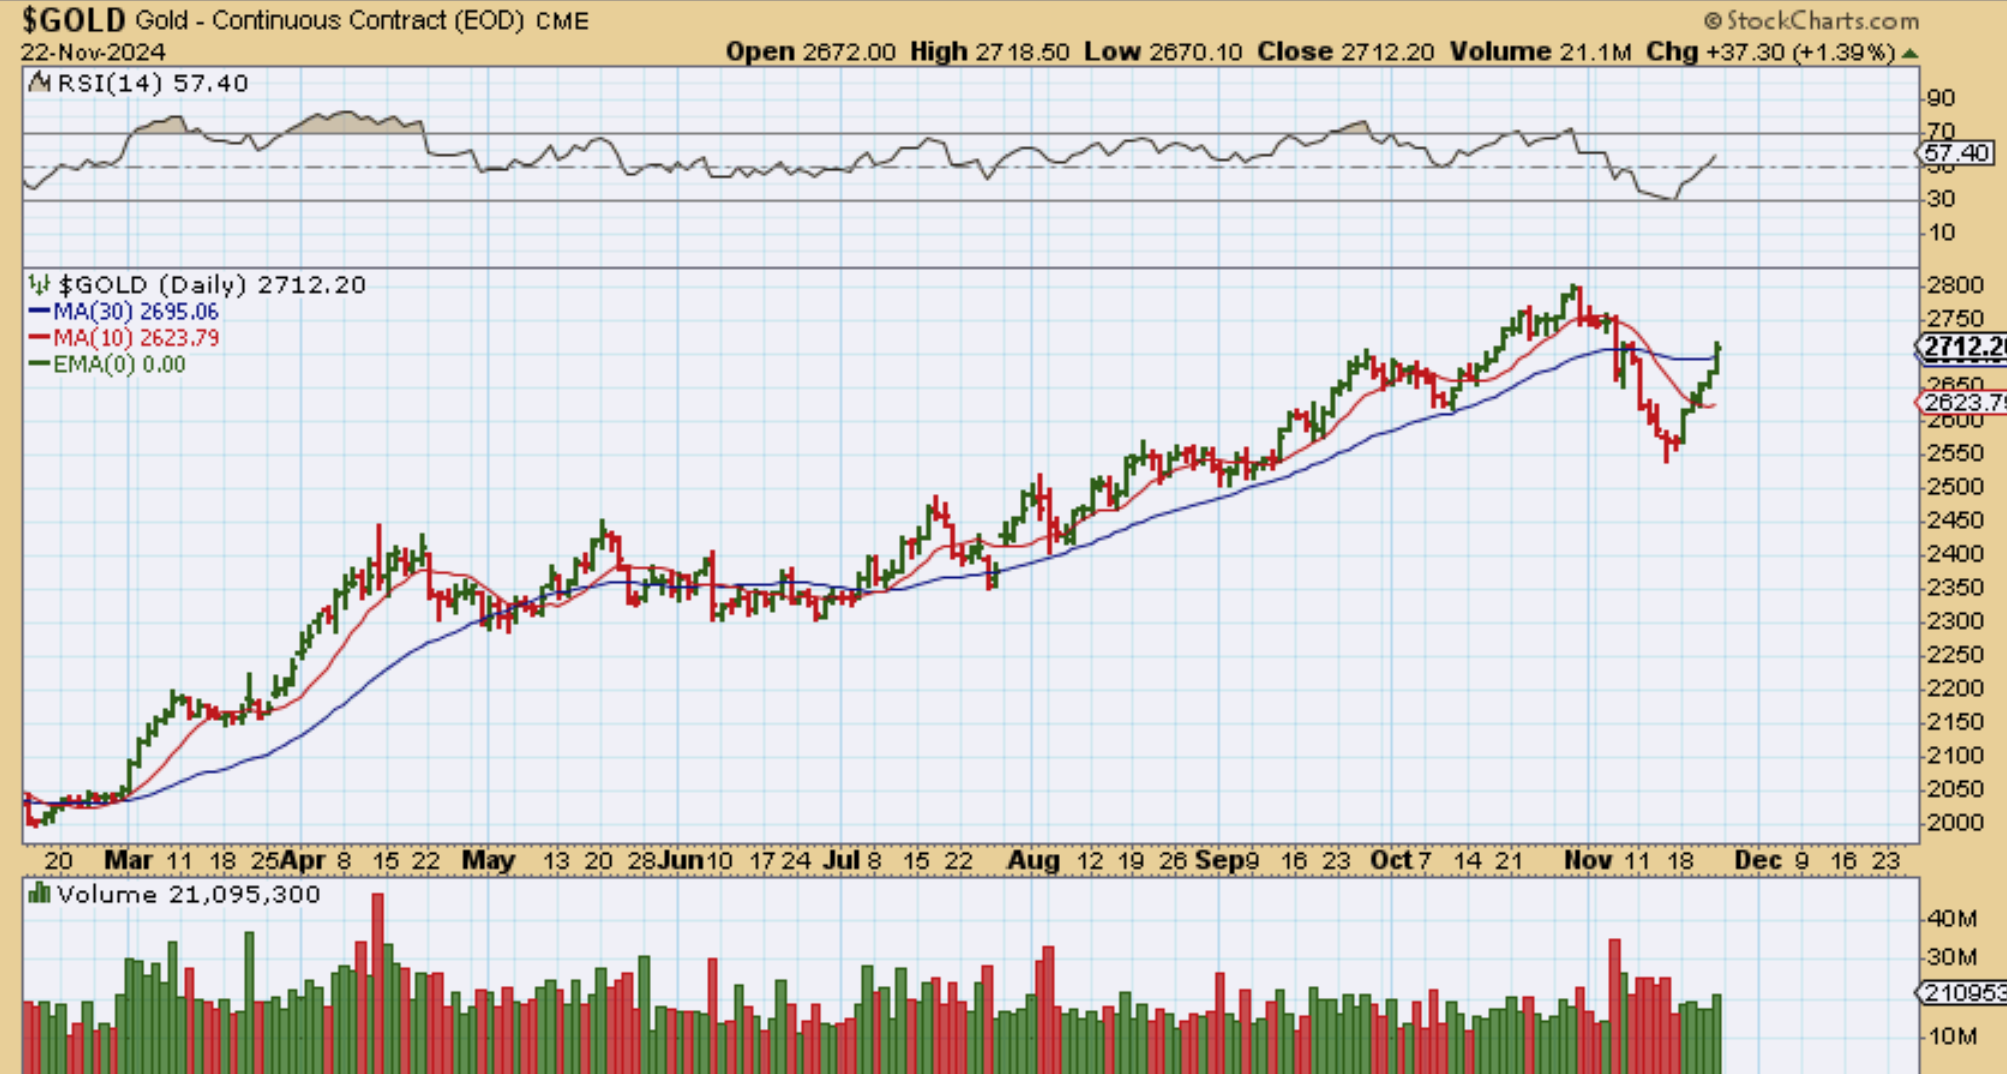
GOLD DAILY – Gold is on day 6, but it is running straight up and that makes me think that we could be seeing an ICL. My problem is that if this is supposed to be a 5th daily cycle, would it be THIS strong in a 5th daily cycle? It doesn’t seem so. So the USD broke out and tagged $108 and Gold rallied too? I am seeing a lot of strange things with this Golden Bull and Gold looks unusually strong right here. Please read the chart.
.
So as stated above, Gold is on day 6 and is taking on the characteristics of a V-bottom ICL, but it shouldn’t be an ICL yet. Also, Silver and the Miners are not quite as strong, so that may indicate that we don’t have an ICL, but what if Gold does? The slow start by Silver means that you still have time to add to a basket of Miners IF YOU FEEL that an ICL formed and the sector will rally again. An ICL for Gold doesn’t make sense for a few reasons, but this bull also put in a strong weekly reversal. Let’s take a look…
.
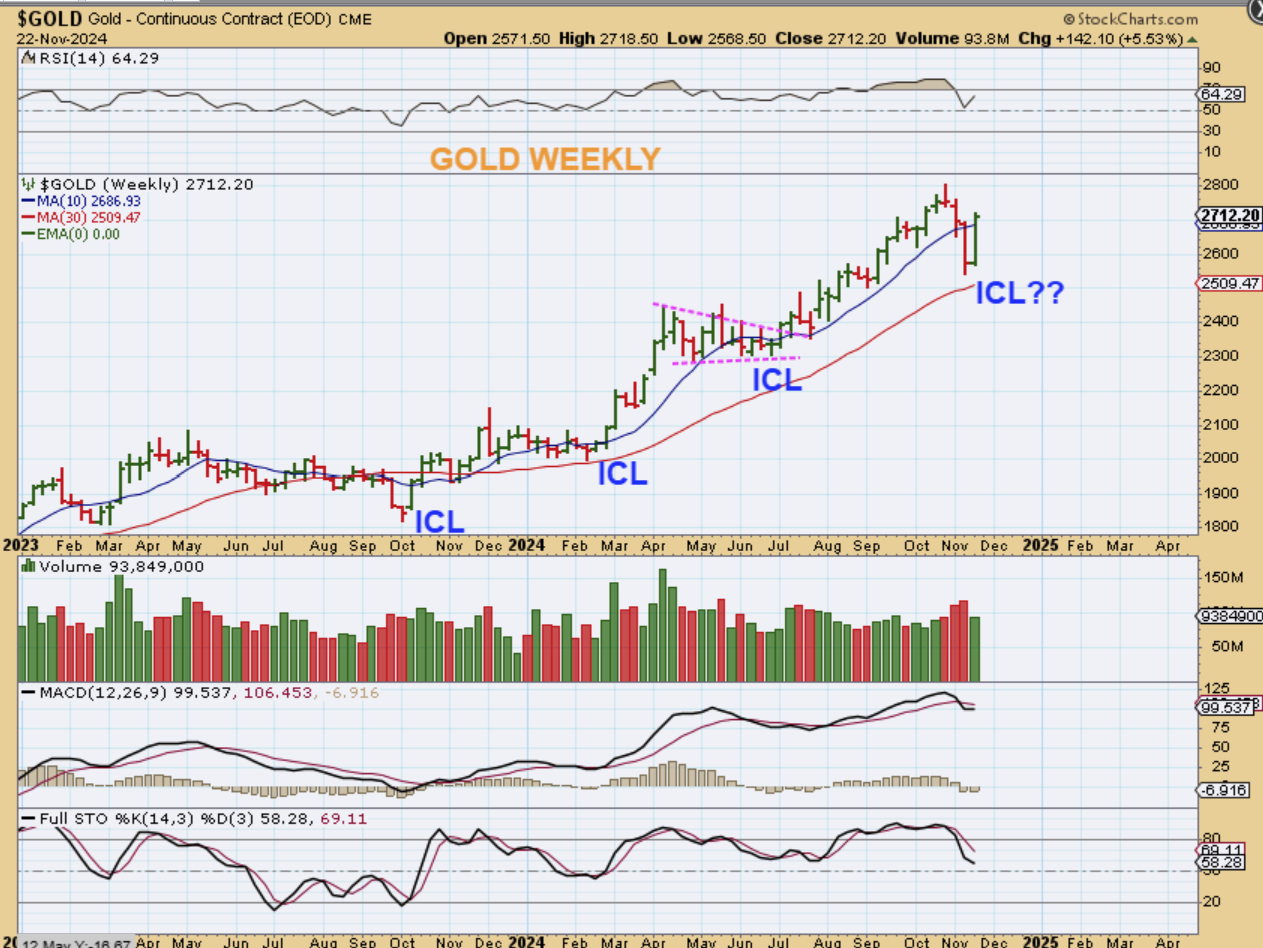
GOLD WEEKLY – Can this be a weaker 5th daily cycle? With the USD running higher, Gold flipped around and gave us this? Gold was up 5.53% last week and has already pushed back up and above the 10 week ma. This looks very bullish so far.
.
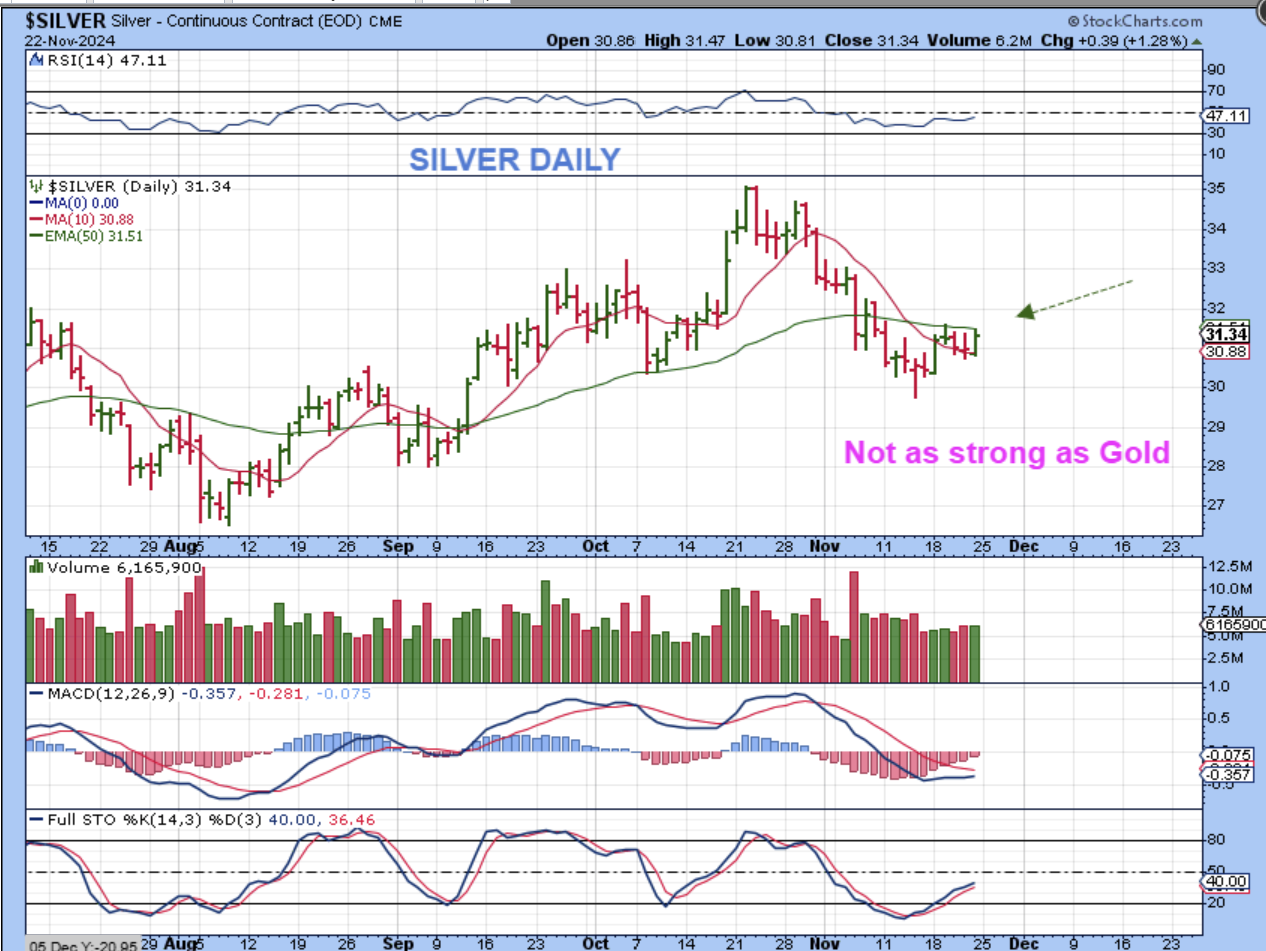
SILVER DAILY – Day 6 for Silver has it still near the lows and this is where it gets tricky.
1. This should be showing us 3 daily cycles with higher highs, and then a selloff with that 3rd daily cycle into the recent low.
2. That means that this should be a 4th weaker daily cycle that chops higher and then rolls over and brings us into an ICL, but Gold looks to have bottomed.
3. We want to remember that GOLD BOTTOMED IN JUNE, SILVER BOTTOMED IN AUGUST. Gold may be bottomed first again.
.
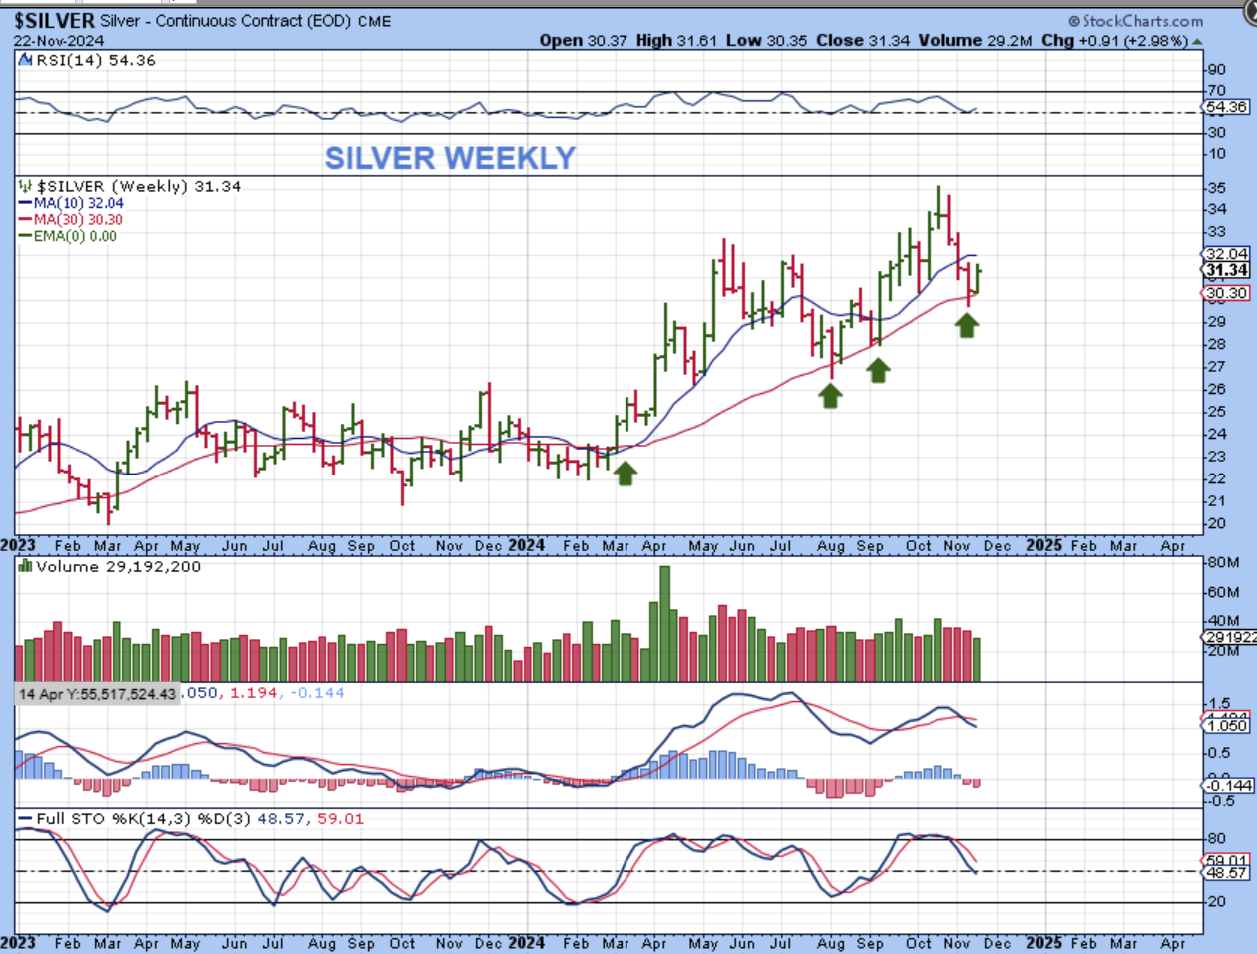
SILVER WEEKLY – In Technical analysis, Silver reversed right where it should have, at the 30 week ma.
.
GDX DAILY – GDX sold off very sharply from October to November and I have mentioned that this does resemble an ICL sell off. I expected 1 more daily cycle to rally and drop to a slightly new low though, so…
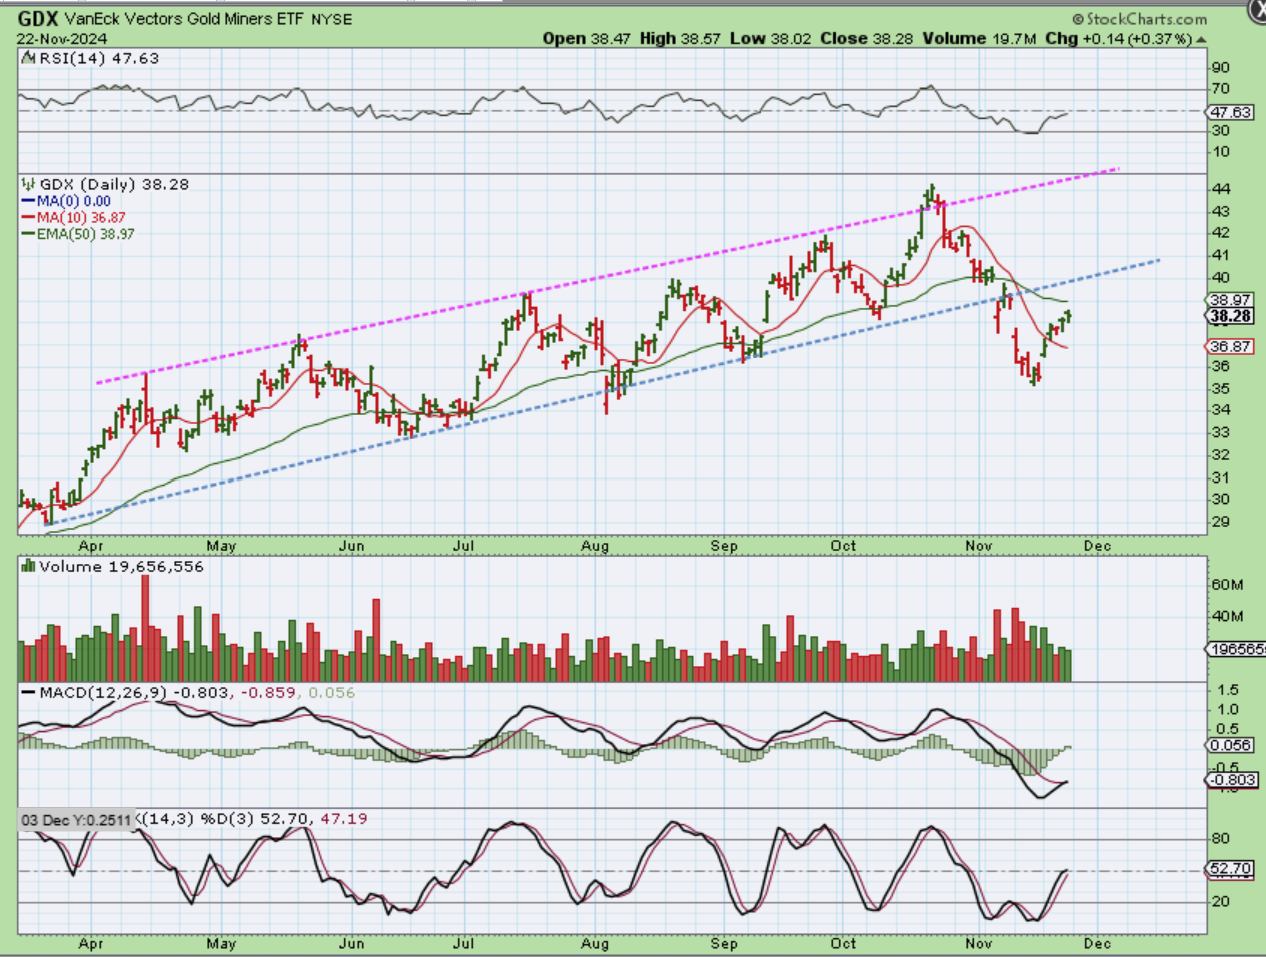
.
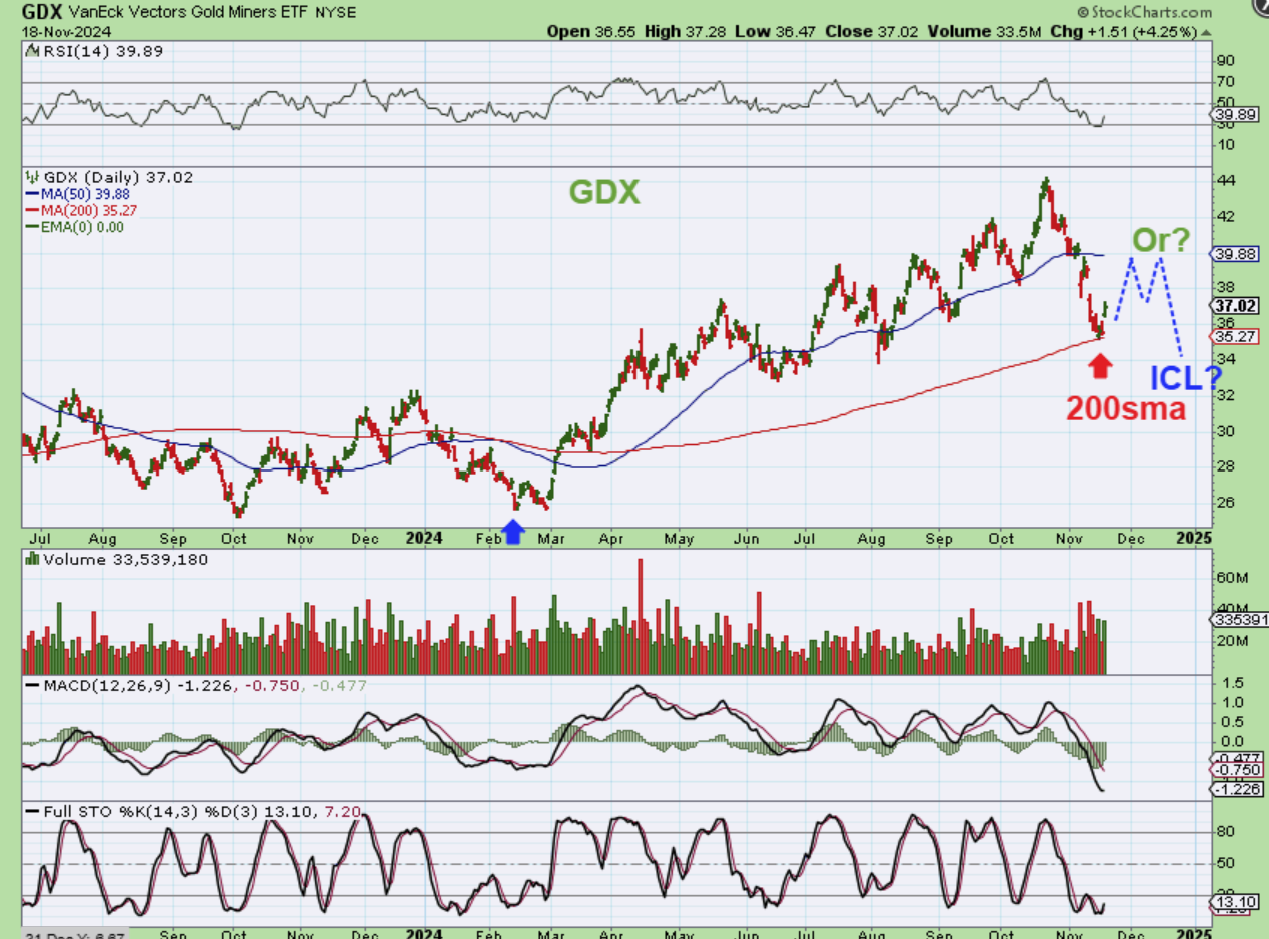
I expected 1 more daily cycle to rally and drop to a slightly new low, so I drew that like this last week on Nov 18th. I said that you can buy this reversal at the 200sma, but be aware that it could drop one more time. COULD THIS BE AN ICL FOR THE GDX? I would say that if Gold has one, then the Miners could too.
GDX WEEKLY – Was that 4 week sell off a drop into an ICL at support. At this point, I have to say that it should not have played out this way, but this bull run just regained the 30 week ma too. Now let me show you one last thing…
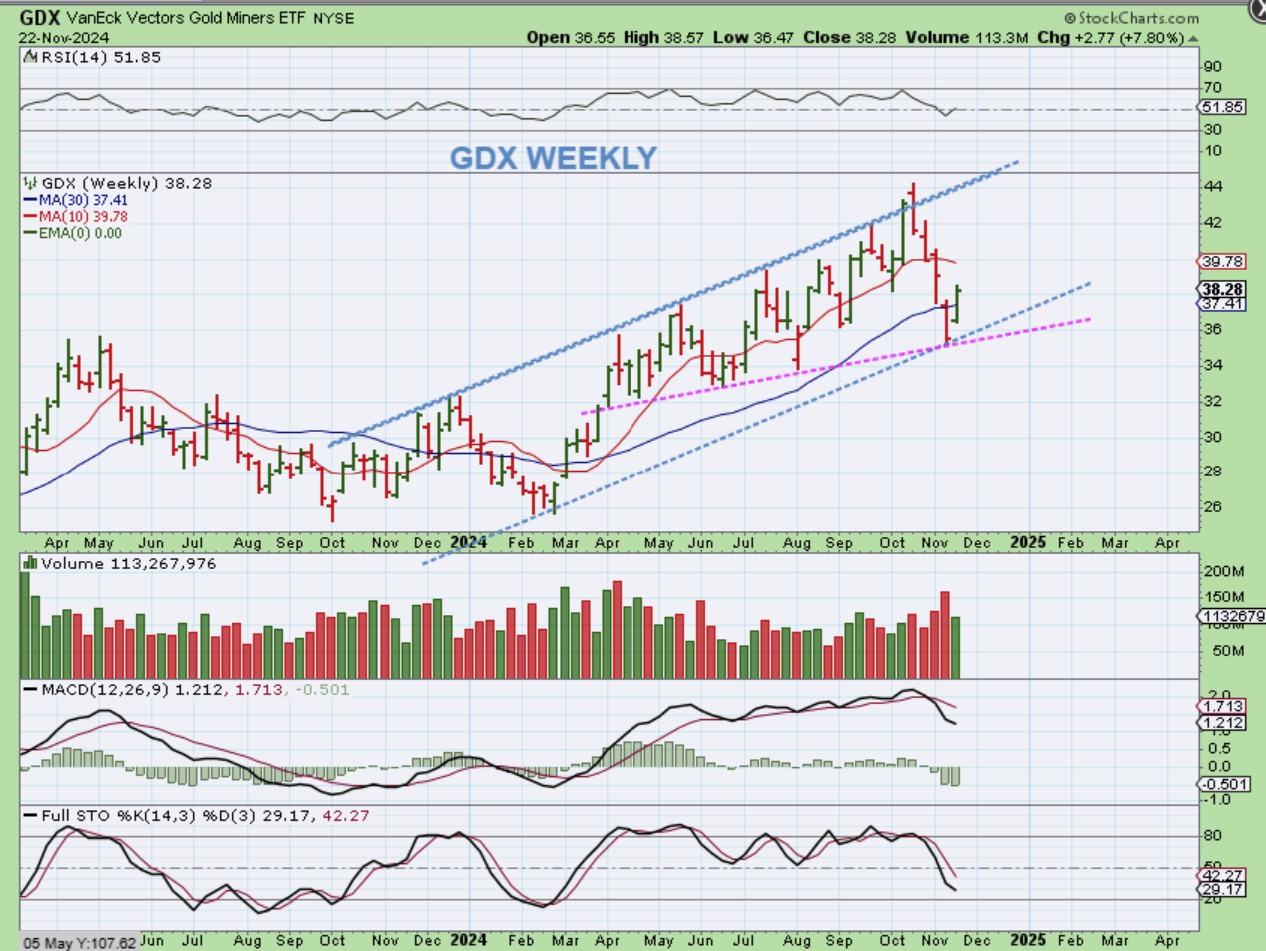
.
Now let me show you one last thing:
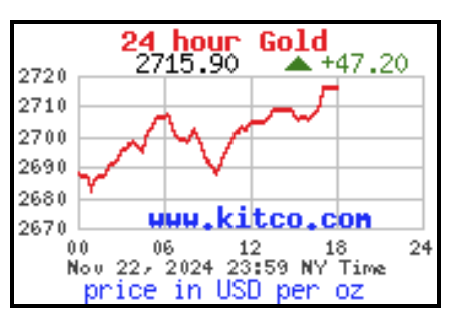
Several of the Miners popped and dropped or even closed Red on Friday, with Gold rallying almost $50 higher according to Kitco.
.
Notice that Gold rallied over $40 higher on stockcharts before a slight dip into the close, in this bullish push above the 30 ma on Friday (I often use a 34 sma).
.
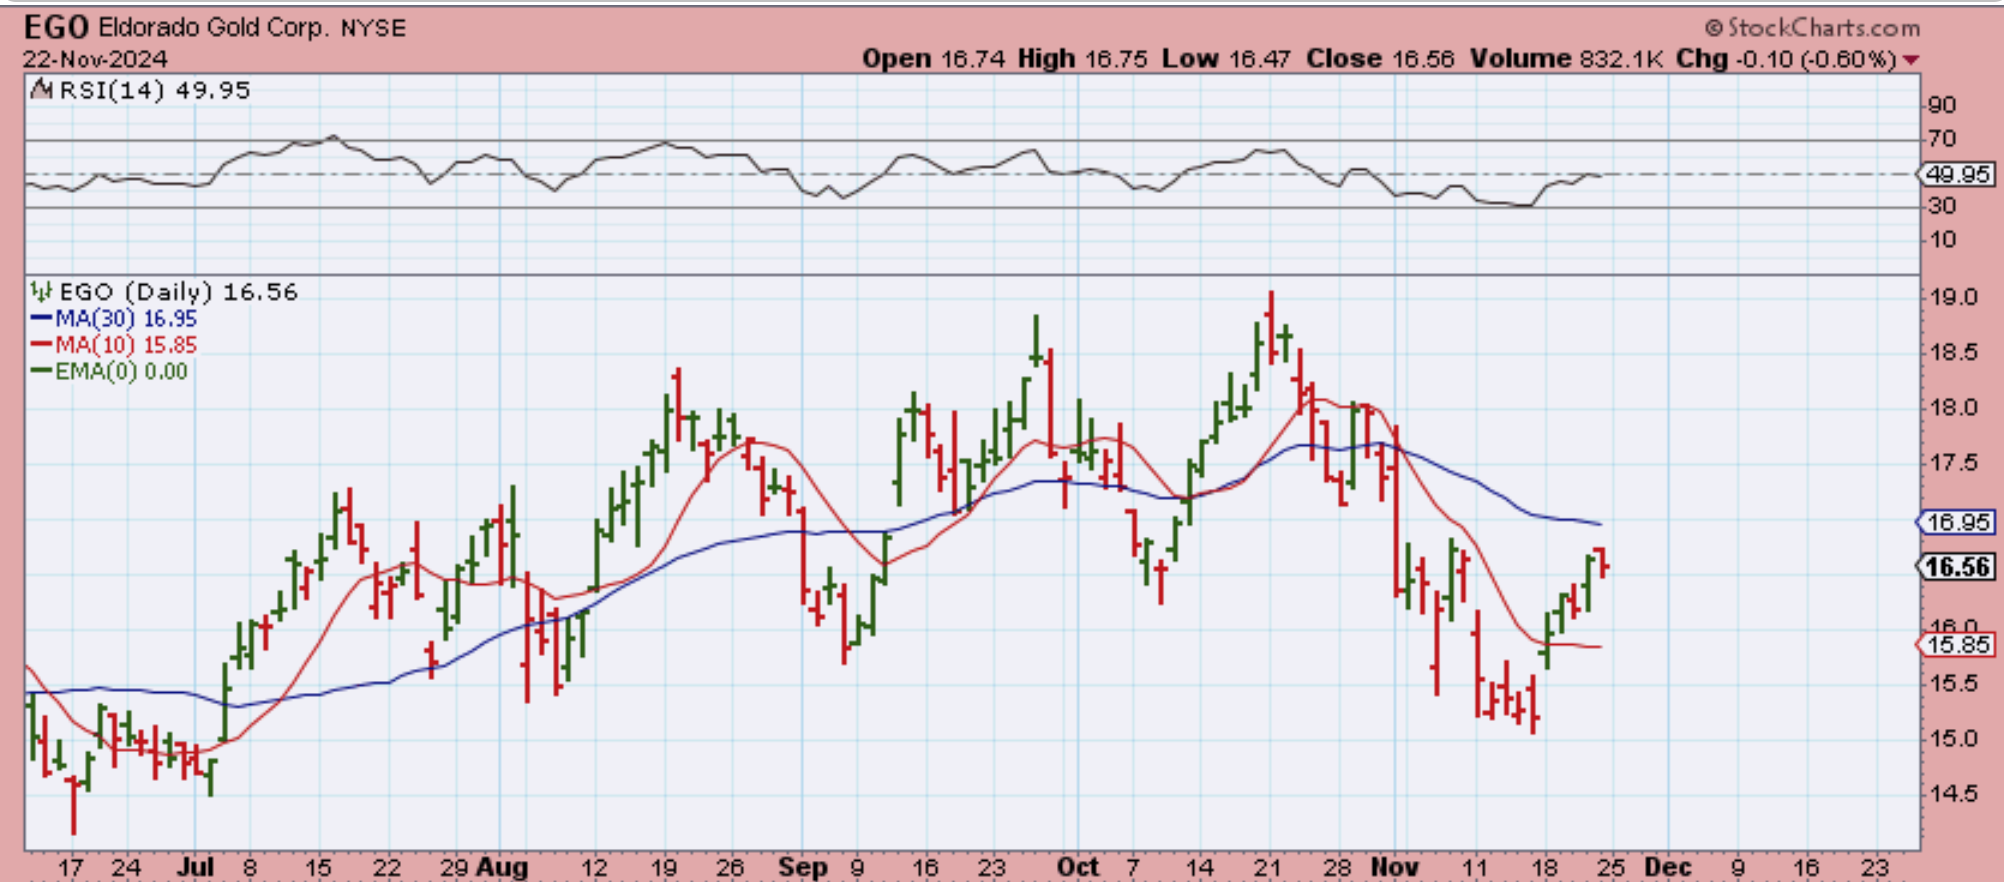
Gold rallied $40- $50 higher and EGO popped up and closed red.
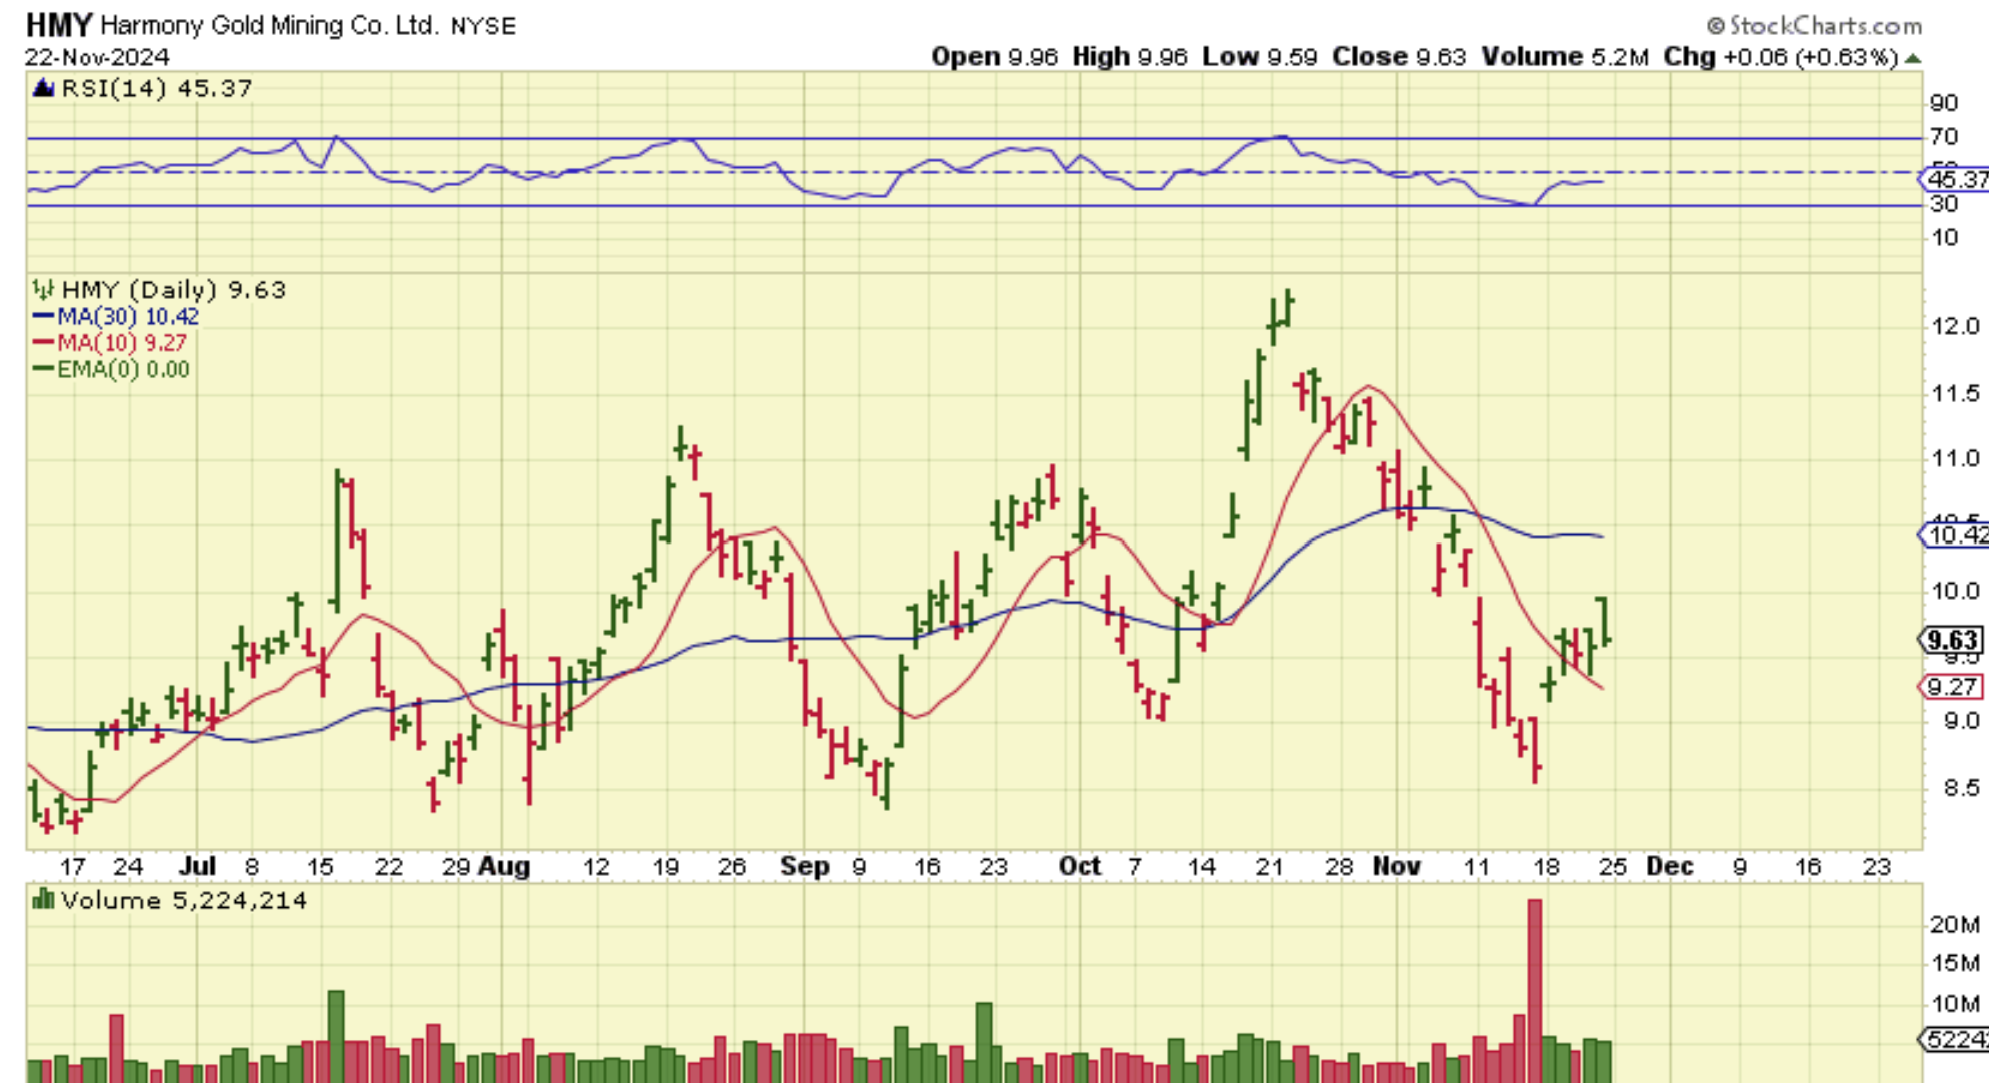
Gold rallied almost $40 – $50 higher and HMY Popped and dropped to only up 6 cents.
.
So my point is this: Gold may have begun its next leg higher, but as Gold rallied aaround $40 – $50 higher on Friday, many miners didn’t seem to believe it. This means that either we still have the ICL ahead and things will get choppy for Gold very soon, or you still have time to buy some Miners while they Popped and dropped, just in case Gold continues higher and they join the race. Right now, Miners are still near the lows, so you can choose to grab a few and use stops or just wait and see what happens.
.
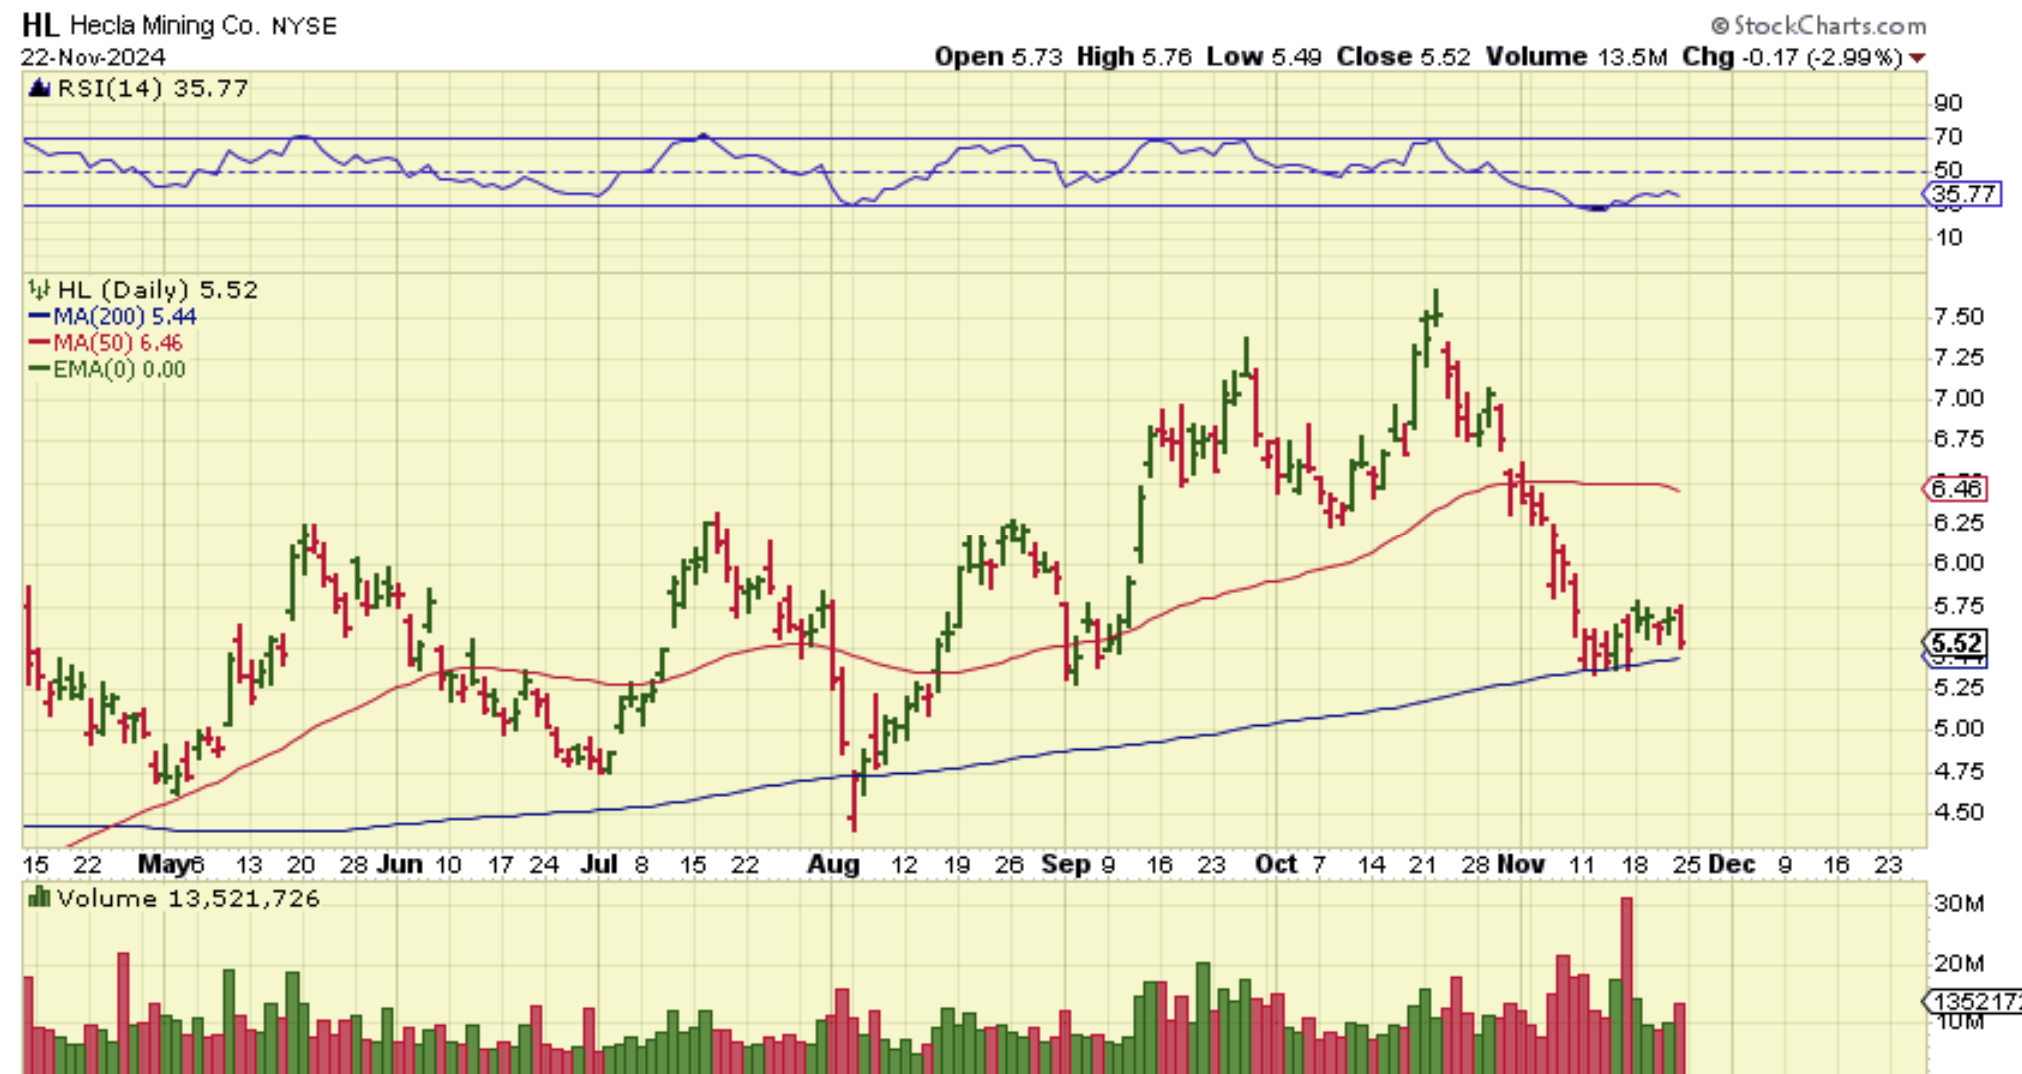
I will say this though, take a look at The Silver Miners like AG, EXK, CDE, HL, FSM etc. Most were red, are still near the November lows, and do NOT look ready to go higher yet.
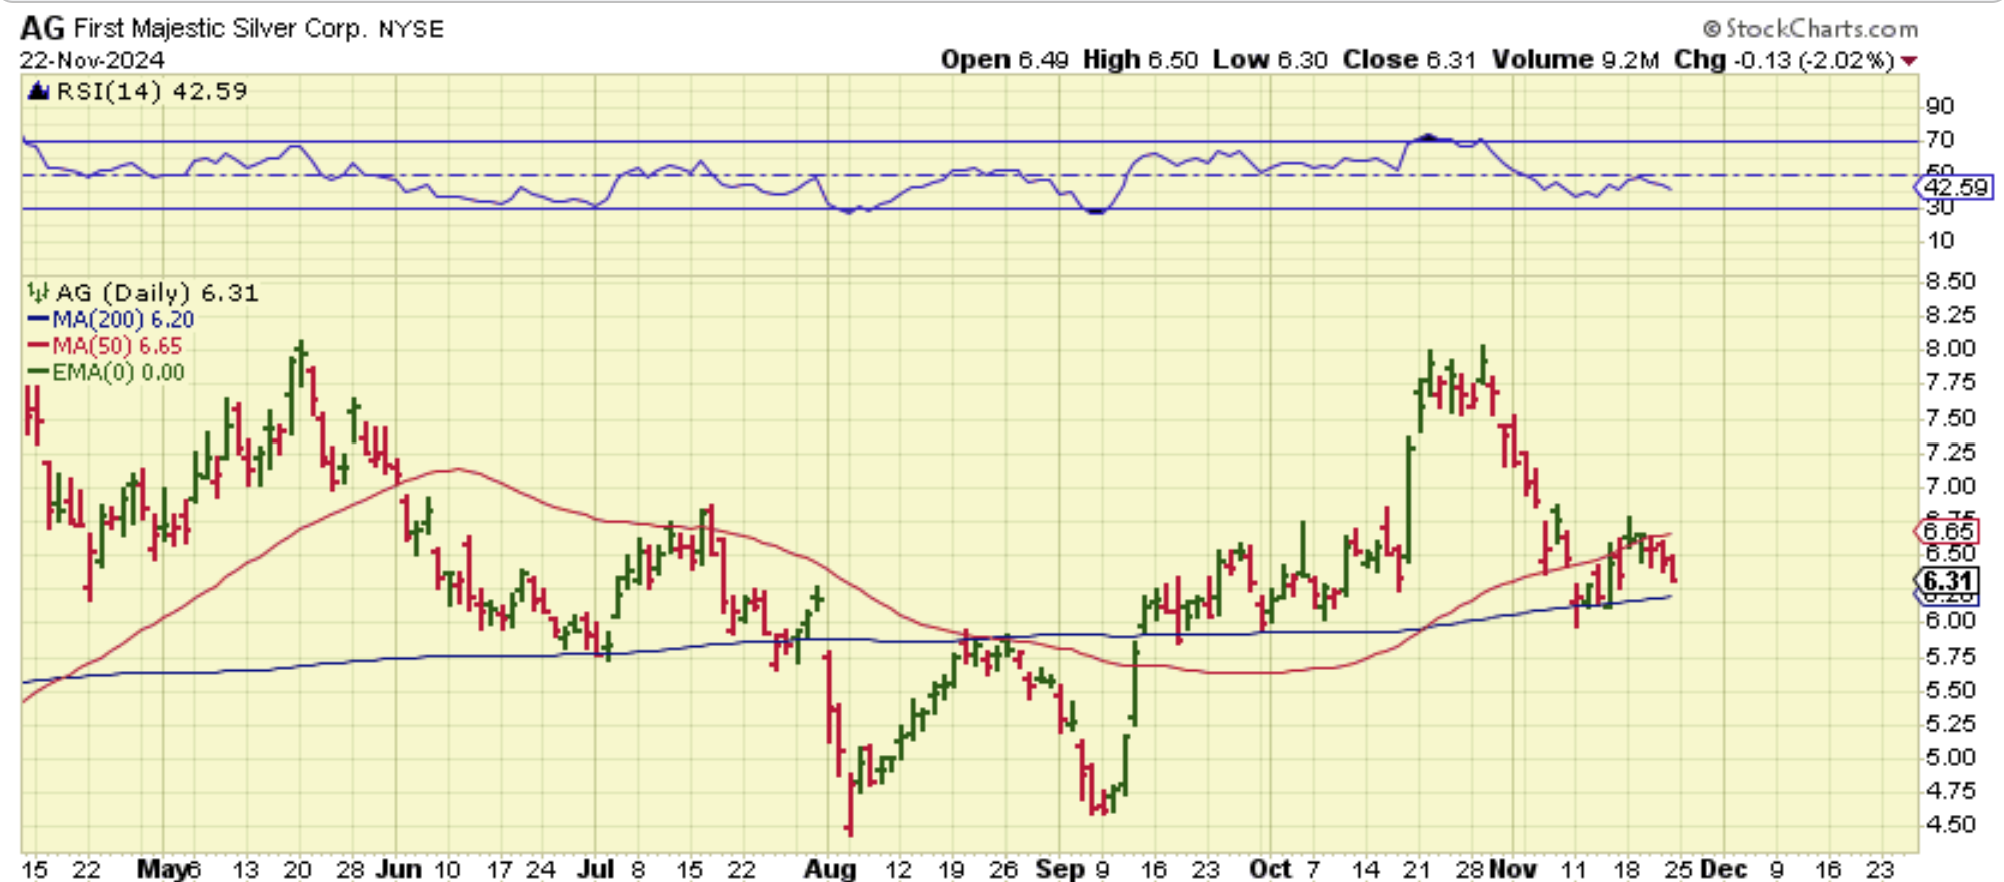
.
Therefore, I think we still have time with Silver and the Silver miners, even if Gold stocks like EGO, KGC, IAG, etc start to run again. It is a very mixed picture!
It is a very mixed picture with the General Markets ( SPX, IWM, vs SOXX) and with Gold, Silver, and The Miners! All of these are in Bull Markets and they are strong, so they seem to have the ability to find buyers and continue to rally when they are still due for a meaningful pull back based on their cycle counts. Gold Silver, and The Miners DID have a deep sell off, but Gold seems to have bottomed early. Silver and the Miners are not running higher as quickly as Gold, so we need a little time to see how it will all play out. At this point, we each need to decide how we want to be positioned with the current set ups before us. We can always change our positioning as clarity develops too (adding or lightening up along the way, based on future price action). Oil stocks are bullish and Bitcoin has been Very strong, almost at $10,000. Crytpo stocks actually responded again on Friday, so the Bulls are still on the run.
.
Enjoy your weekend!
.
~ALEX
.
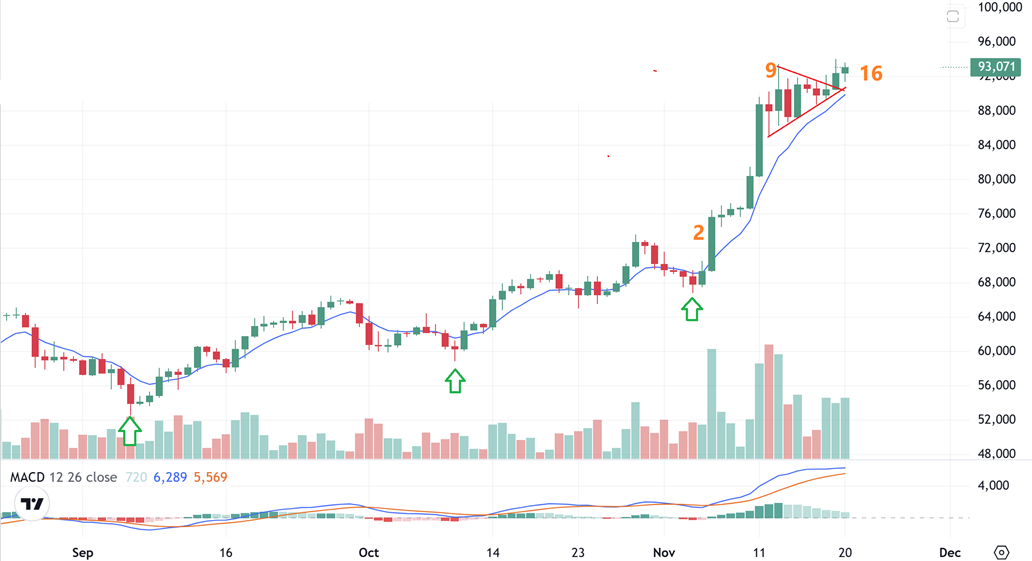
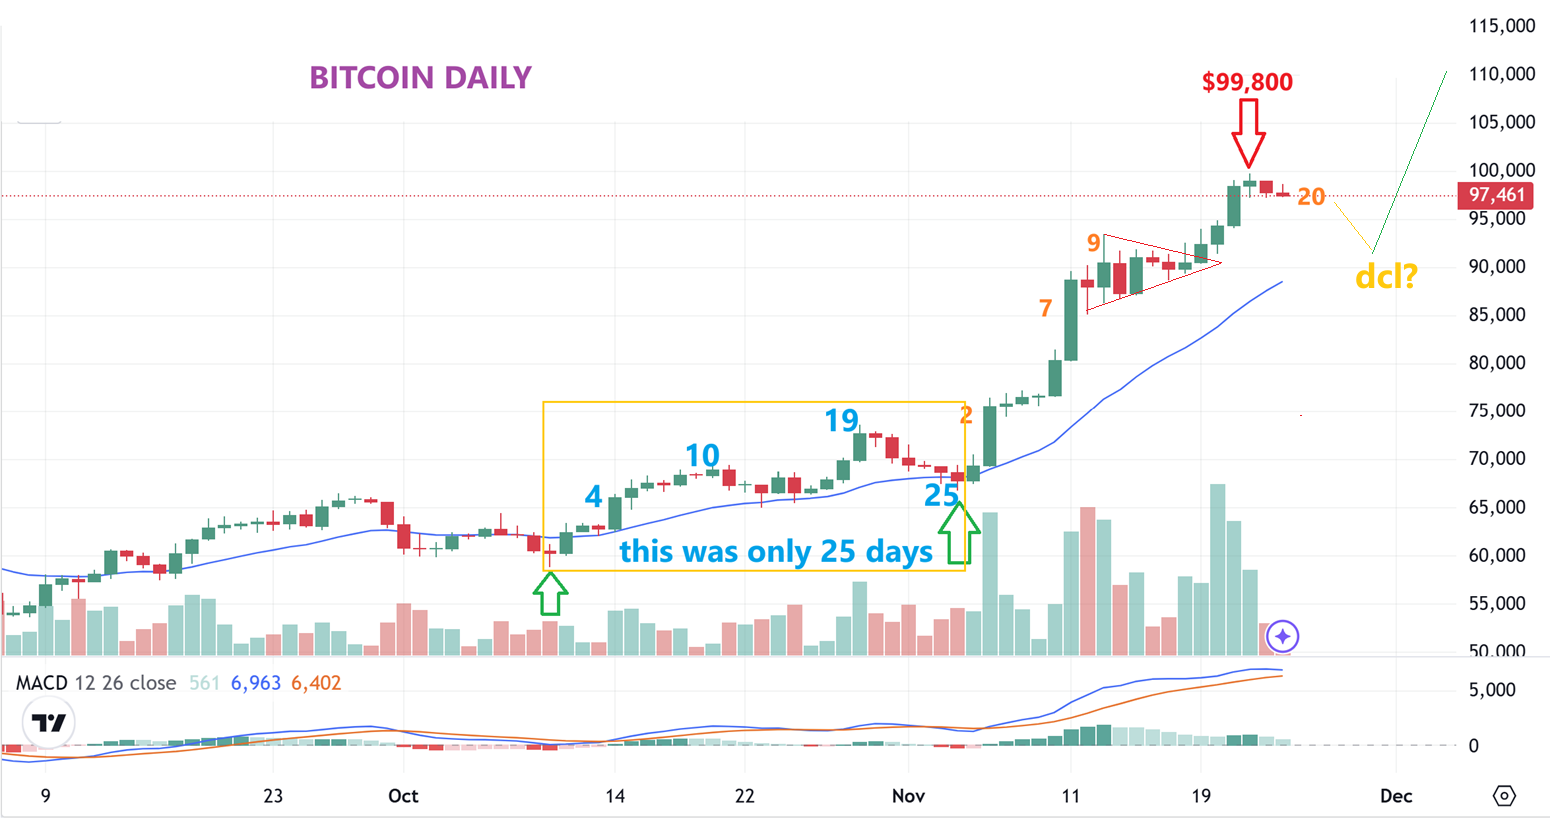
JUST A REMINDER WITH WEDNESDAYS BITCOIN CHART, that as of Thursday, we were on day 17 of a possible 30 day cycle count. Bitcoin then took off to tag $99,800.
.
BITCOIN on Sunday is at day 20 of possible 30 or so. My target was $100,000 and then $120,000, so tagging $99,800 may be all that we see for a few days, we’ll see. Let’s examine the chart.
.
With this chart, I am simply showing you…
1. With the last cycle, Bitcoin peaked on day 19 and then slowly sold down and bottomed on day 25.
2. Bitcoin peaked on day 18 so far near $100,000, so Bitcoin may dip lower, form another pennant & bottom near day 25 again, and then take off, as drawn here by me.
3. We do also want to remember that this is a super strong Bull phase, so we also realize that it could just take off again and rally straight up to day 28 at $110,000 for example and then dip into a mild day 33 low.
4. In other words, this is a strong bull, anything can happen from here, but I/m sharing a couple of scenario possibilities based on the set up. 🙂
.
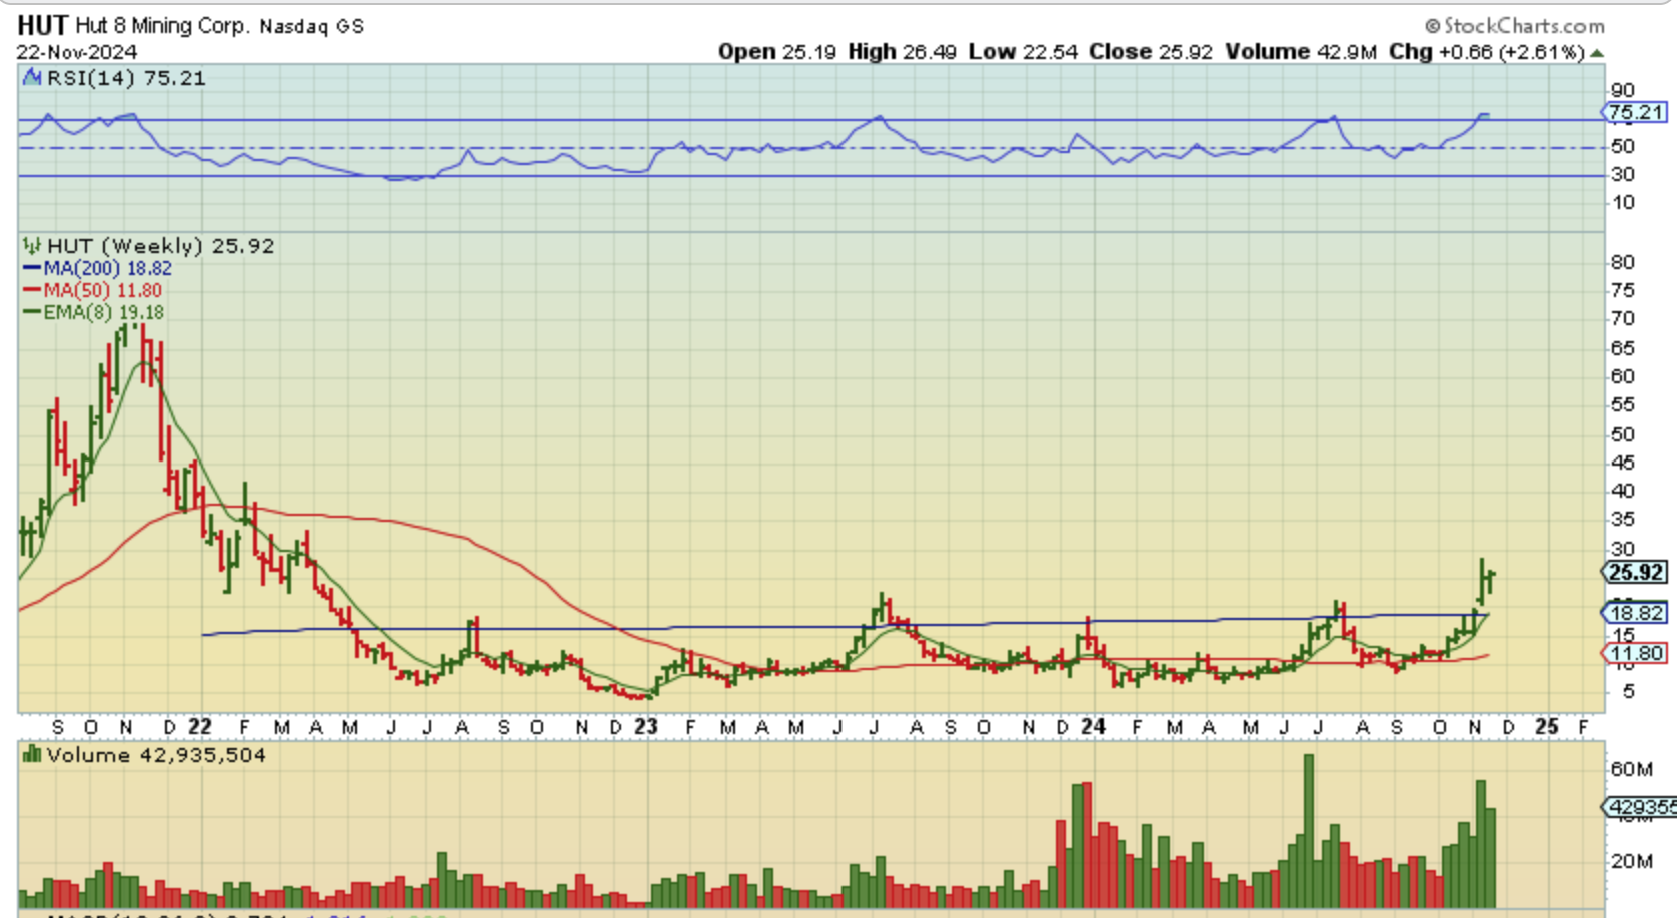
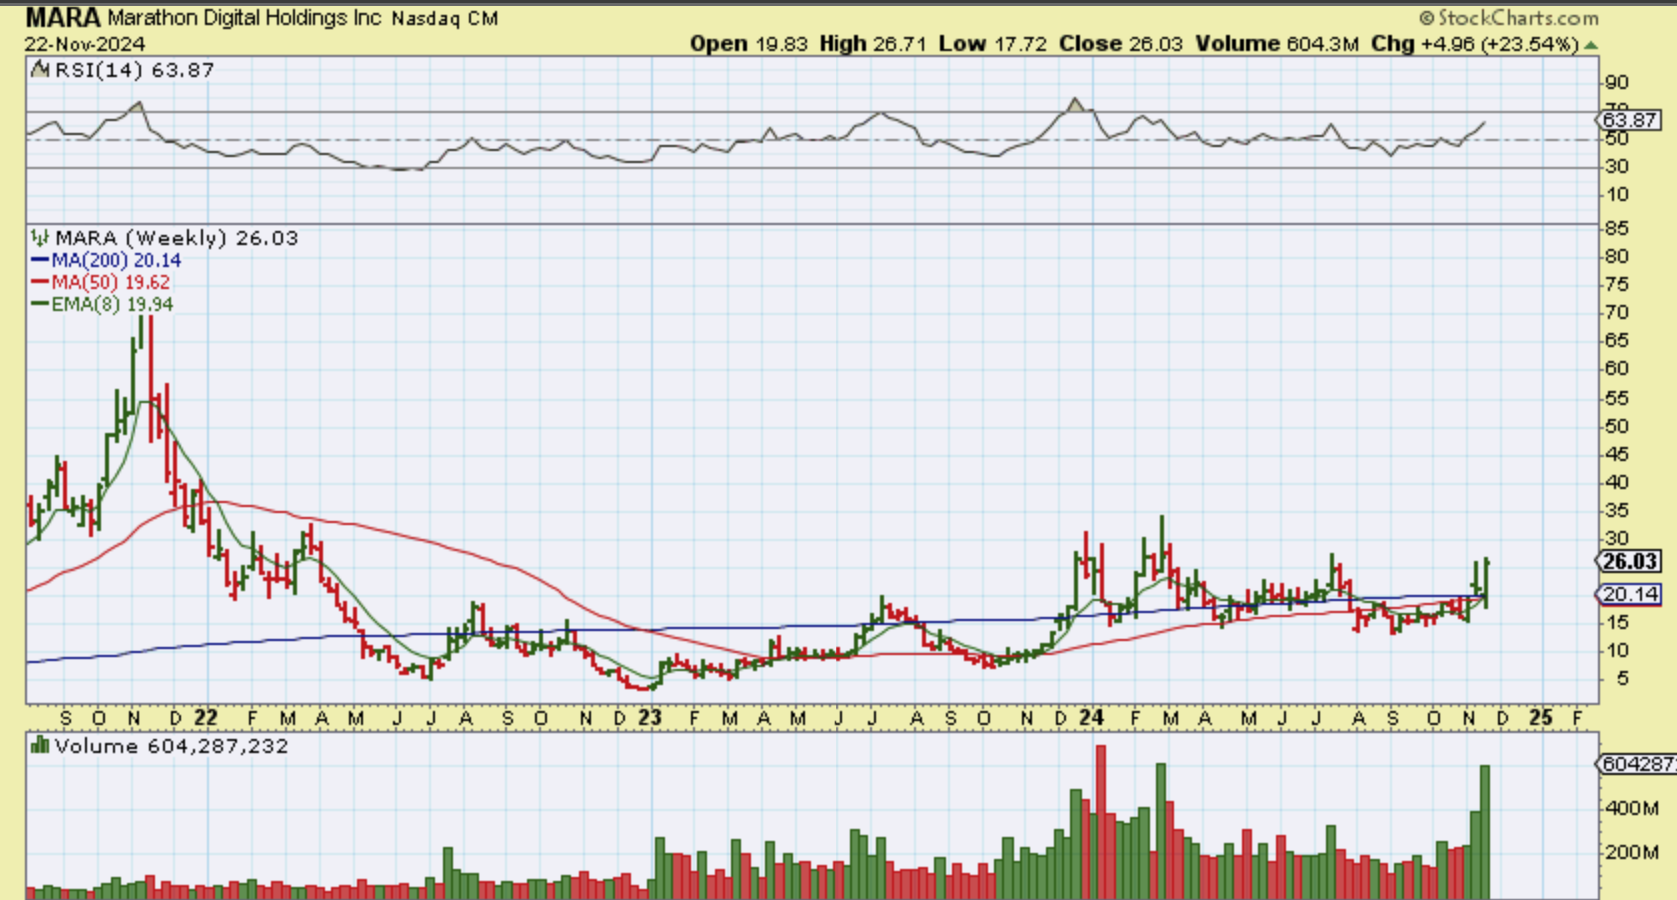
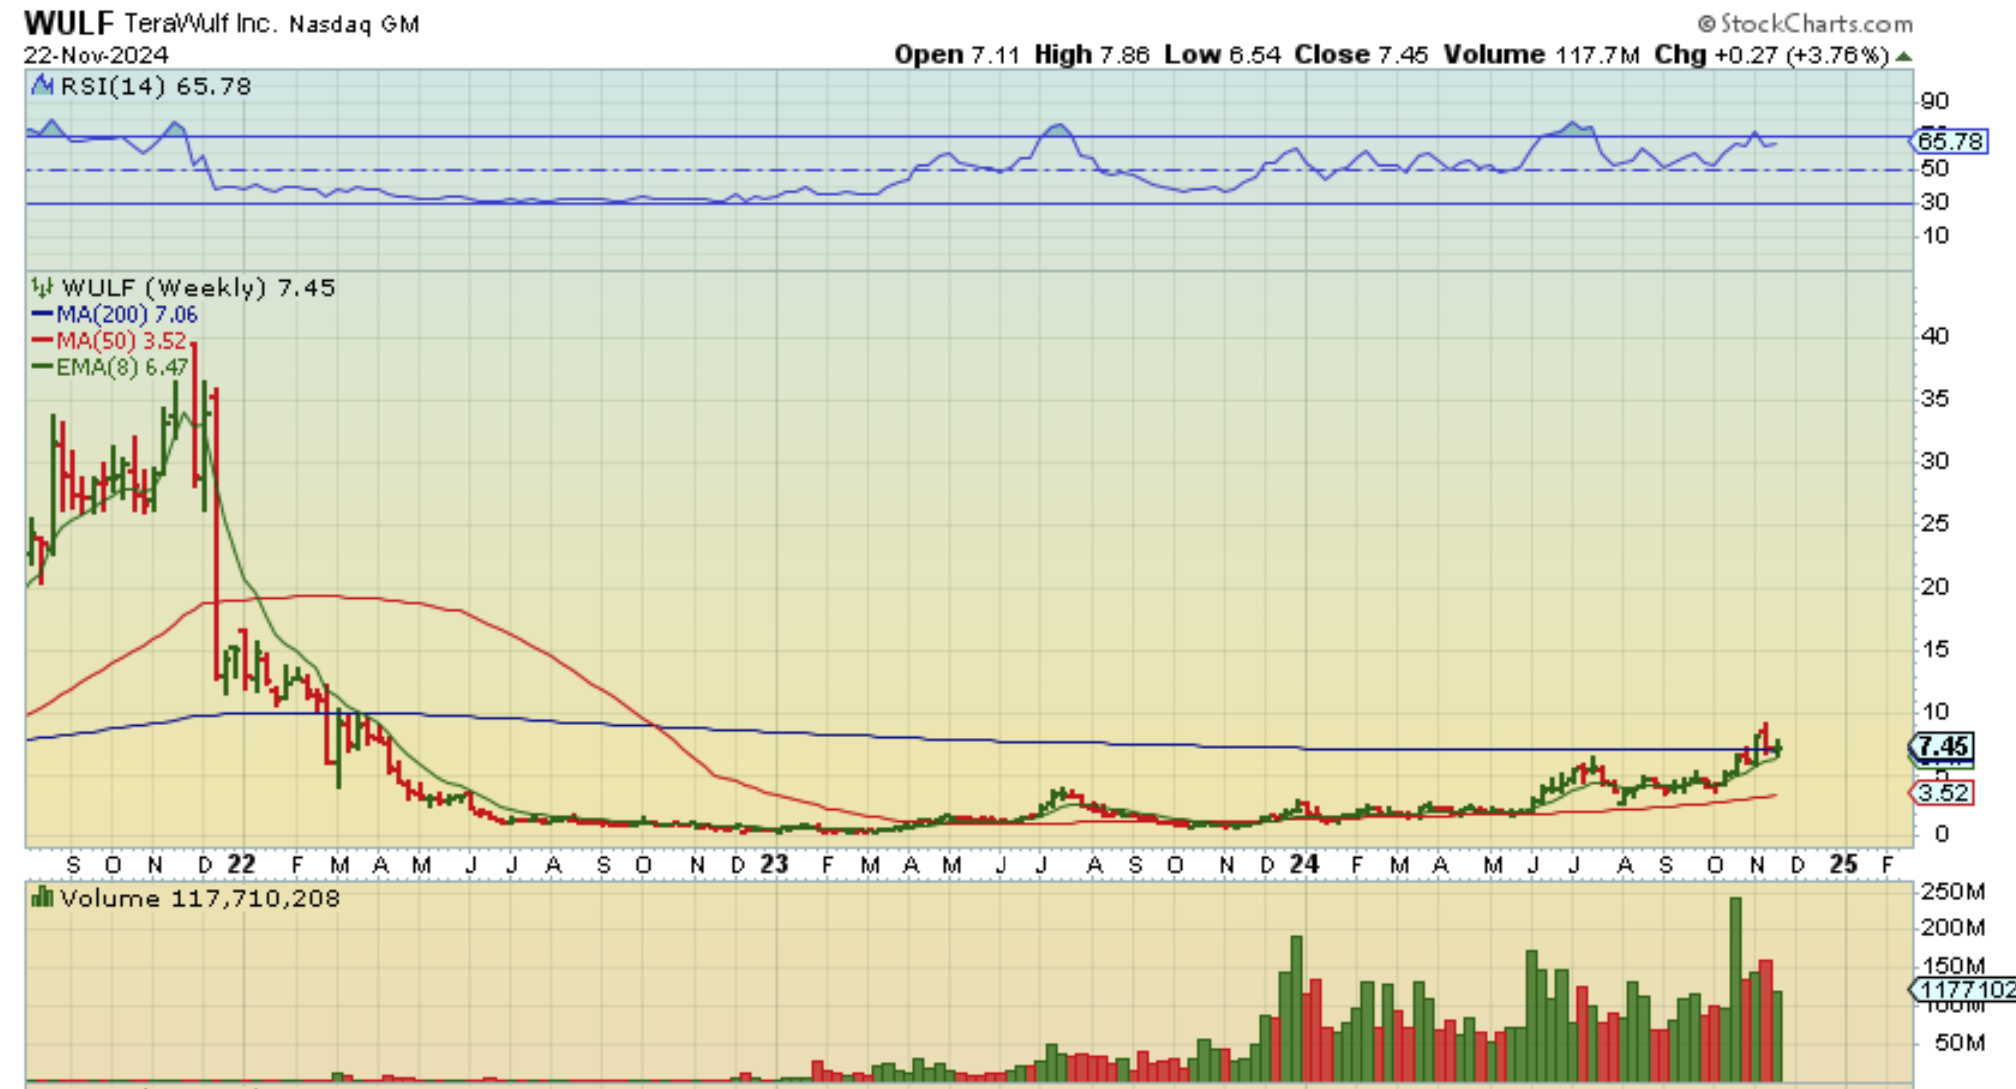
CRYPTO STOCKS RESPONDED BULLISHLY TO BITCOIN AGAIN. If you look up the daily and weekly charts, they are showing bullish activity again, so they may start to stack on the gains again. We saw several strong reversals on Friday, with the stocks up 15-20%, so now I will just show you 3 stocks where last weeks reversals gave us some very bullish looking weekly charts below.