Tuesday November 19th – Occasional Choppiness
.
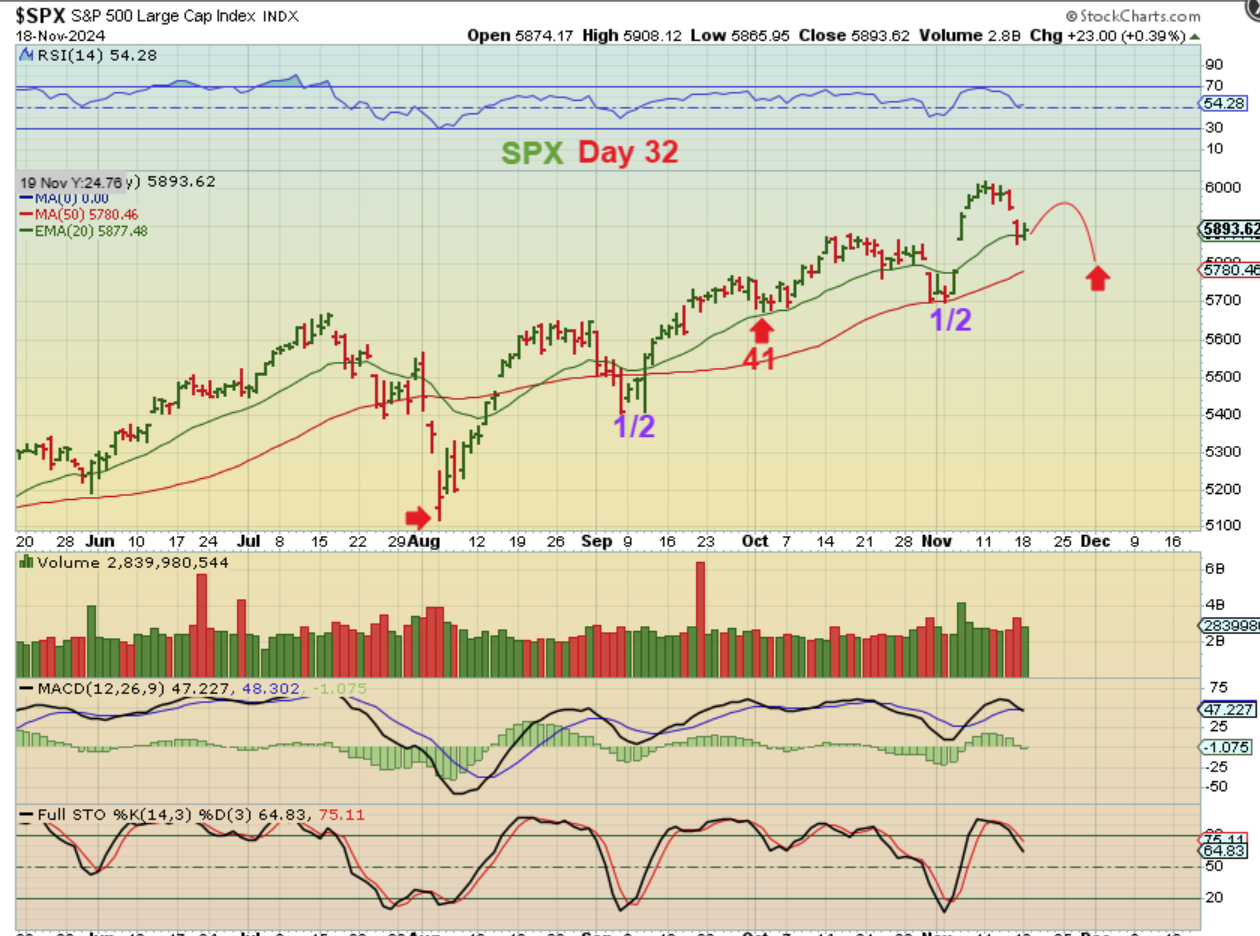
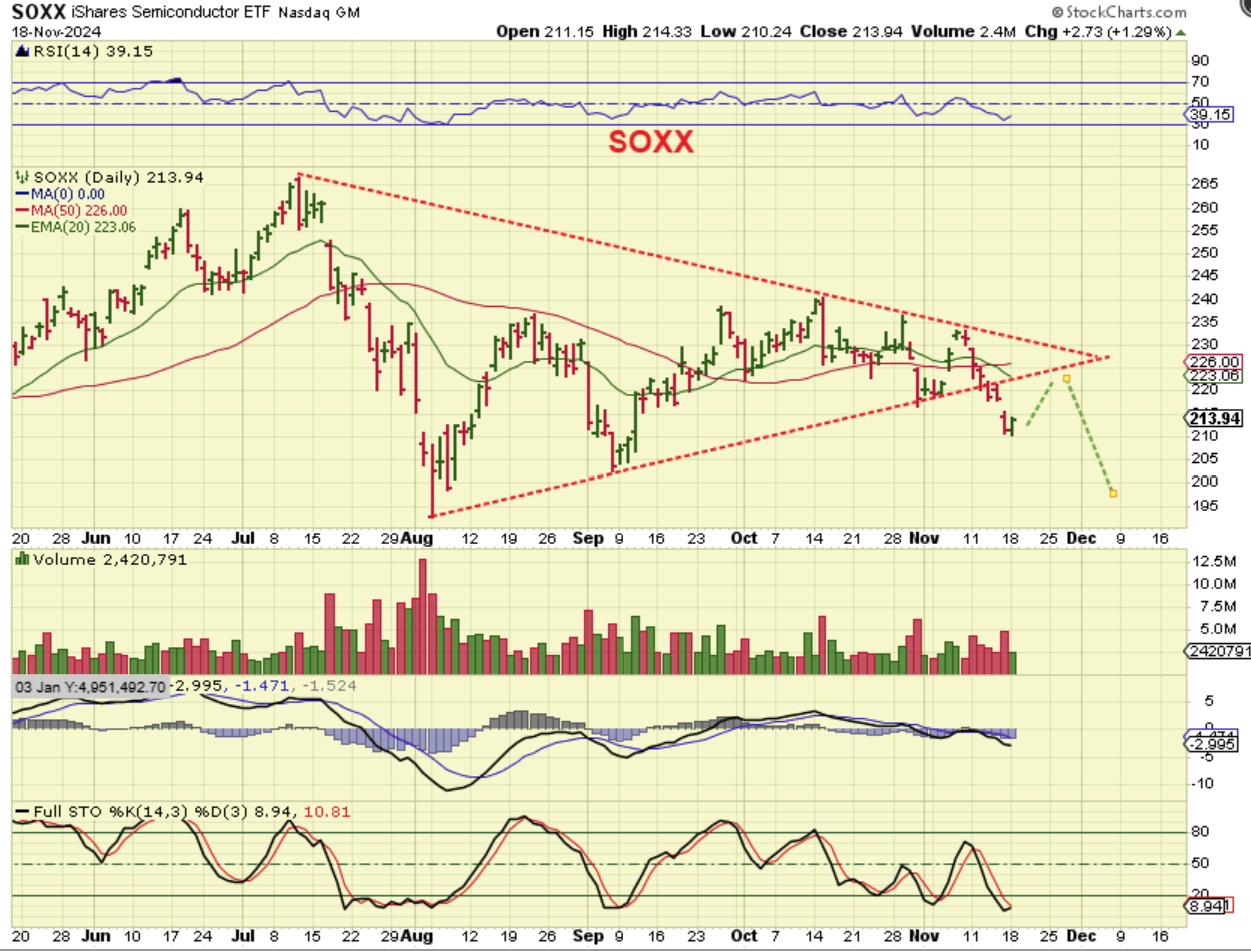
SPX – You could say that day 32 is near the timing for a dcl and one could form right here, so let’s keep that in mind, but I am going to again point out the SOXX as a ‘caution sign’. So if anyone buys the reversal low here at the 20 ema, that is fine, but I would use a stop there. This might sell off with Data this week.
.
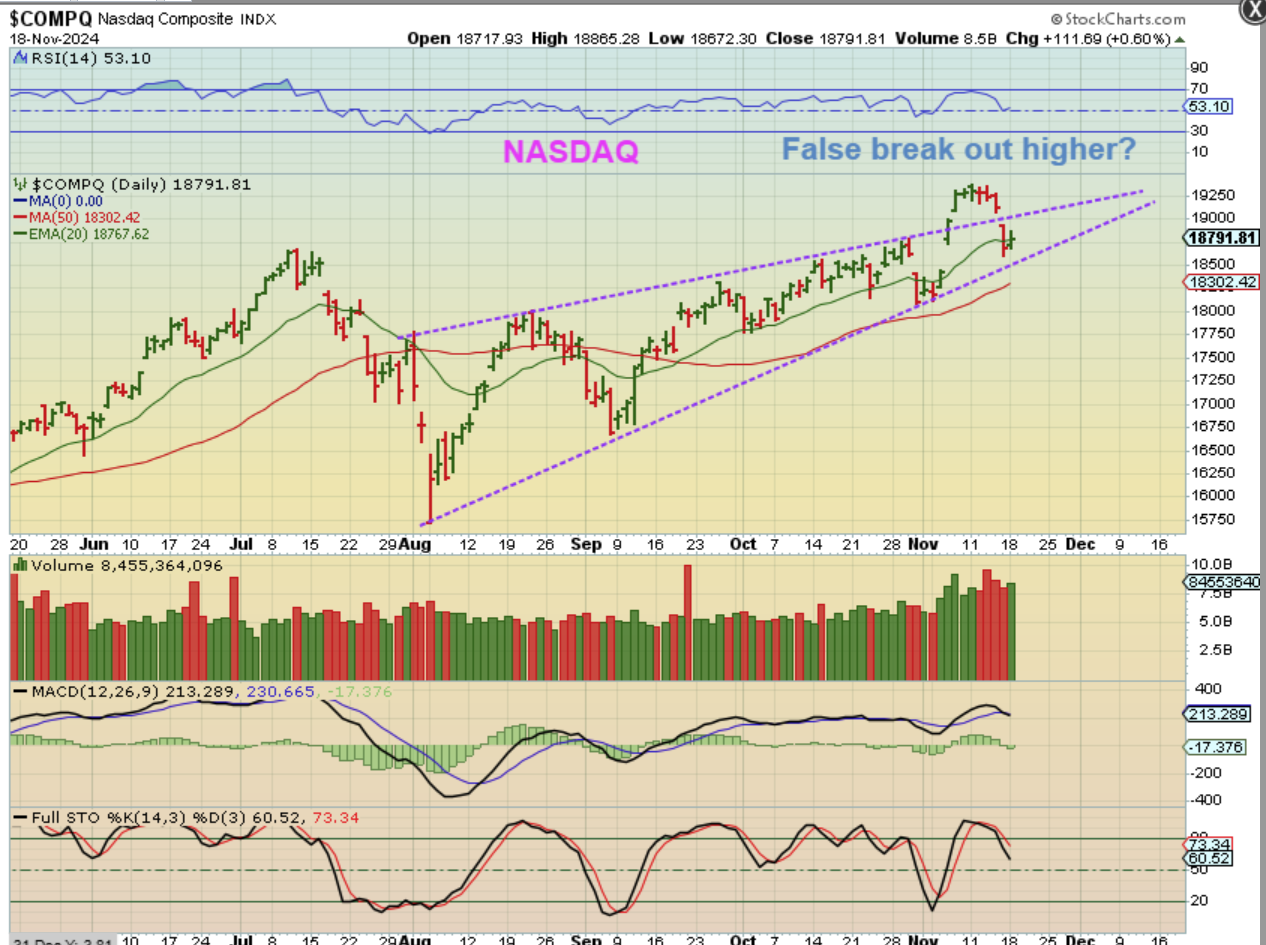
THE NASDAQ had a bearish rising wedge. It broke out to the upside and that would negate the wedge, but then price dropped right back inside. I honestly feel that the markets will still dip lower with the current set ups, and the SOXX is not pretty…
.
THE SOXX – This reversed higher too, but is this now bullish? Not at all. It is oversold so a bounce can play out, but as mentioned in the weekend report- we have a failed DCL and lower highs and lower lows. It is very hard for me to see that this will repair itself.
.
THIS WAS IN THE WEEKEND REPORT:
.
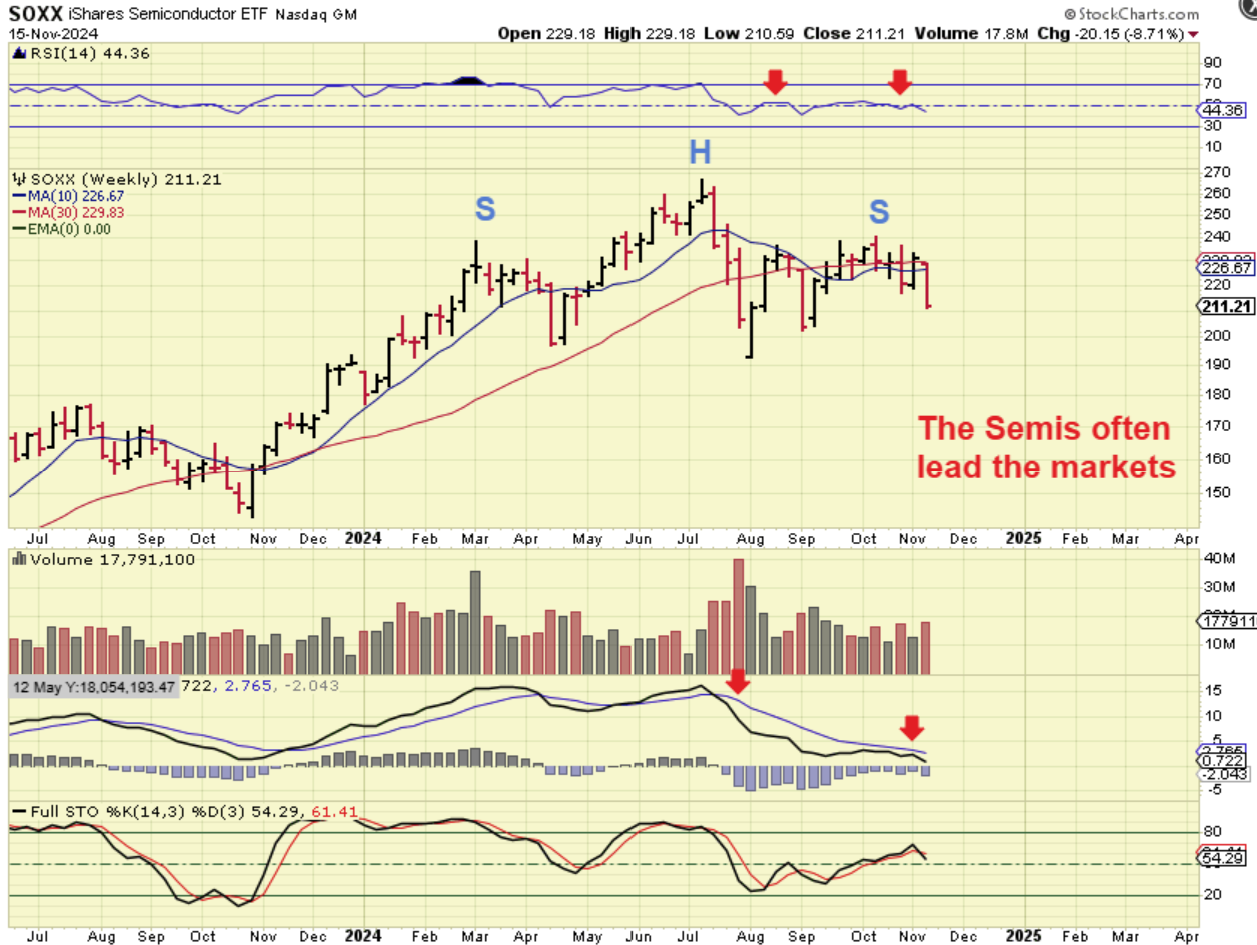
SOXX WEEKLY – The weekly chart now looks like a H&S has formed and we closed at last weeks lows. The SOXX lost the 10 & 30 week ma, and was down almost 9% for the week. THIS could lead the markets lower. The weekly MACD is a ‘weak’ MACD.
.
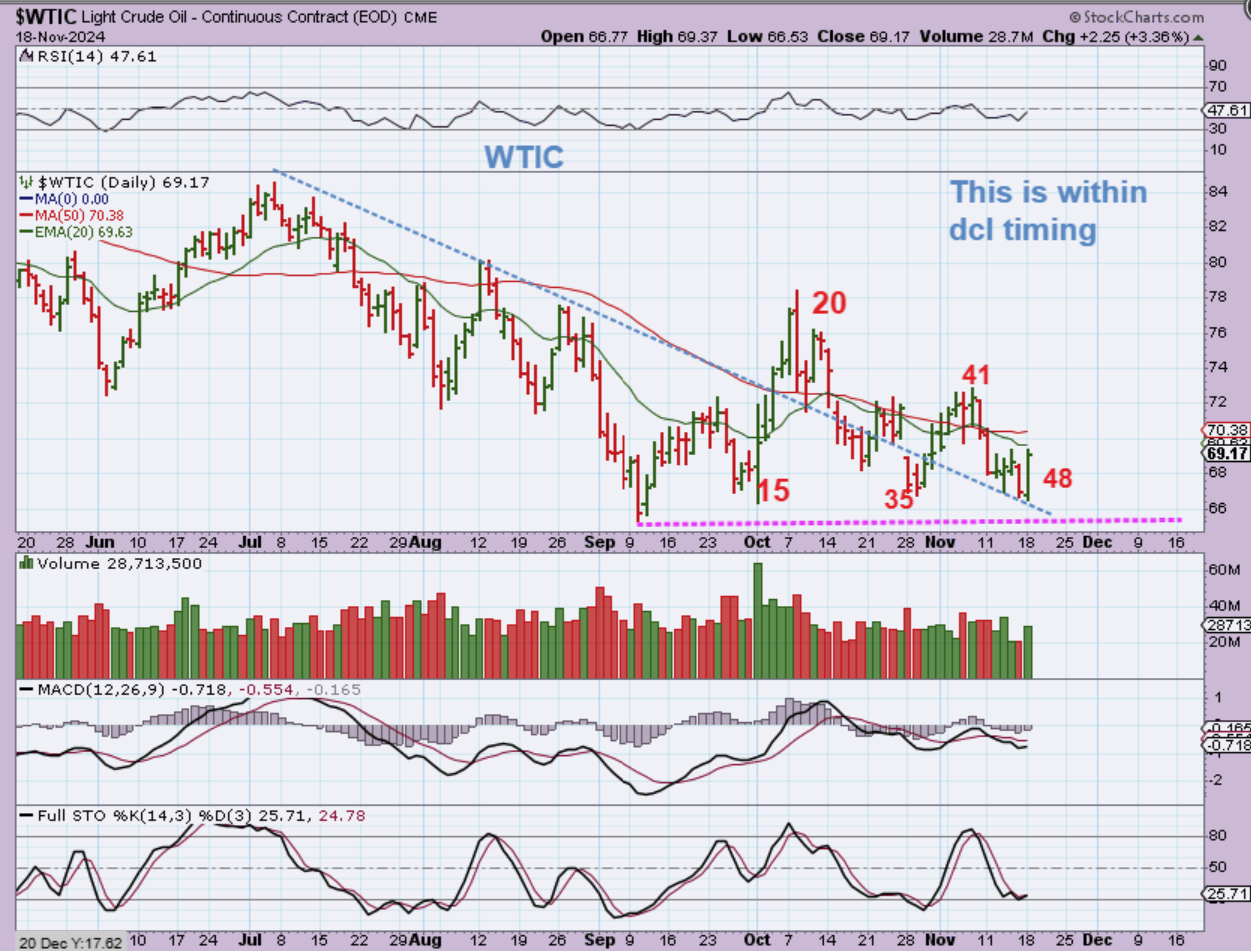
WTIC – Day 48, is this our dcl? If we have a dcl here at day 48, which is very much within the timing for a dcl, then that indicates that we do have an ICL in September. That also lines up with the OIL stocks. As pointed out in past reports, many oil Stocks and the XOP/XLE have become Bullish and didn’t follow Oil to the lows.
.
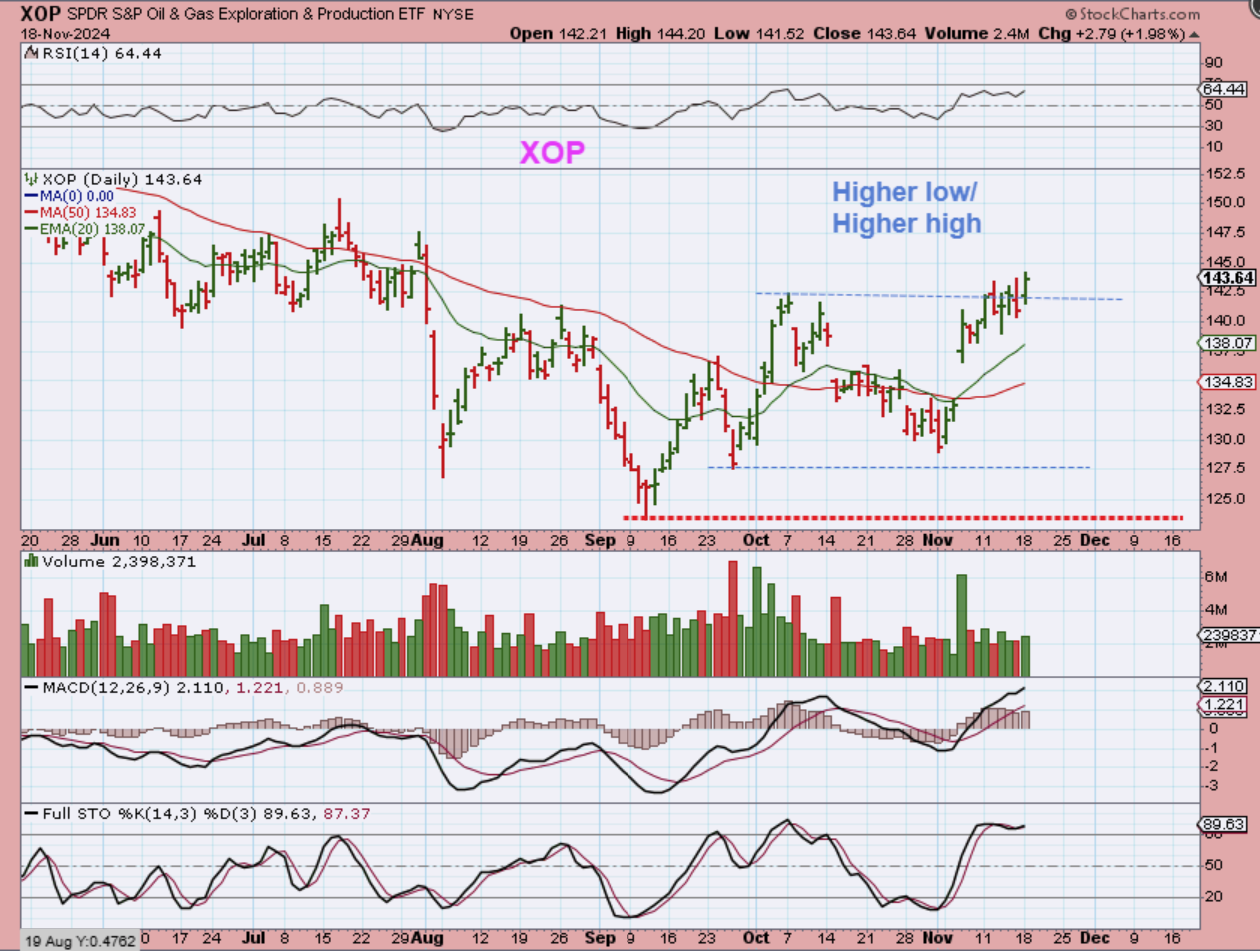
XOP – Oil is at THE LOWS, but the Oil stocks and XOP & XLE are making higher highs. The ICL for Oil (& the XOP & XLE) is most likely in September.
.
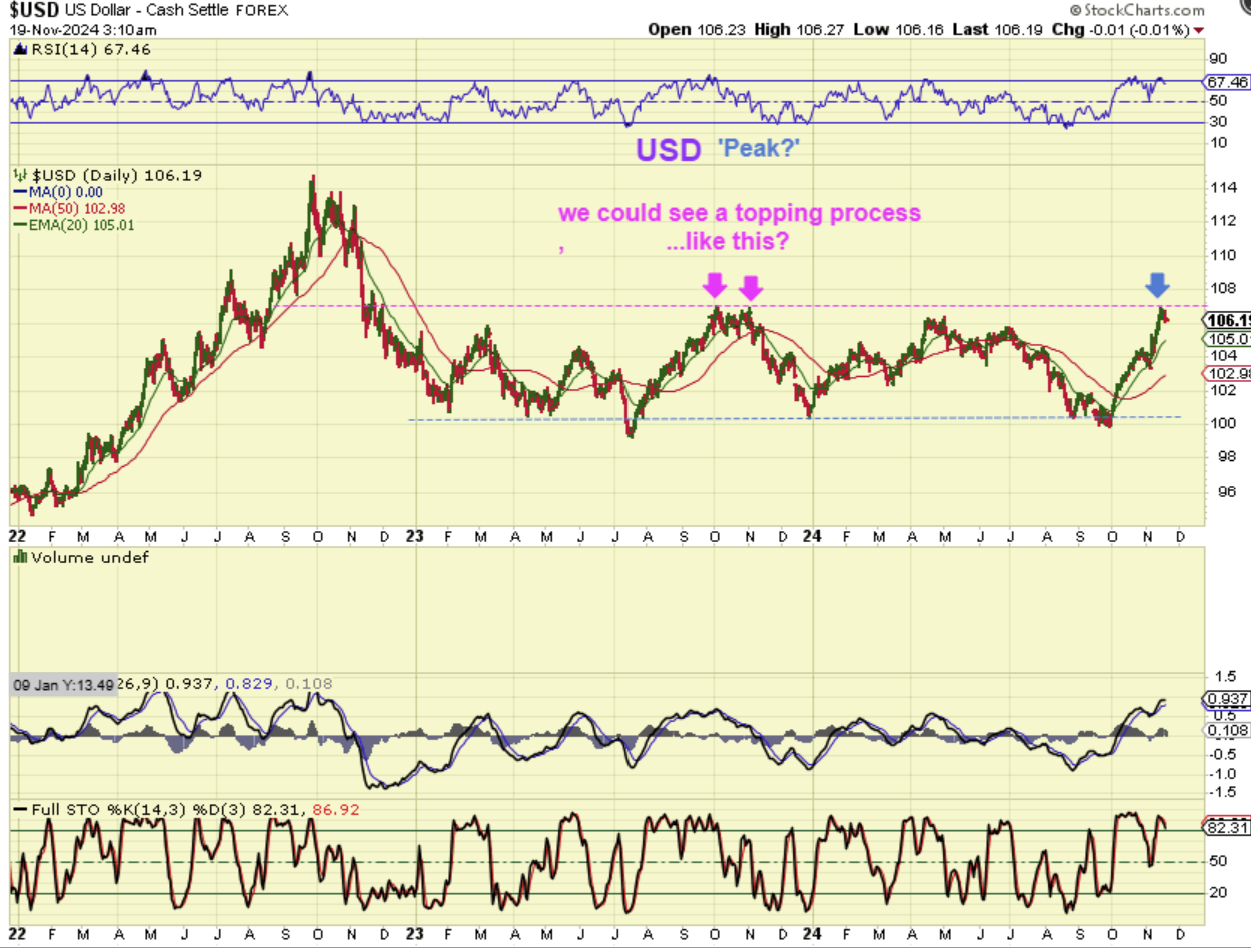
THE USD reached a resistance point and started to pull back. It is possible that this becomes the peak at resistance, but we may see a ‘topping process’ in this area that allows Gold to put in an ICL. Read the chart.
.
I drew this for the weekend report:
.
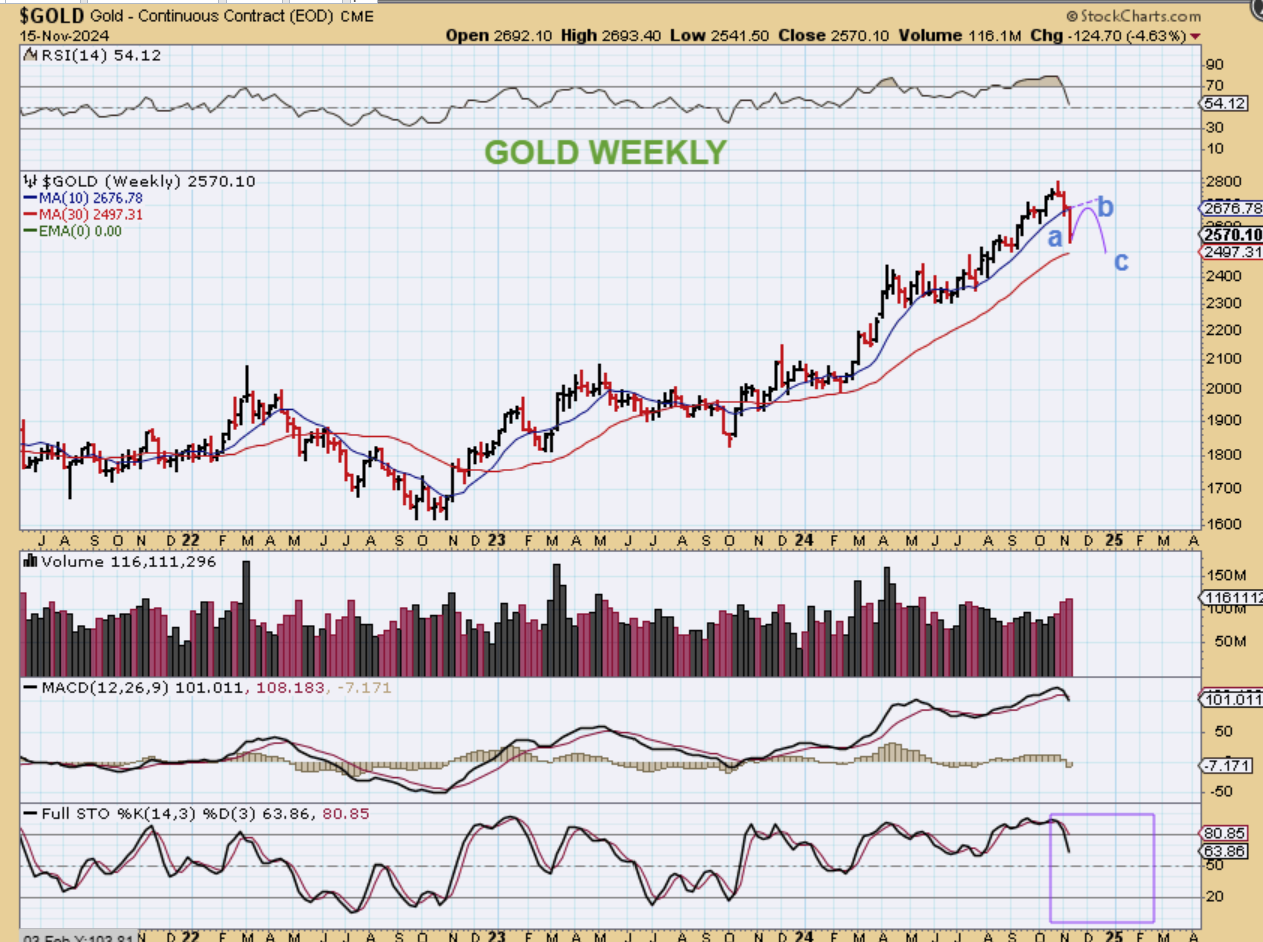
GOLD WEEKLY – An ICL often forms from an a-b-c type of a drop, so 1 more daily cycle could look something like this.
.
So If the USD may be starting to ‘peak’, then GOLD could be bottoming in this area too, right? The question is: ‘Will it bounce in a final daily cycle and then make a slightly lower low?’
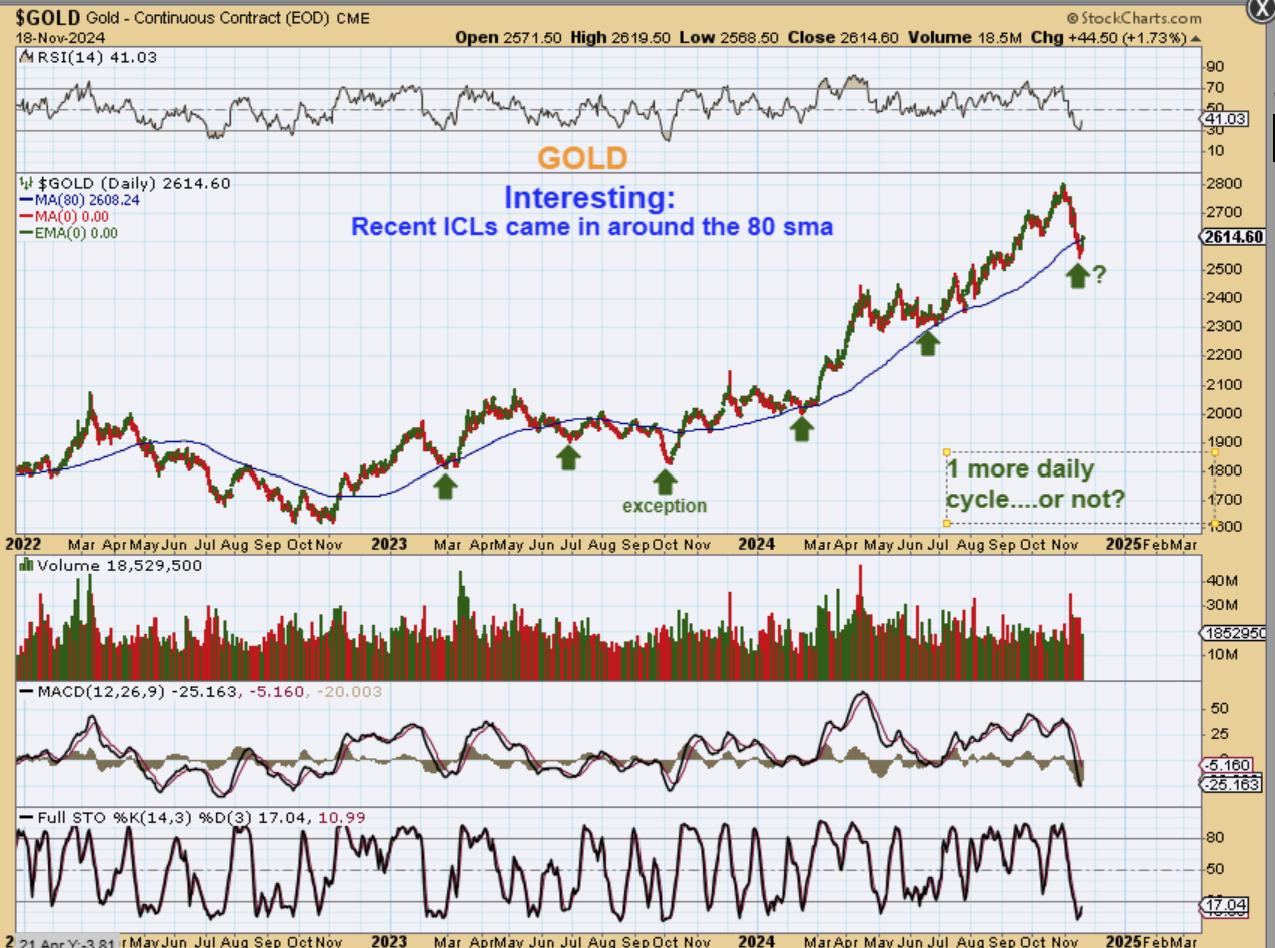
That is one possibility, and it should because our last daily cycle is still R.T., but Gold has already reached an area where prior ICLs did form too. That said…I would say that we are close to the AREA where the ICL could form. We may bounce and make a new low-or- we may be at the low. So the one major problem with an ICL forming now is that Gold is still a R.T. daily cycle. THAT seems to eliminate this as a possibility of an ICL being in place right now.
.
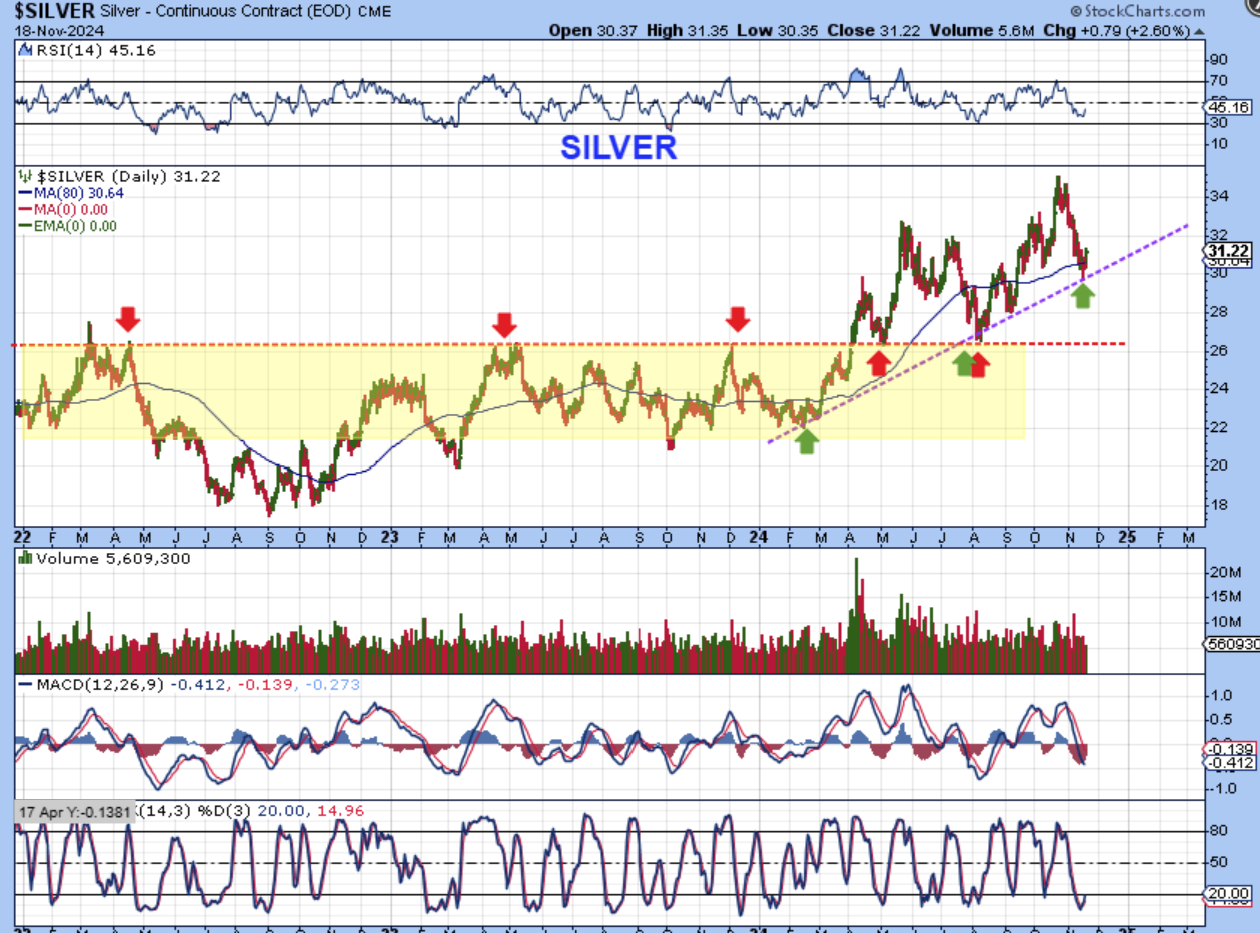
SILVER reversed at the lower uptrend line after that steep drop. This also doesn’t seem to be an ICL, because Silver only had 3 shorter daily cycles out of the last ICL (the last bounce on this uptrend line).
.
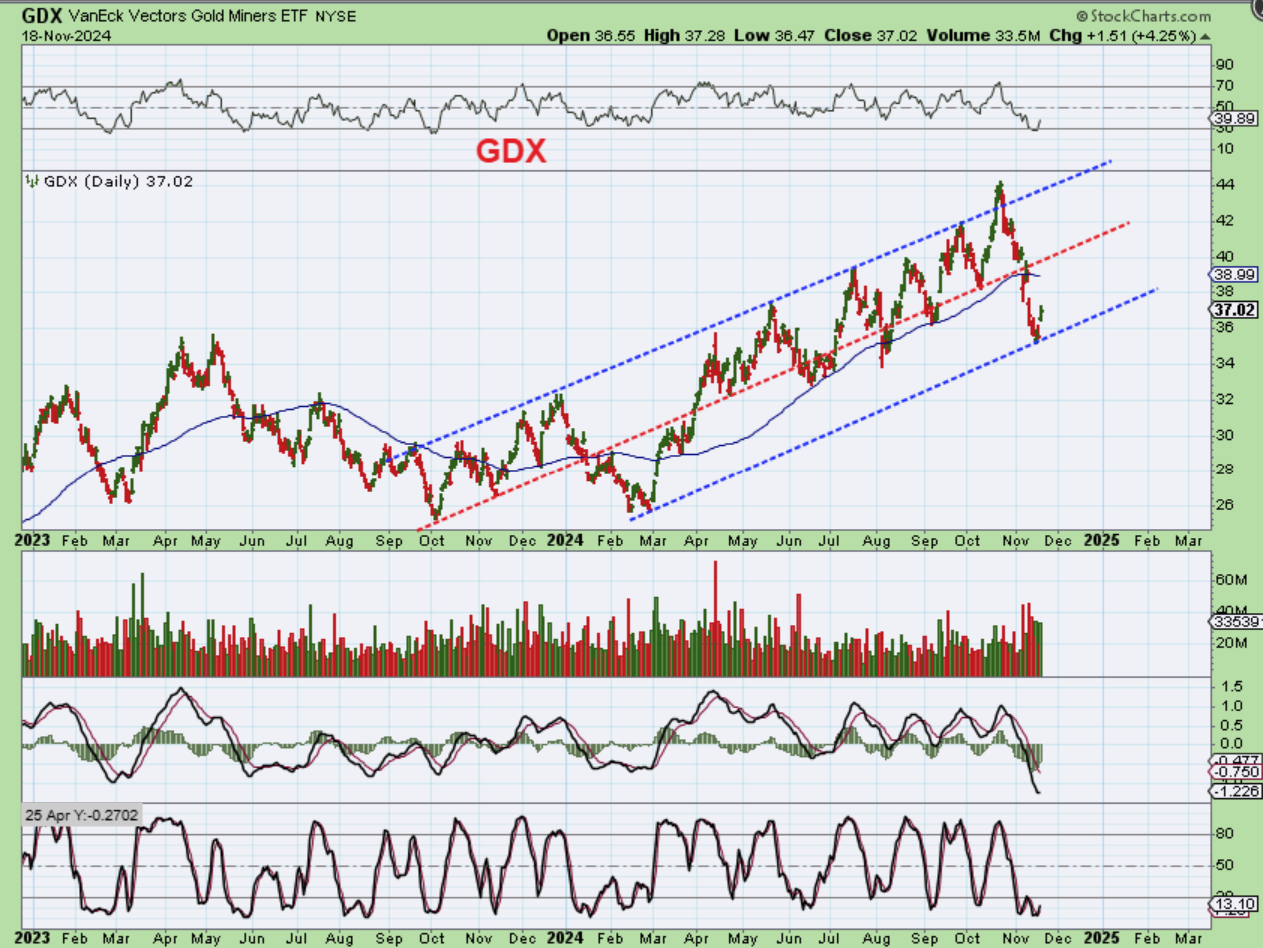
Next we look at The GDX and see that it reversed after a steep sell off too. Notice this…
.
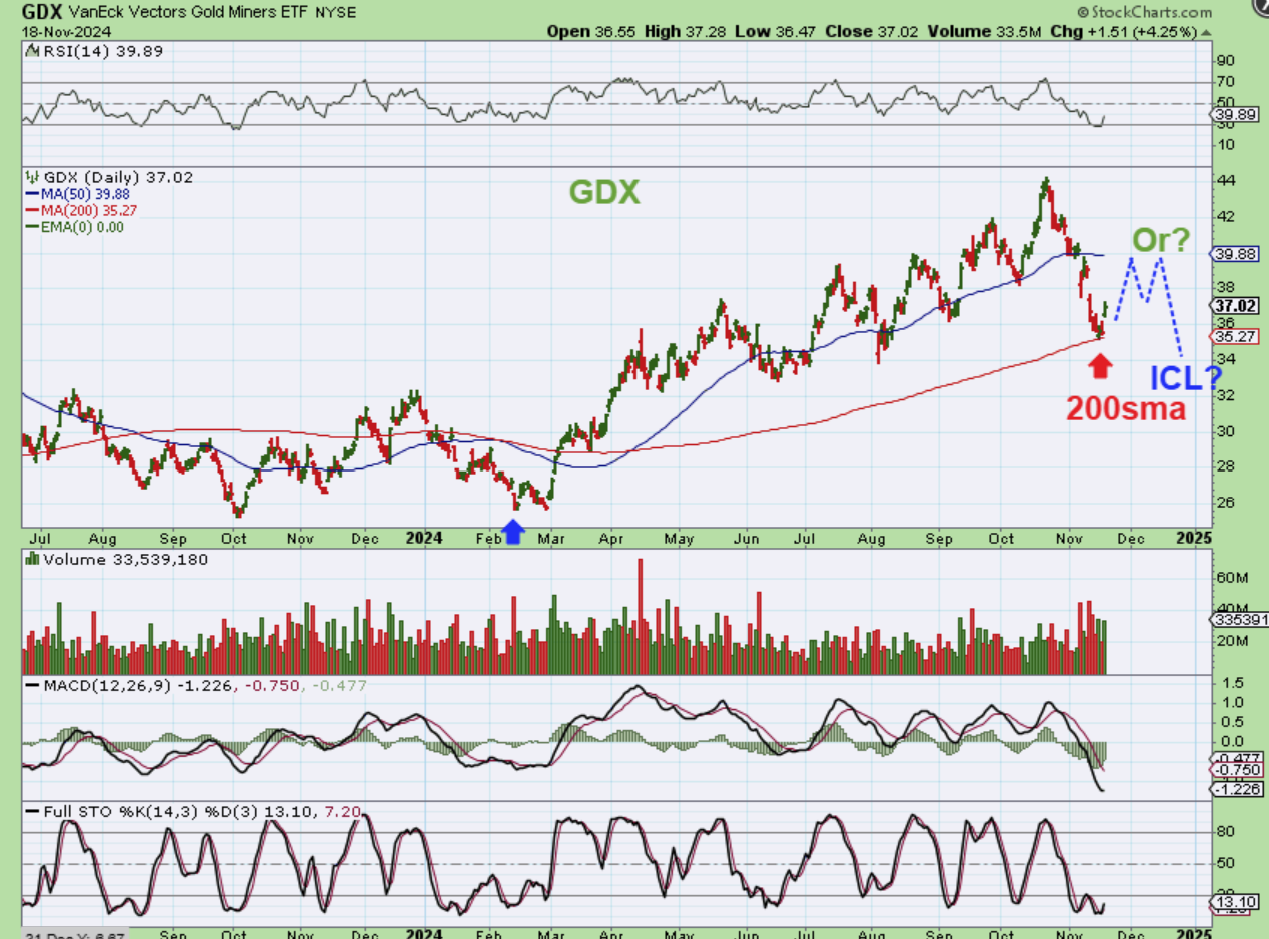
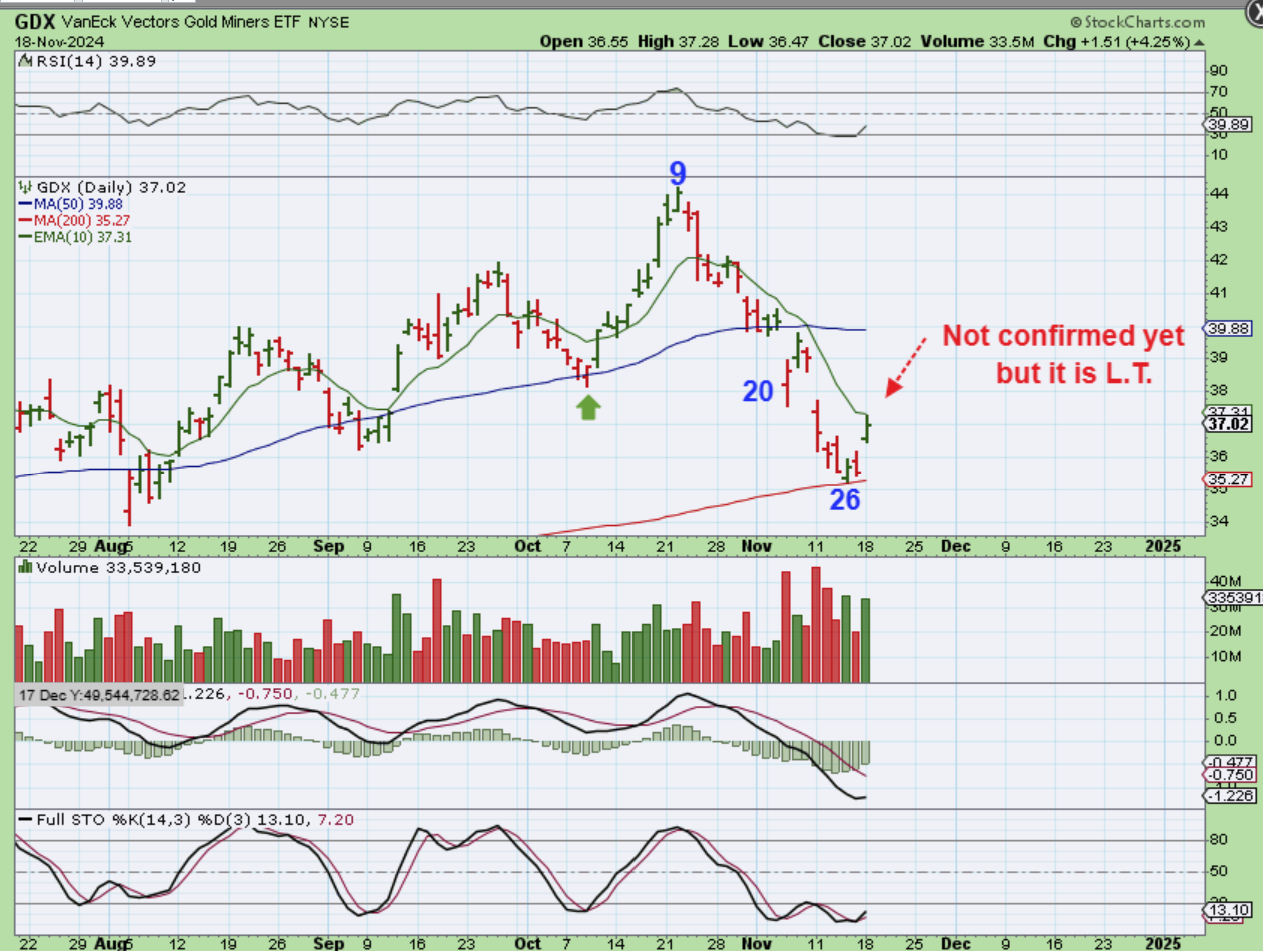
THE GDX dropped to the 200sma and bounced. That was such a steep drop, that it looks like an ICL, but if Gold and Silver put in another daily cycle, then I would expect that the Miners will wait for their lows to come in too.
.
THE GDX: This is a L.T. daily cycle, but it was also being viewed as a 3rd daily cycle. We’ll just have to see how this plays out, but I would imagine a bounce to the 50sma, some chop, and one final drop would be possible for an a-b-c style drop into an ICL.
.
Traders can take advantage of the recent lows, and often buying a reversal at support is what I do, but they are NOT confirmed swing lows yet in the precious metals, so that needed to be said. Also Gold has a R.T. Daily cycle again. That makes me think that we need one weaker daily cycle. Oil stocks have looked bullish and now Oil might have put in a higher low at day 48. Oil DID close just barely above the 10sma too. The General Markets are acting fine, with the exception of the SOXX. I do like how NVDA, GOOG, AMZN, AAPL, NFLX, etc are acting, so if you bought a stock buy & hold, you can raise stops and simply keep the SOXX in the back of your mind. Bitcoin is at the highs and will be discussed below. Enjoy your Tuesday trading!
.
~ALEX
.
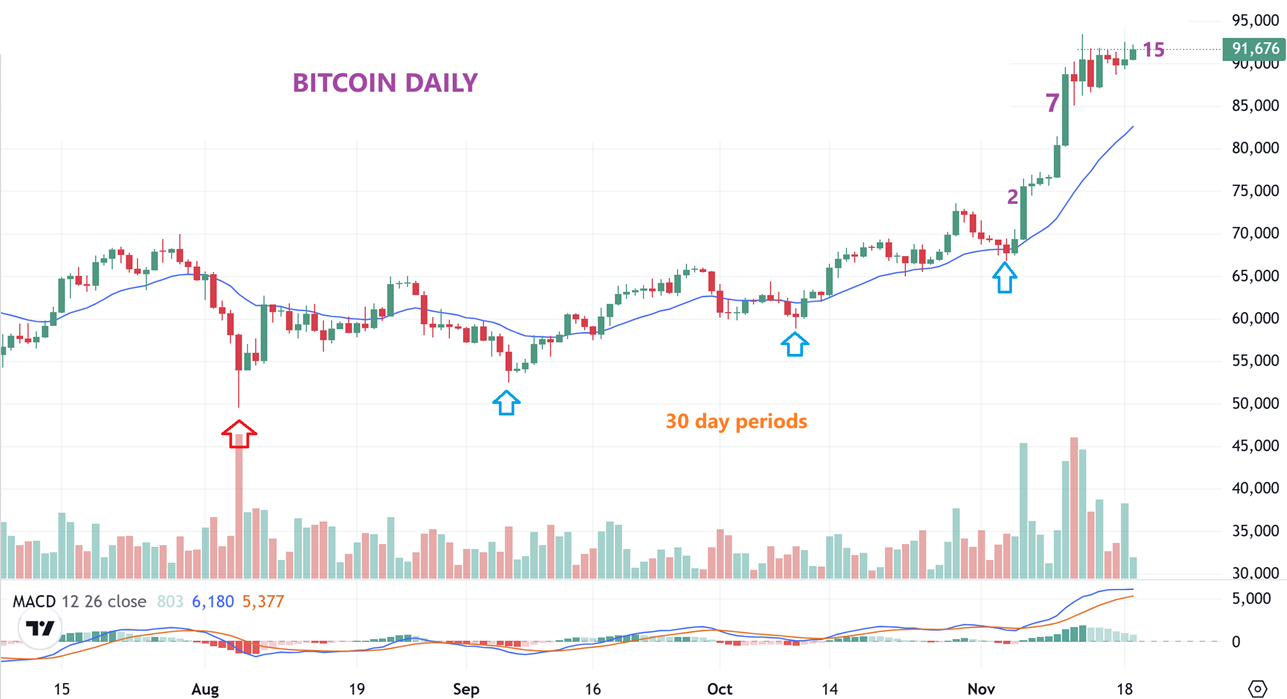
BITCOIN I have simply turned to a 30 day count for Bitcoin after that sharp capitulation low. We are now 15 days forward from the last low, so Bitcoin can climb higher, even if it were to pull back for a couple of days first. Right now it looks to be churning sideways and could continue to do that until it reaches the 20 ema too. It also looks like a bullish triangle, pennant, or flat top wedge. Bitcoin looks bullish. As you can see, Bitcoin did a pop and drop yesterday (that last candle is todays/ this morning).
.
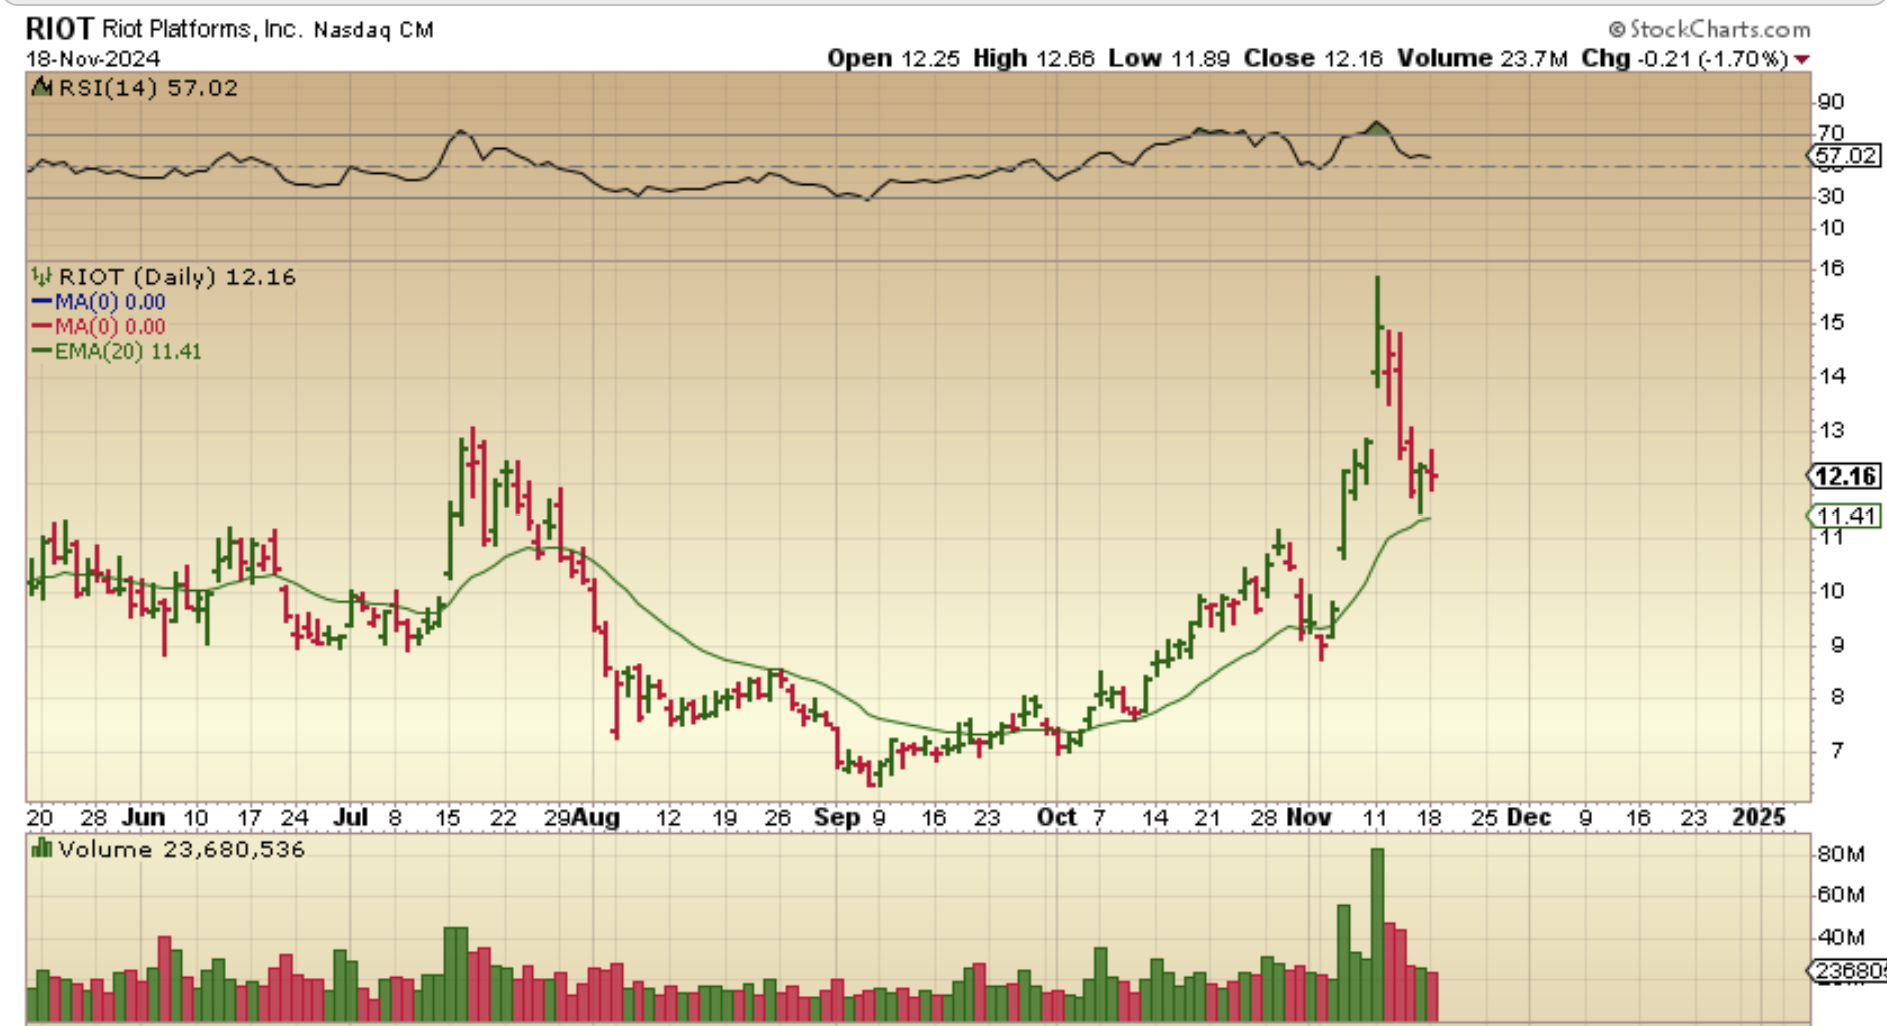
I pointed out several of the Crypto stocks in the weekend report as sitting right at the 20 ema. Many of them also did a pop and drop or a doji, similar to Bitcoin yesterday. Note: MARA sold off 14% when they announced a public offering and will likely need time to recover. BKKT was rumored to be a buyout candidate and shot up 162% very quickly. The rest look fairly uneventful.