Friday November 15th
,
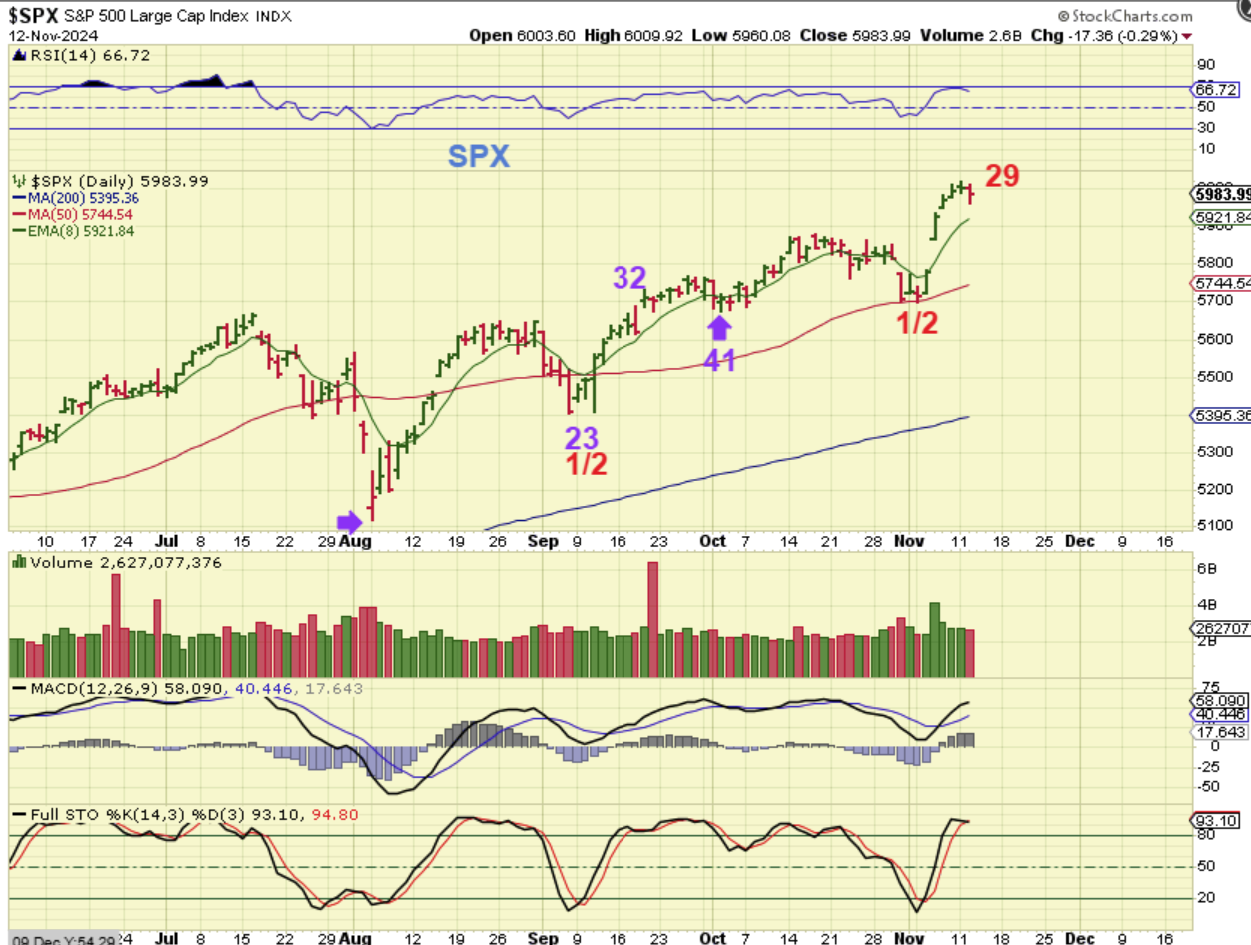
THIS WAS THE CHART FROM WEDNESDAYS REPORT – Just to show you cycle counts. We were on day 29 and I said , “This can keep rising up, but I’m just a little worried that the SOXX may weaken things if it doesn’t start running higher.”
.
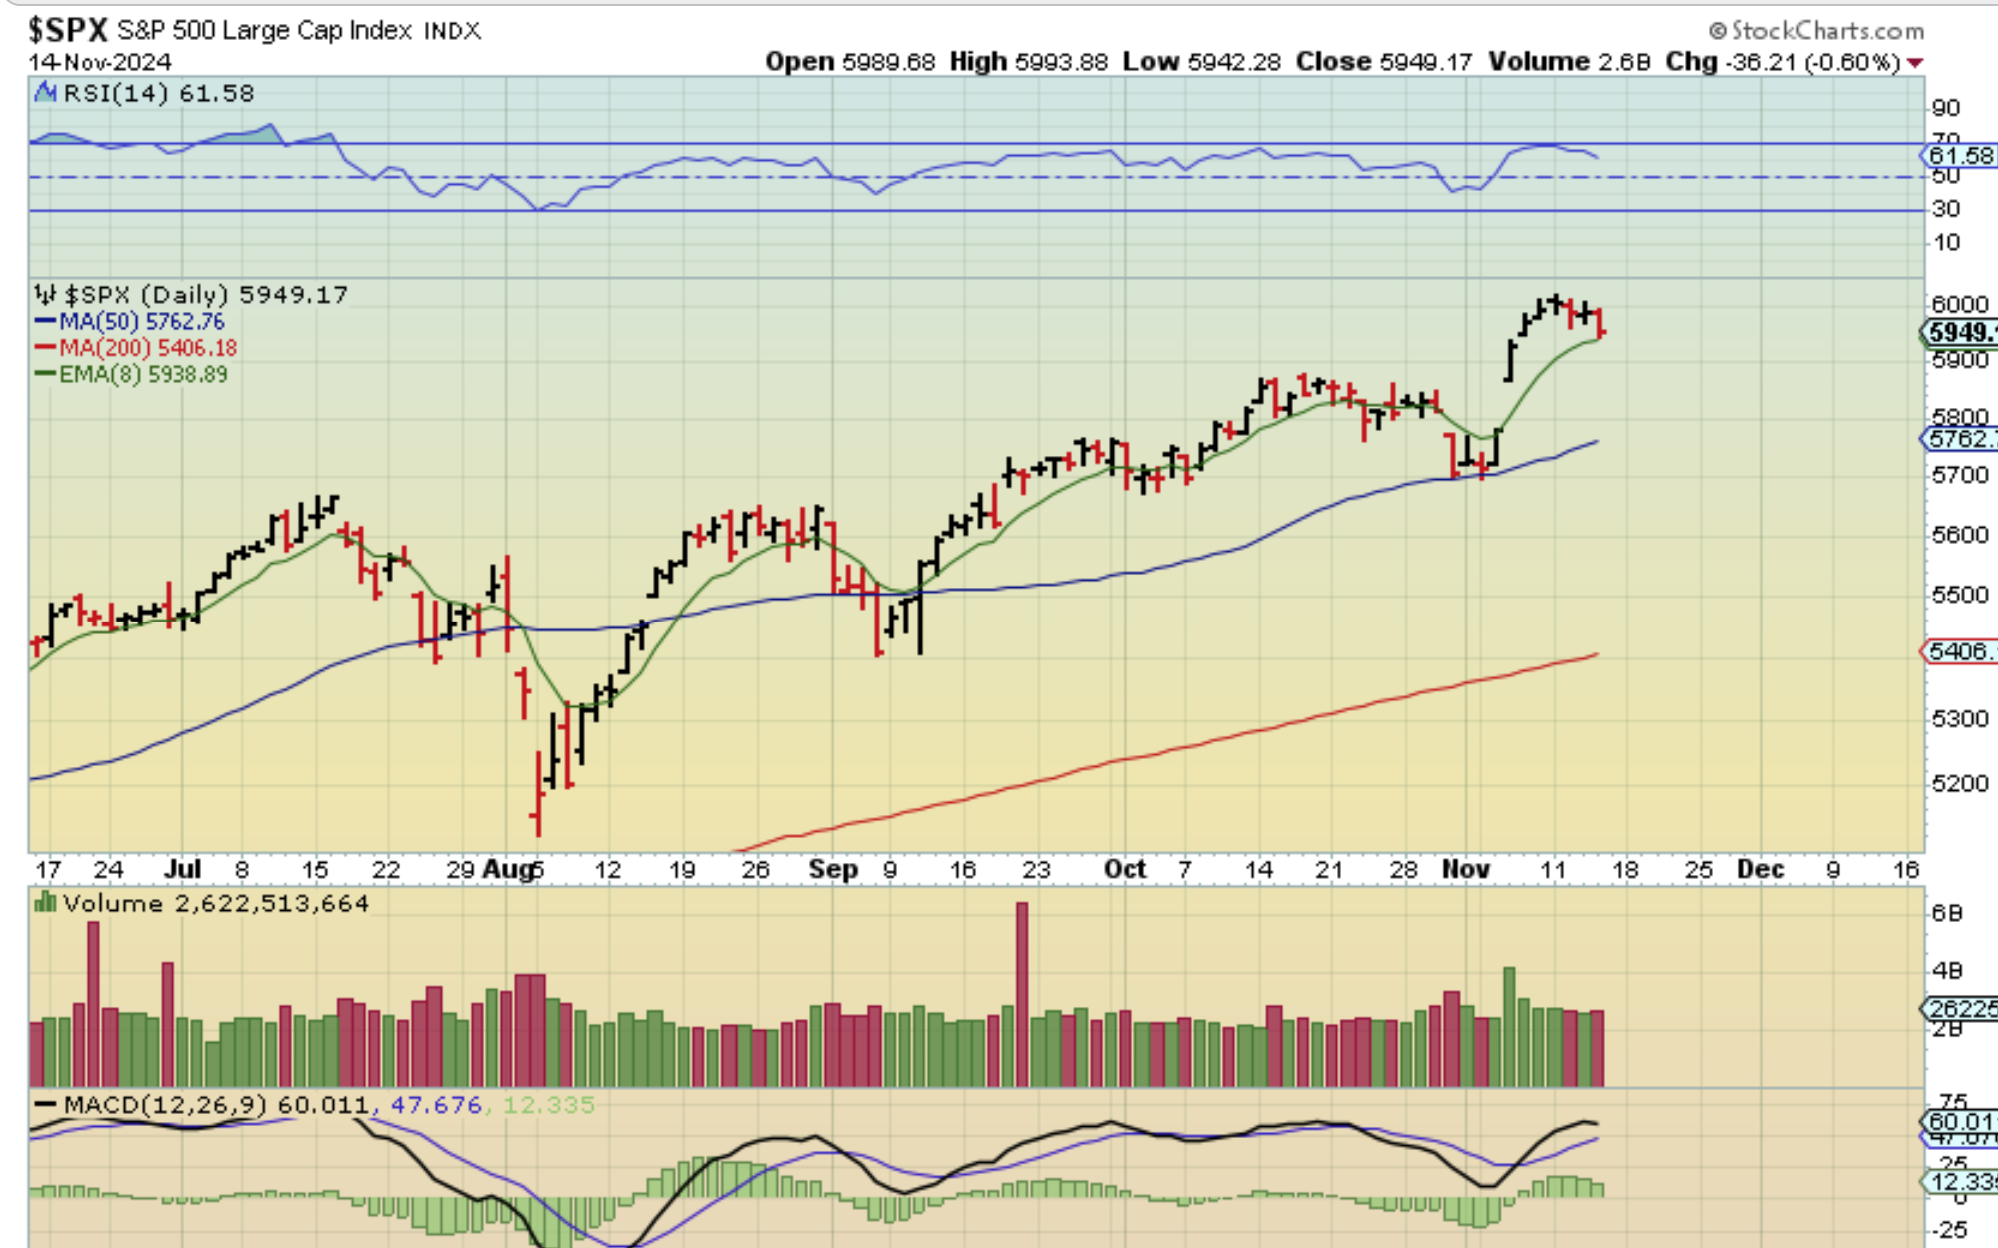
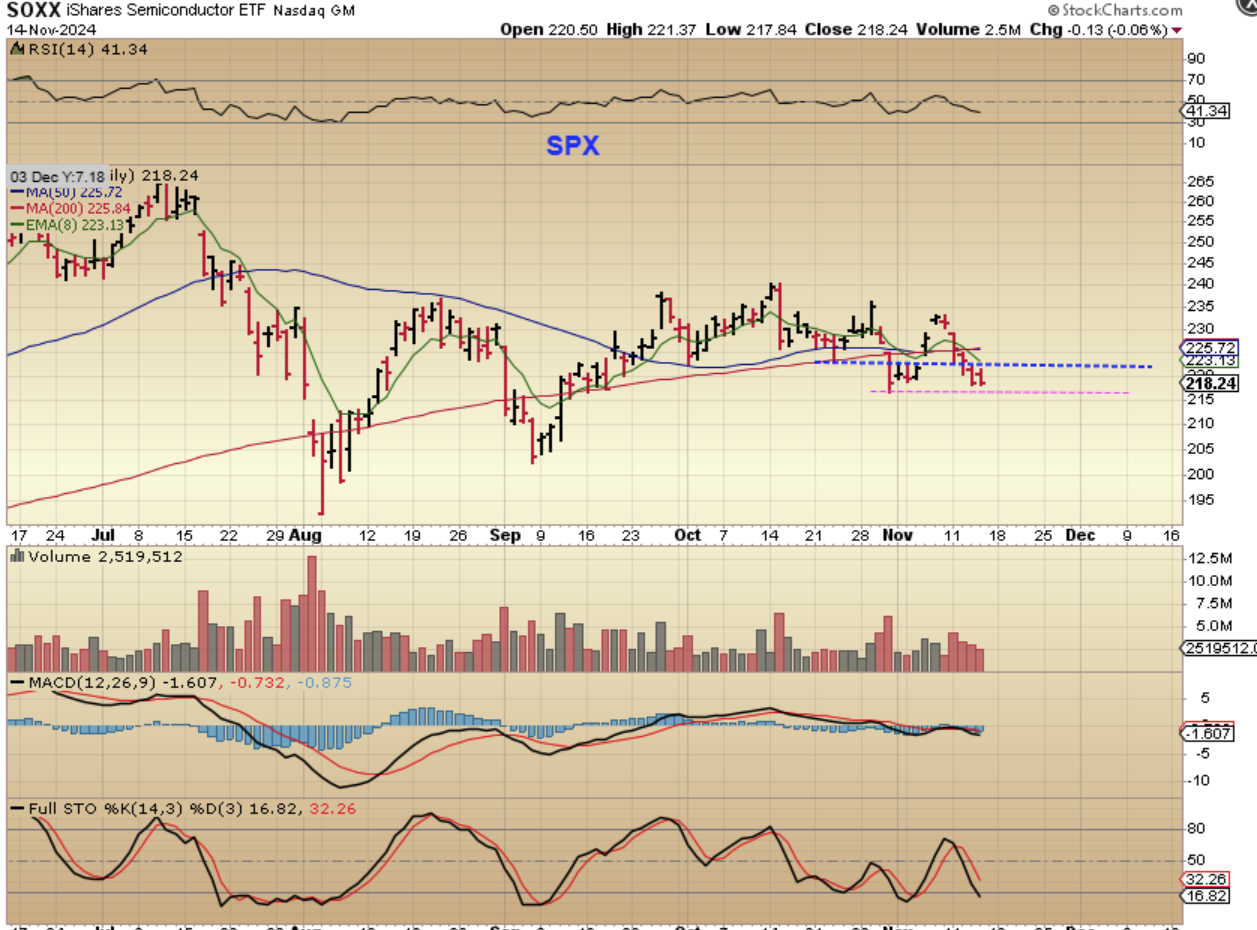
SPX – So now we’re on day 31 and price is at the 8 ema. It can go higher or start to soften and dip towards a dcl low. What about that SOXX though?
,
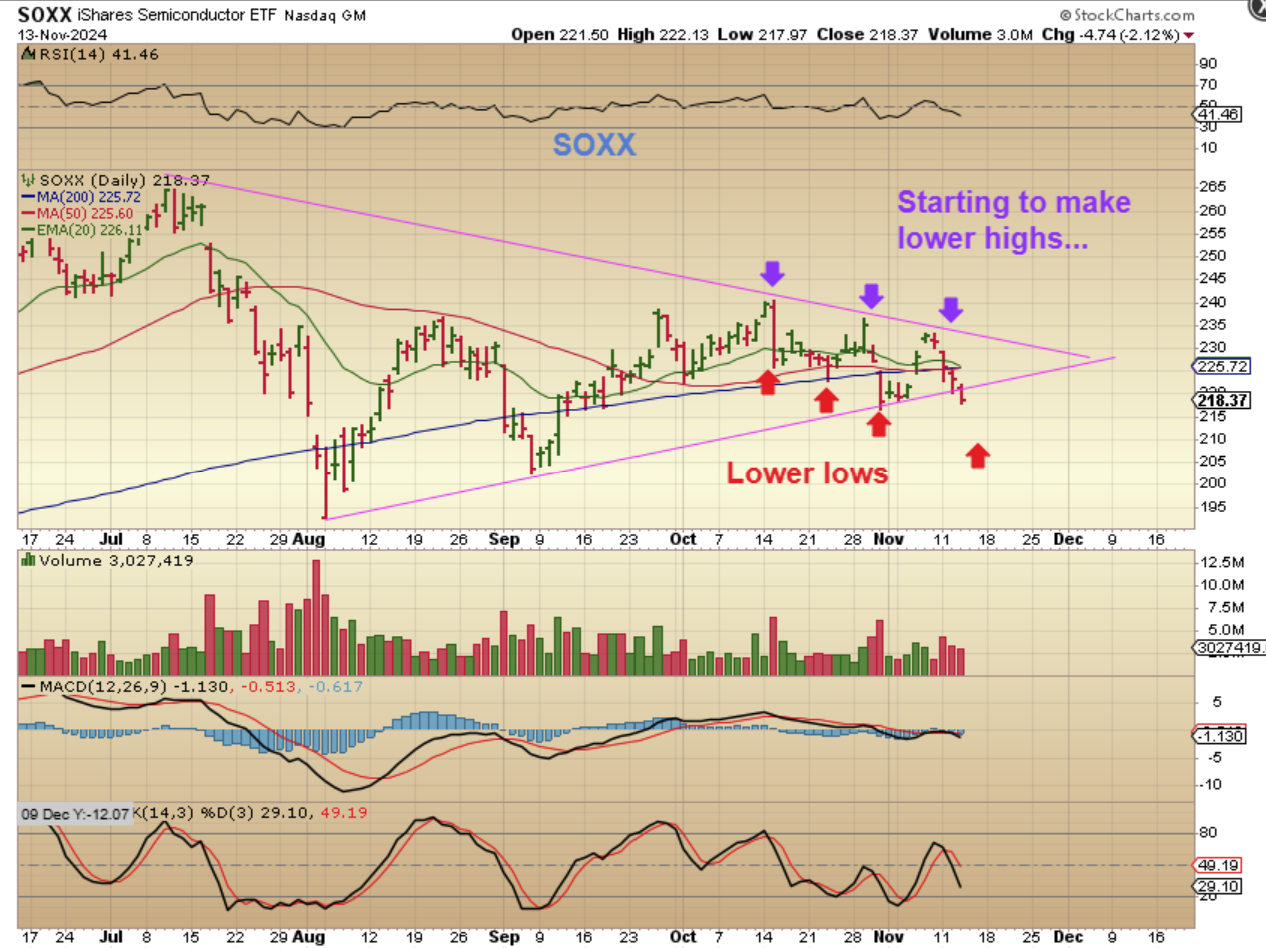
ON WEDNESDAY I SAID: “THE SOXX broke down and is threatening the lows again. That was after the CPI report, Thursday is PPI & Jobless Claims. The SOXX is known to lead the markets, so we’ll see what happens here.”
.
THE SOXX (not SPX) didn’t break the lows, but it is so close that any downside selling could really start a sell off. This does not have any support or strength, so it does look like the Semiconductor sector is going to break down and lead the markets lower. What will happen during the 3rd and 4th daily cycle? This does not look good for the markets.
,
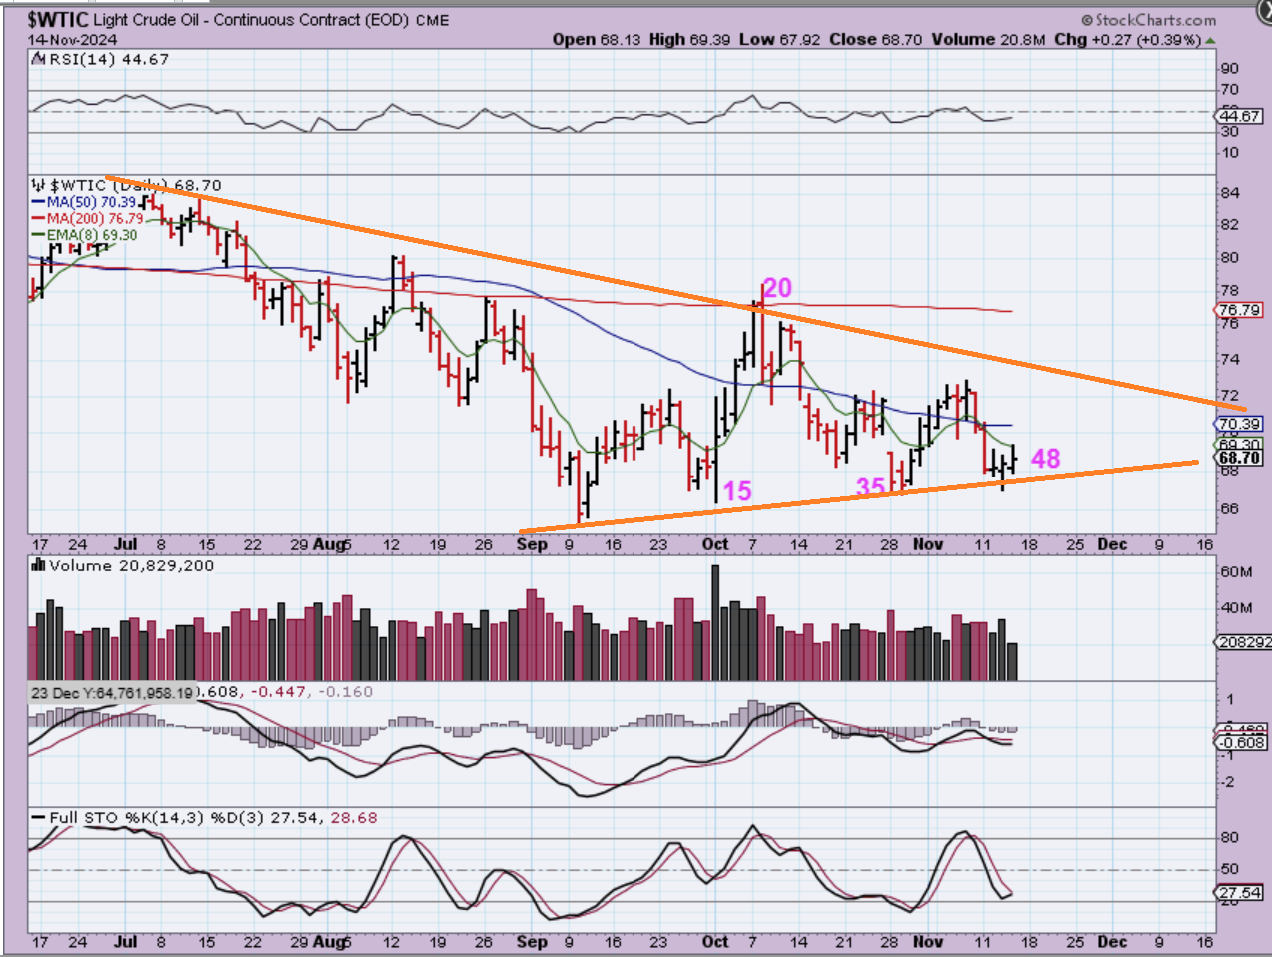
WTIC – This swing low MIGHT be a dcl, since the timing is right, but it is L.T. and I would have expected one more dip lower to give us a new low right under the September lows. The only time I’ve seen an ICL followed by a L.T. Daily cycle is when a triangle forms at the lows, and we might have that here. Oil stocks already looked to have bottomed.
,
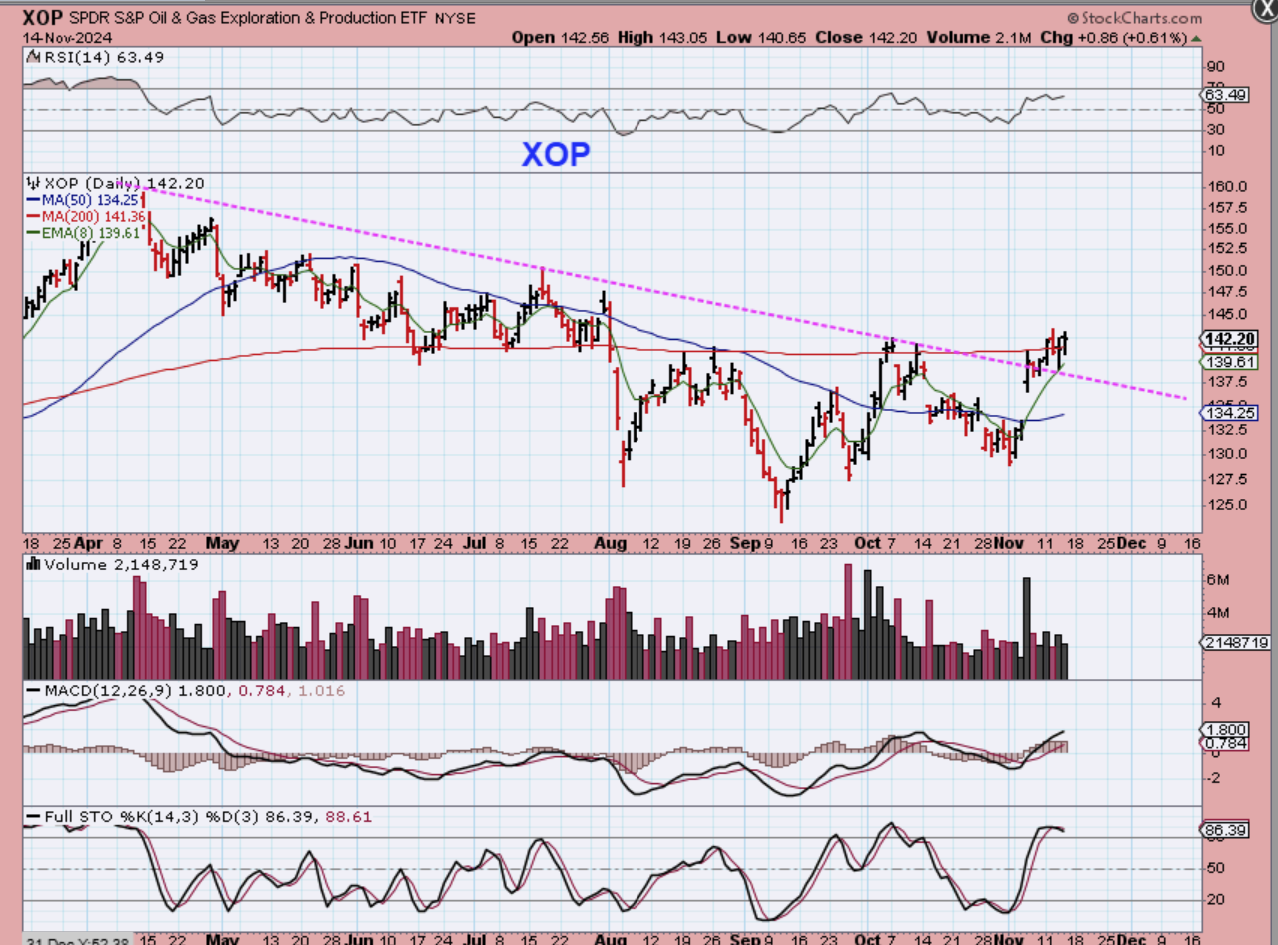
XOP – You can see that OIL stocks do look to have their ICL in place with the Septembers lows, so that is why I think that Oil is just acting weaker but may have an ICL in September too.
,
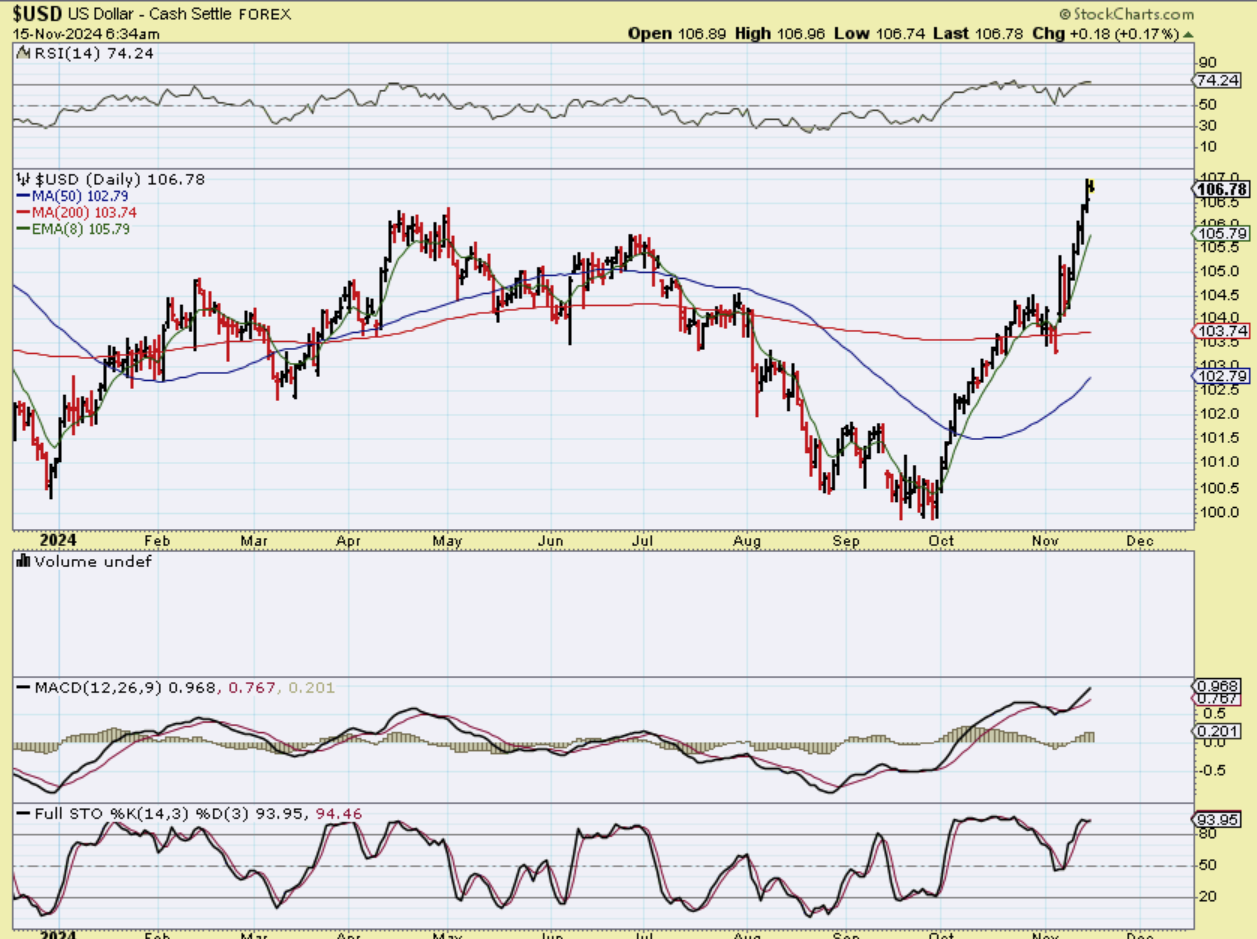
THE USD is on the 2nd daily cycle and has been a rocket out of the ICL. Gold was NOT selling off the same way that the USD was rising with that first daily cycle, but it IS now selling off in the same manner that the USD is rising in that 2nd daily cycle.
,
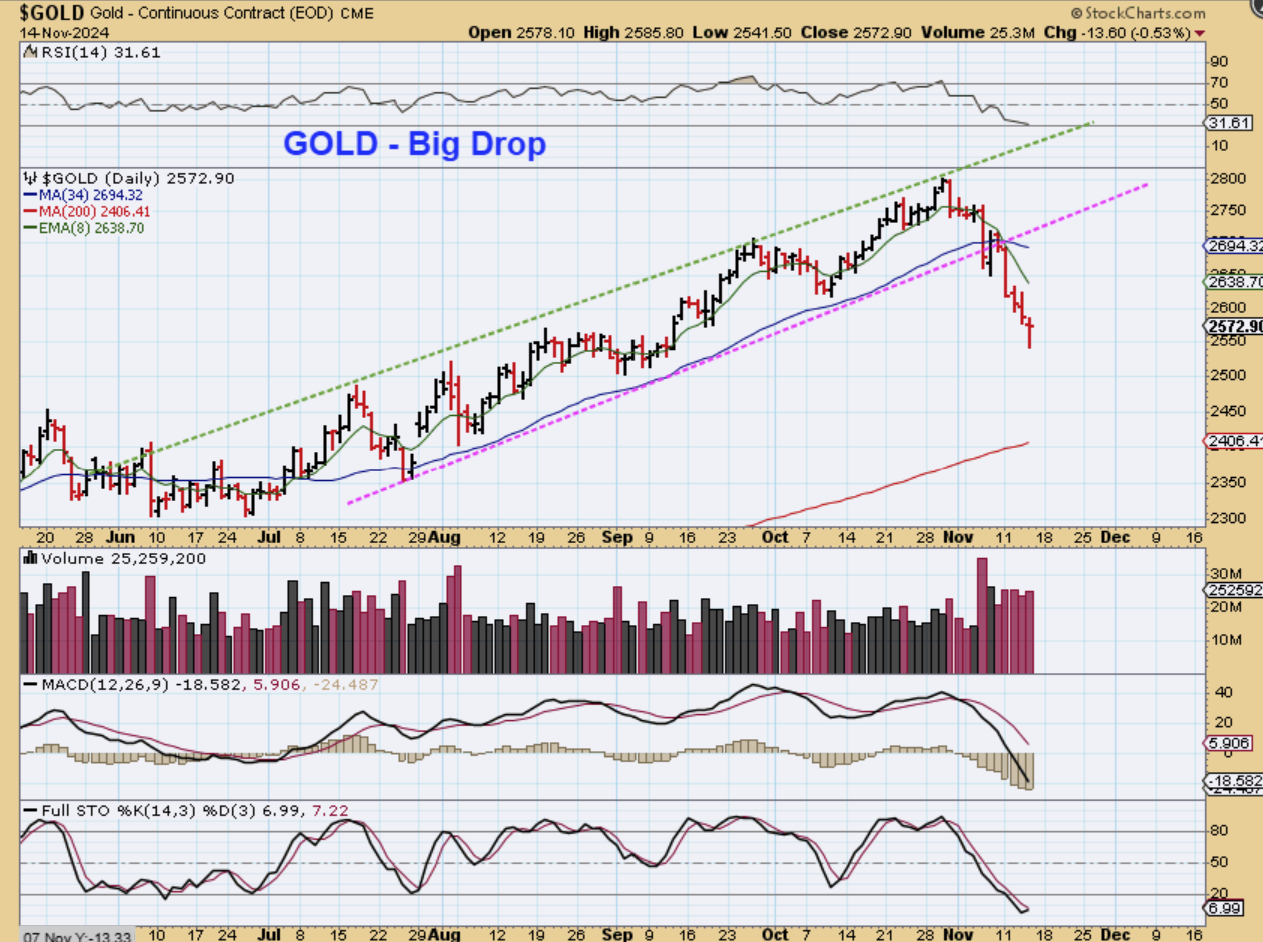
GOLD #1 – You can see that Golds did start to drop sharply. I have been expecting a dip into an ICL and those dips can be steep, so Gold is now dropping into an ICL…
,
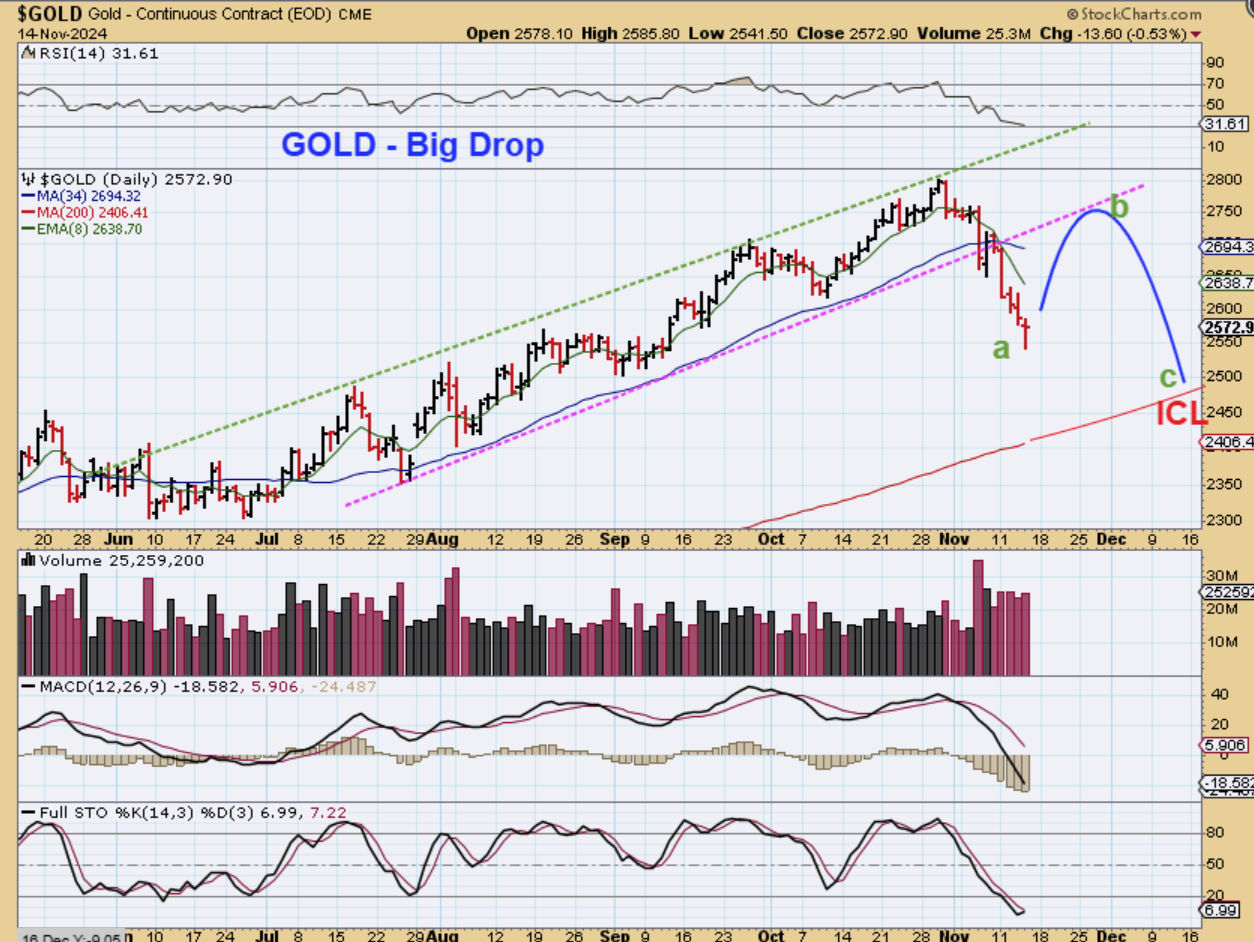
GOLD #2 – It often takes another daily cycle to give us an a-b-c dip into a dcl, so I have drawn that 5th daily cycle here, with a drop to the 200sma. That looks normal, but if the USD peaks and rolls over soon, I also do wonder if this will just turn out to be the ICL for gold in this 4th daily cycle. We’ll see. You could buy the Miners at Golds next low and use a stop or buy this dip , sell after roughly 10 days, and get back in if it just keeps running.
,
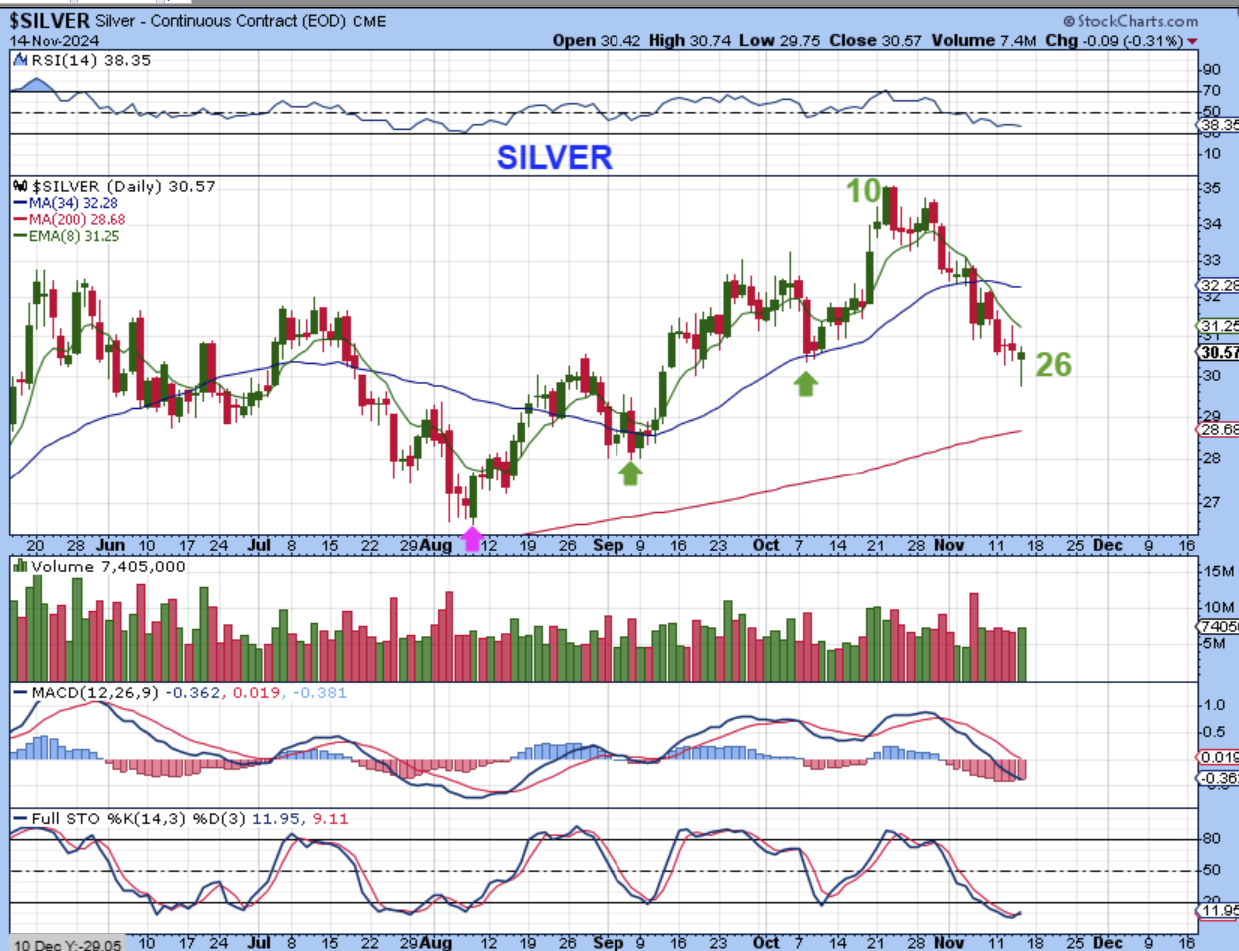
The problem is that SILVER only has 3 daily cycles, so I would think that Gold and Silver finally SYNC UP with Gold having a 5th daily cycle and Silver having a 4th. Here we have a reversal candle on day 26 and many Slver stocks look to be bottoming at support levels, so…
,
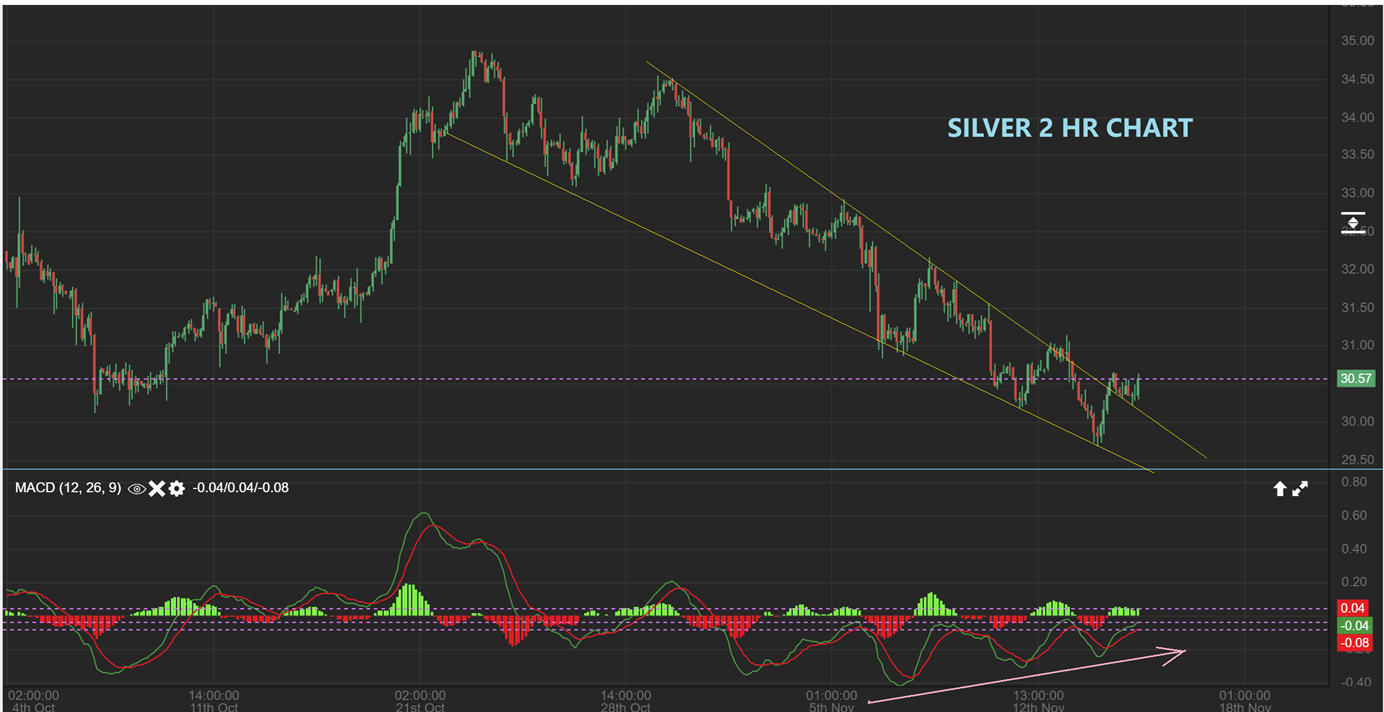
So with that reversal candle in SILVER, I wanted to look at an intraday chart. This is Silver with a 2 hr chart and it does look like it broke a downtrend line overnight. Again, Silver miners started to look good Wednesday and Thursday.
,
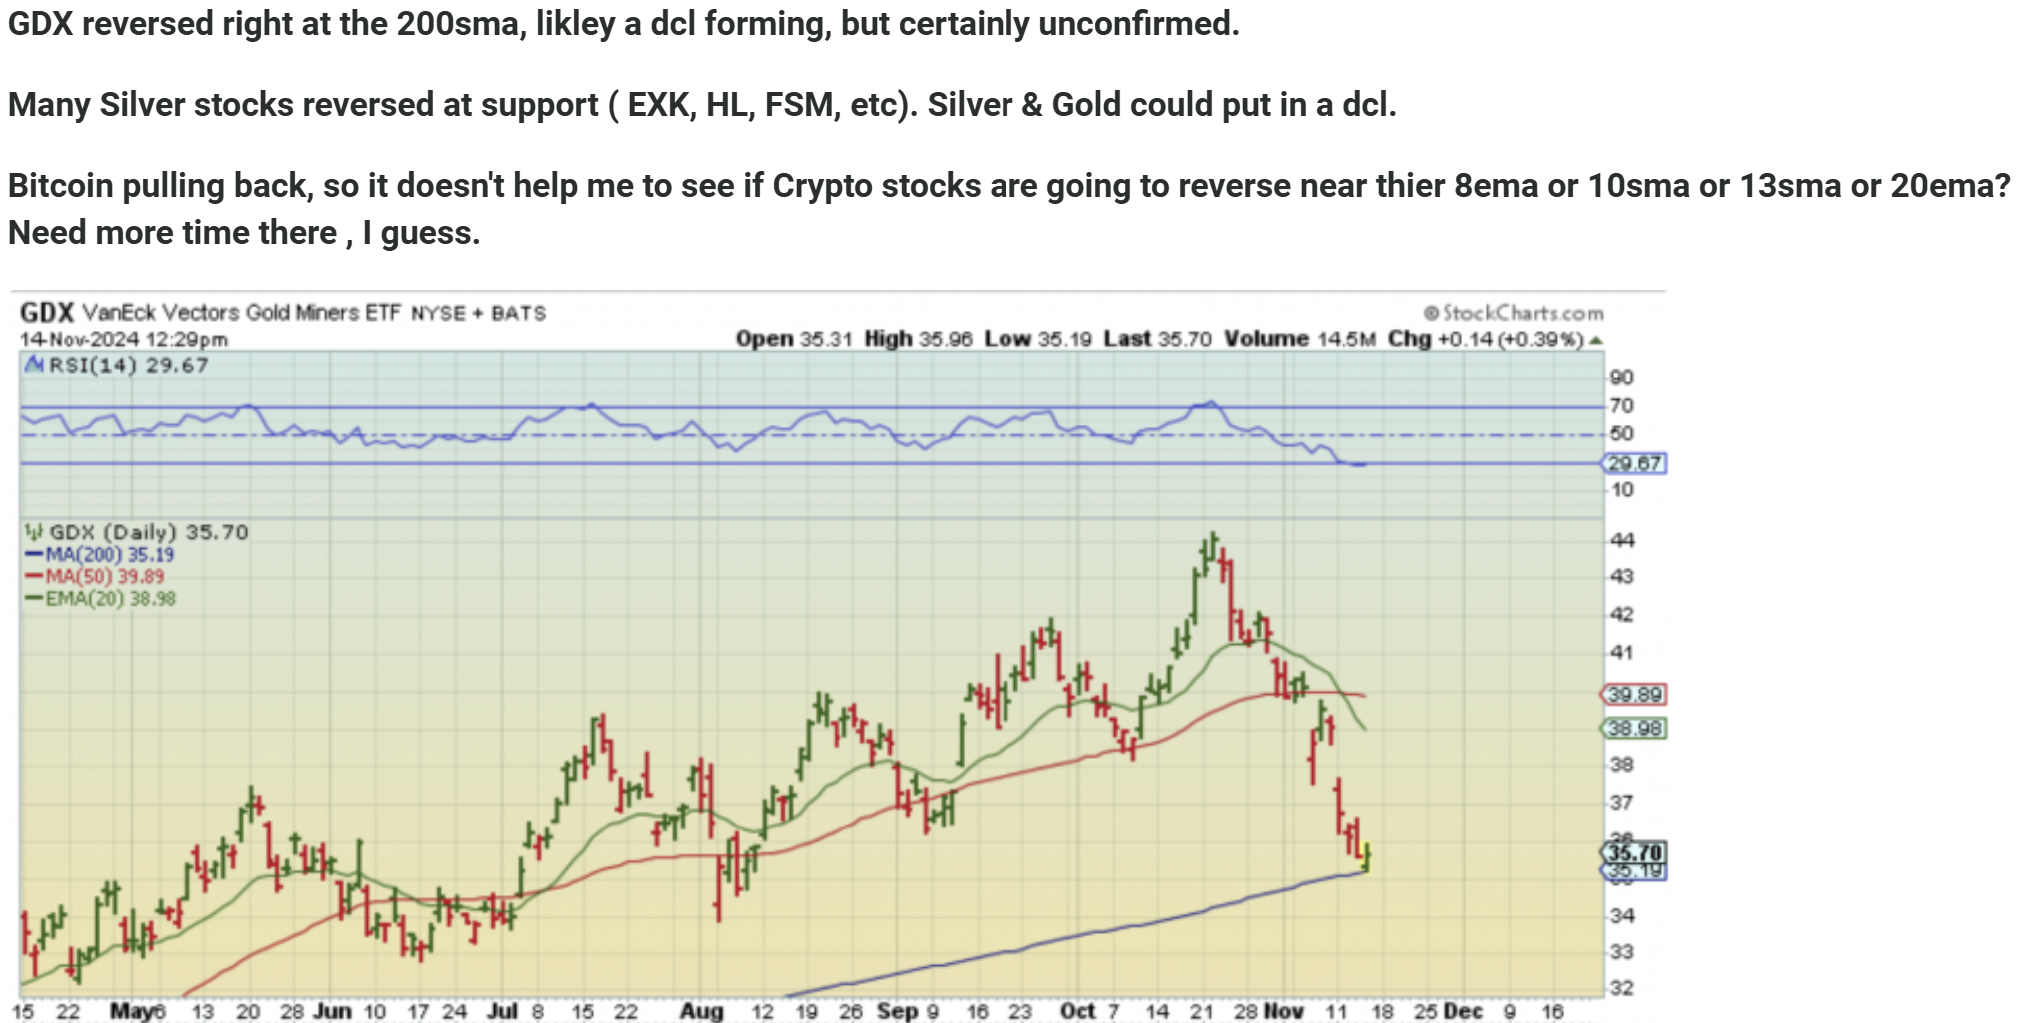
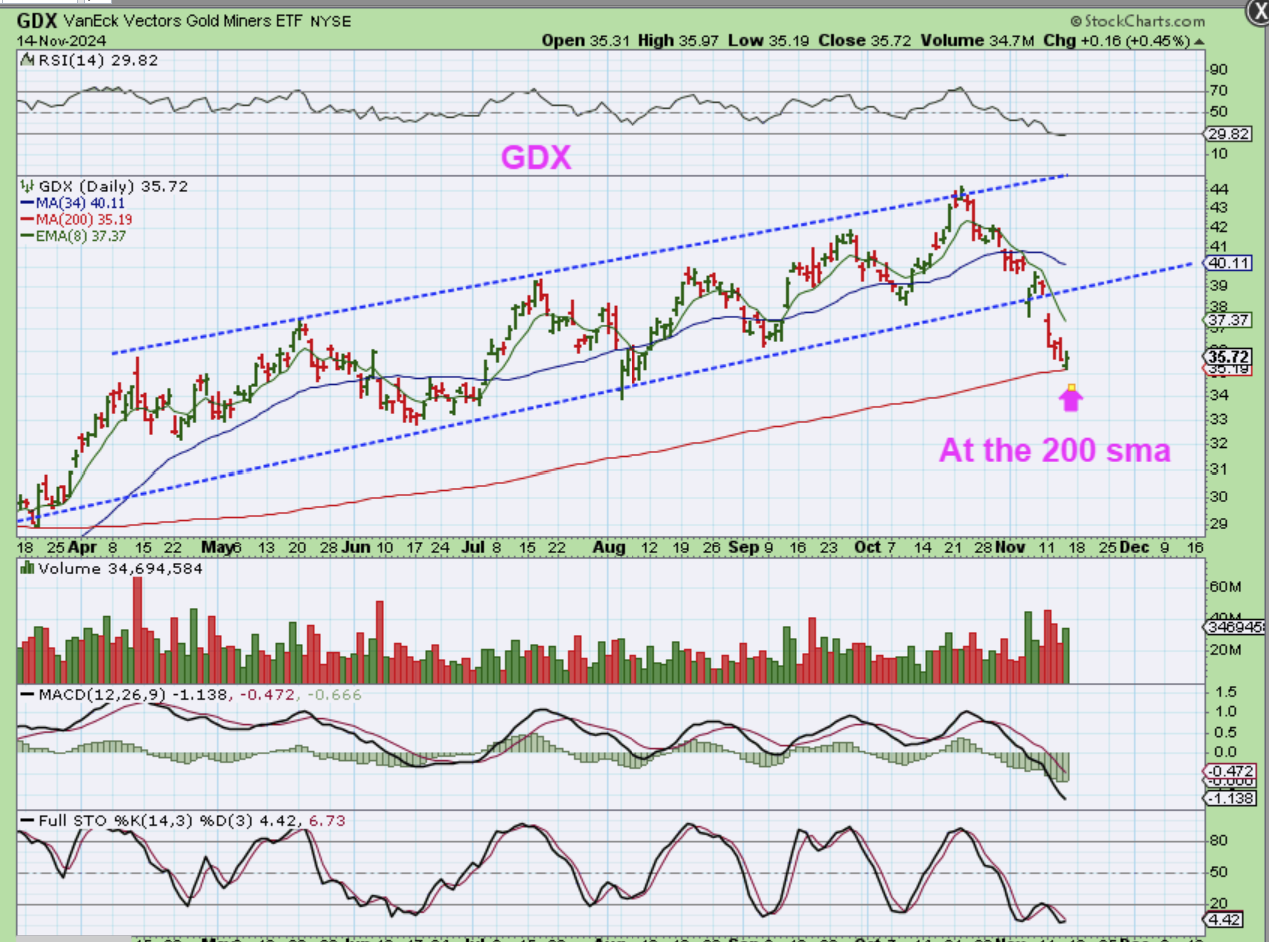
AT NOON YESTERDAY I POSTED THIS IN THE COMMENTING SECTION ABOUT SILVER STOCKS AND THE GDX:
.
.
The GDX closed the day at that support level and we may have a dcl there.
.
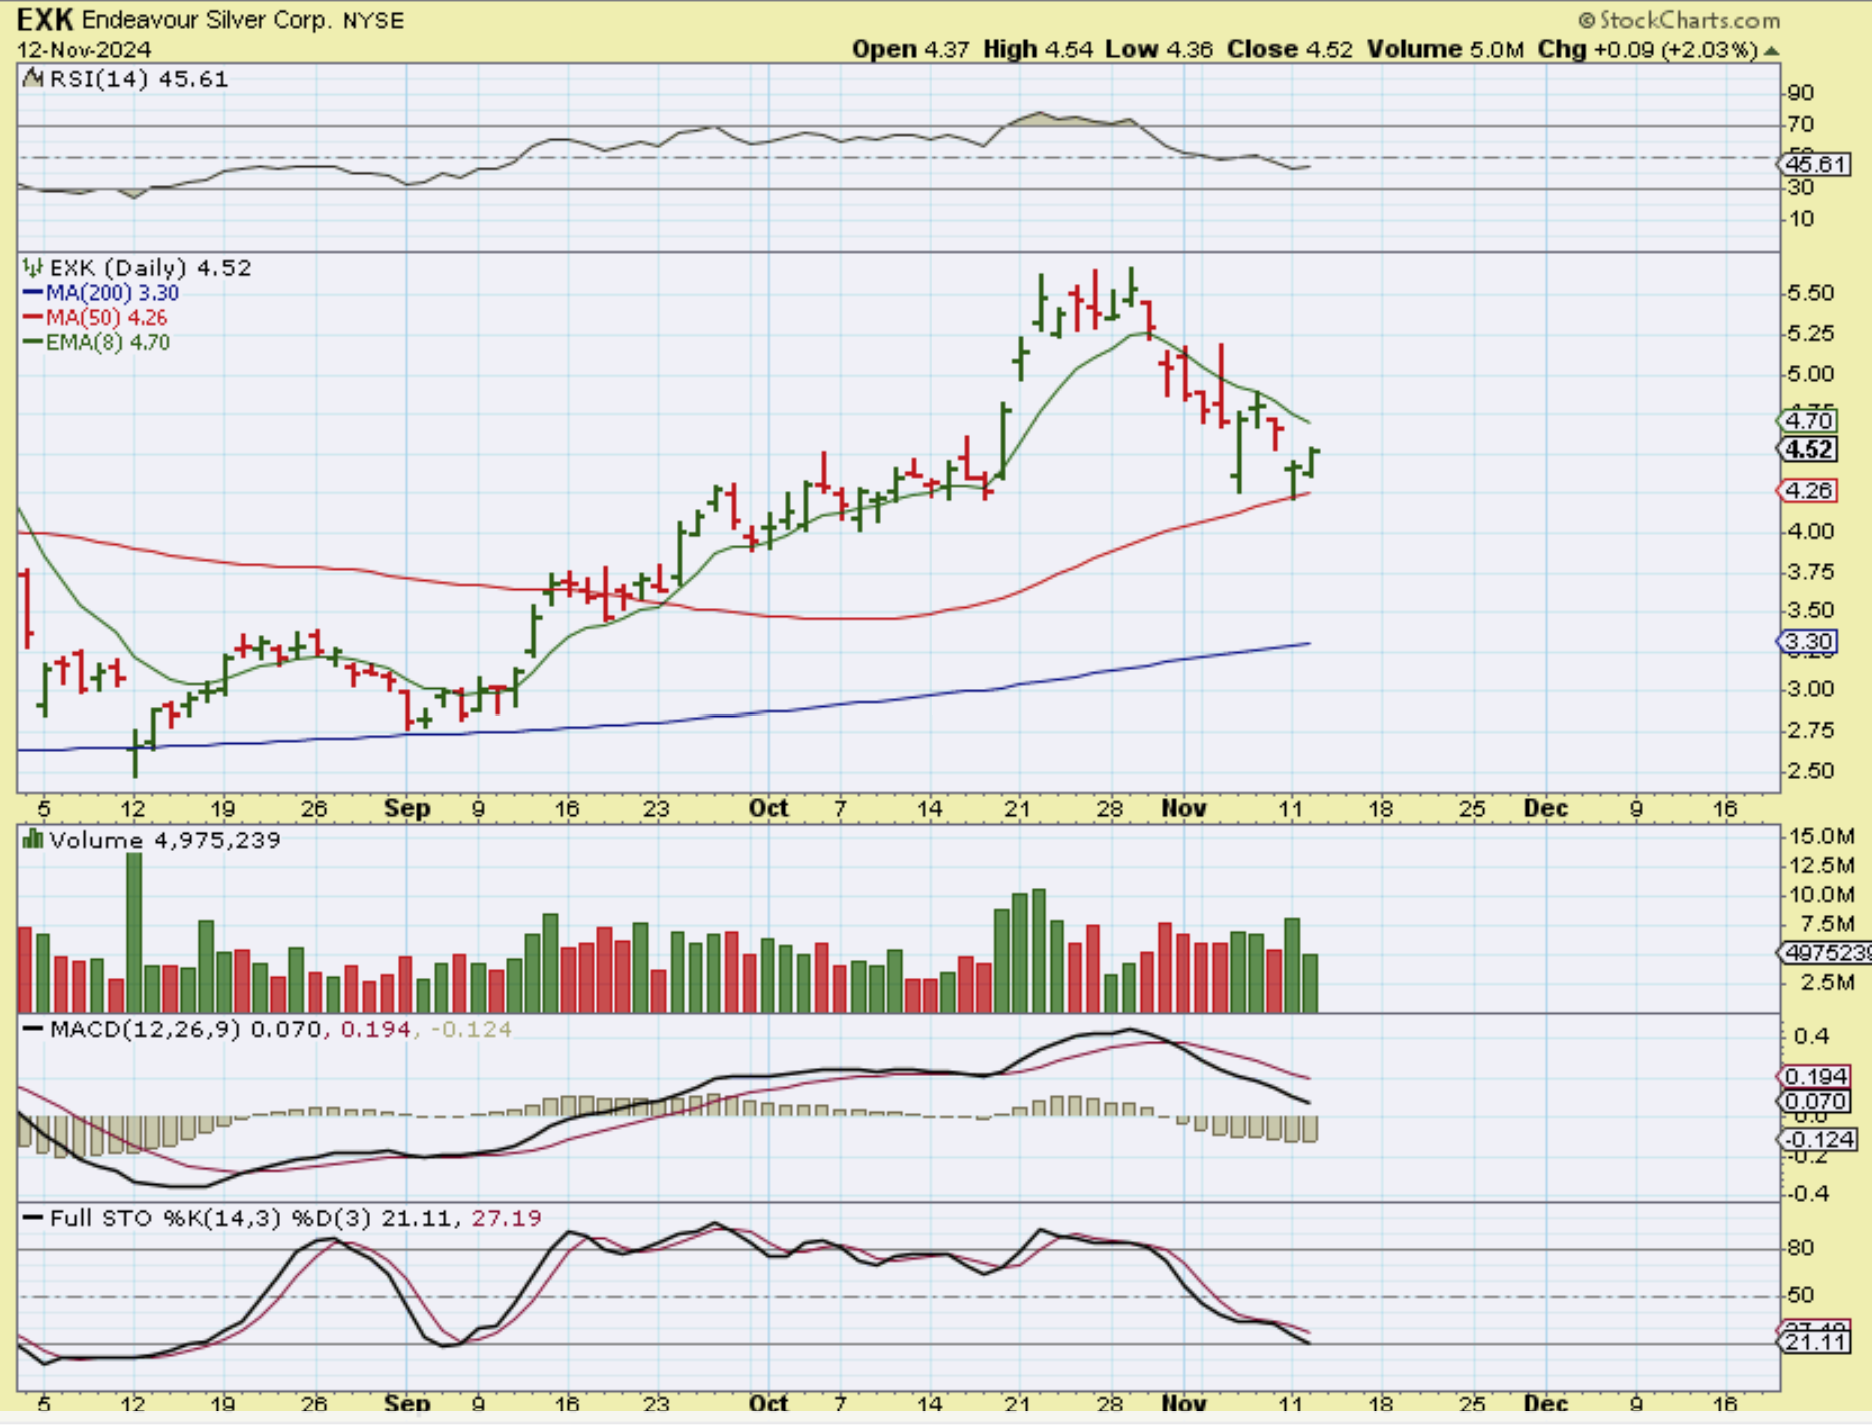
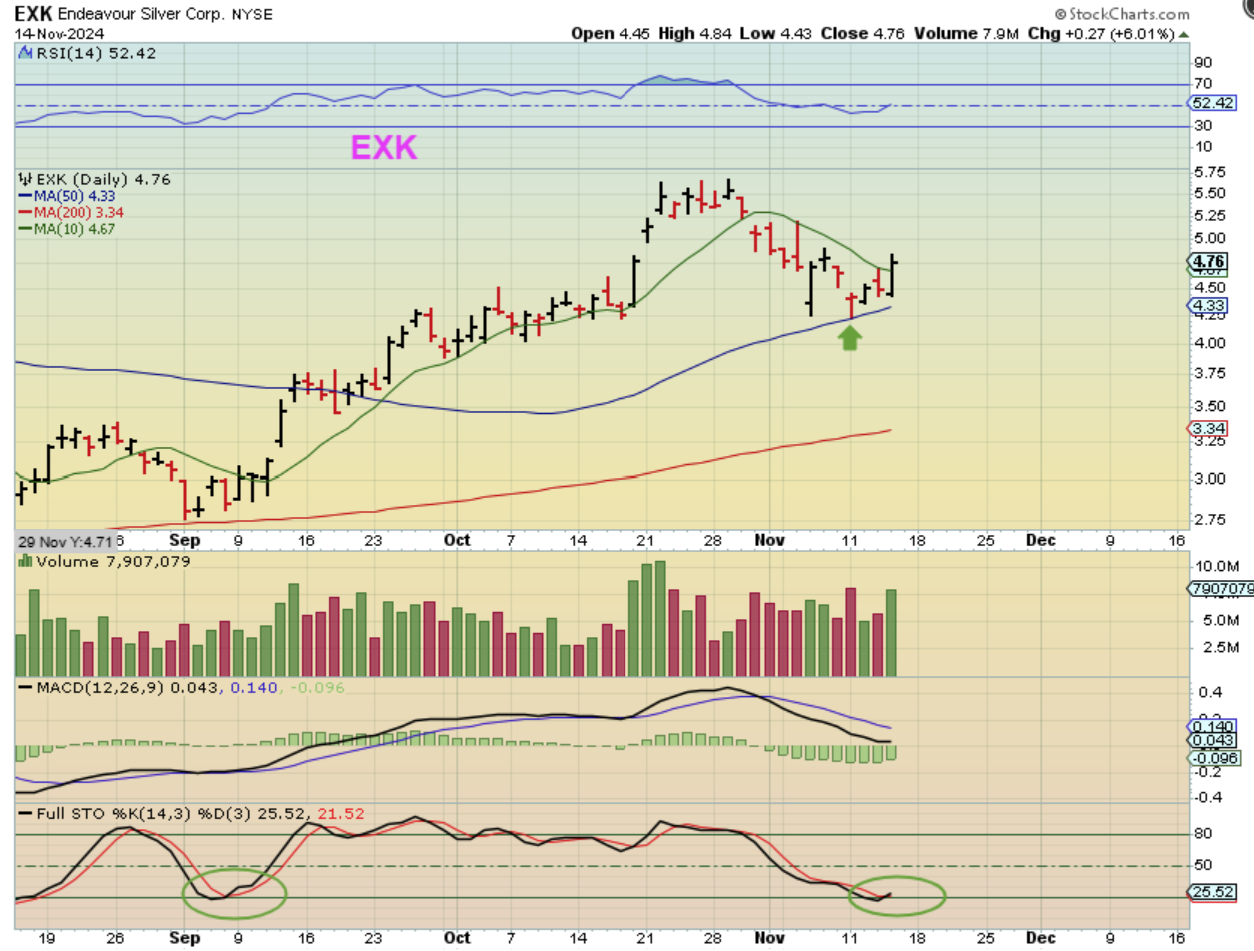
I pointed out the support for EXK on Nov 12th. Did it hold?….
.
EXK did hold and is pushing higher, even though Silver made new lows again. I think that Silver stocks are bullish looking, even if its just for a shorter term trade.
.
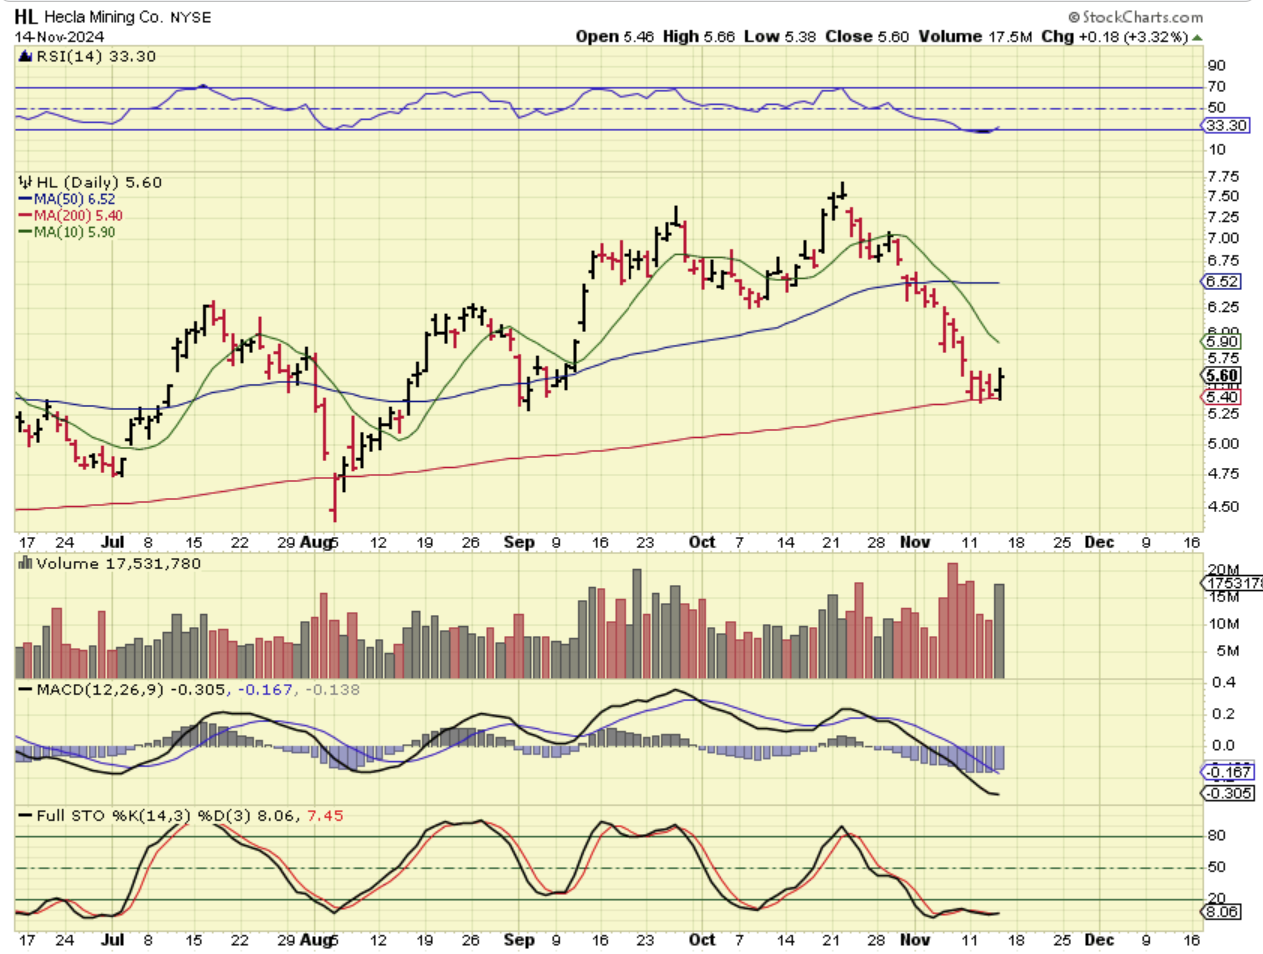
HL also held up at support, even though Silver made new lows again. This is a buy.
.
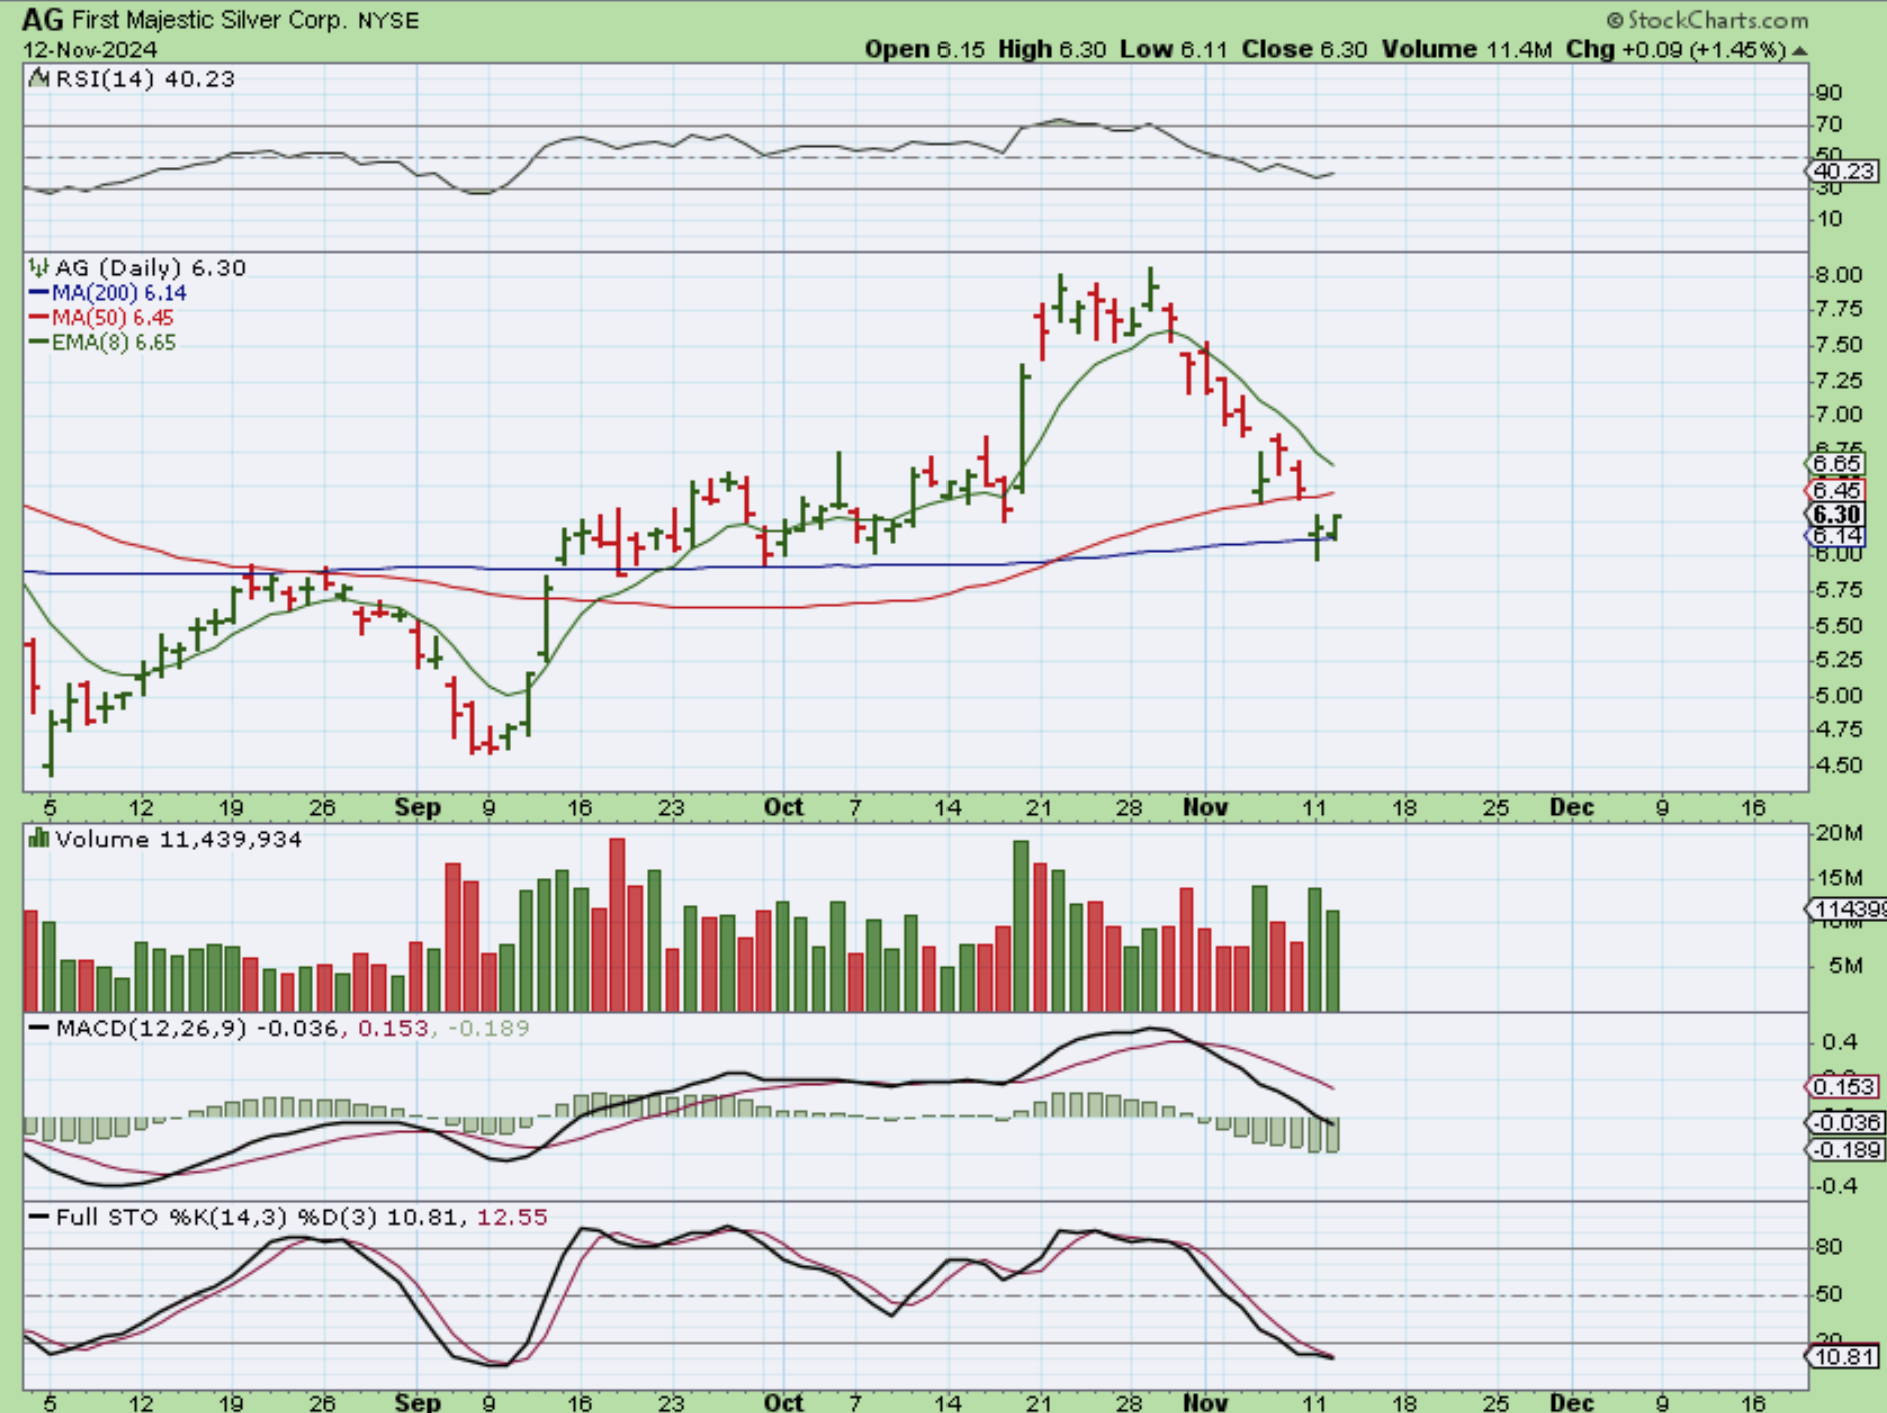
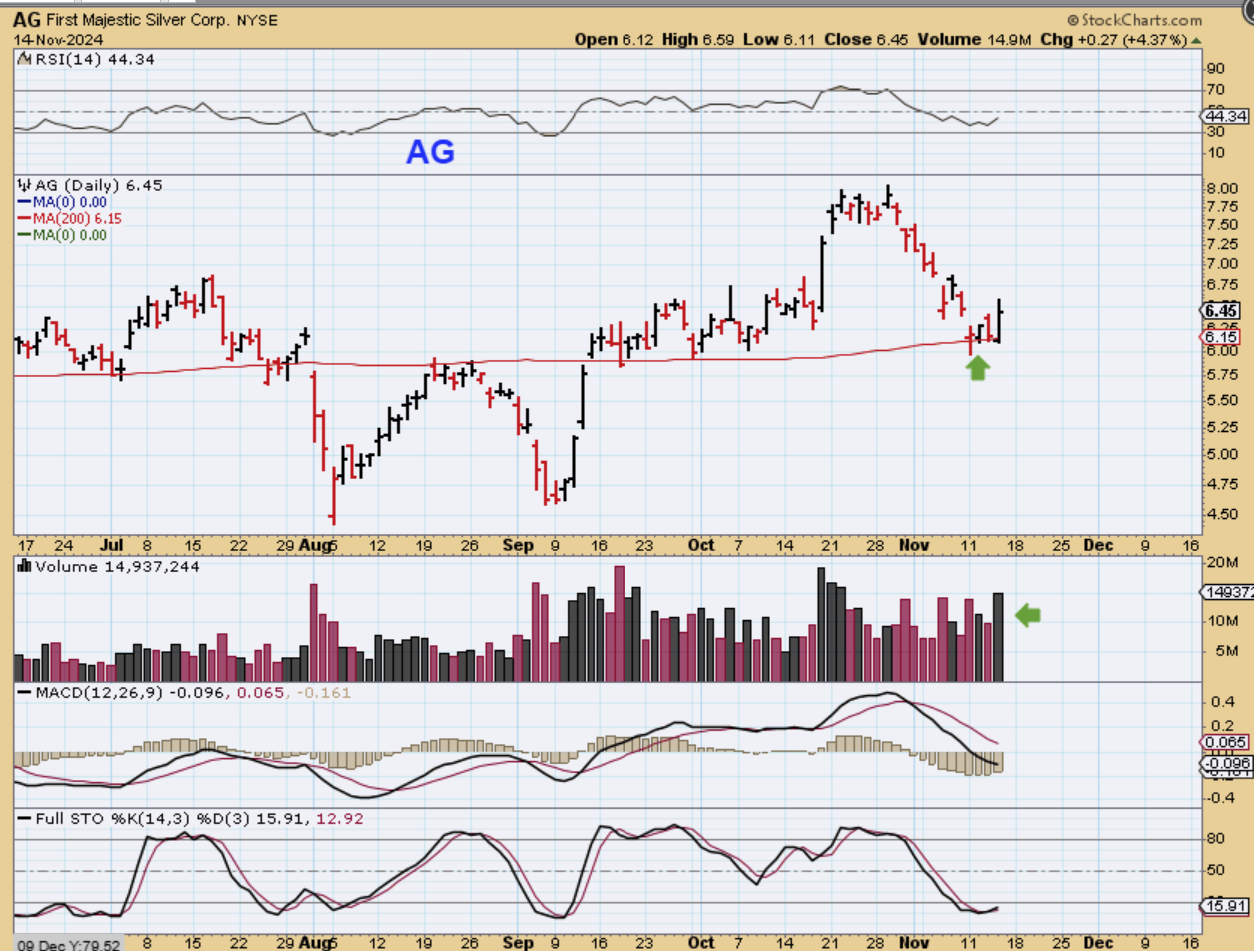
AG – On November 12th I also pointed out AG as sitting at support, but Silver continued to make new lows, so did AG hold up?
.
AG is holding up at support, even though Silver made new lower lows on the 13th and 14th. I’d say that this makes these Silver stocks a buy for at least a few days gains when Silver pushes higher.
;
I’m taking my mother out to breakfast, so I will be away from my desk from 8 a.m. until maybe 11 a.m. this morning. I bought some Silver stocks 2 days ago and I am just holding that basket for now as my main trade. I also want to point out what could be a risky trade.
.
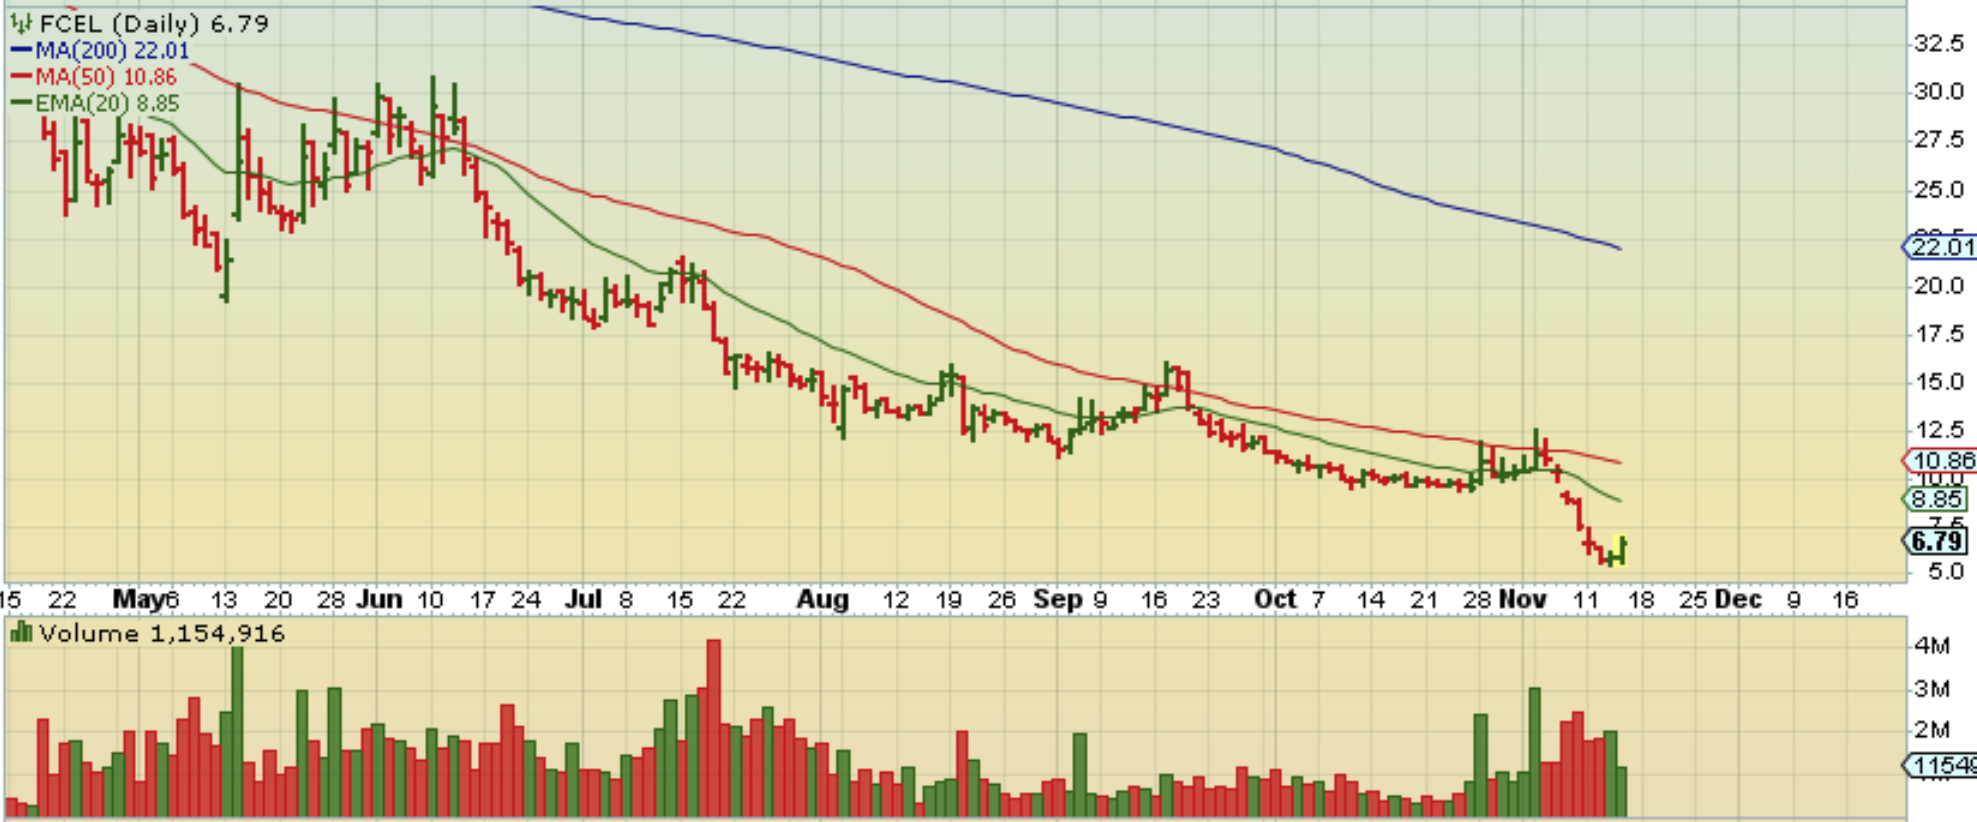
Most of us are familiar with FCEL as an energy trade. It became a penny stock, but they did a 1:30 split recently (wow), and often those will bottom out and then they can jump quite a bit, but that is not a guarantee. I caught this reversal yesterday, and I view this as a risky trade. It can move up or down in a big way intraday, but it could be quite a gainer too. You could take a small position if you need a trade. I have seen these Pop or run to the green or red line, and that is a big gain of 100%, but it is best to keep it small.
Enjoy your Friday trading!
..
~ALEX
;
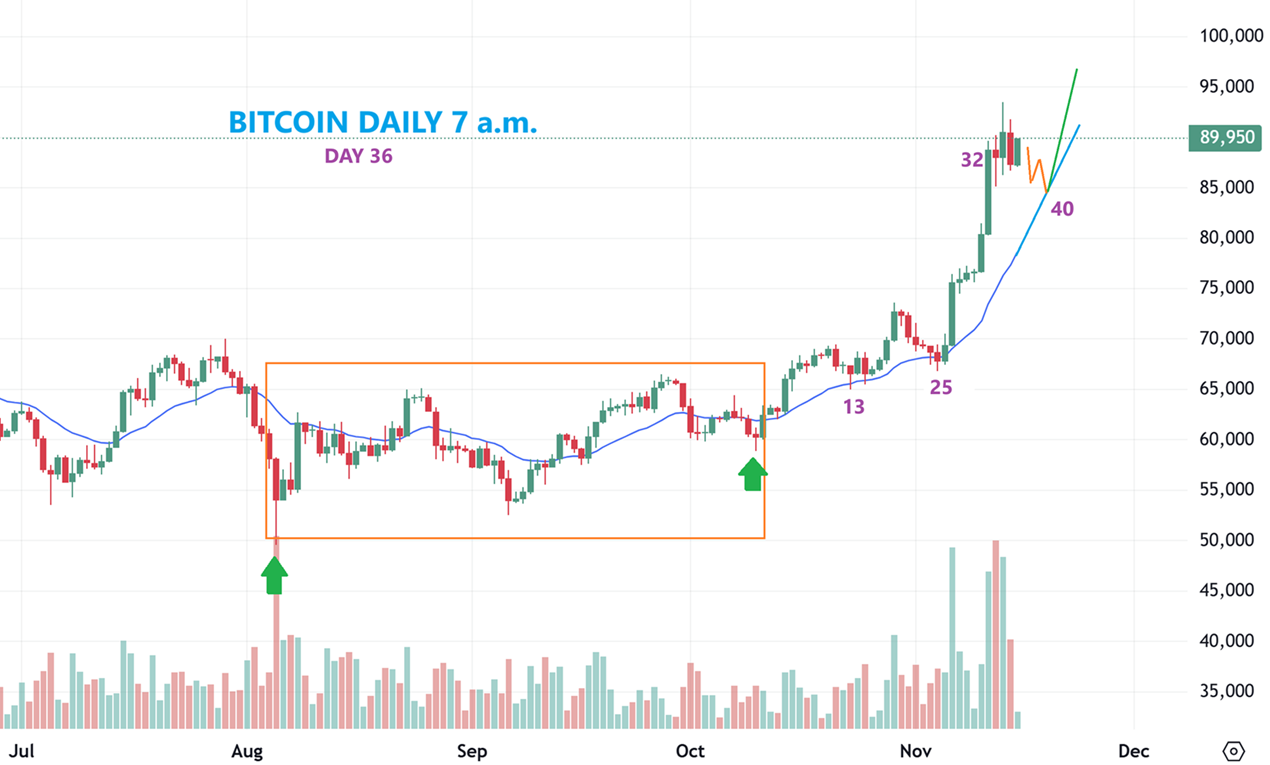
BITCOIN is chopping sideways, but on day 36, this is early enough that it could make another run to $100,000 before a deeper dip is due. Crypto stocks are dropping, and I’m watching them like a hawk! They may simply be dropping to support area and then will move higher when Bitcoin runs to $100,000. I also wrote a big write up in yesterdays report about crypto miners in early 2024. If you missed it, you do want to go back and read that report. In the weekend report, I want to explain why I feel deep down inside that crypto miners will continue higher over time.