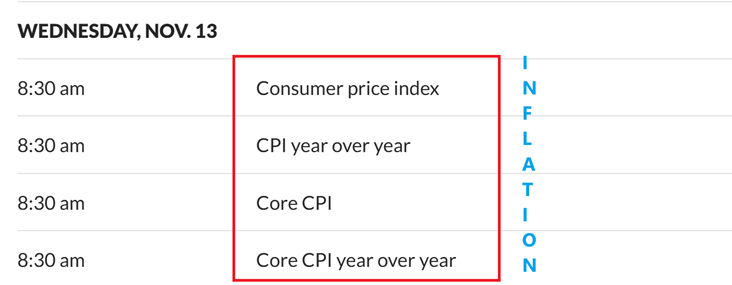
Wednesday November 13th – Inflation Data
Just a head up: Inflation data comes out pre-market, and the precious metals sector actually looks like it may put in a low. Stay tuned at 8:30 a.m. ET
.
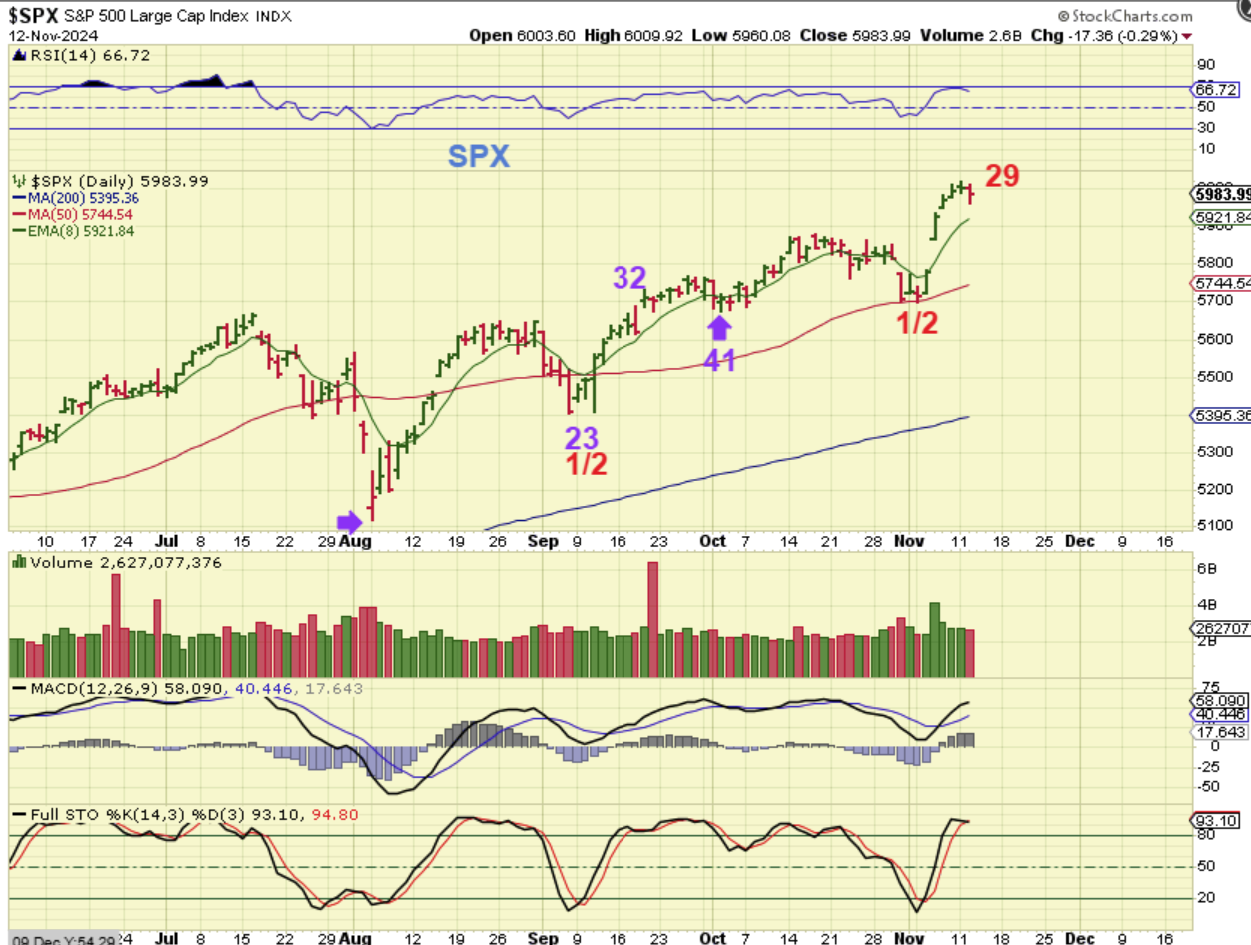
SPX – We can see that the first daily cycle was strong and didn’t ‘peak’ until around day 37, and then we got a dcl at day 41. We are on day 29 so this can keep rising up, but I’m just a little worried that the SOXX may weaken things if it doesn’t start running higher.
.
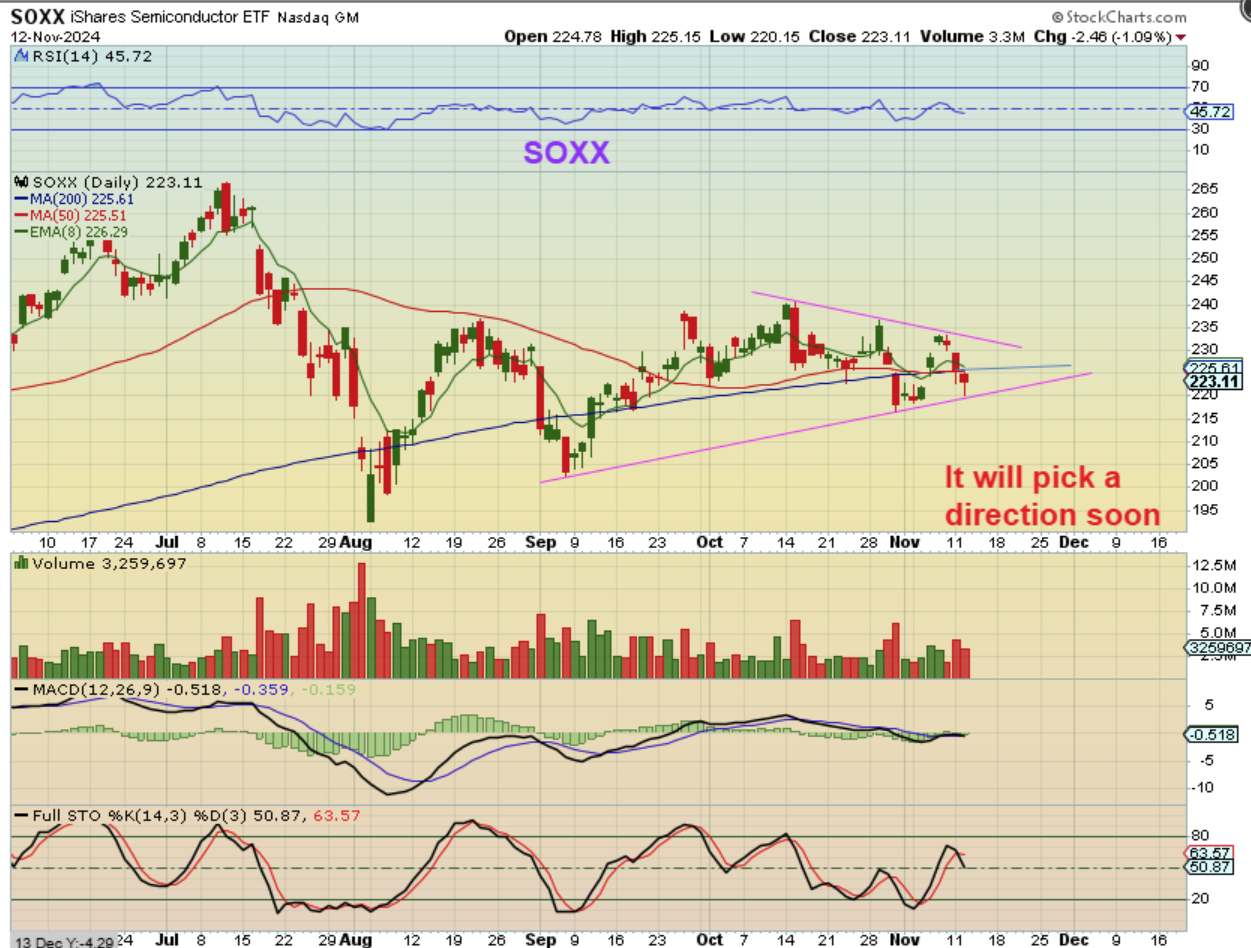
THE SOXX actually failed when it broke the dcl, but we haven’t seen follow through selling. I now see a choppy run that formed a triangle over time, and when triangles form and price nears the apex, we get a directional move. We will see what direction the semiconductors take very soon. I AM keeping an eye on the SOXX.
.
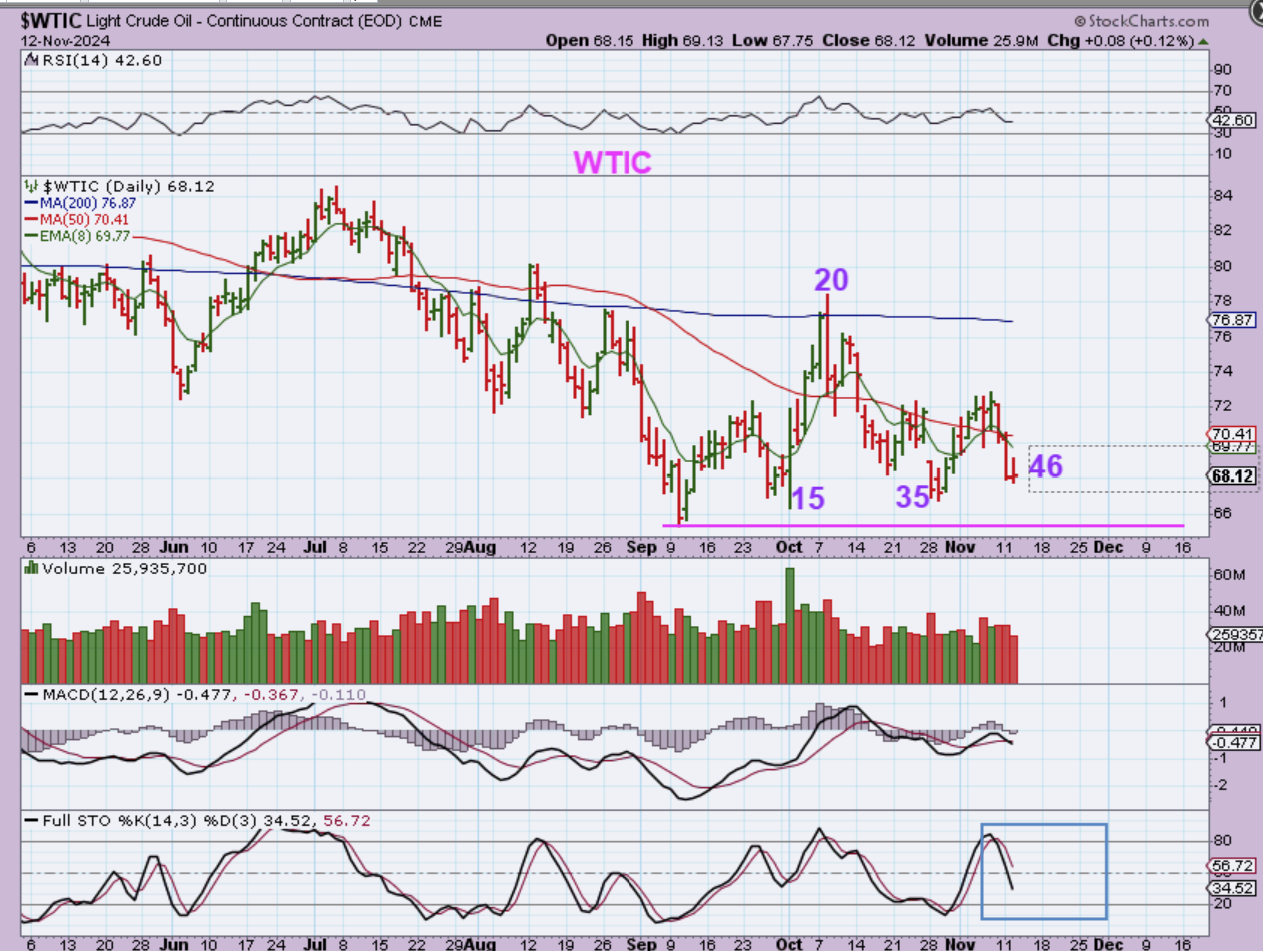
WTIC – Oil paused at day 46, and this is the timing for a dcl. I have pointed out that the XOP and Oil Stocks (MRO, NOG, NOG, OKE, etc) already bottomed and look bullish, so Oil should be bottoming. THAT SAID, there is a problem…
.
THAT SAID, there is a problem.
.
For an ICL, it would seem that we now need to break that September low. Why? September cannot be the ICL, because this is a L.T. Daily cycle, and we don’t usually see L.T. daily cycles for the first daily cycle unless we form a triangle. Furst daily cycles should peak R.T. IF WE TRUST THE CYCLES HERE, Oil will break that low, and Oil stocks may pullback slightly for a perfect buy opportunity. At day 46, the low could come with a very short, quick slam down & reversal. Oil stocks look good, as seen in yesterdays report.
.
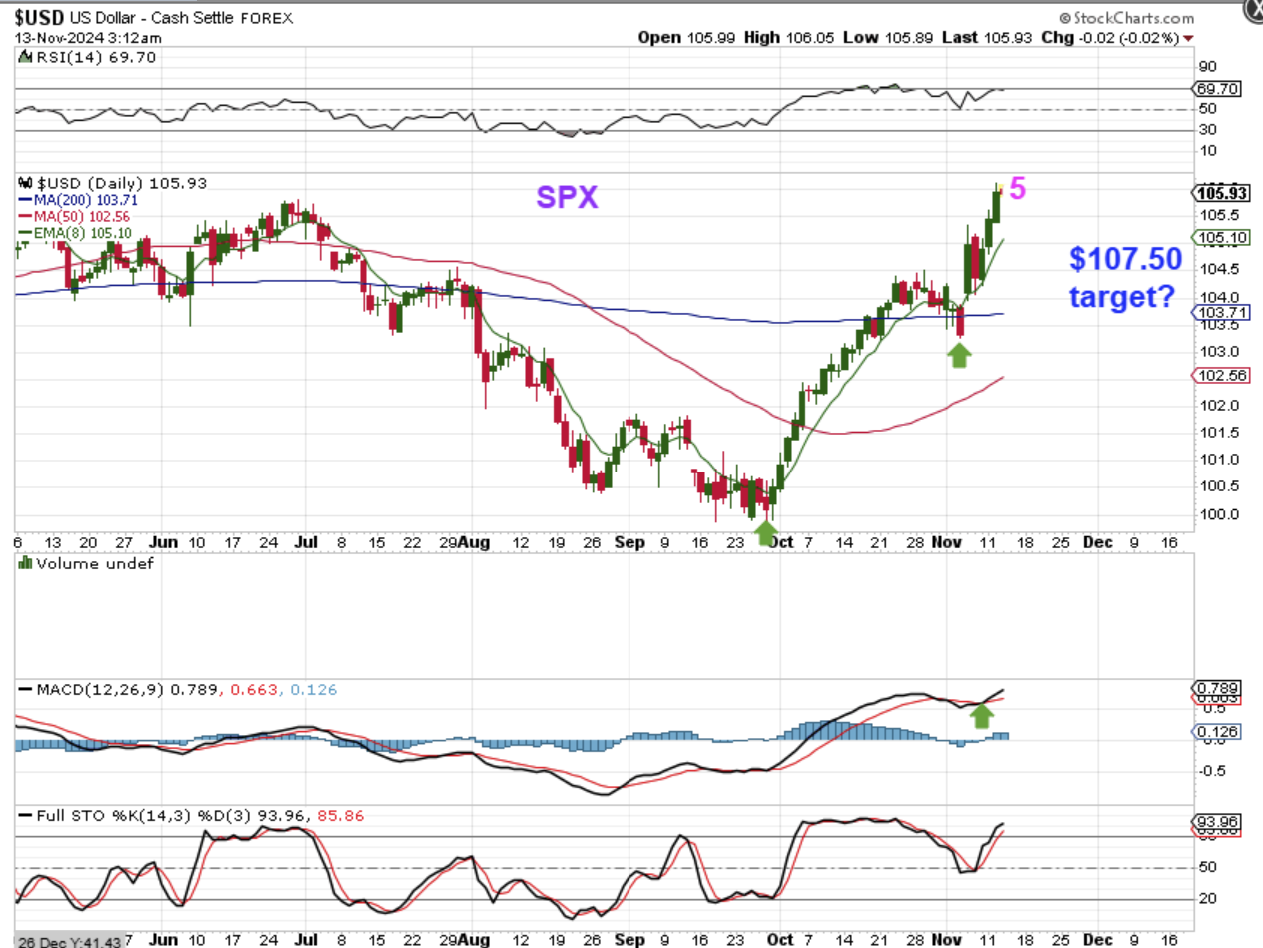
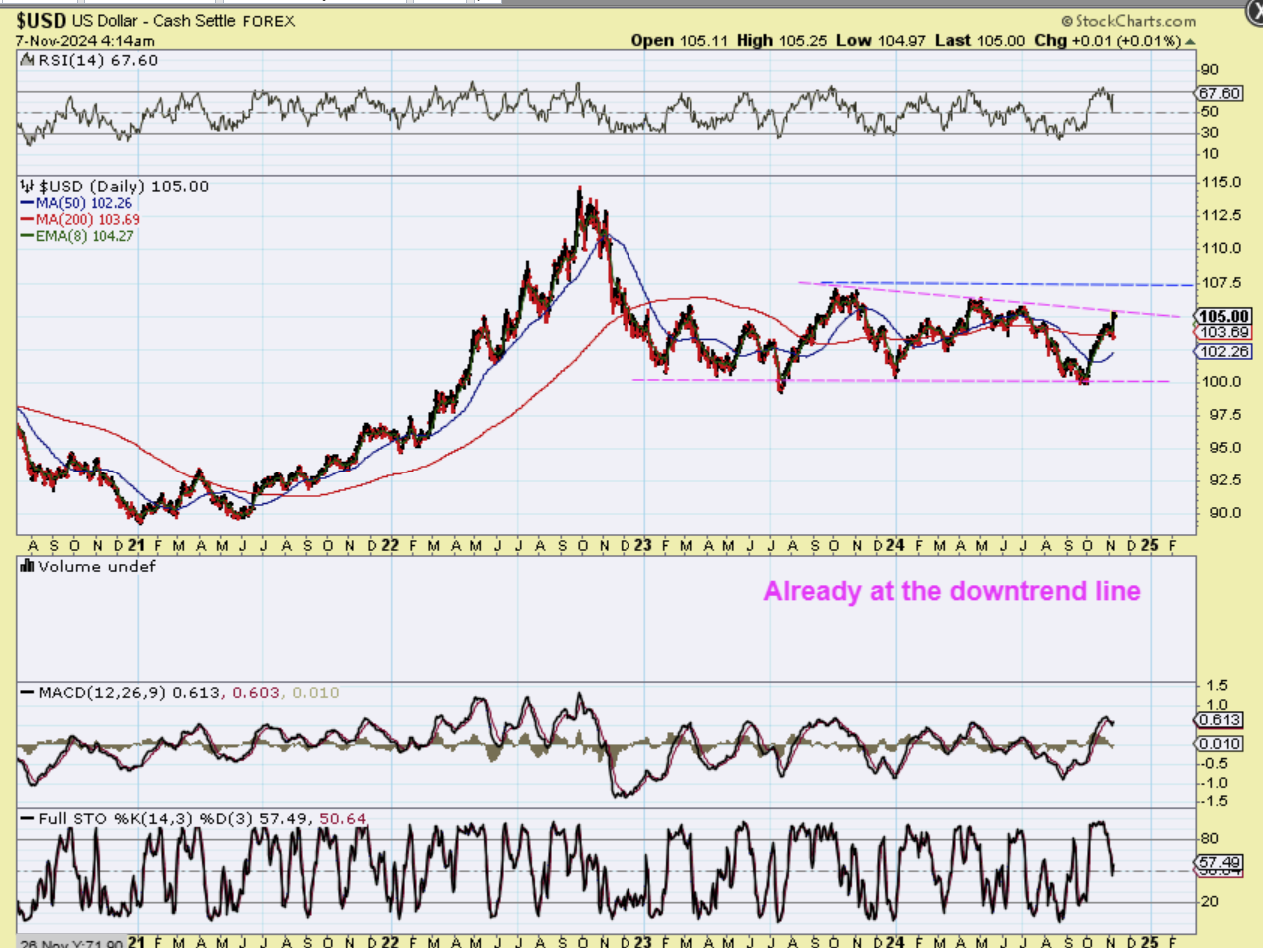
THE USD continues higher, likely up to that $107.50 area, and then we’ll see what it does from there. The USD is very strong out of the ICL, but that 1st daily cycle didn’t hinder Gold.
.
FRIDAY I SHOWED THE $107.50 AREA AS A POSSIBLE TARGET WITH THIS CHART AND THE BLUE LINE.
.
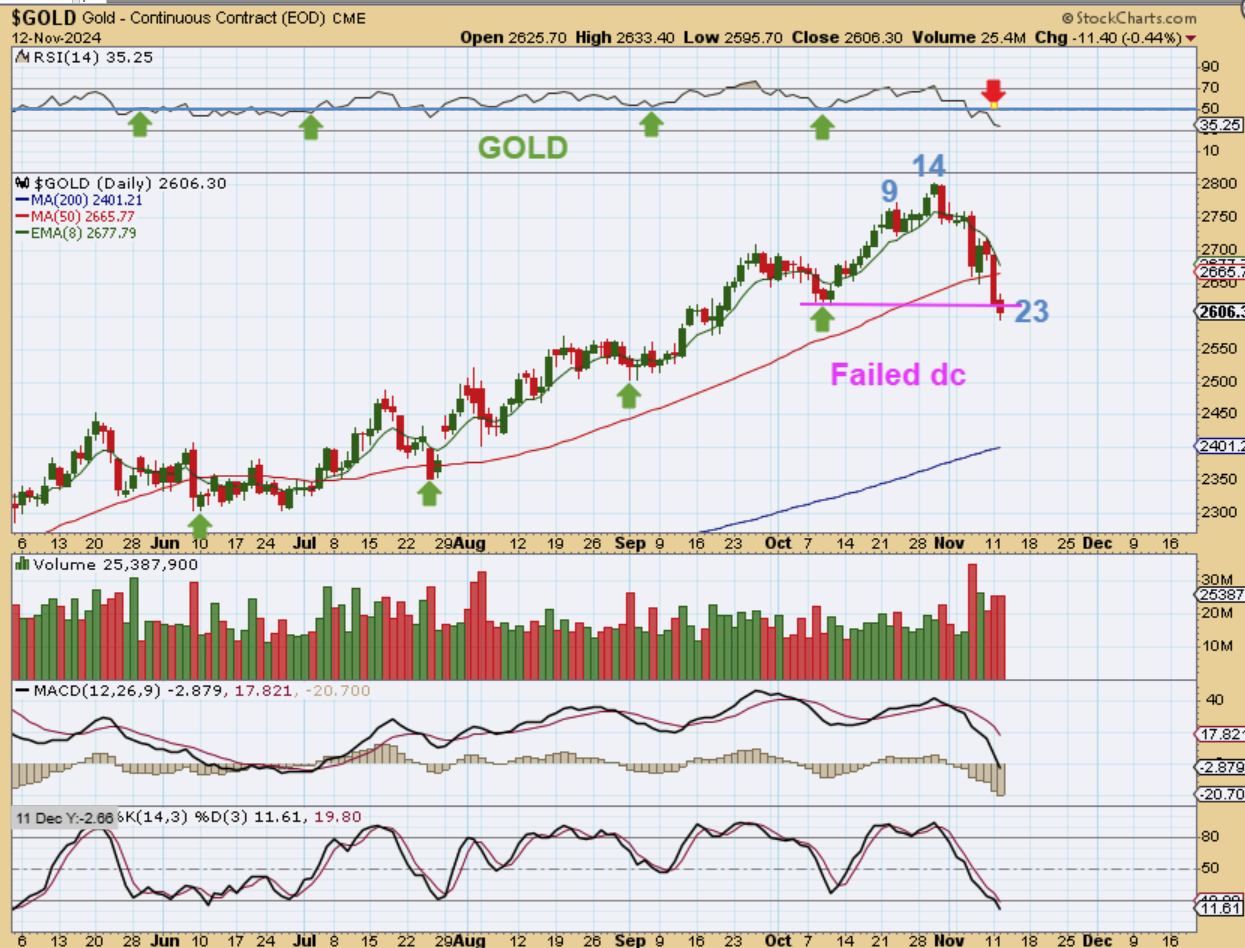
GOLD has a failed daily cycle and the selling slowed down a little. We have seen smaller daily cycles as buyers step in on a bull run, so it is possible that a low forms here with todays inflation data at 8:30 a.m., but we’ll see. This can continue to sell off too.
.
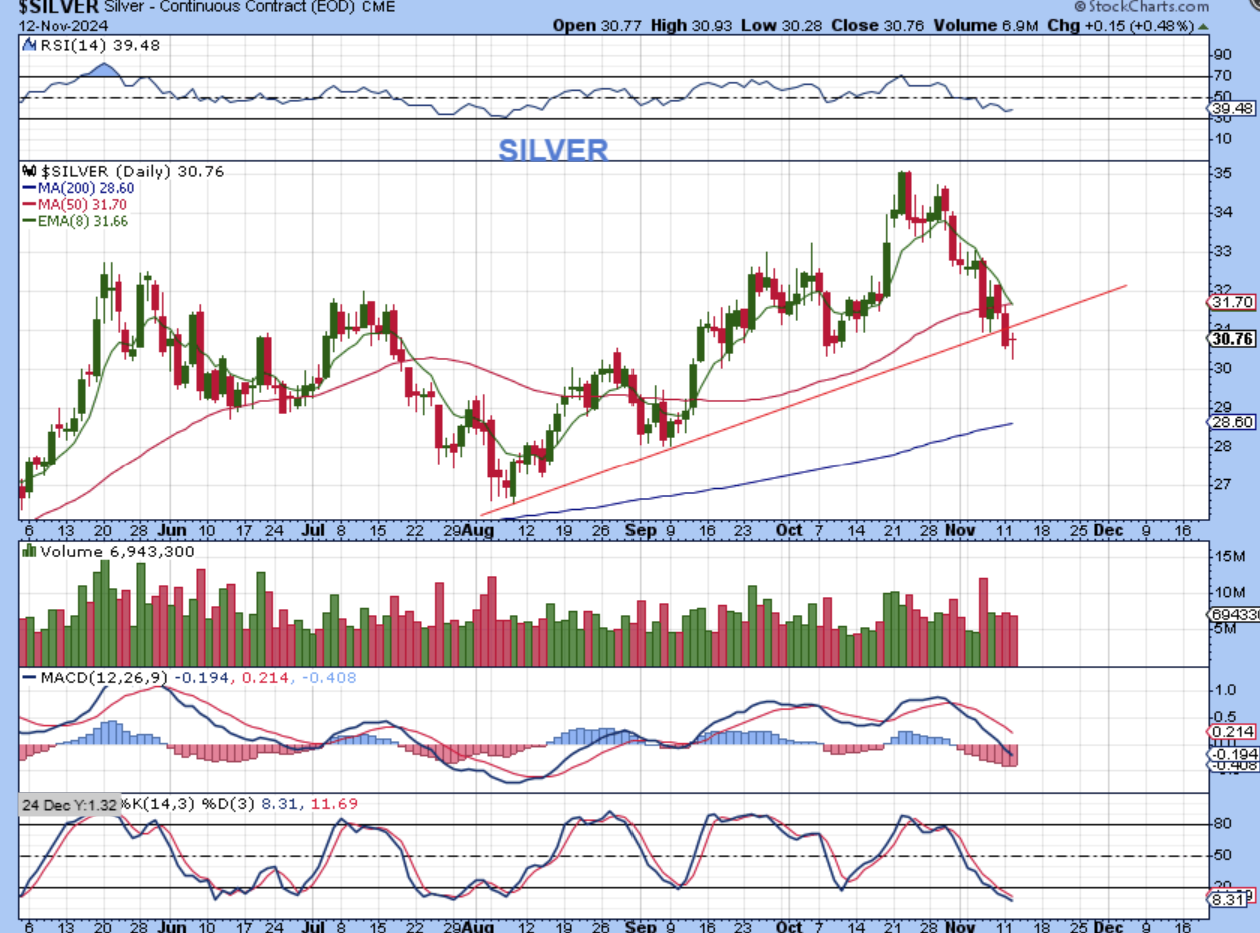
SILVER #1: Silver dropped and gave us a reversal candle by the close, so it also could put in a low when the data is released.
.
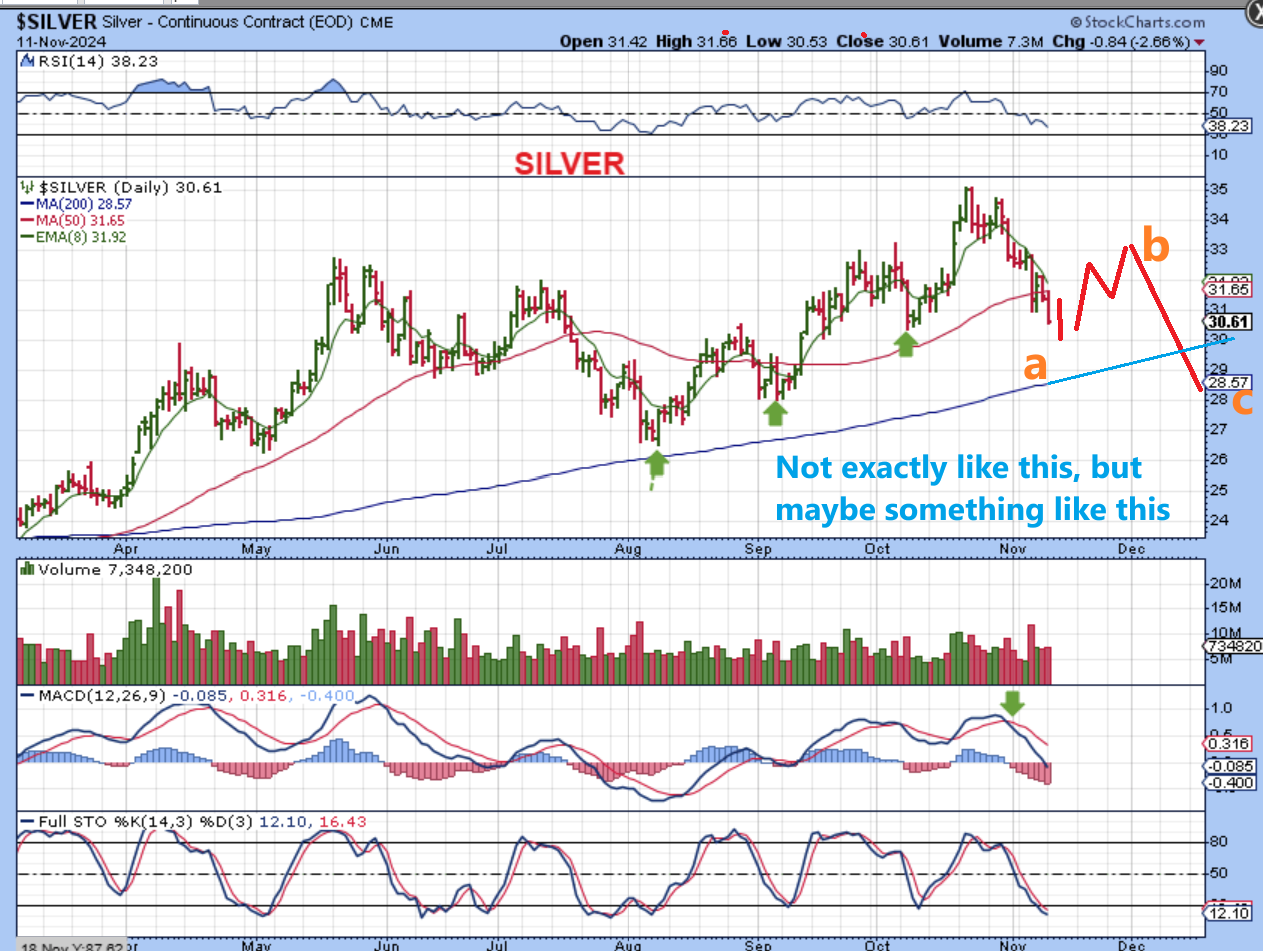
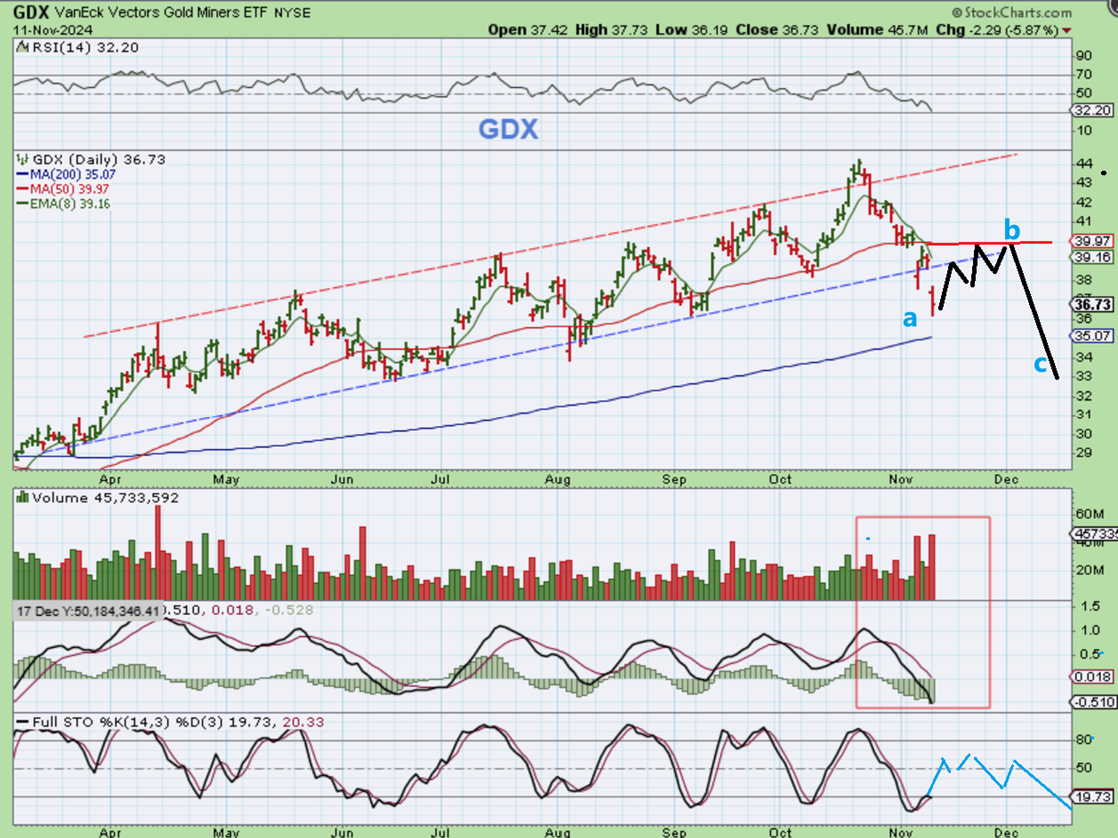
SILVER #2 – Yesterday I used this chart to show that a dcl here may not be the final low in the current sell off to an ICL. Another daily cycle into an ICL could look something like this for Gold and Silver, giving us more of an A-B-C drop toward the 200sma. Take a look at July into August, and that is what we had last summer.
.
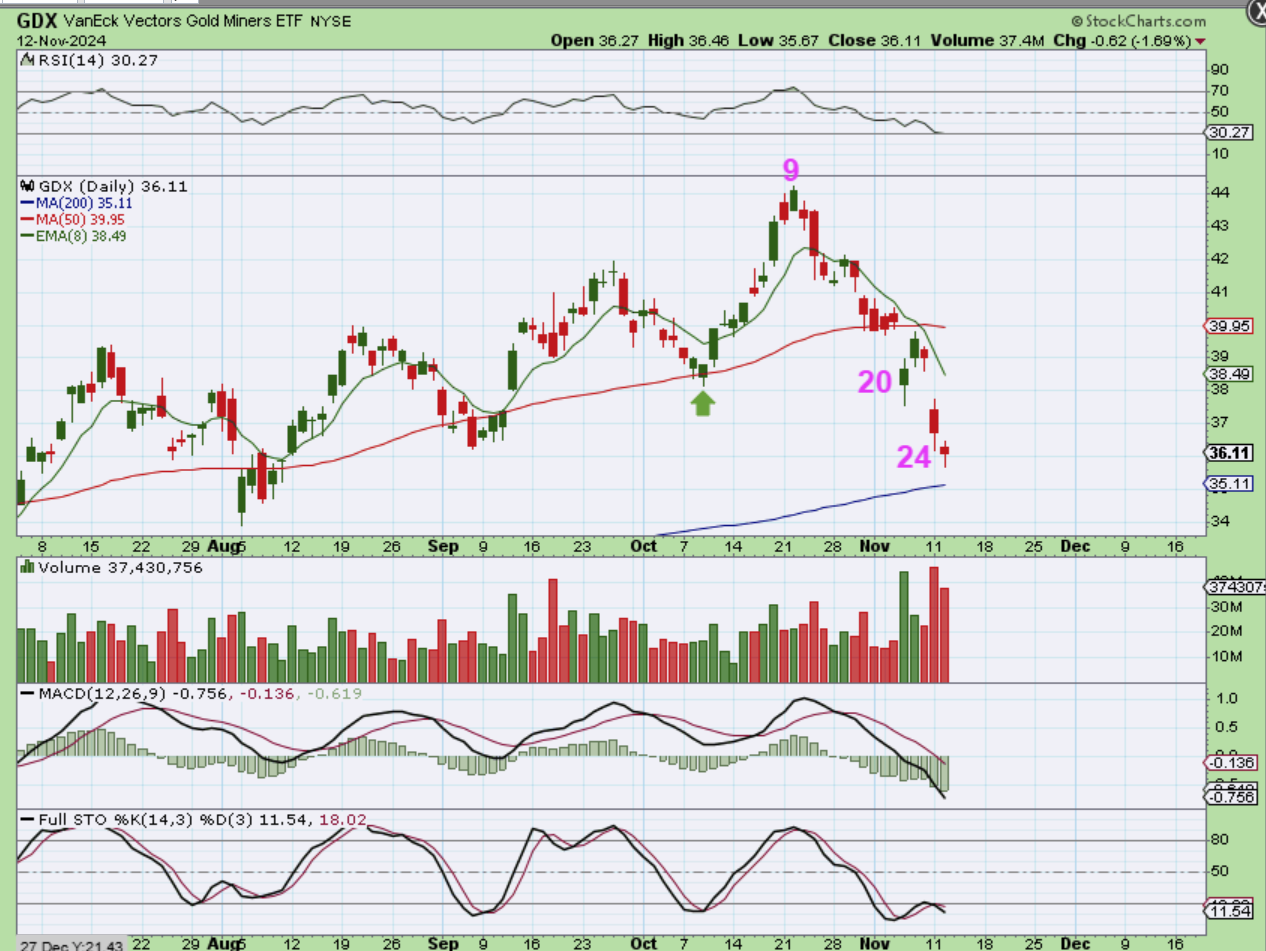
GDX peaked on day 9 and dropped to day 24 so far (L.T.).
.
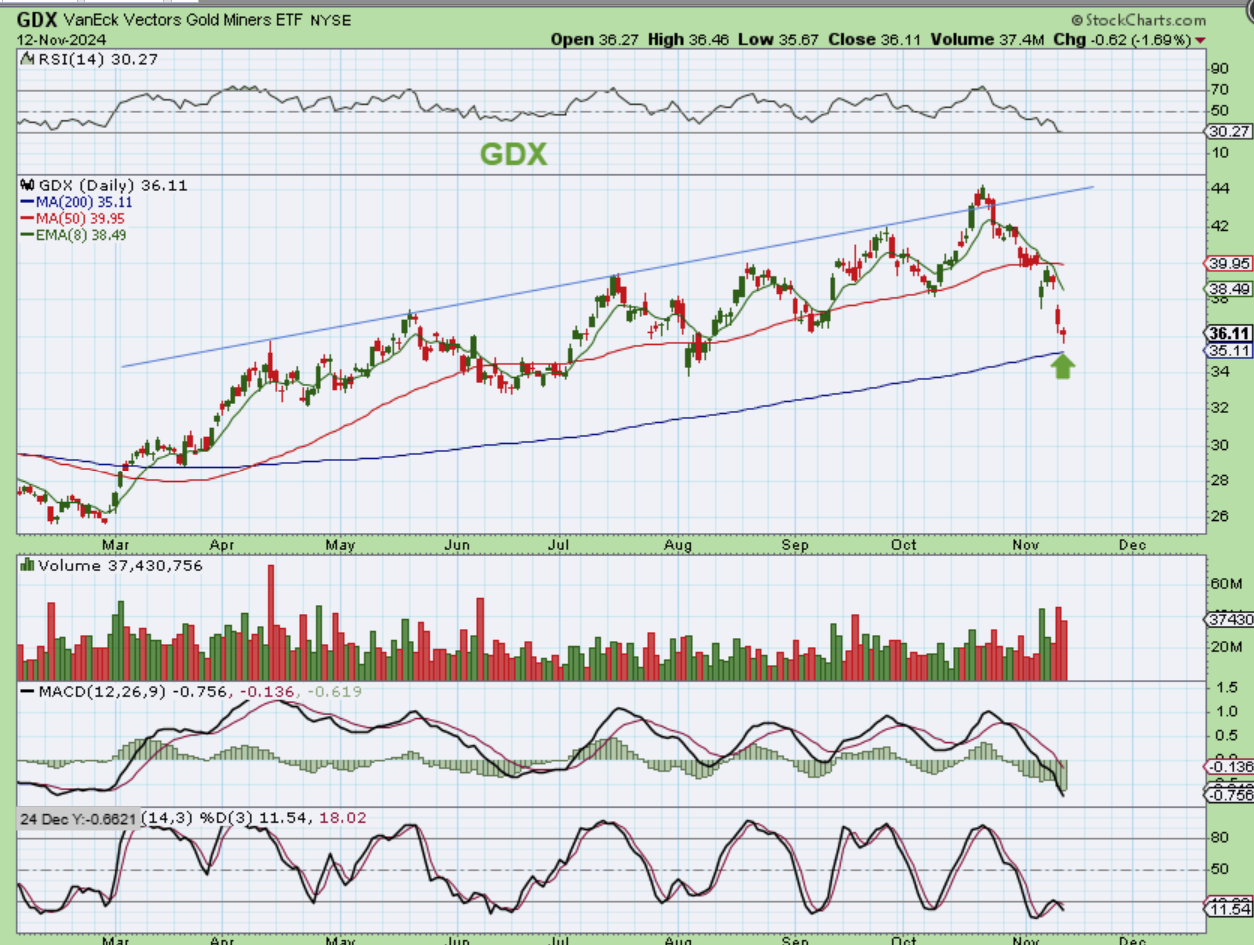
GDX – Stepping back we can see that the reversal candle yesterday came in right above the 200sma. The selling could end here, or with the inflation data, we could also see a quick break of the 200sma as a shake out and then buyers step in. We should know by 8:30 a.m. with the inflation data release.
.
YESTERDAY I SAID:
.
We just want to keep in mind that the final low (an ICL) may not come about until we ride another L.T. Daily Cycle into December. This is just an idea of how that could play out. CAN YOU BUY THE NEXT DCL/SWING LOW? Some like to buy it just in case it takes off higher as the ICL, but if you see weakness and maybe resistance at the red 50sma, it is likely a final daily cycle.
.
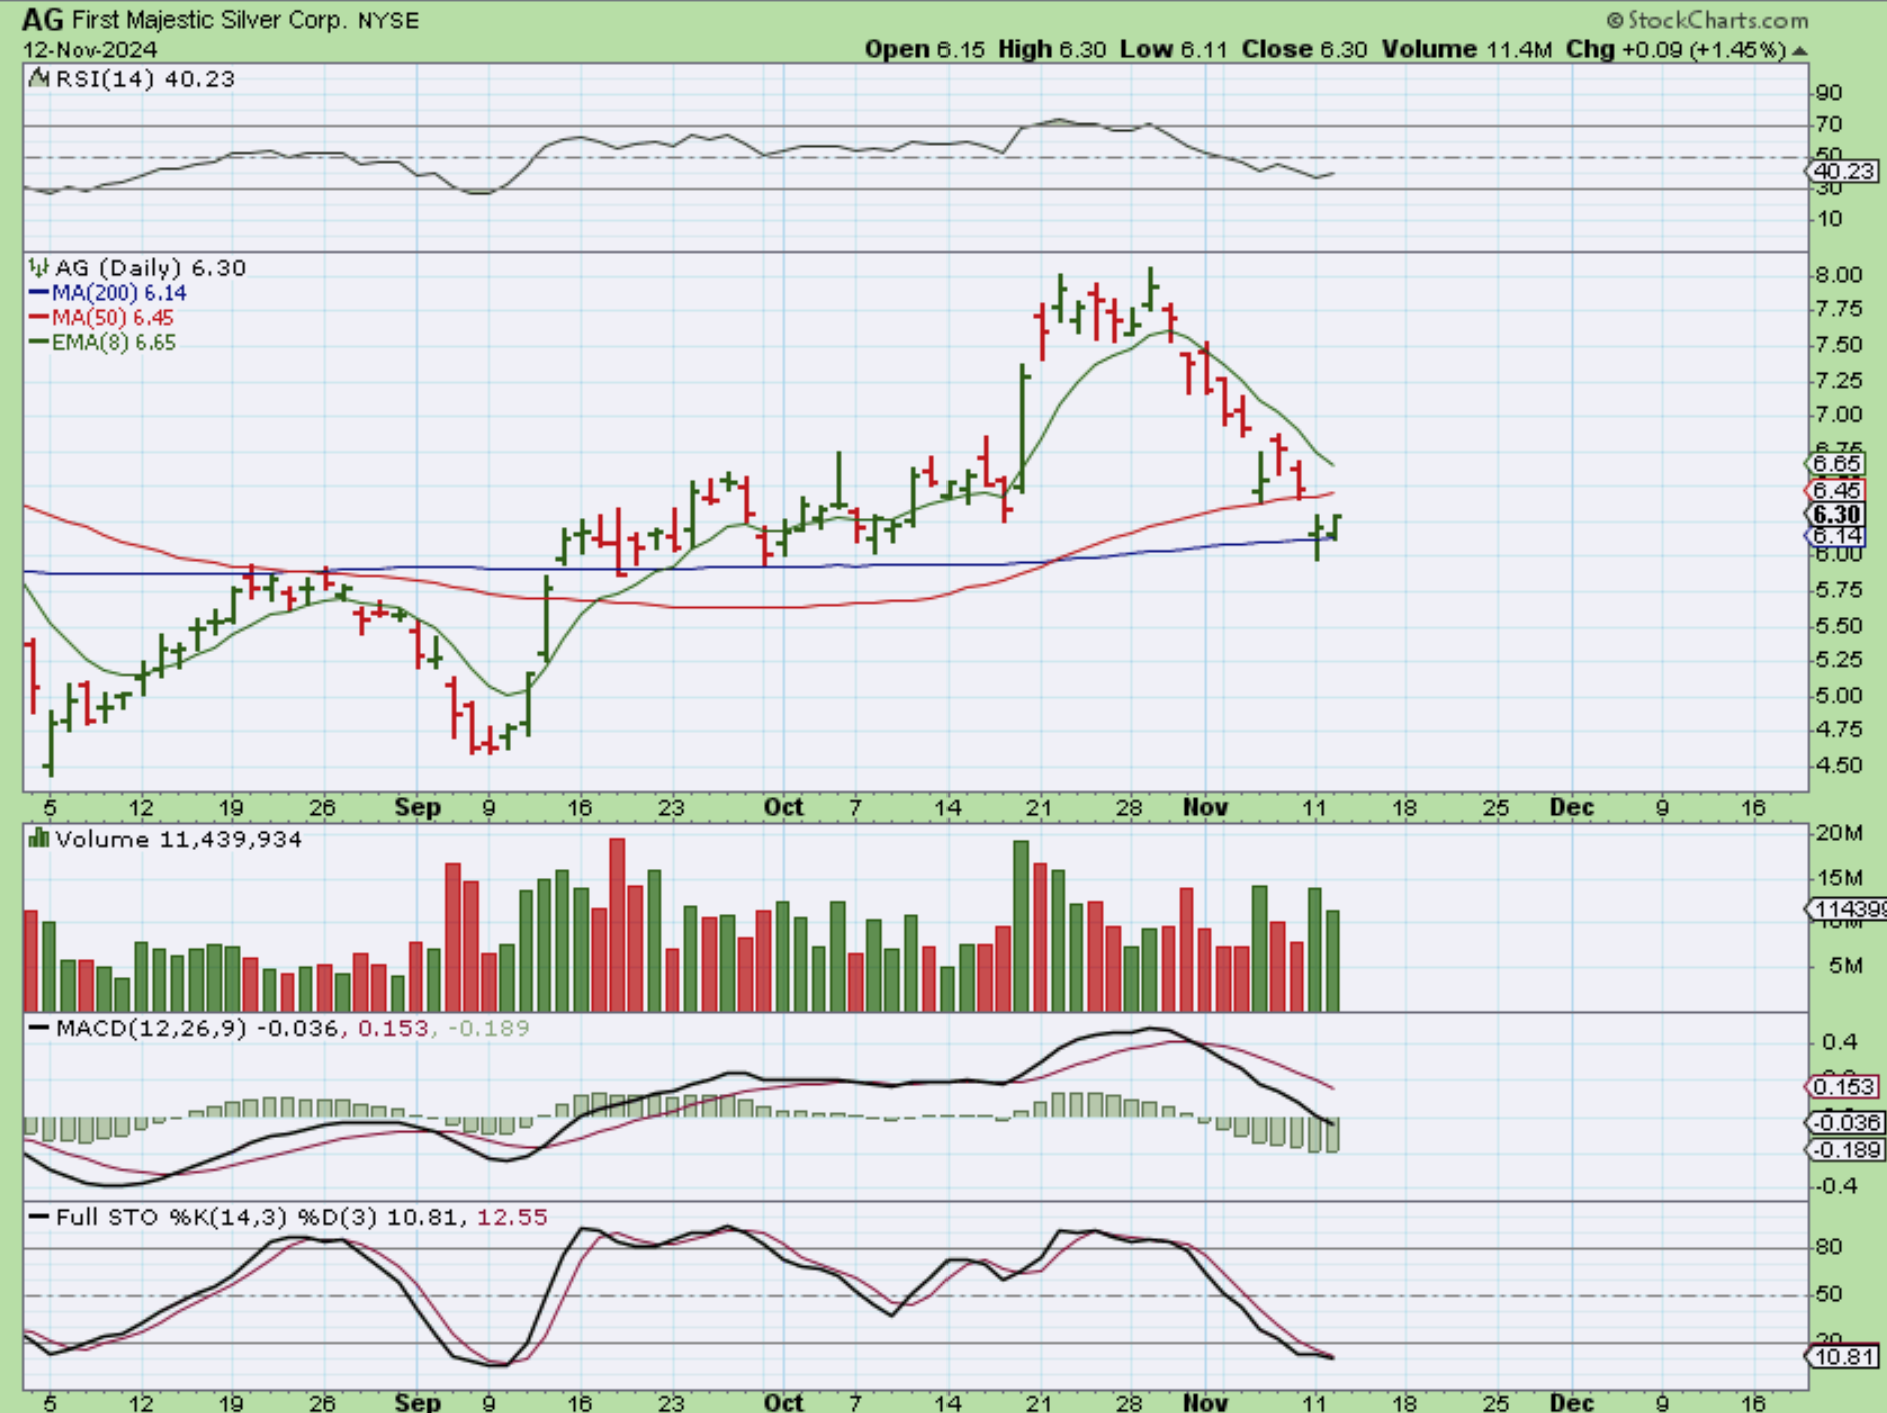
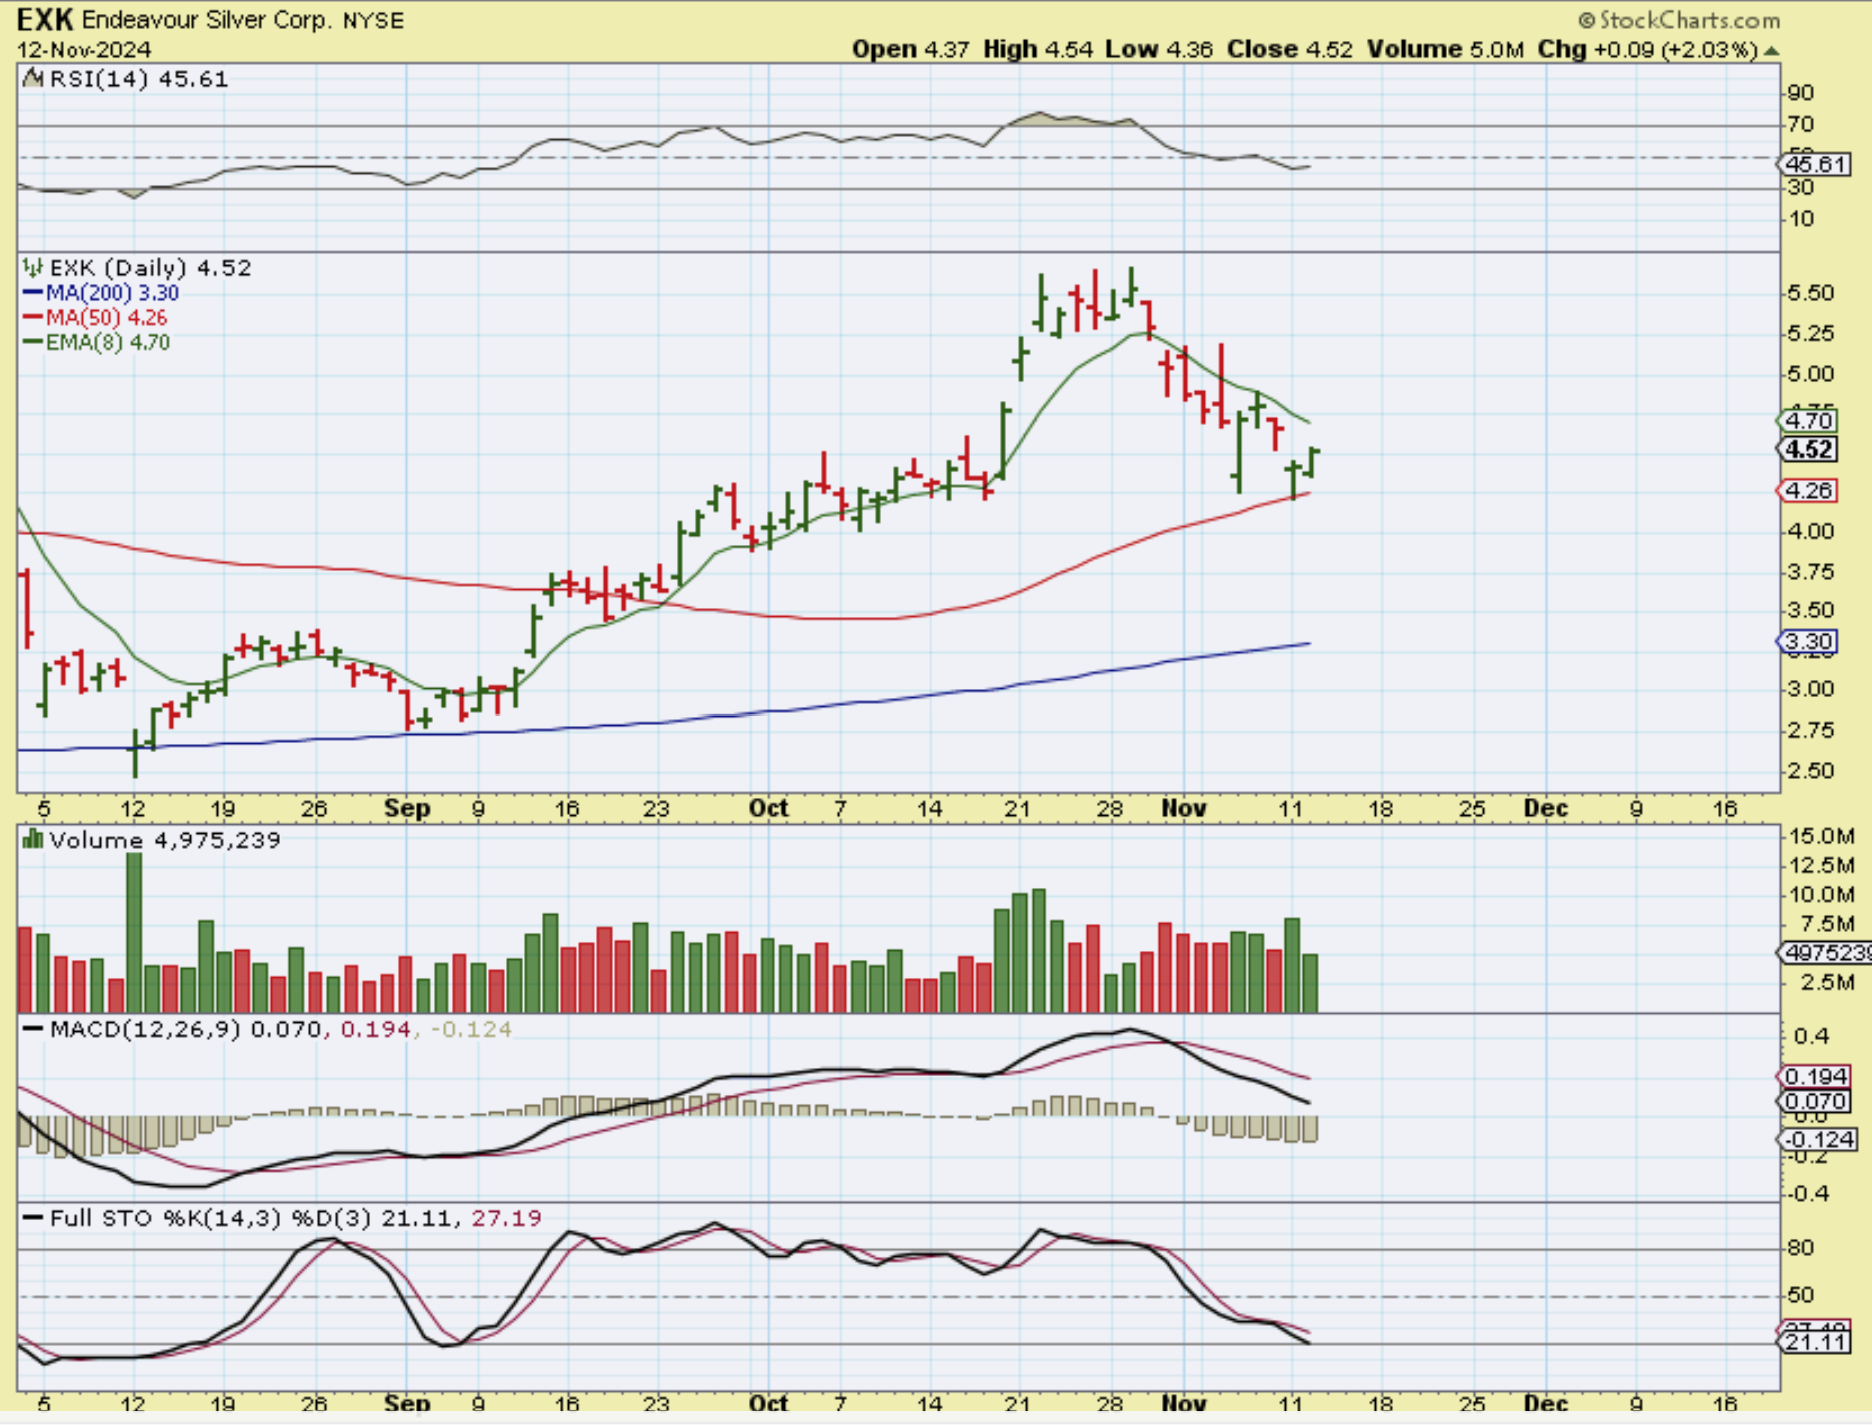
Several Miners dropped and turned green yesterday at support levels too, so the selling may be drying up.
.
We’ll have to see what the futures look like after that 8:30 data is released, to give us a clue about the days trading. I’ll discuss Bitcoin below. Enjoy your Wednesday trading!
.
~ALEX
.
Using ’30-day cycle counts’ and adding them up to see what the ’60-day counts’ would give us still does not have us in the timing for a low.
.
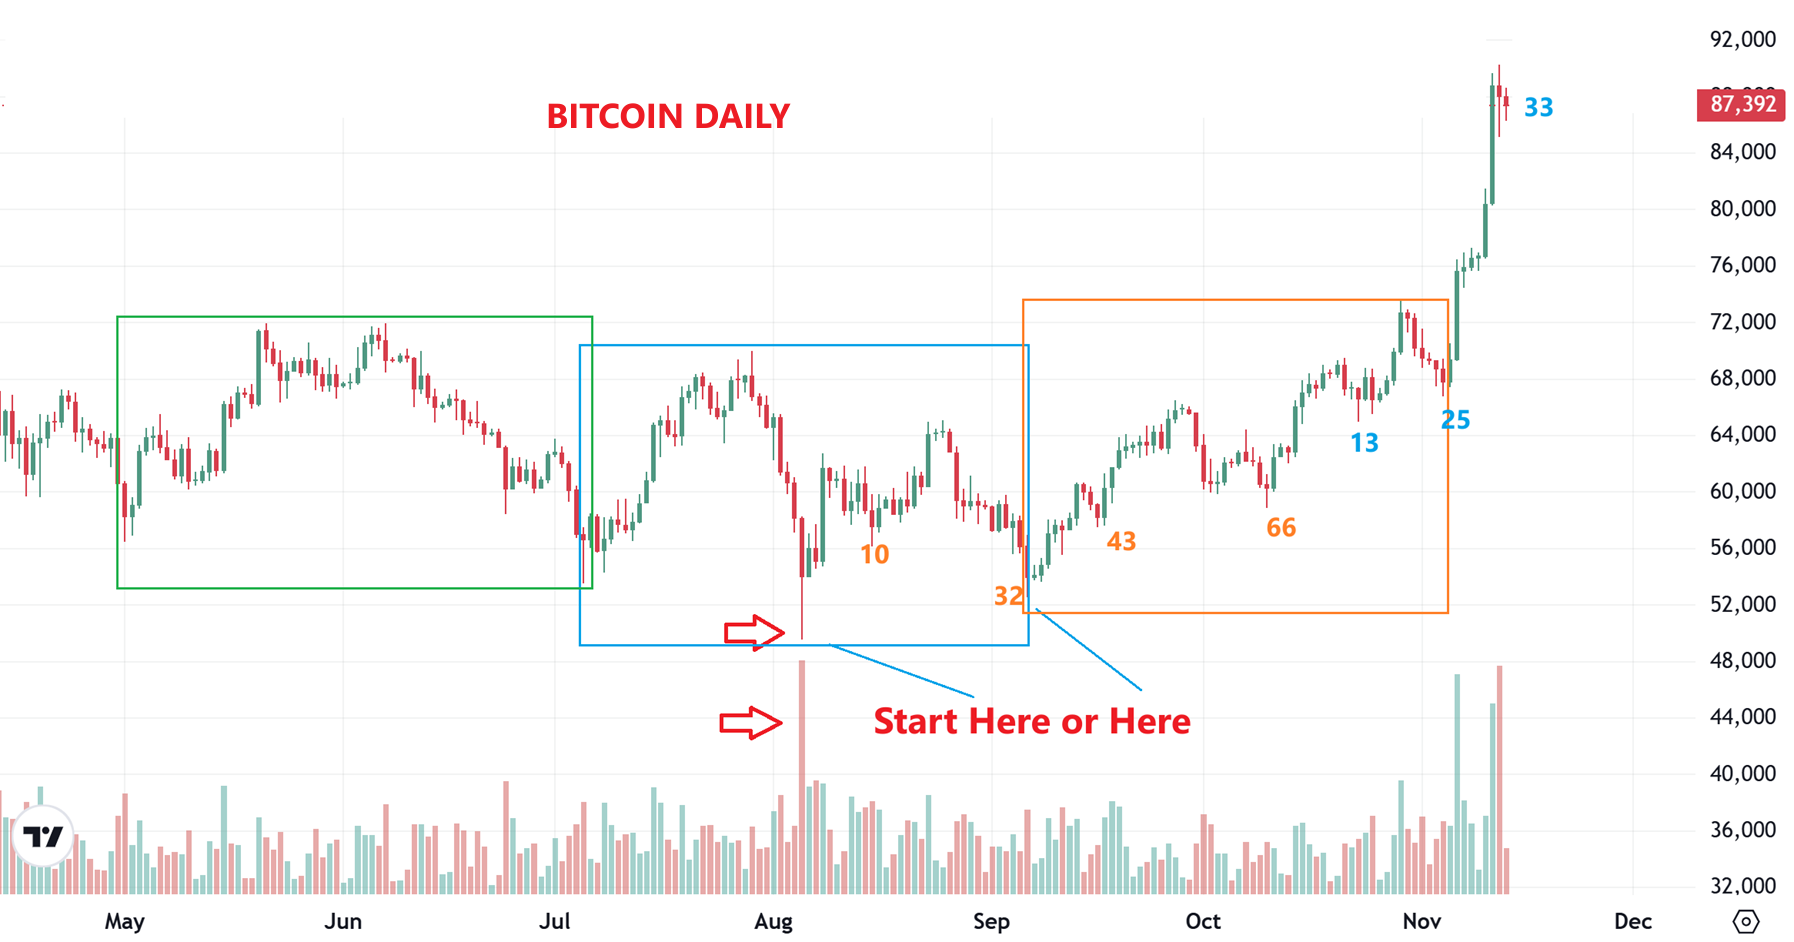
Bitcoin: On this chart I will start a 60 day count from that slam down low (on the next chart I’ll start with the day 32 low on the blue box, that was how the count originally was). With that slam down low, we see a low that came in near day 32 & then day 66. We would then start over and we’d only be on day 33 of 60ish, with a day 25 low for the 30-day timing, so a low is not due now.
.
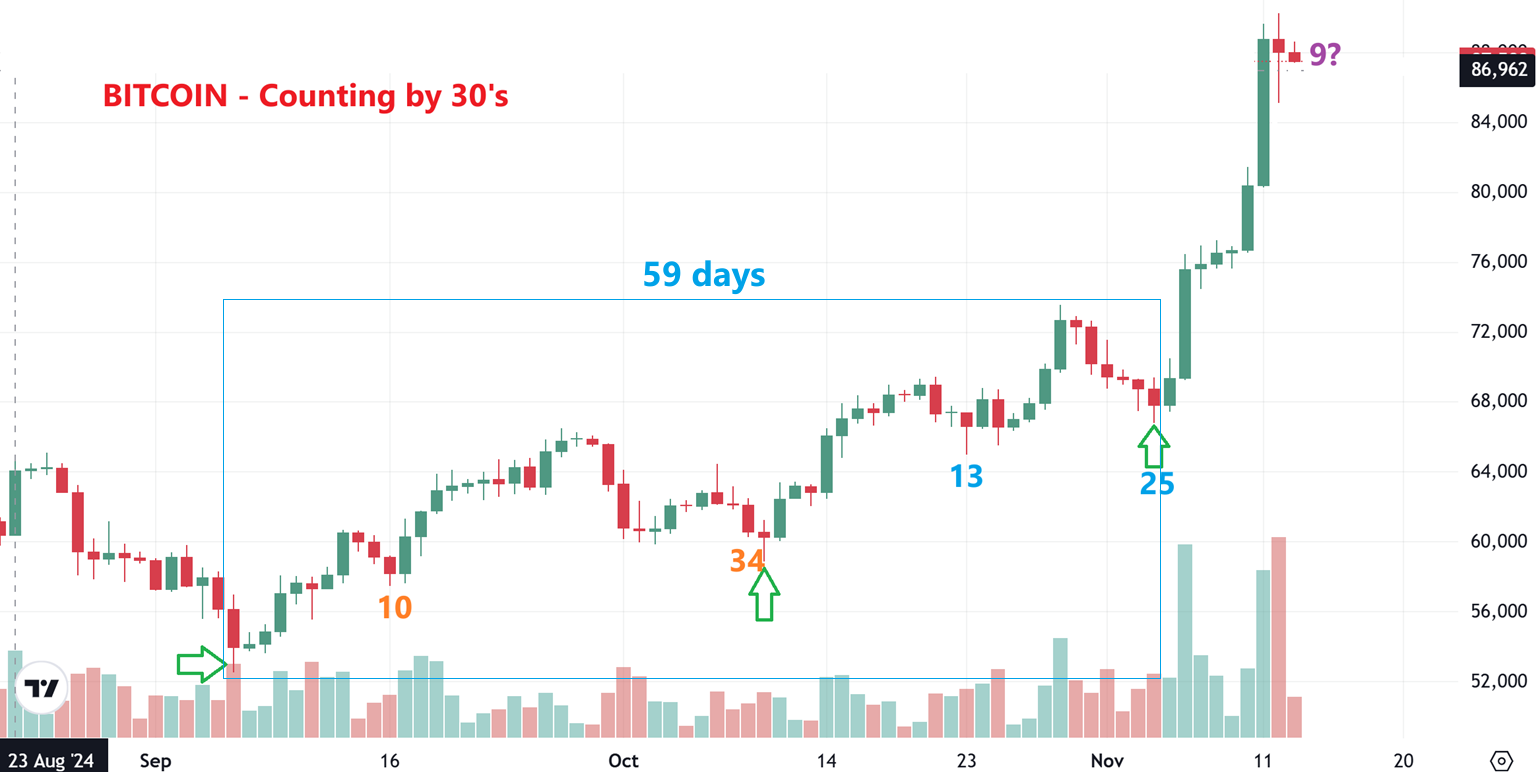
Bitcoin: This chart starts the count at that other low. That would have given us a day 34 low, followed by a day 59 low (or a day 25 low from day 34) and now we’d only be on day 9? So we are not due for a low any way that you count it, but with that rocket launch higher, we could consolidate sideways for a while or build a bull flag. We’ll see.
.
Bitcoin: Notice the move sideways for several days in the last major run higher. That was about a 13 day sideways churn, and something similar is what we could be doing here and now.
.
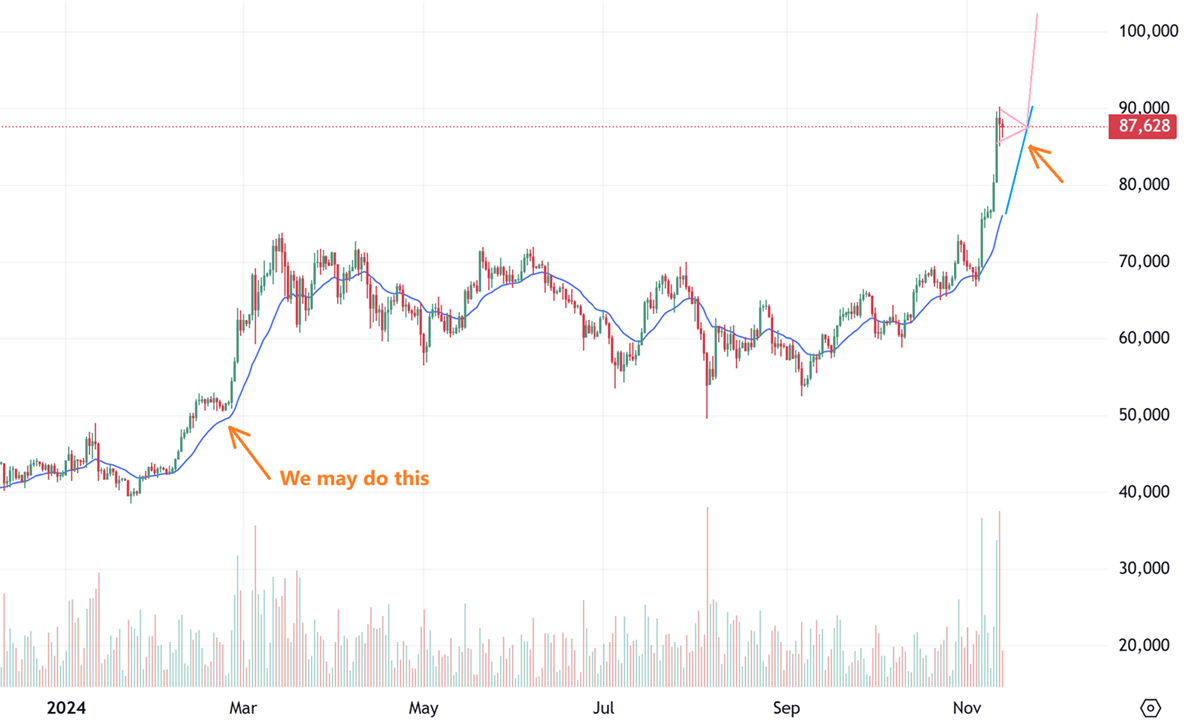
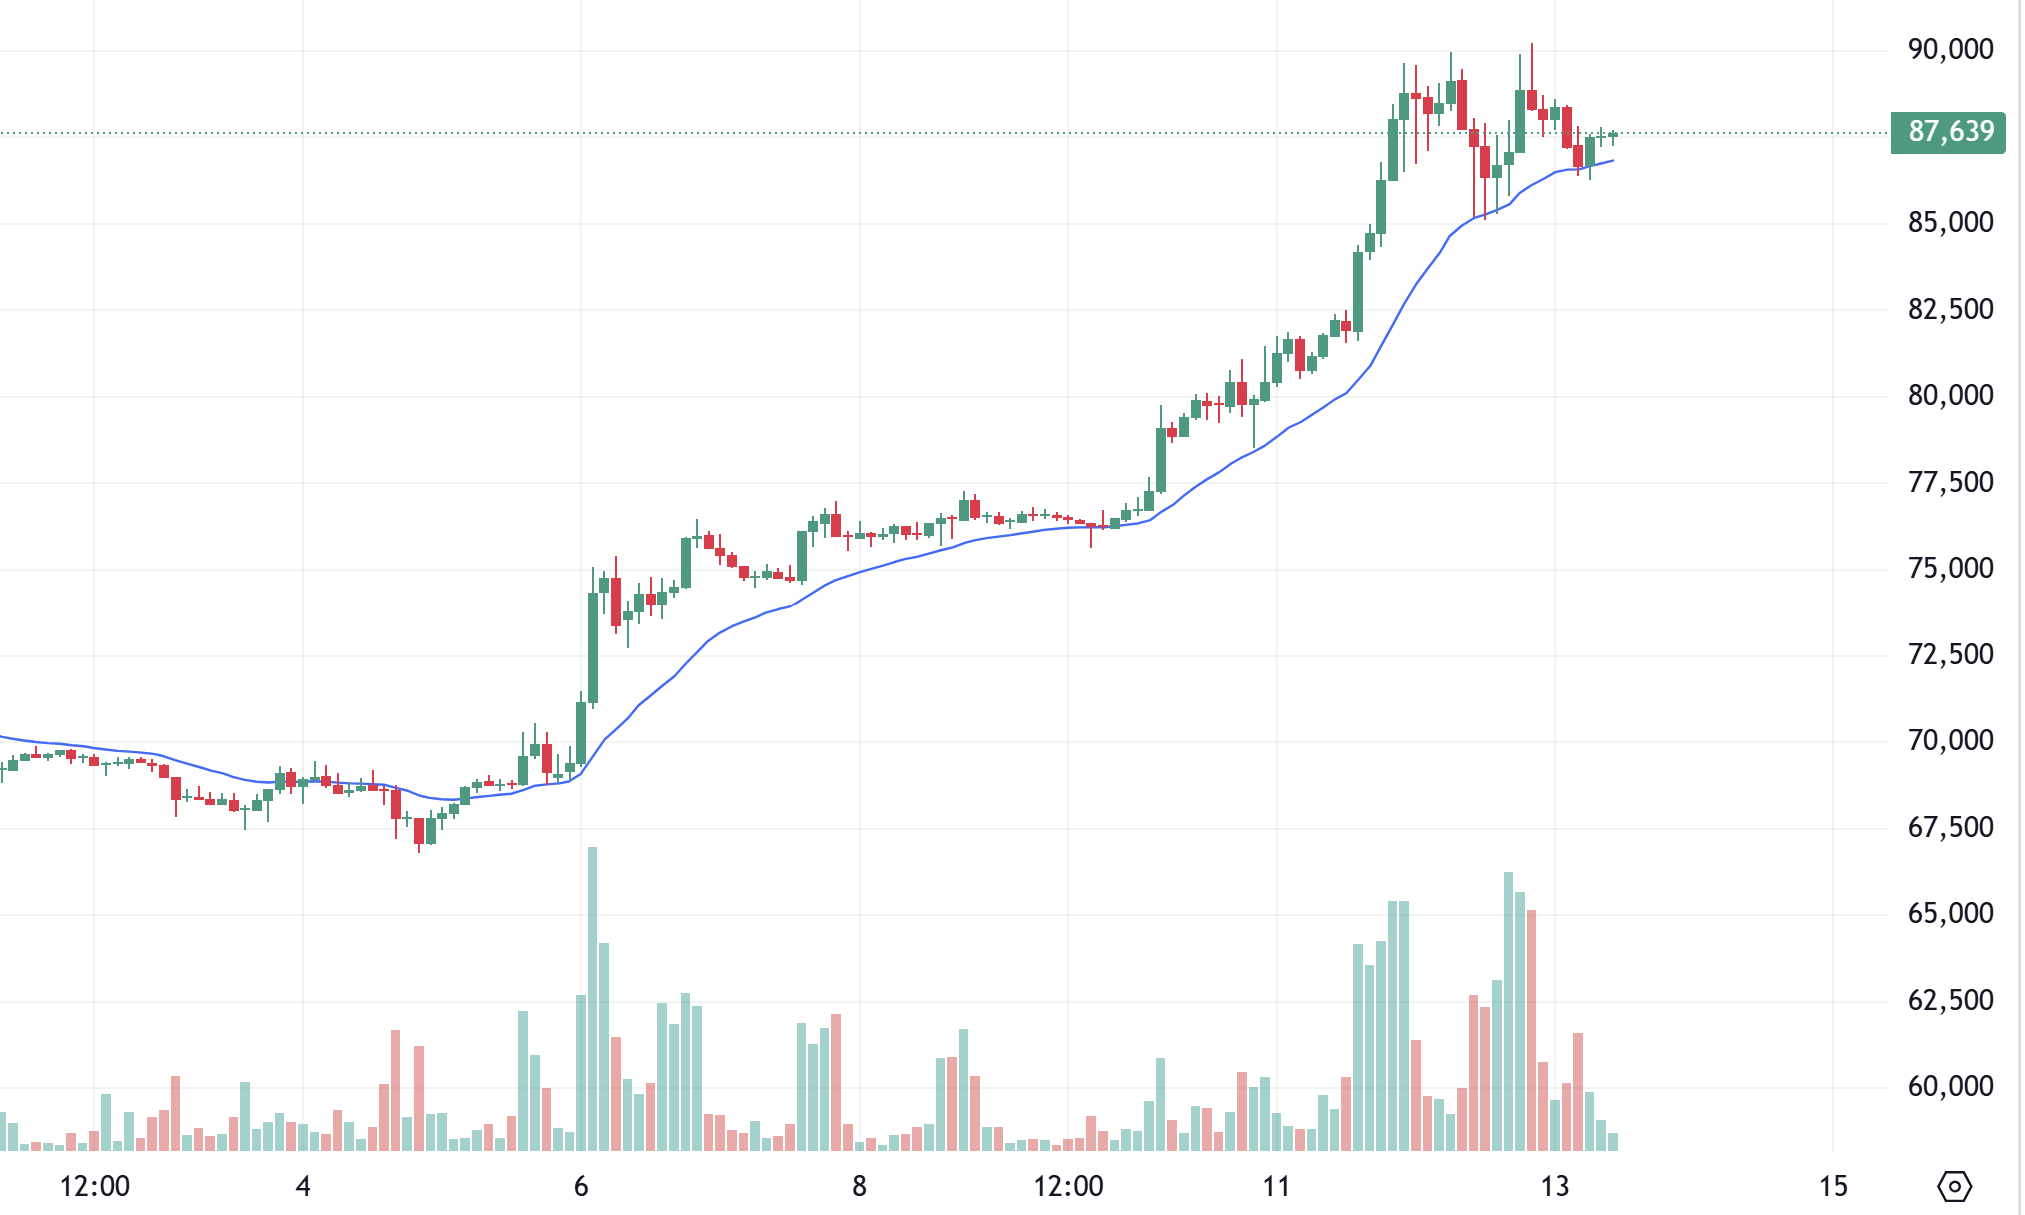
Bitcoin: The 2 hr chart seems to show a short-term triangle or pennant that is obeying the 20 ema as support, but this may or may not hold up. I have seen these go either way in past runs, because if it forms when we are over extended, it just eventually breaks down. If it is valid and holds up, Bitcoin would push higher sooner than later.
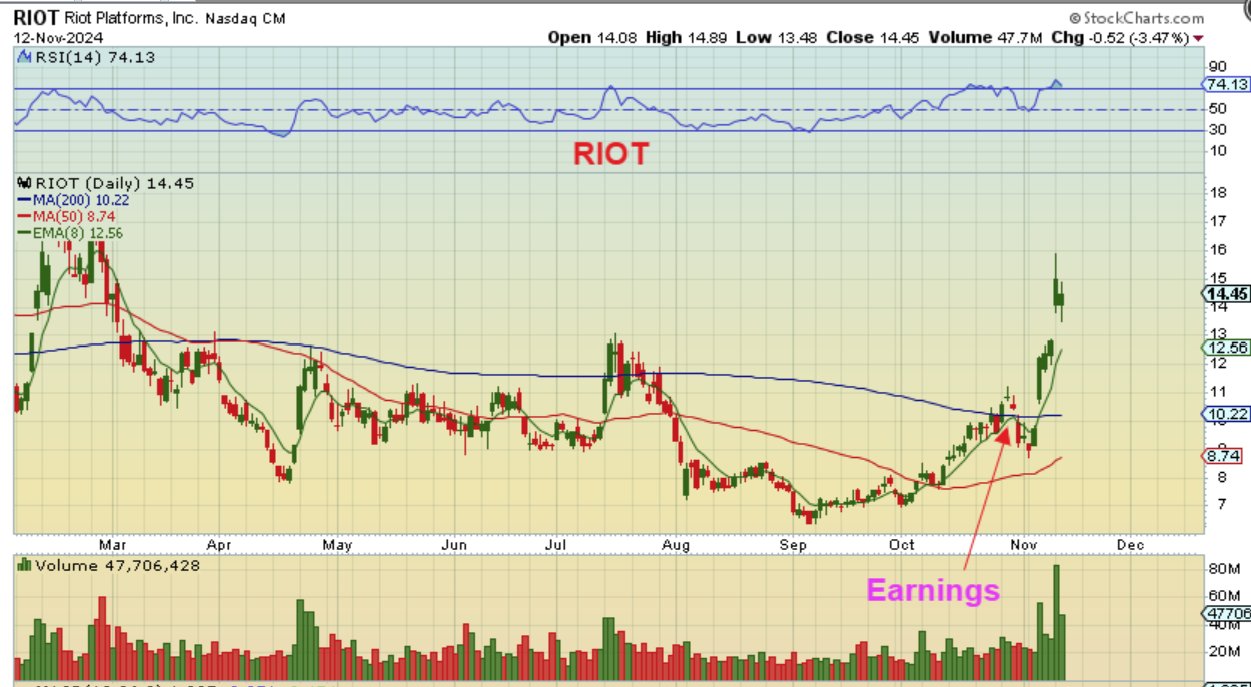
As a final note, many Crypto Stocks have or are now releasing earnings reports. Ones that are considered a miss or disappointing only seem to drop for a day or 2, and then recover, since we are in a bull market. RIOT and CIFR both did a short term drop…
RIOT dropped for a couple of days after releasing their earnings, but now it is much higher than the earnings drop.