November 9th Weekend Report
.
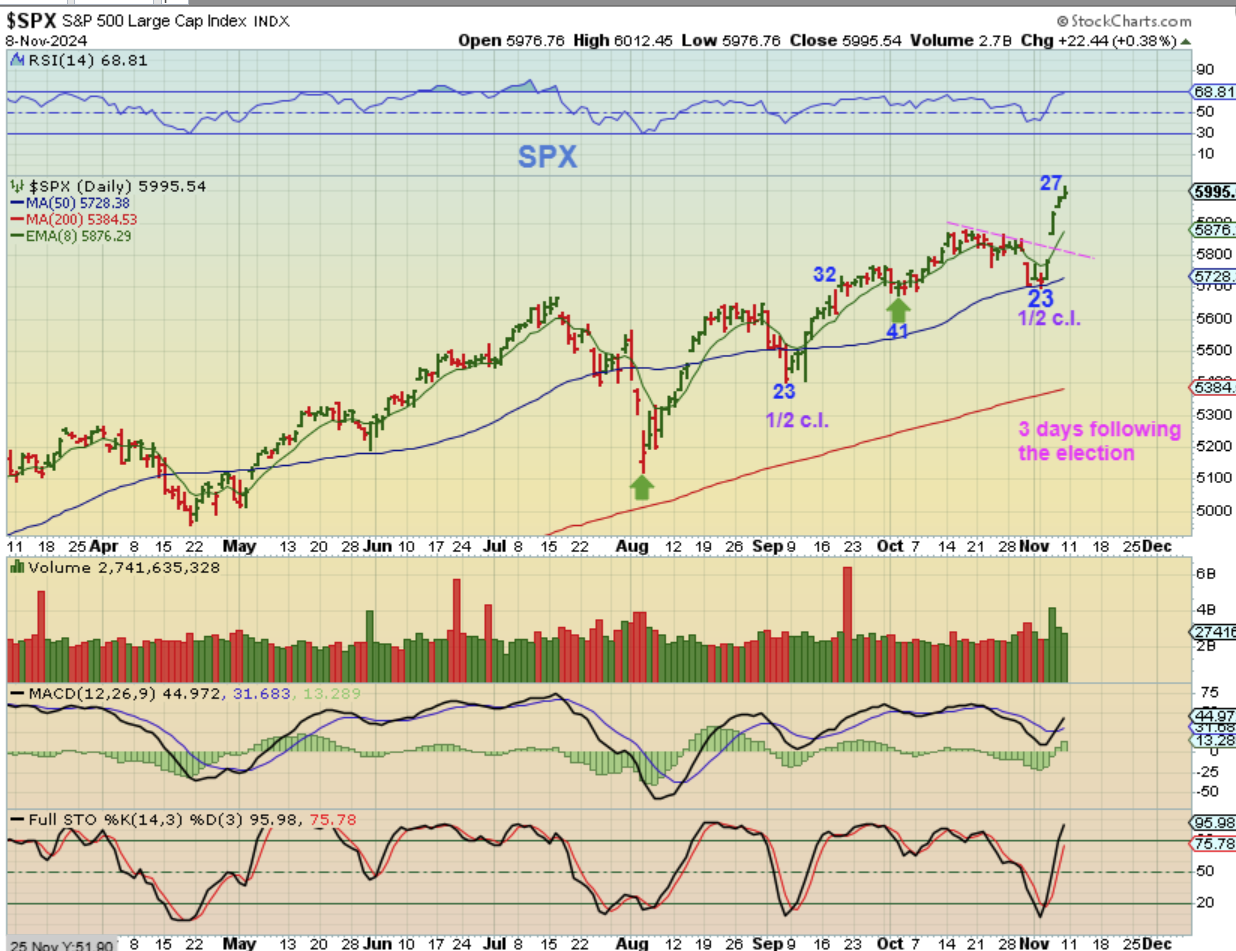
SPX DAILY– After the U.S. Elections, the markets gapped up and have gone straight up for 3 days. The last dcl came in on day 41 and if this follows in that path, then we would still have 2 weeks until we see a dcl here. How it gets to the next low is anyone’s guess.
.
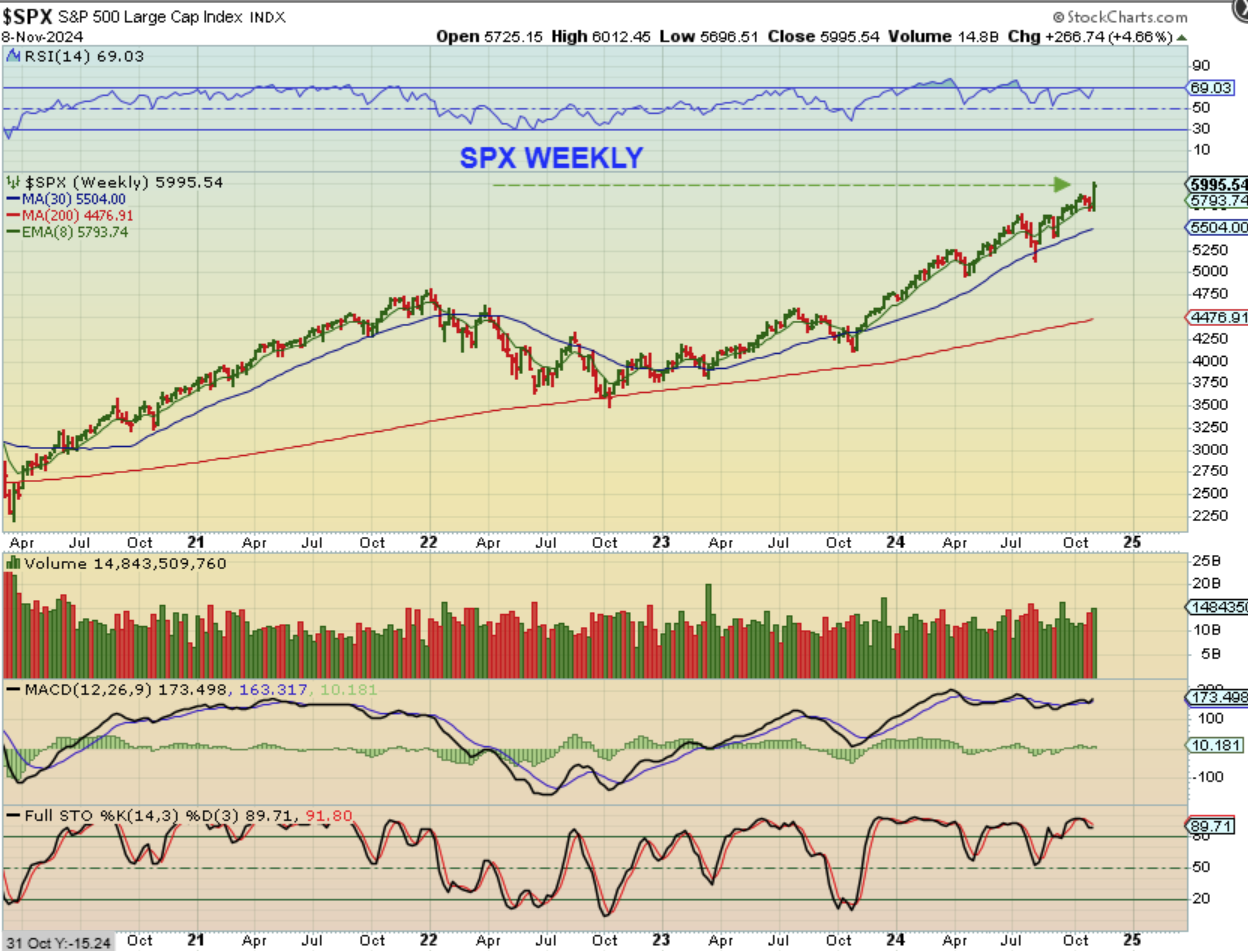
SPX WEEKLY: New all-time highs, a 4.66% rise, and hopefully it starts to chop or pullback a bit, so it doesn’t get into an unsustainable blow off top move.
.
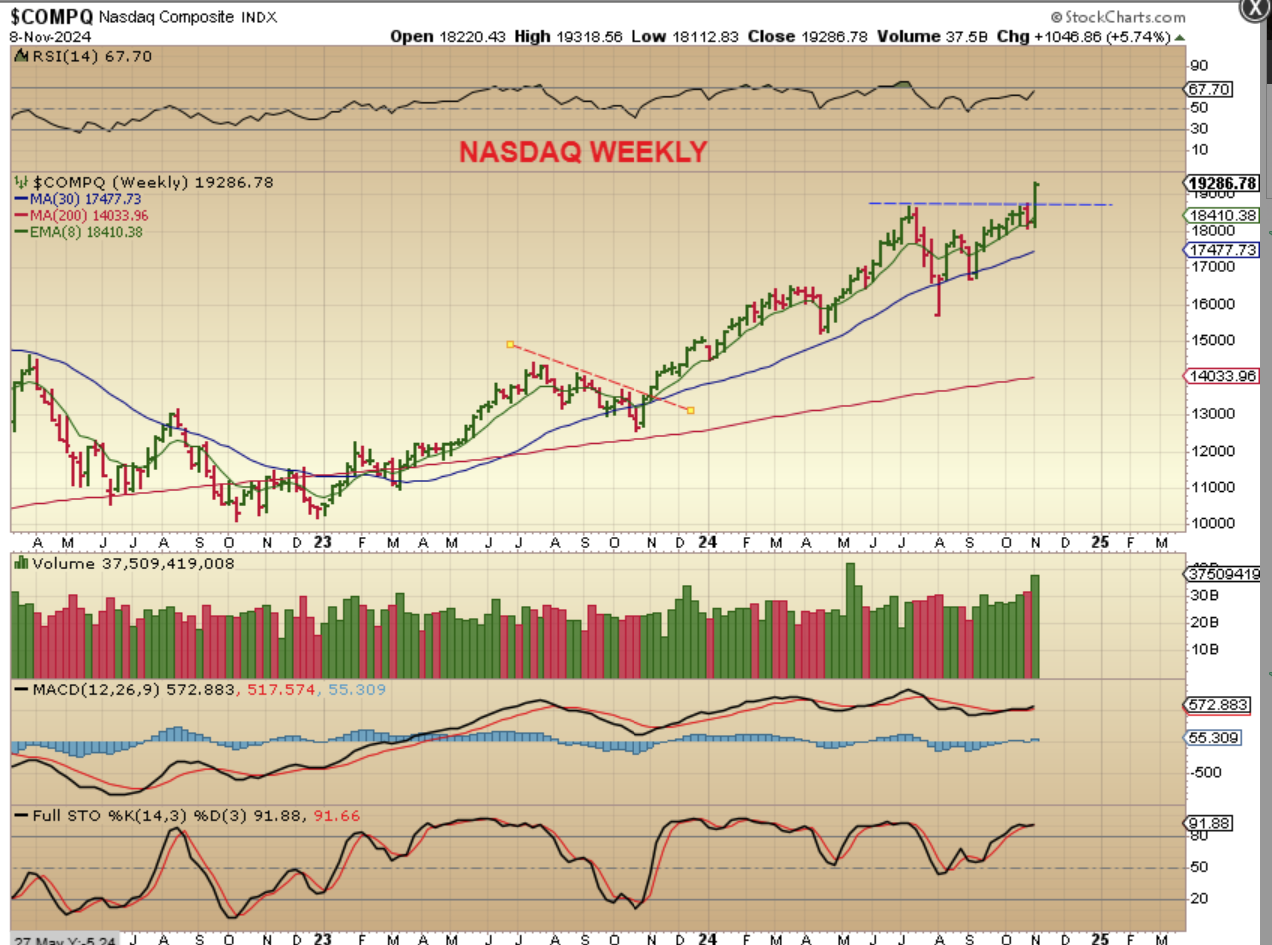
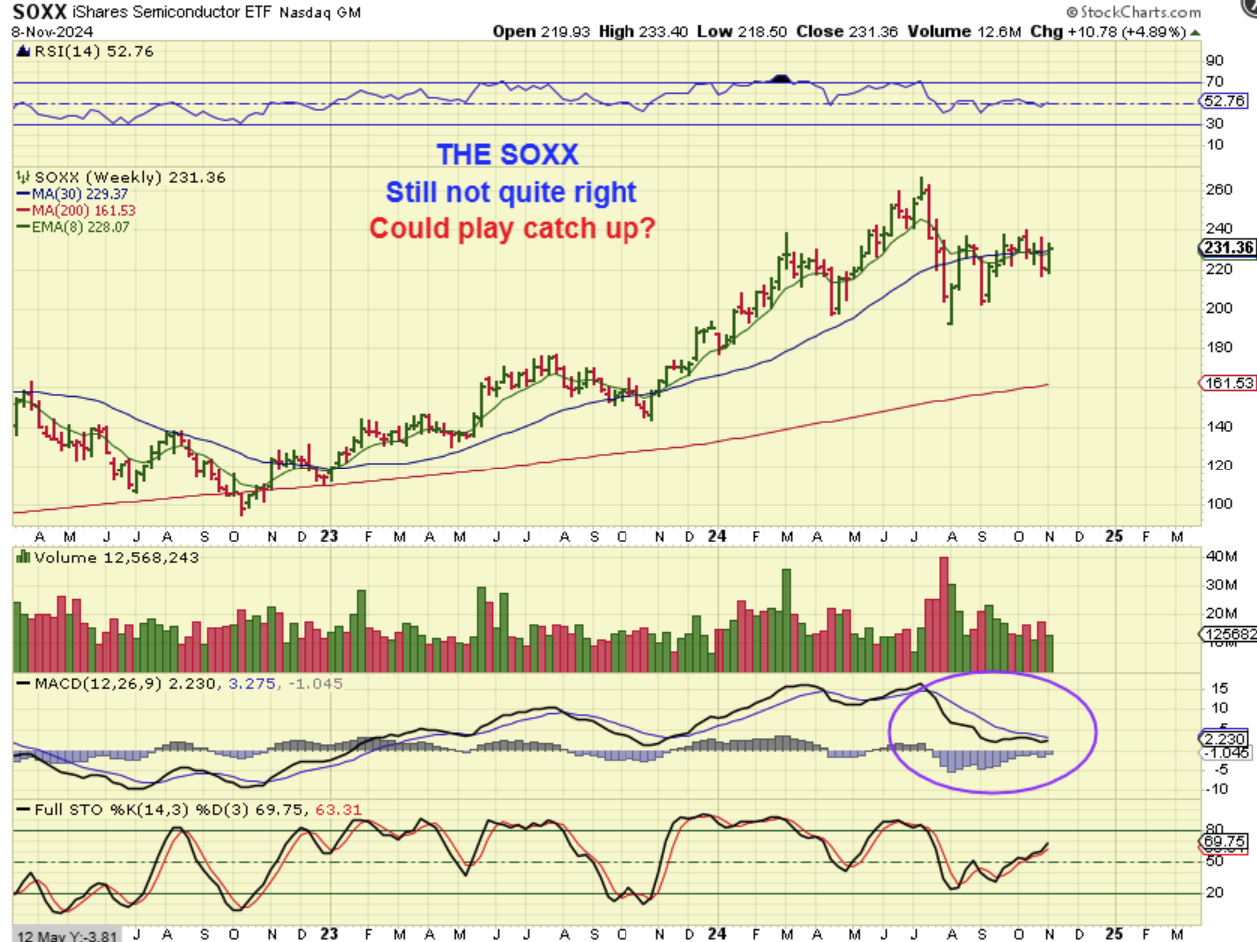
THE NASDAQ WEEKLY shows that the NASDAQ was up 5.74% and finally broke out to new all-time highs too, so it caught up to the SPX. Will the SOXX?
.
IF THE SOXX does play catch up, it will have a nice run in the SOXL, so the SOXX, SOXL, or some semiconductor stocks can be bought with a stop under this weeks lows or even here at the 30 week ma. I showed INTC and NVDA as bullish recently. With that said though, The SOXX did break down and showed a sign of weakness, so it was weak, but may be improving. The MACD & RSI on a weekly chart are showing improvement after this week.
.
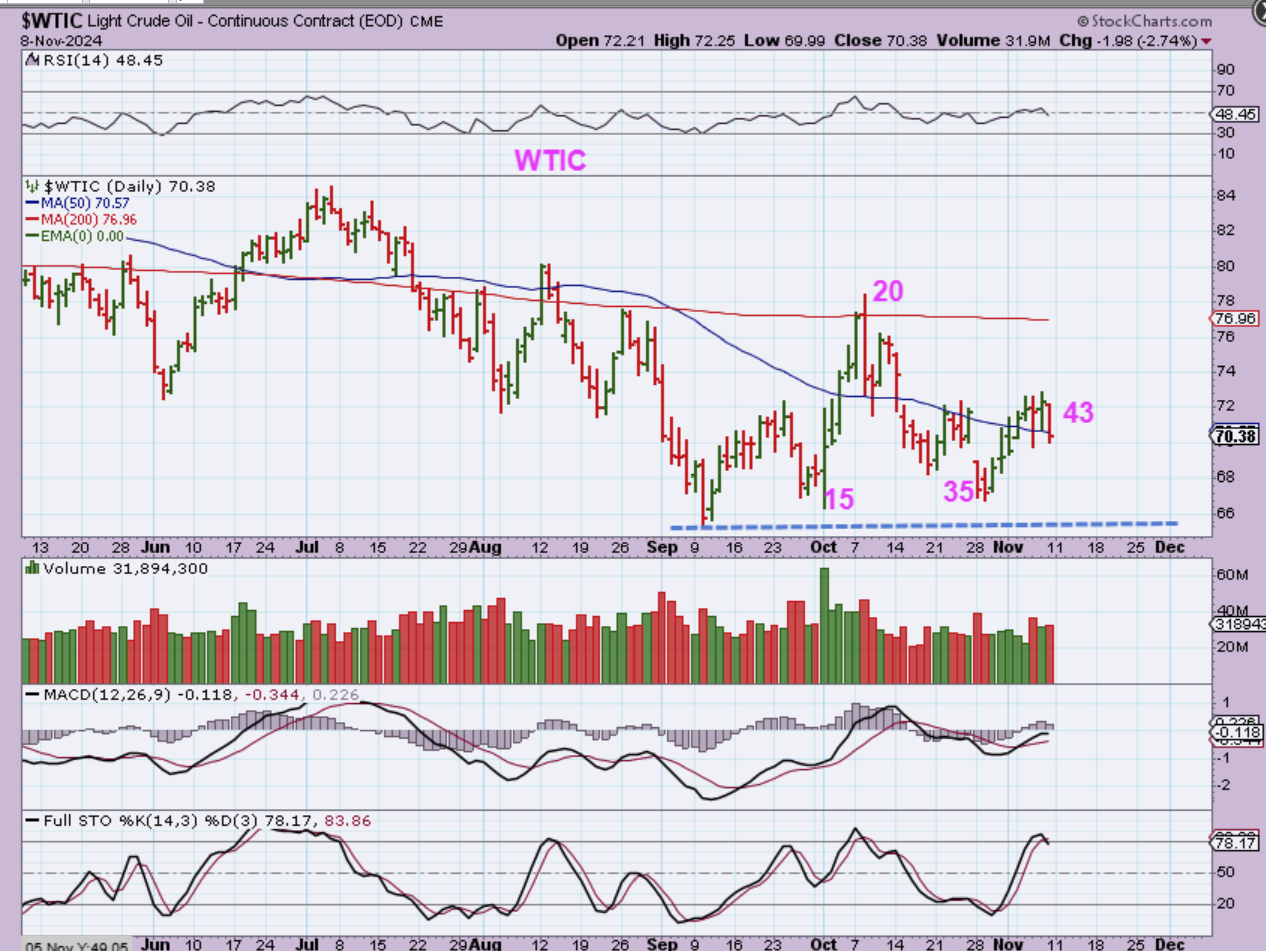
WTIC – Oil sold off on Friday and a dcl is now coming due at any time. The real question is, “Will it break the September lows or was that an ICL?” I tend to think that it will break lower. Why? A higher low forming above Septembers low would indicate that September was an ICL and that this was a choppy first daily cycle. I think that is unlikely, because this is already a L.T. cycle and first daily cycles are usually R.T. & stronger than that. I expect a drop below Septembers lows.
.
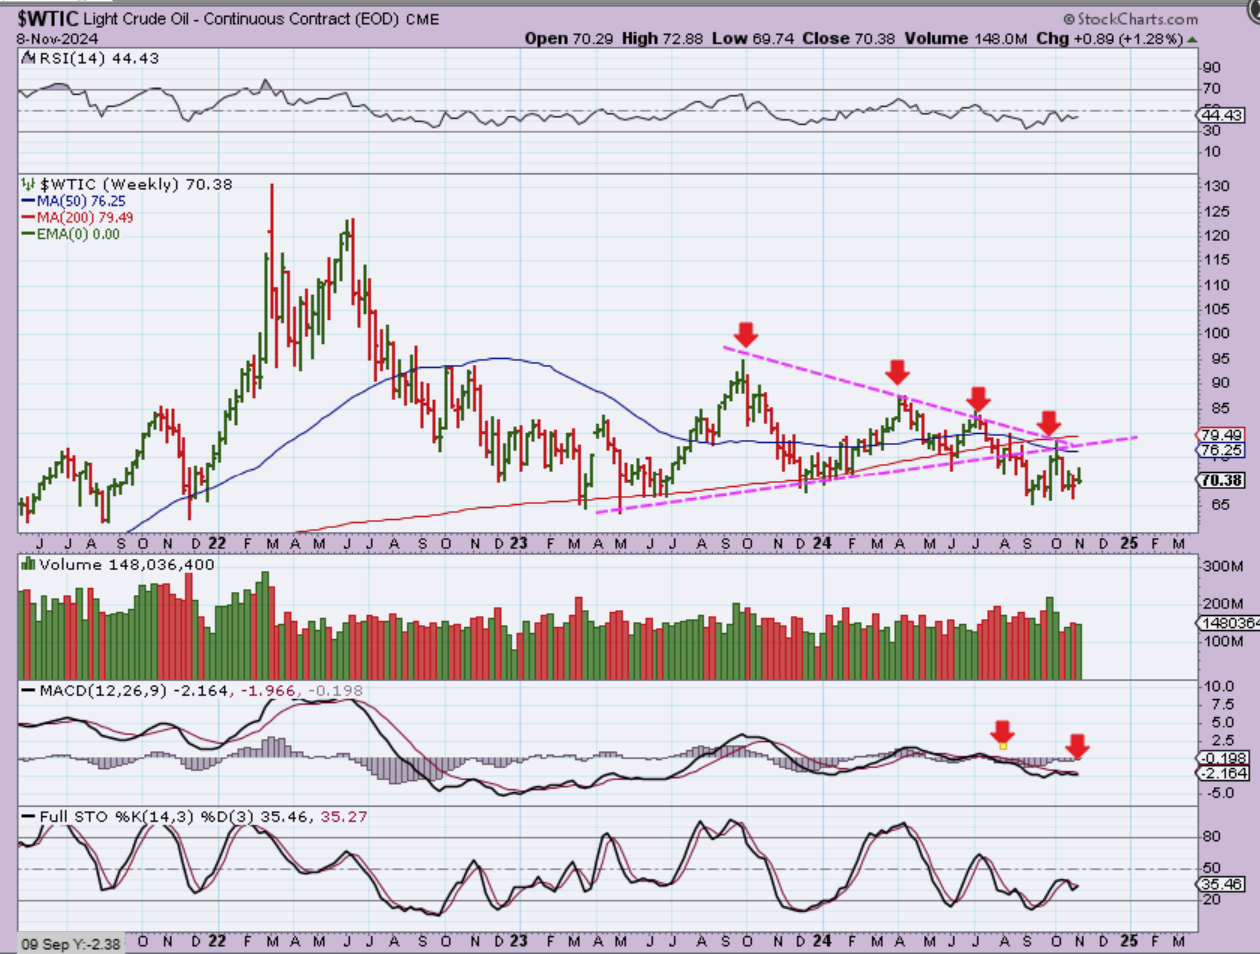
WTIC WEEKLY – A break below the September lows gives us a continuation of a new downtrend. Oil broke down from that triangle, back tested it with our current daily cycle peak, and now it threatens to continue trending lower. Will that continue with the current changes in the US elections? It actually could if price drops due to over drilling/production.
.
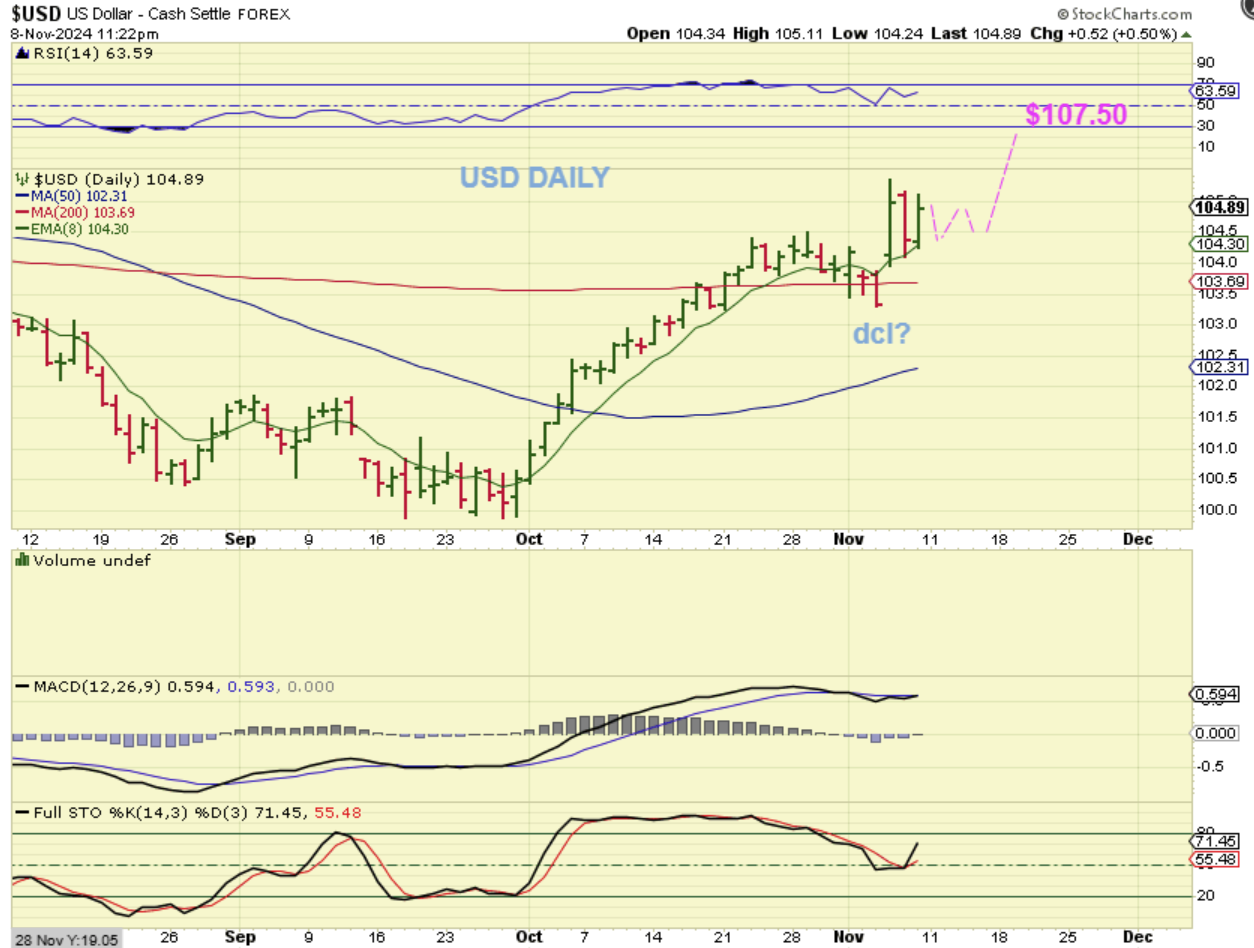
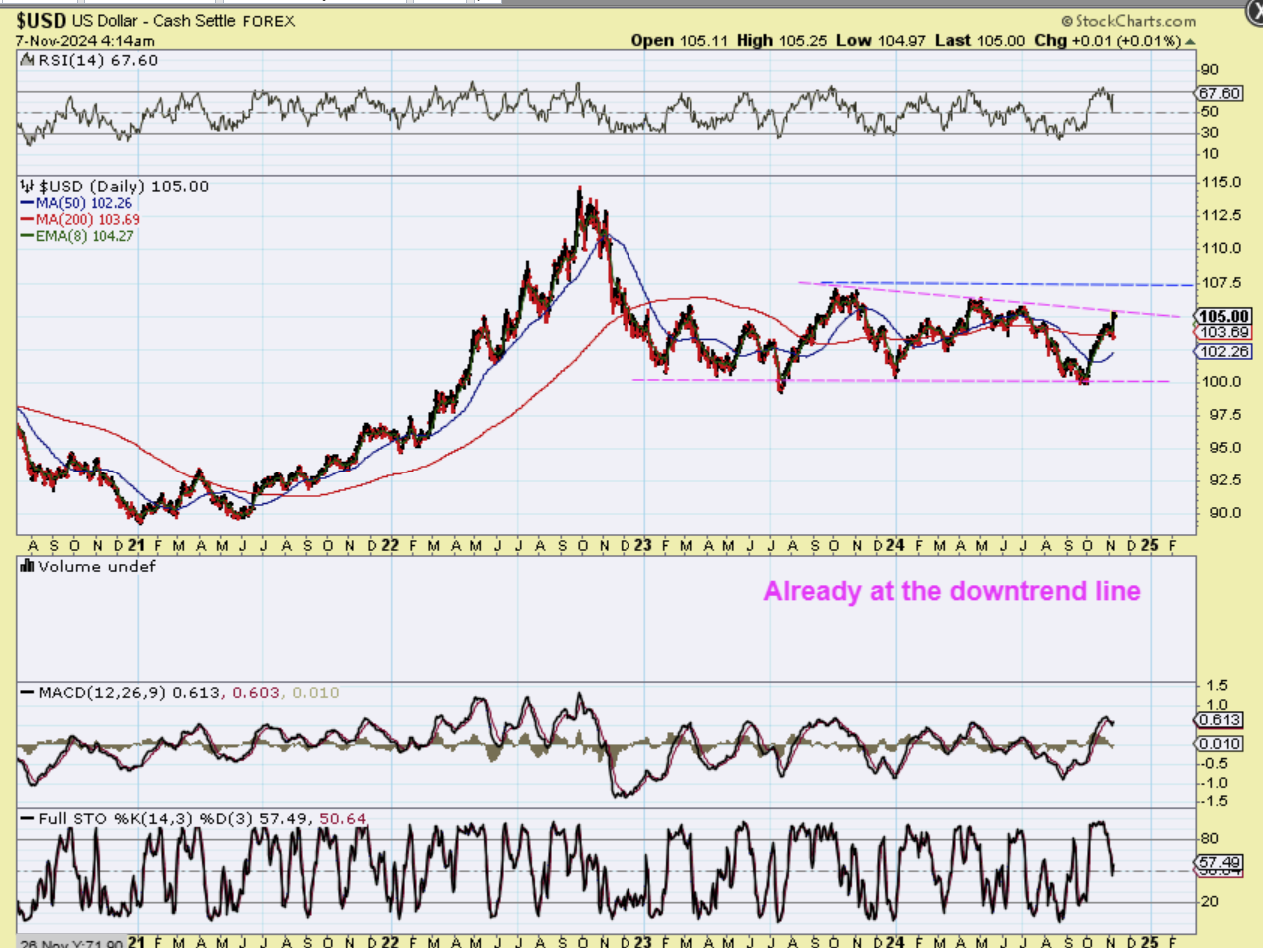
THE USD popped and dropped and popped again this week, so I see that it may be forming a large pennant at the 8 ema. If so, my target of 107.50 could be reached on the 2nd daily cycle.
.
FRIDAY I SHOWED THE $107.50 AREA WITH THIS CHART AND THE BLUE LINE.
.
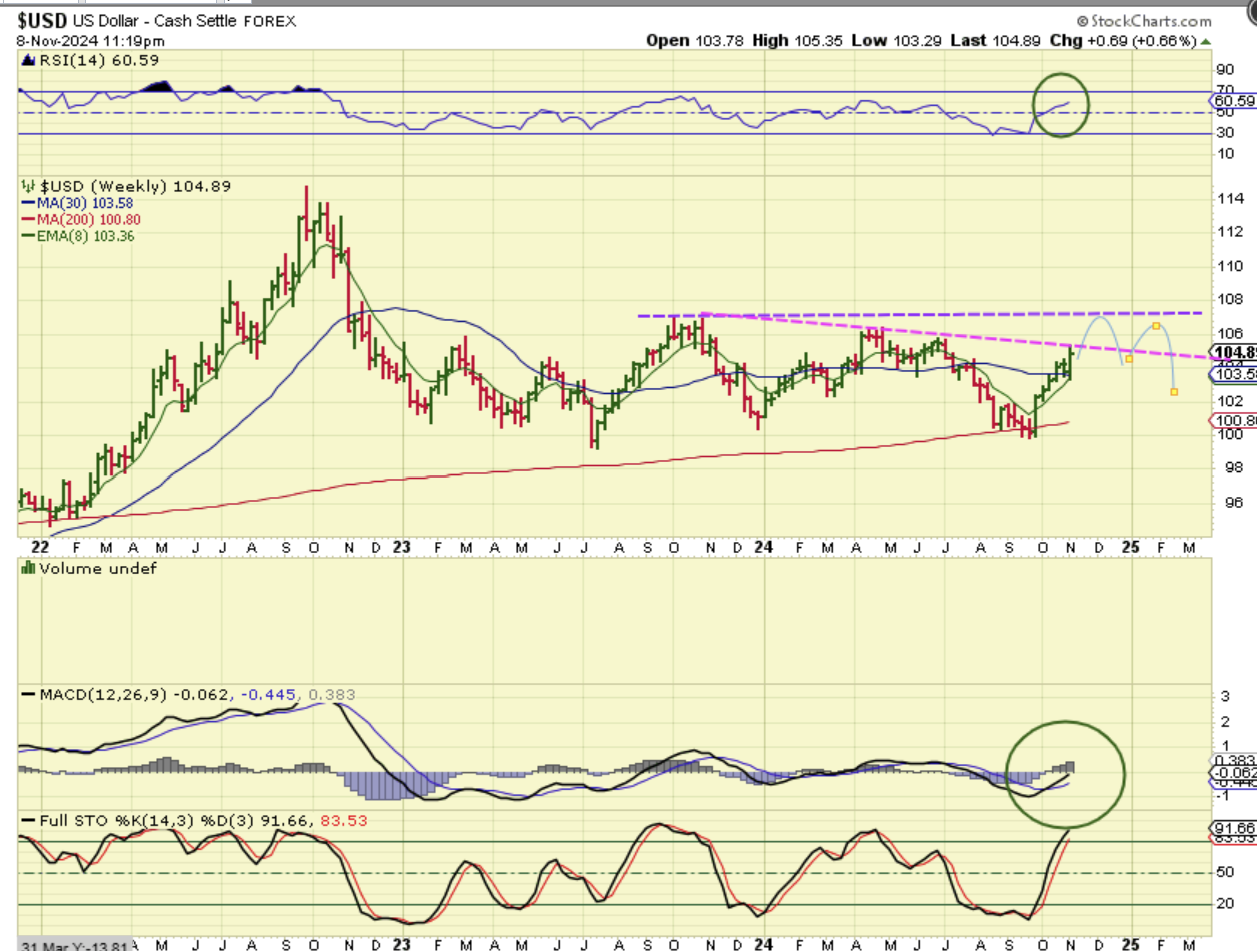
With an ICL in place for THE USD, it could take some time to peak out, so I drew it with a peak in December and we’d also see an ICL in Gold around that time.
.
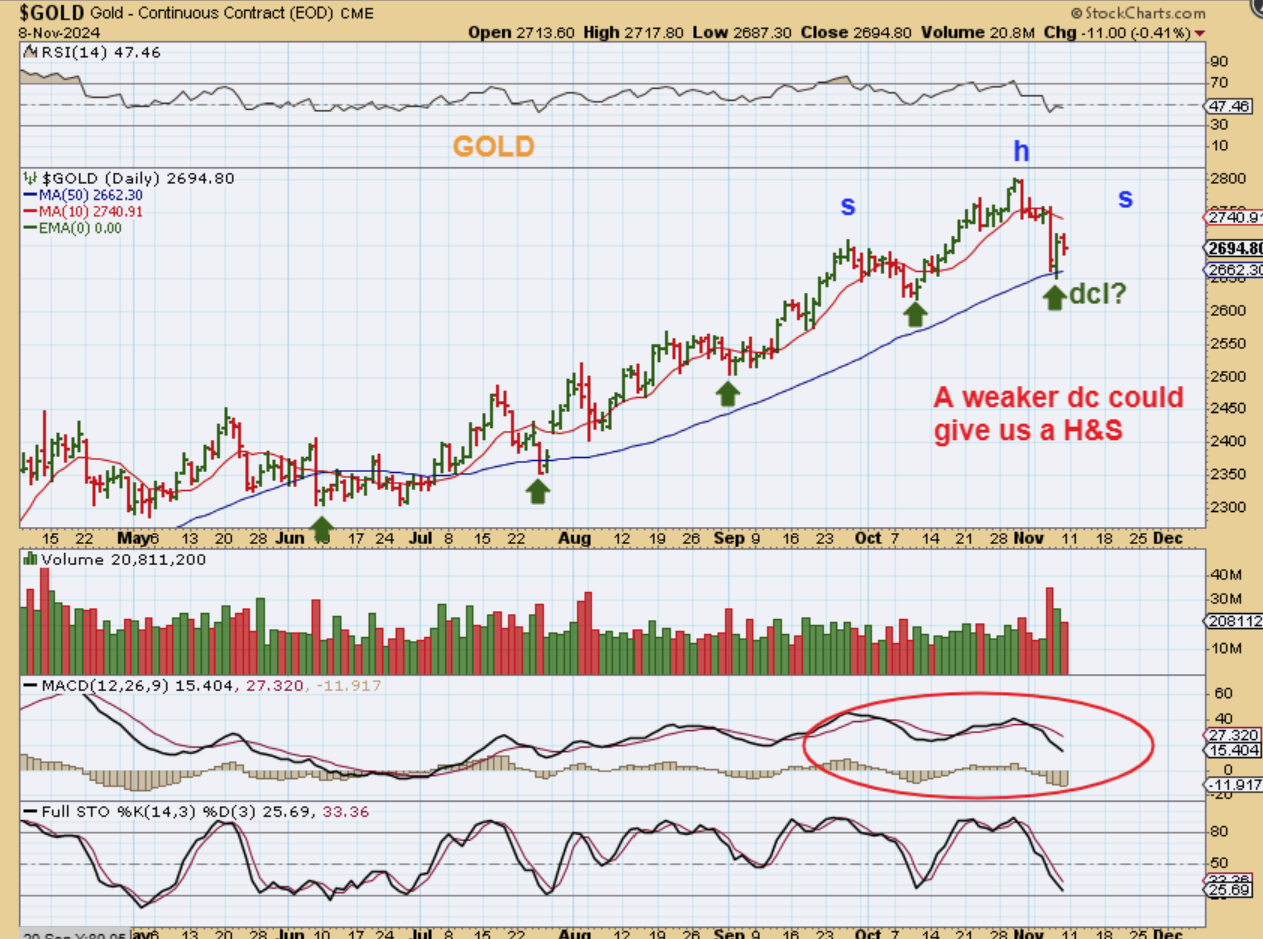
GOLD dropped to the 50sma on Wednesday, bounced on rate cut Thursday and stalled on Friday. This could be a dcl and if it just meanders around, then we could see a right shoulder form, as drawn here. This has been a great run for Gold.
.
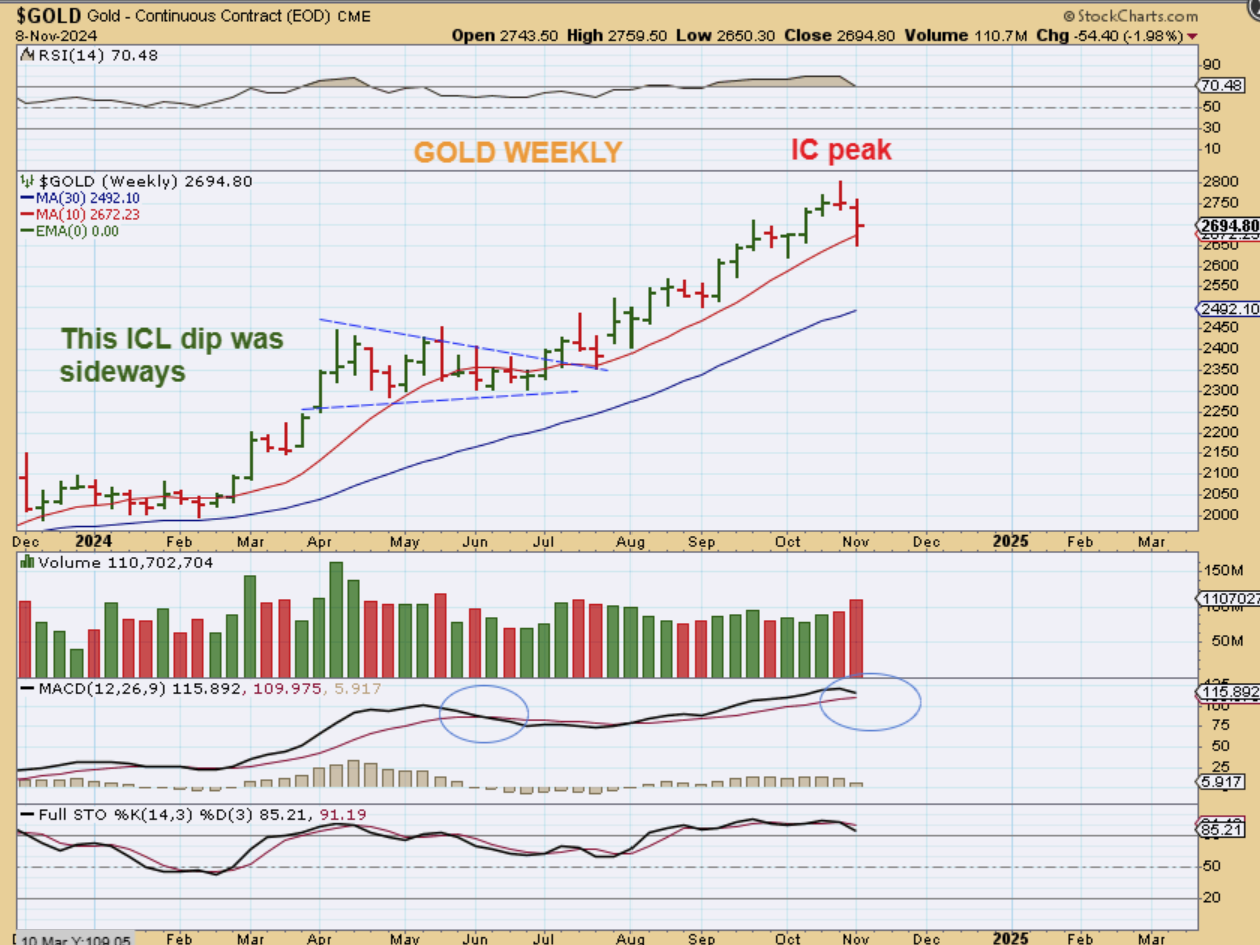
GOLD WEEKLY– Gold can chop around for a while and it should be due for an eventual dip into an ICL. The last drop into an ICL was a mild sideways triangle.
.
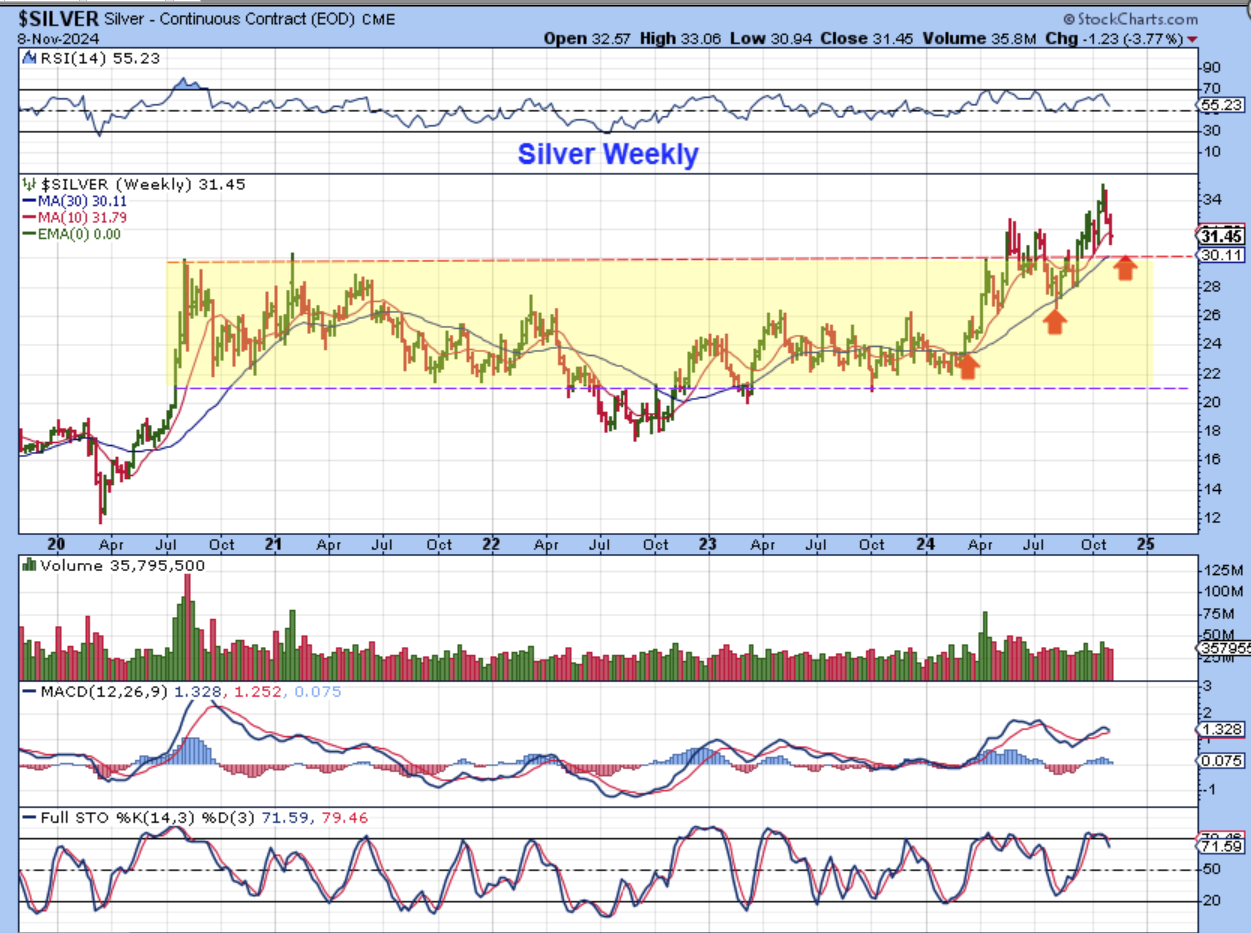
Even on the Weekly chart we see that SILVER has had wide swings in the 2024 rally this year.
1. Silver could rally without Gold, because Gold rallied higher with put Silver, or
2. Silver may get choppy, move sideways, and start to sync up with Golds ICL over time.
.
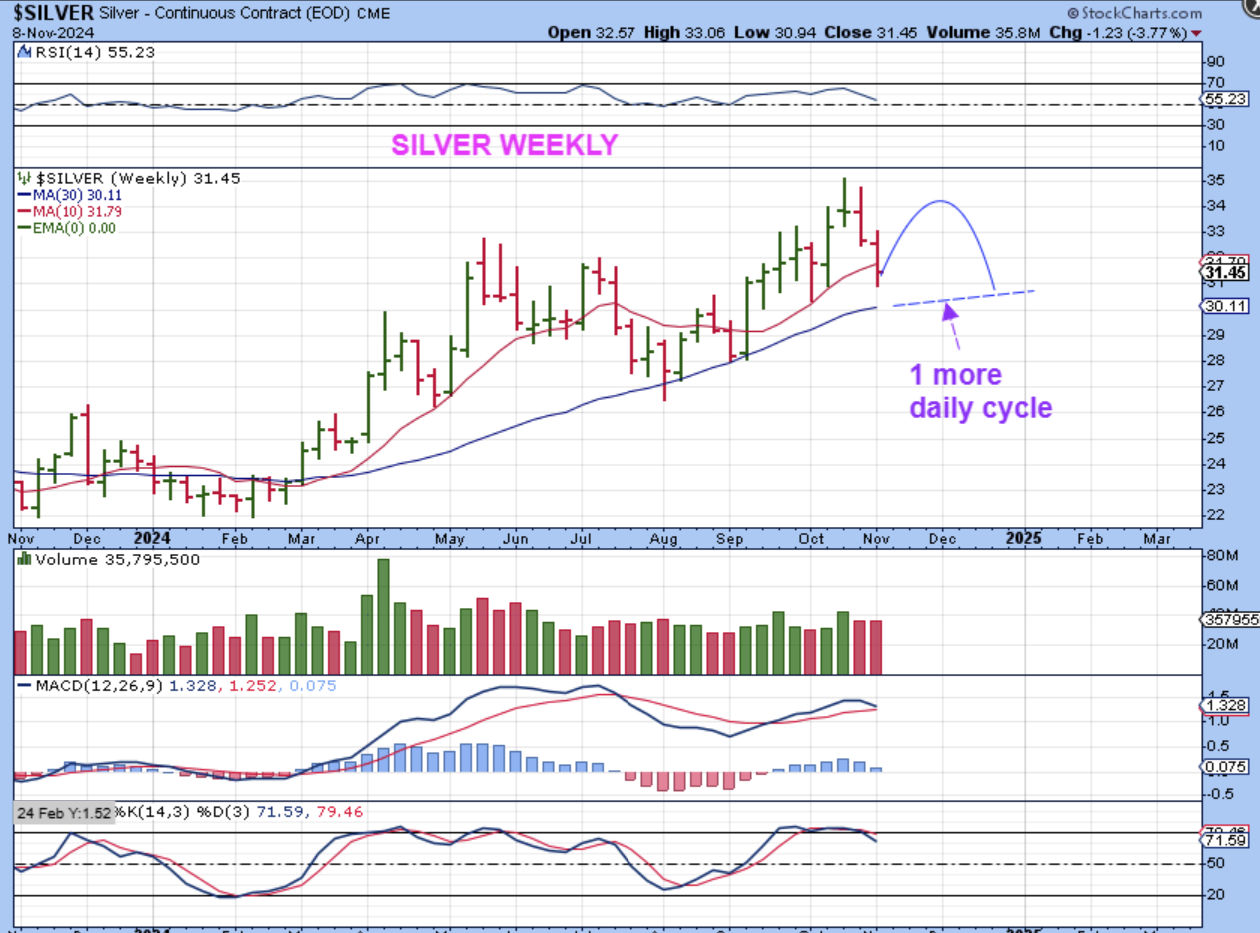
SILVER WEEKLY – Our current daily cycle (the 3rd for Silver) is now L.T., so we can get one more daily cycle that becomes the drop into an ICL and hopefully it syncs up with Gold and we get a string rally for Silver out of that low. I think that Silver stocks will become a strong buy in late November or early December if the ICL forms there.
.
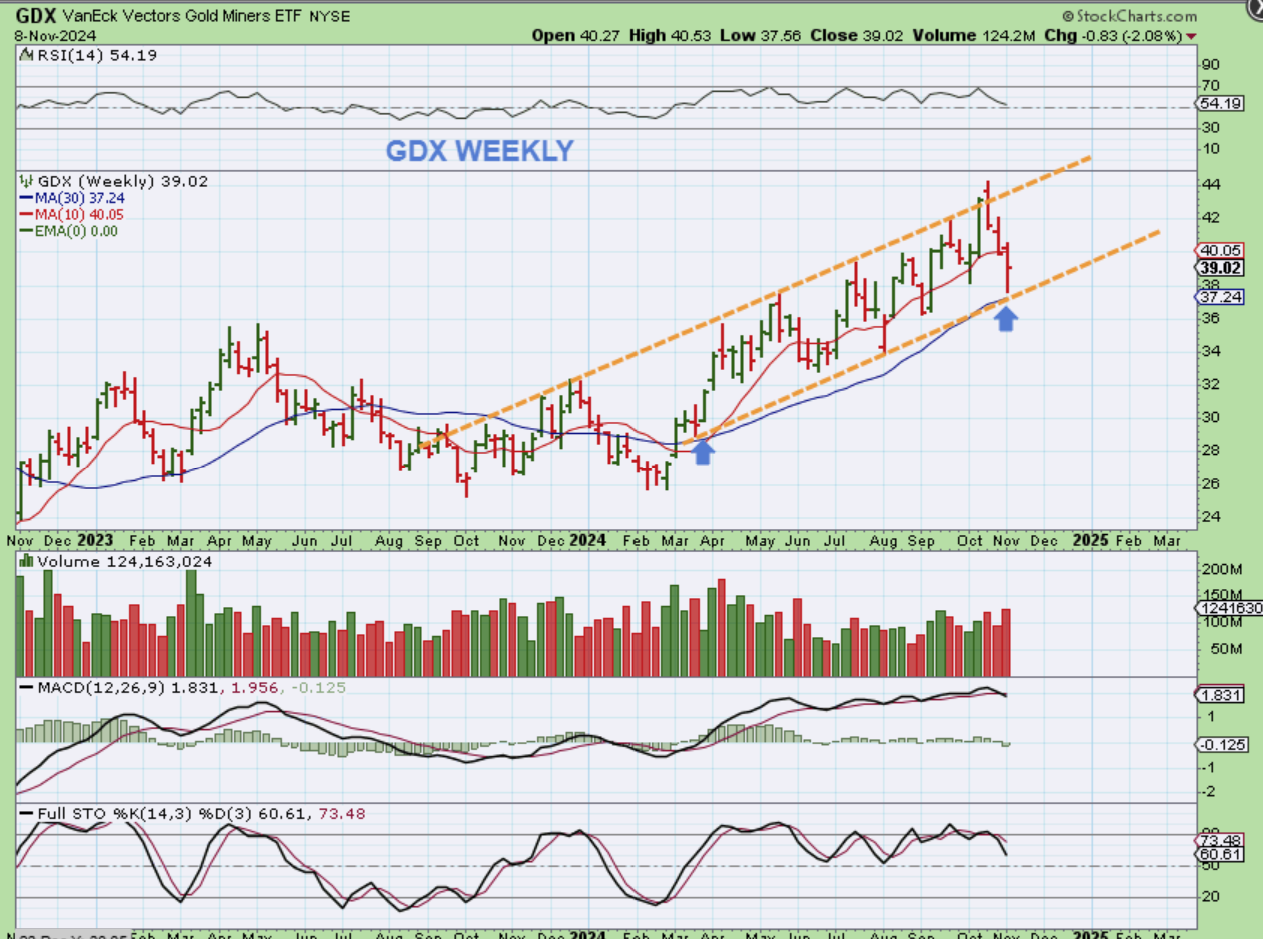
GDX had a steeper drop over the last 3 weeks. Hopefully just one more daily cycle with GDX will give us a bounce and a final low around this area too. We could lose the channel and regain it as an ICL shake out, so I’ll be looking for that in a few weeks.
.
This was going to be a week of reactions and volatility and that is what we saw. In fact, in some cases it looked like an overreaction.
1. The General Markets Popped higher and had follow through with the Jobless Claims Report and Fed rate cut.
2. The USD popped on election results, dropped on a rate cut, and moved up again on Friday. I think it is in a 2nd daily cycle.
3. Oil is choppy and on day 43 it is now due to drop further into a dcl.
4. Gold, Silver, and Miners may be forming a dcl when they dropped sharply on Wednesday, bounced on Fed Thursday, and stalled on Friday. I expect a bounce that is followed by a drop into an ICL, maybe in December. A strong buy will result from that sell off.
5. Bitcoin broke out this week, I’ll discuss that below.
.
Enjoy your weekend, and even though Monday is a bank holiday in the U.S., the Markets are open. Have a great weekend!
.
~ALEX
.
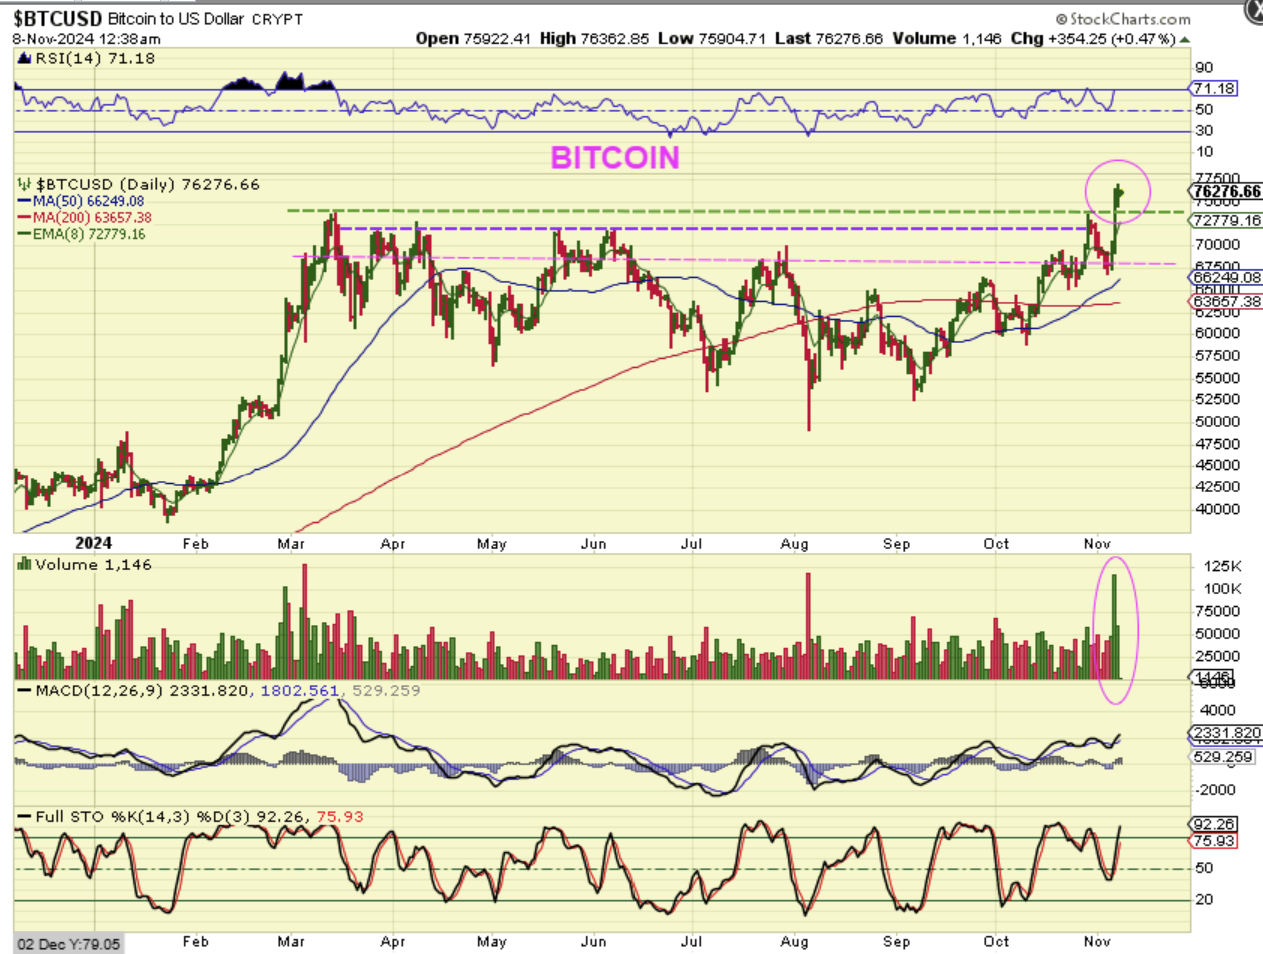
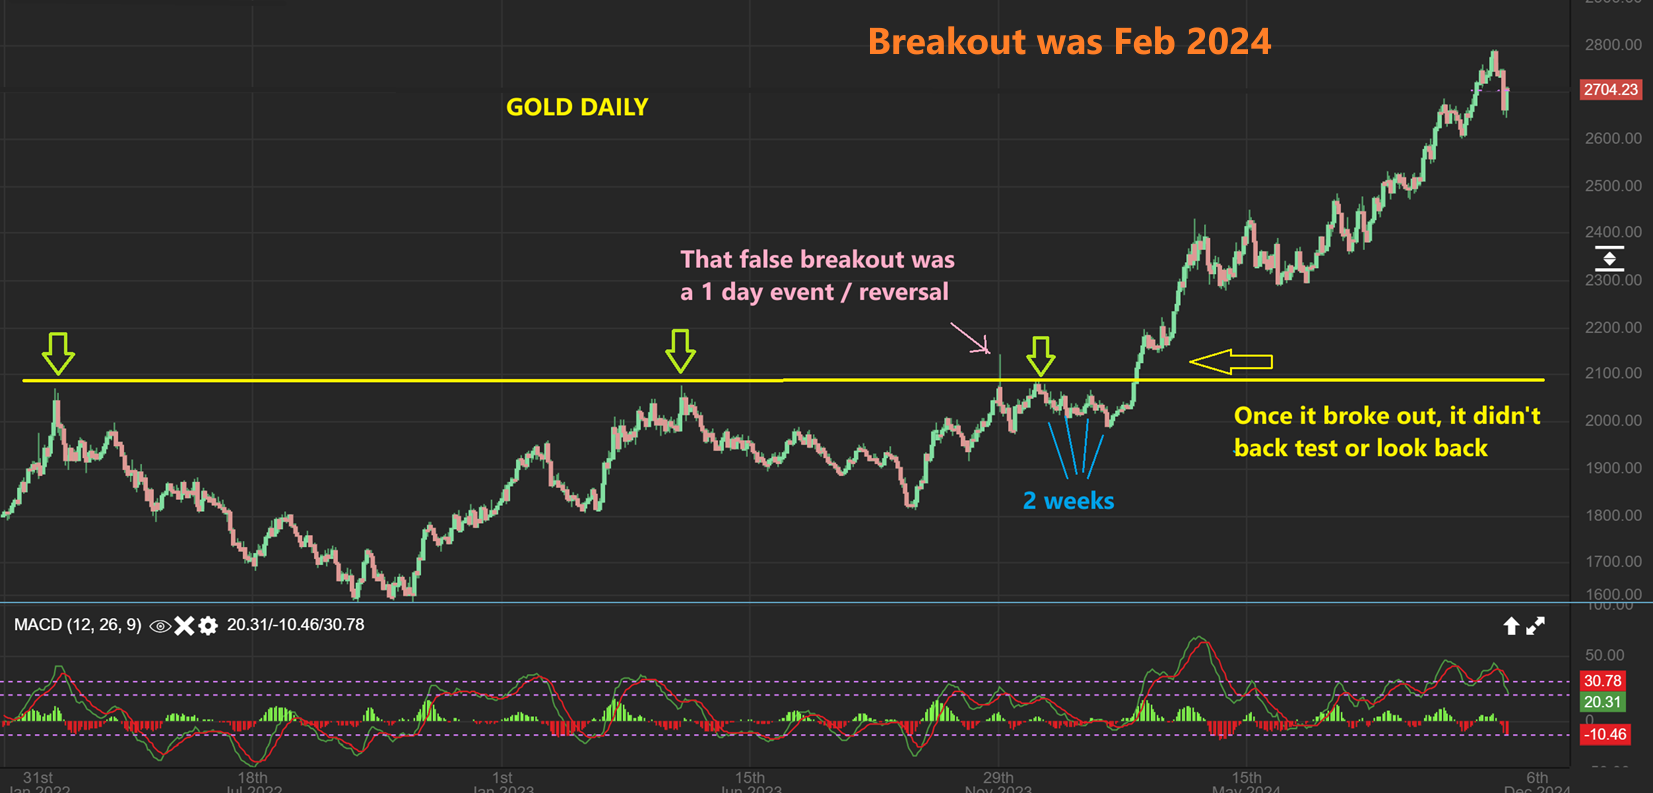
BITCOIN – On Friday I wanted to remind you that Bitcoin has now rallied to a breakout to new all-time highs. We often see a ‘back-test’ after a breakout, and that would be around the $72,000 – 73,000 area, however…
.
Once Gold broke out, it did NOT make a back-test due to the strength of the coming move. So with this chart I am simply saying that Bitcoin may back-test on the next dcl, but it also may not. It could just put in a bull flag or a pennant and then keep going. With this breakout of Gold to new all-time highs in February 2024, I showed that the Miners also ran up and never pulled back, so that breakout was the lowest entry for Miners since February.
.
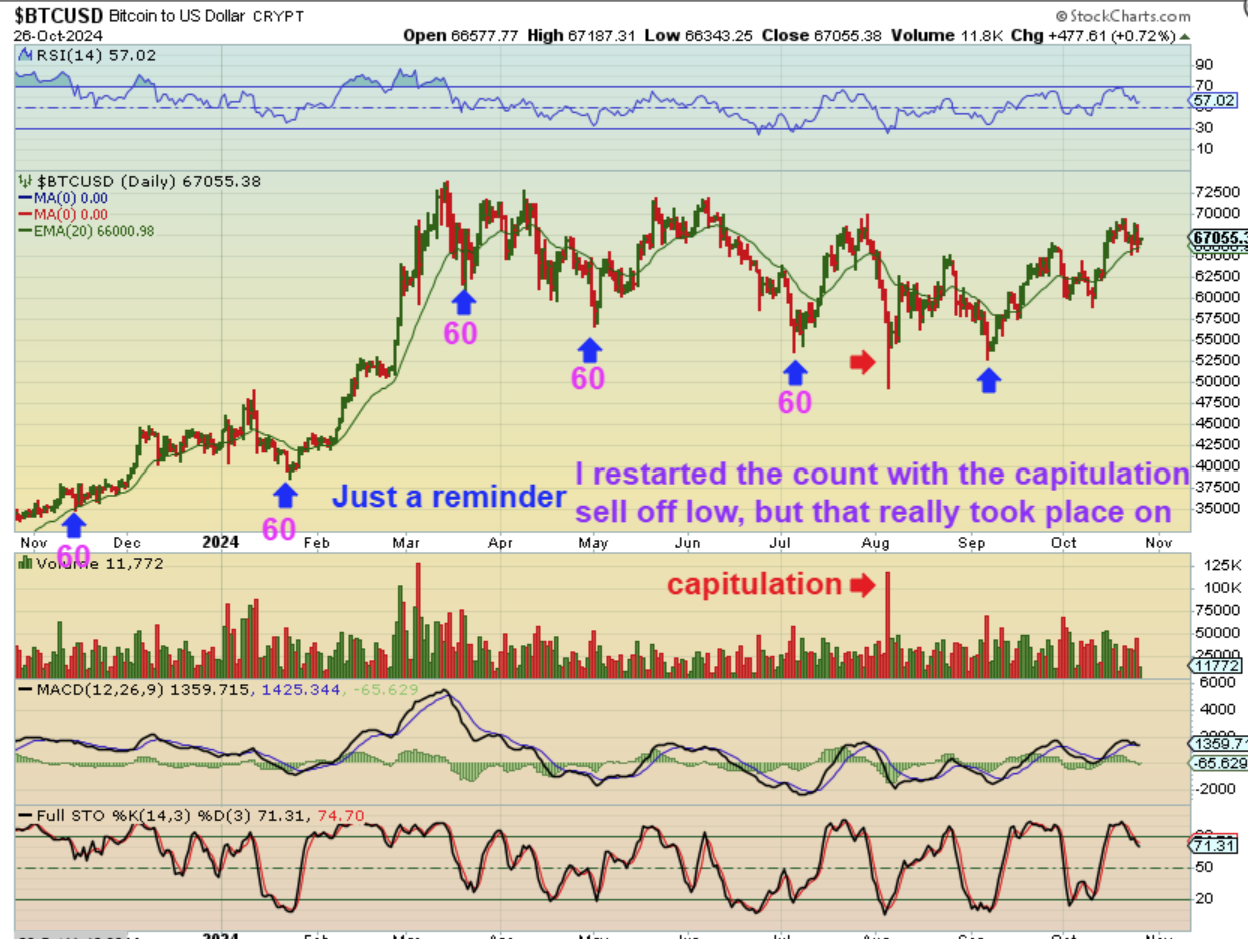
ANOTHETR THING THAT I POINTED OUT TO YOU IN ADVANCE WAS THAT BITCOIN WAS DUE FOR A LOW THIS WEEK, NO MATTER HOW I COUNTED IT OUT.
I USED THE FOLLOWING 2 CHARTS FROM OCT 26 TO SHOW THAT.
.
With this original count that I had before the Capitulation low, I showed a low near day 60 at the 20 ema was due. Even though I didn’t draw it as a breakout, it was showing that low was due this week near the 20 ema.
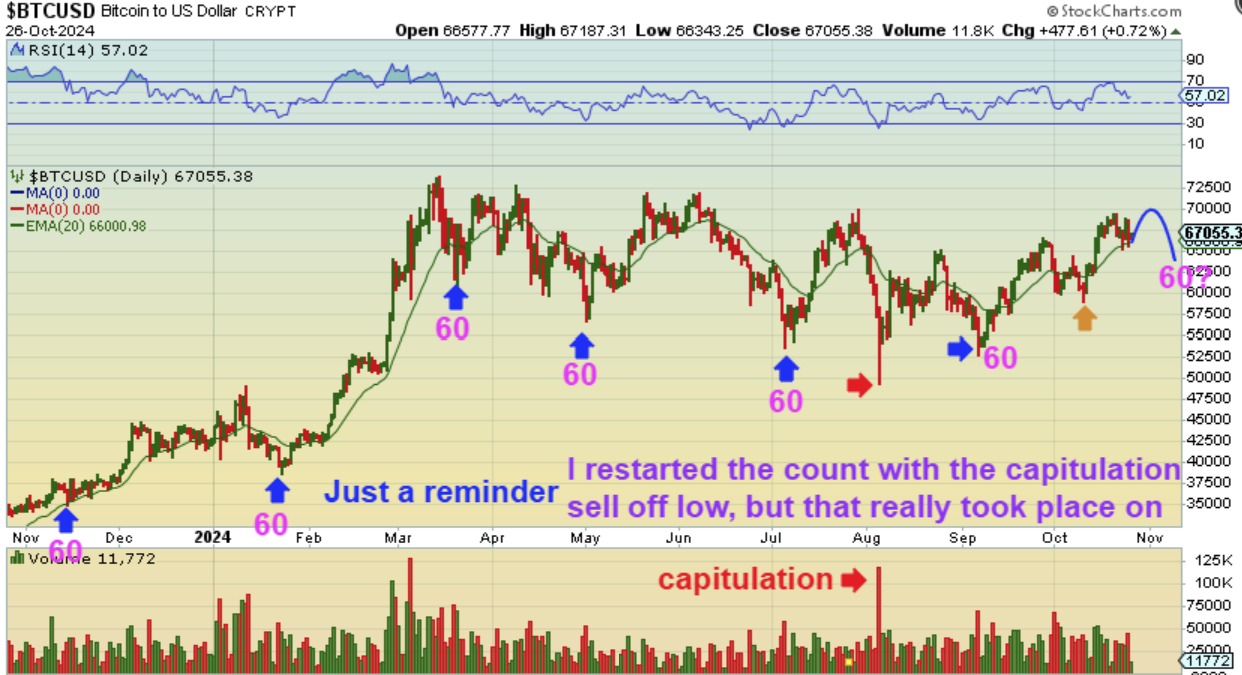
I then showed the slam down capitulation low as a possible re-start for my count, but we still would be due for a low, because it would be day 30…
.
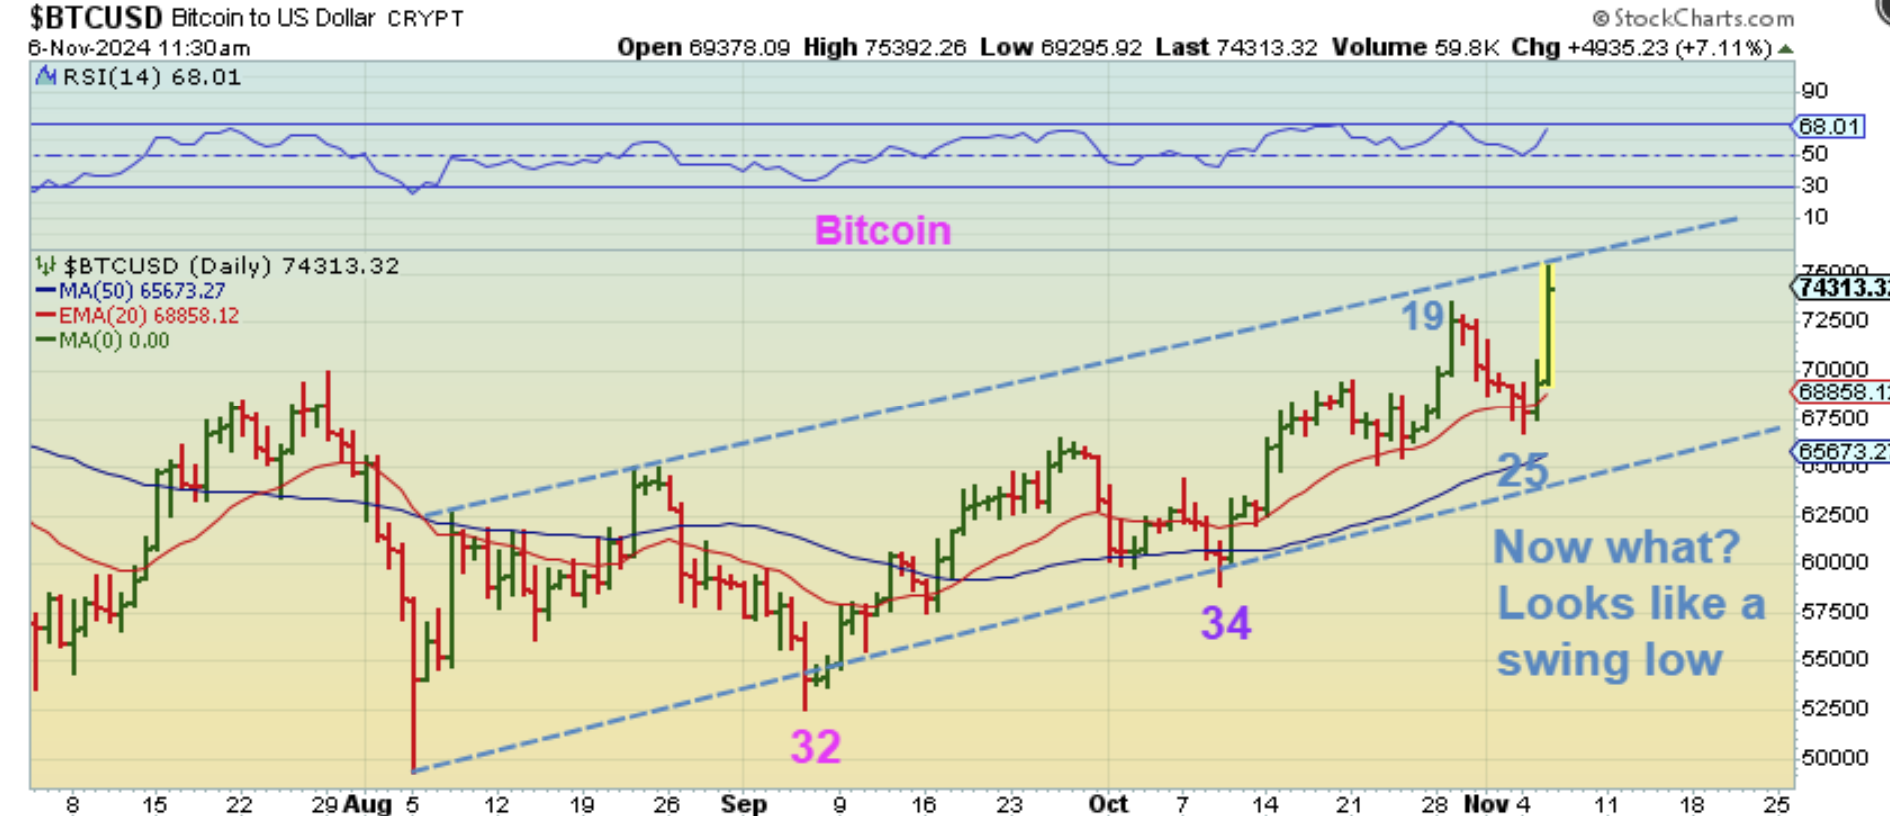
Using only 30-day intervals from that capitulation low, which is when the lows due come due for Bitcoin, I also showed that the day 25 swing low could be that dcl. So this would only be day 2 as it started to breakout.
.
I have pointed out these similarities in past reports.
.
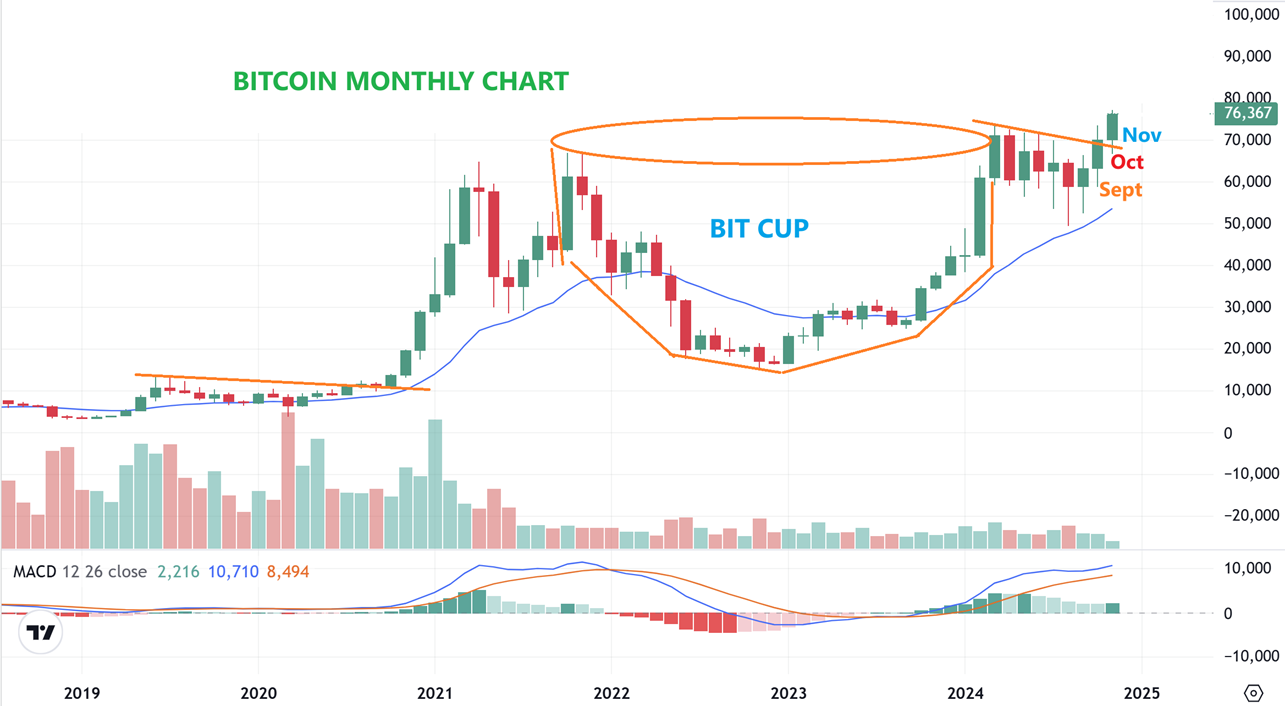
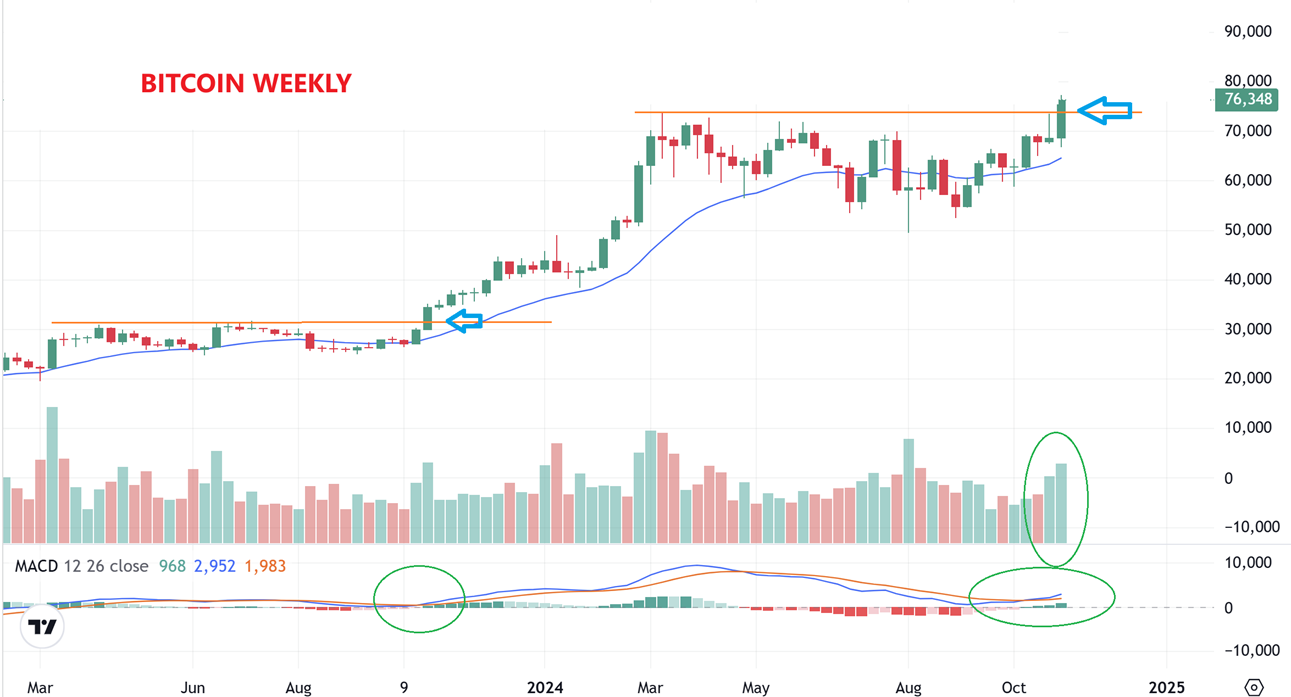
BITCOIN WEEKLY – Here I am comparing Bitcoins breakout with the last breakout in 2023, when we saw Bitcoin cross the orange line above the consolidation in October. With that breakout, Bitcoin also had a weekly MACD cross and it ran higher until March. October to march is a long rally. We also just broke out in October 2024 and this could run for months too.
.
BITCOIN MONTHLY – In that 2023 run, we saw months of steady gains and we also currently have 3 straight months of gains leading into this current breakout. We have a massive cup and handle breakout like we saw with Gold, and the Miners in Gold made great gains following that breakout. I expect the same with Crypto mines and actually, many of the ones that I have been featuring in the reports since September have already doubled. I expect more over time.