November 2nd Weekend Report – When Do We Buy The Dip?
We have a week of guaranteed volatility ahead, with the U.S. Elections on Tuesday (results on Wednesday), and the FOMC Meeting on Wednesday and Thursday, Rate Cut Decision released at 2 p.m. Thursday, followed by the Fed Speech.
.
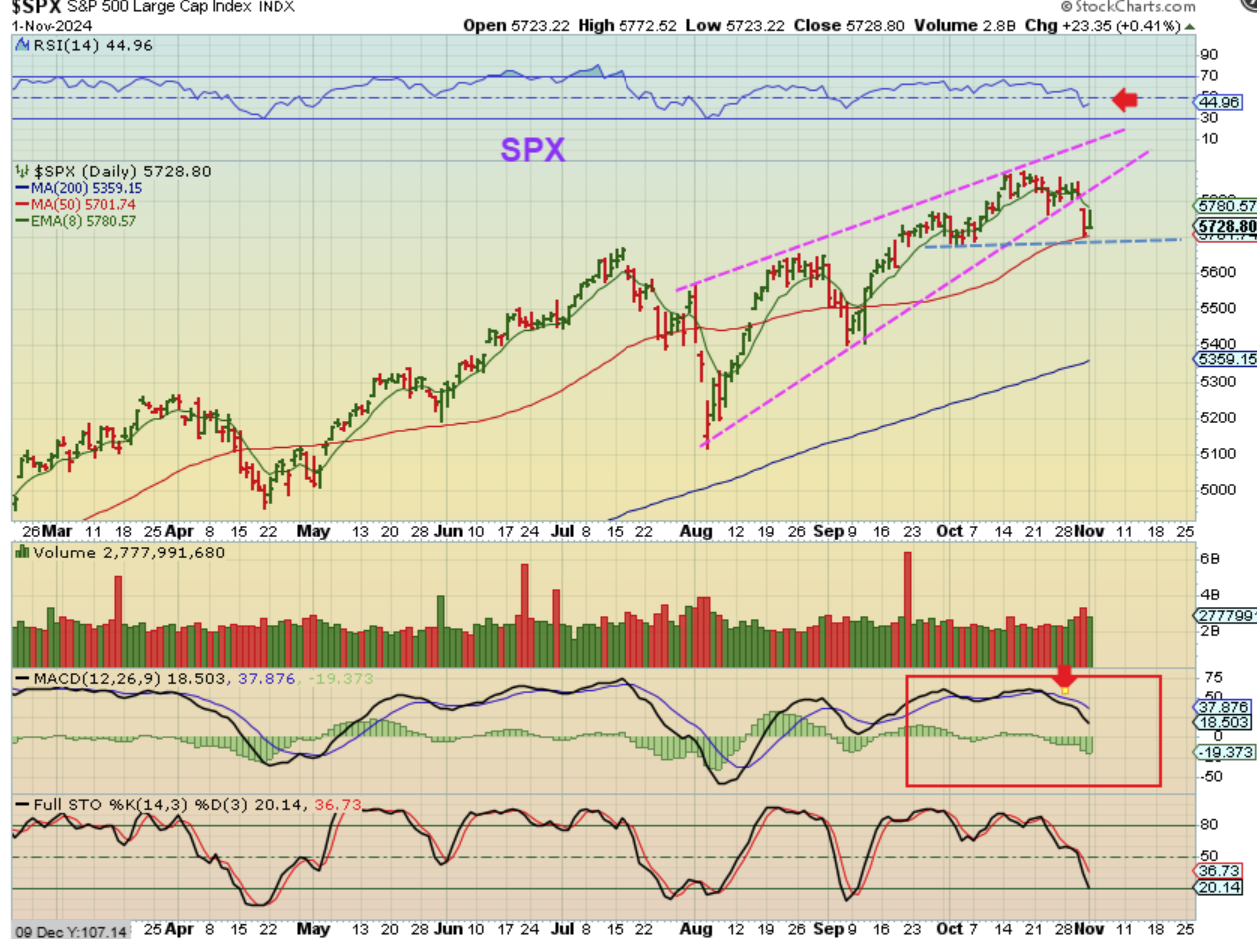
SPX DAILY – The SPX sold off last week, but found support at the 50sma. Based on the SOXX and the weak RSI & MACD here, we should expect more selling.
.
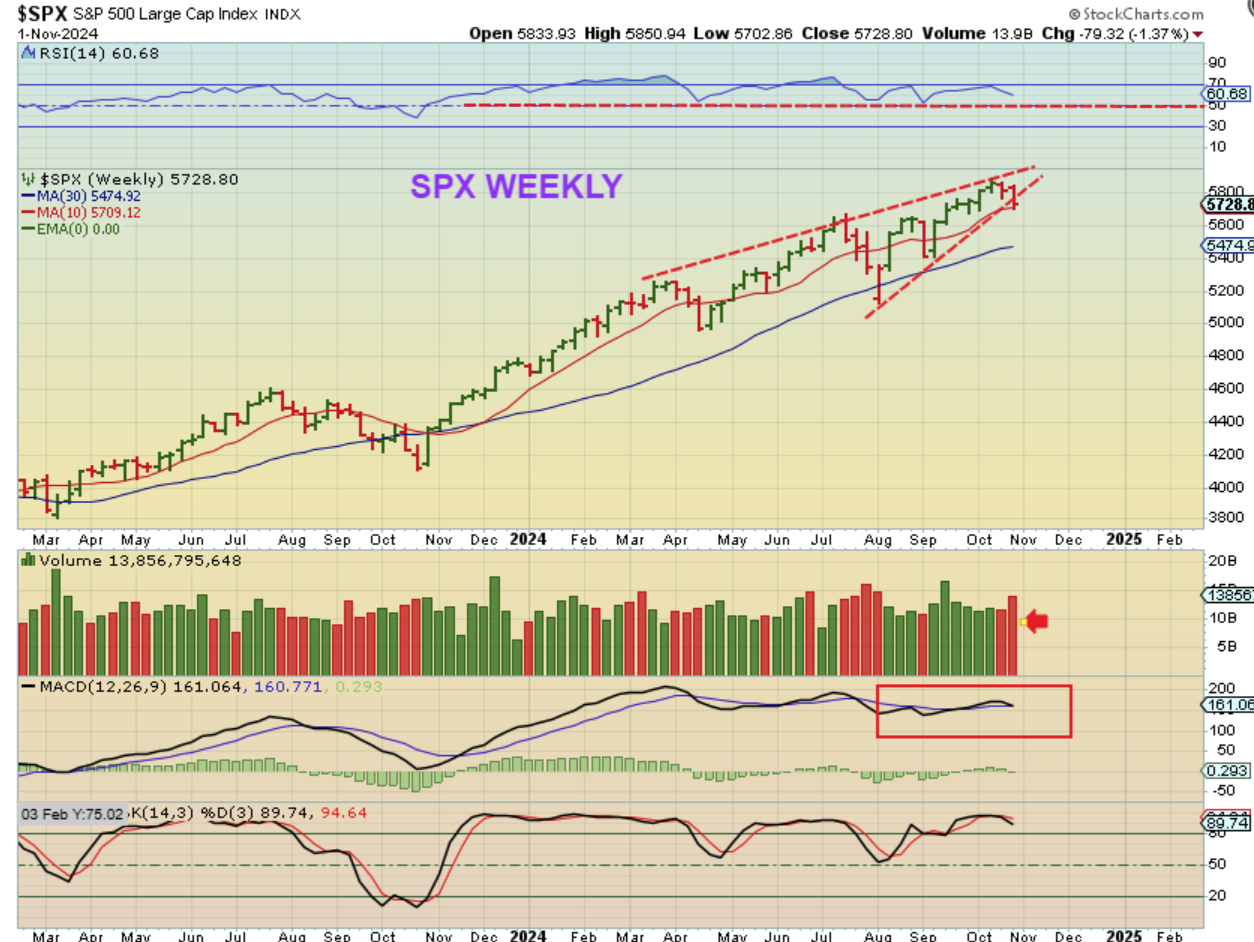
SPX WEEKLY – This looks like a bearish rising wedge and the sell off last week had heavy volume. This is going to be a volatile week and at this point I’m expecting more selling.
.
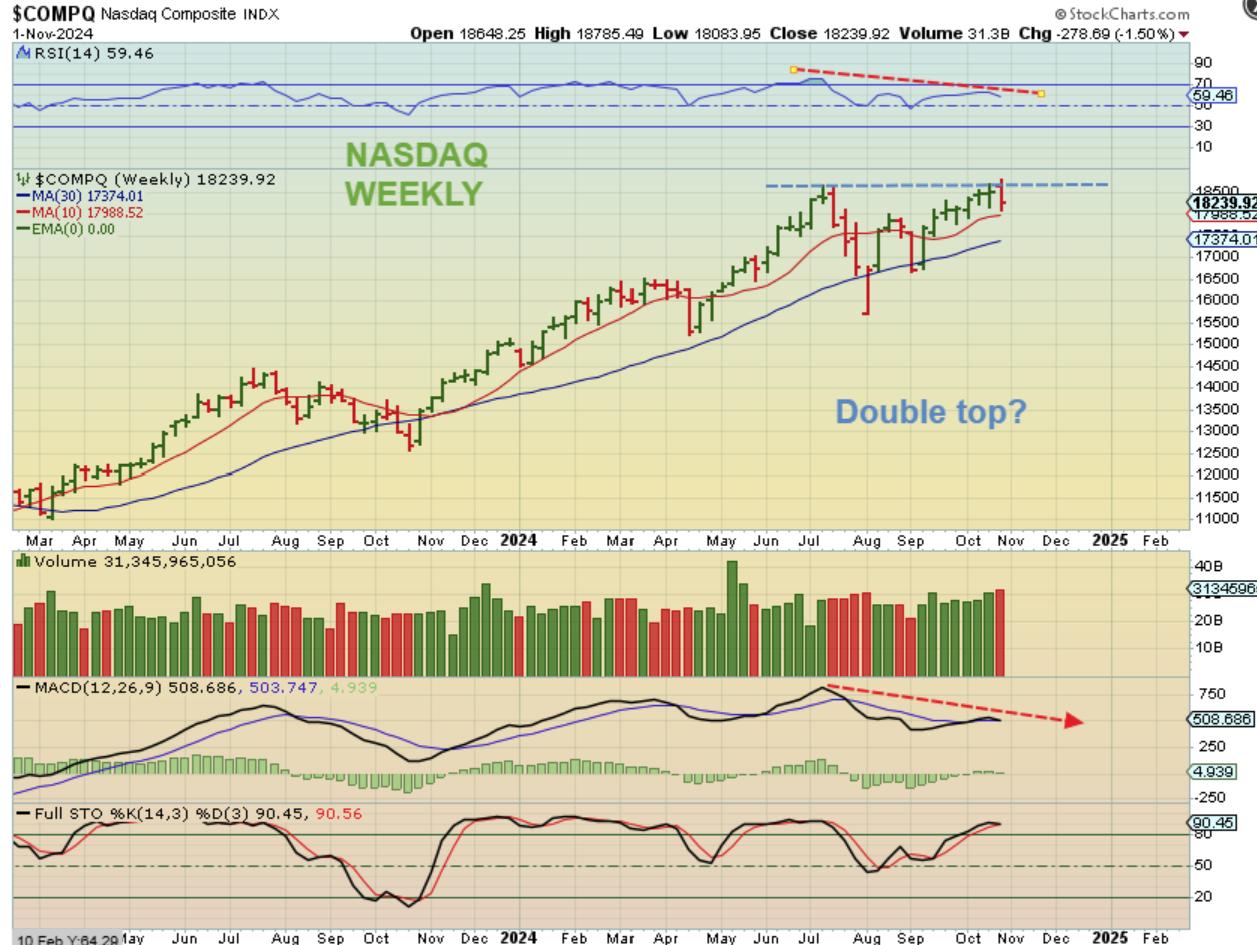
NASDAQ WEEKLY – The Nasdaq could be a double top, and there is divergence at the highs here.
.
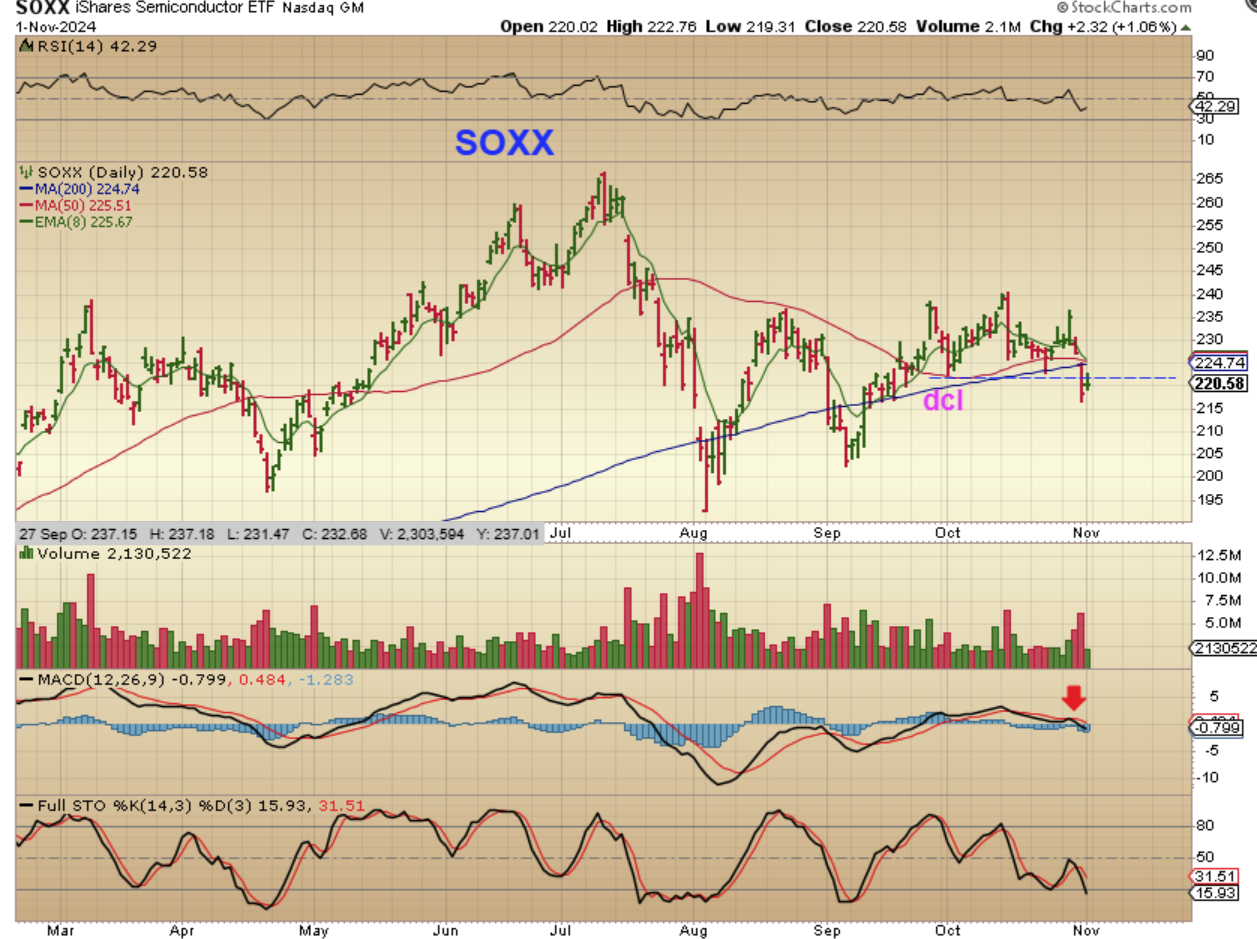
SOXX DAILY – The SOXX is the problem.
1. The sell off lost the dcl and That is a failure.
2. Price is below the 50 & 200sma and the 50 is ready to cross under the 200 sma.
3. The MACD crossed down and now it did a ‘kiss’ & rolled over again.
.
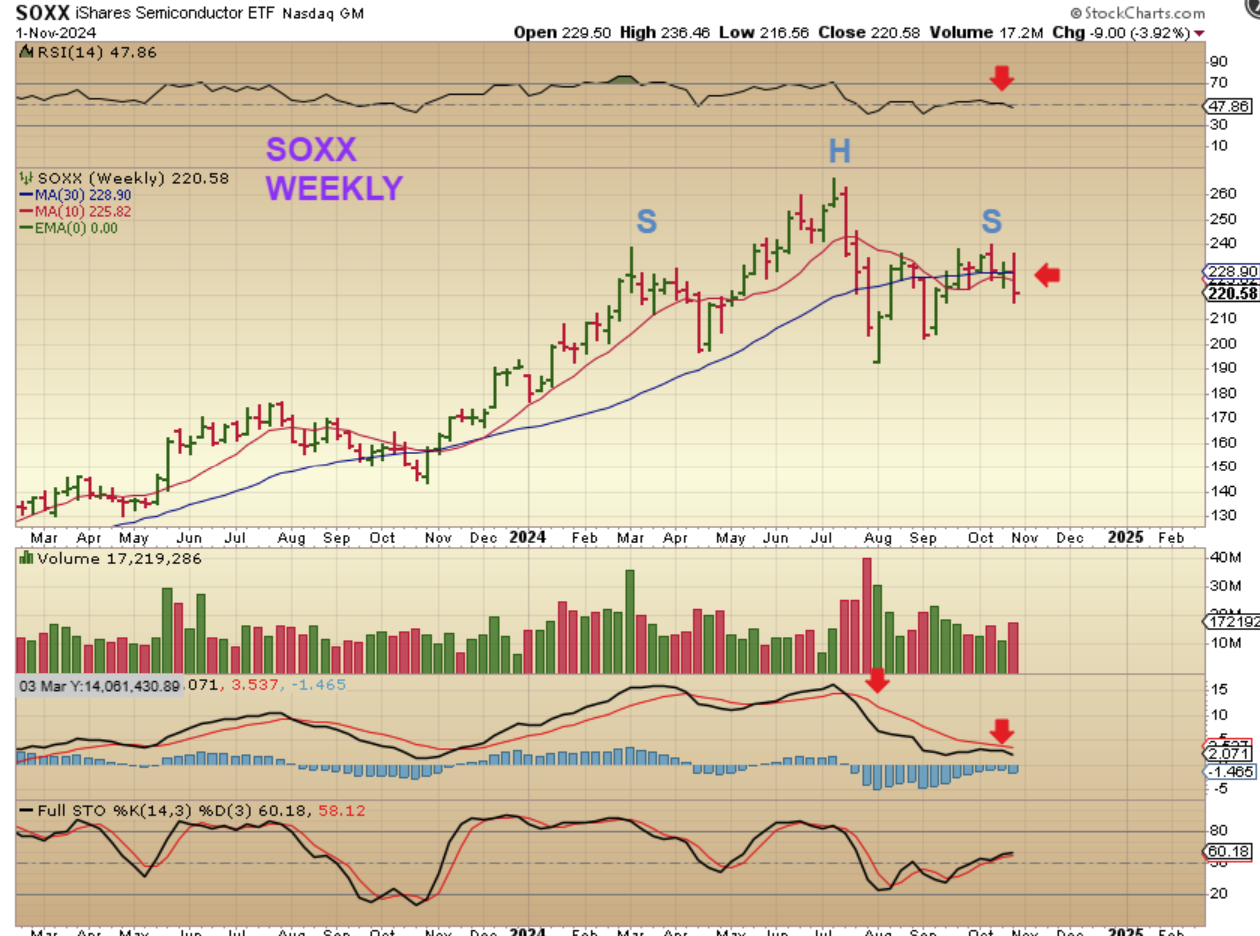
SOXX WEEKLY – This is what a H&S Pattern looks like and that weekly MACD is very weak.
.
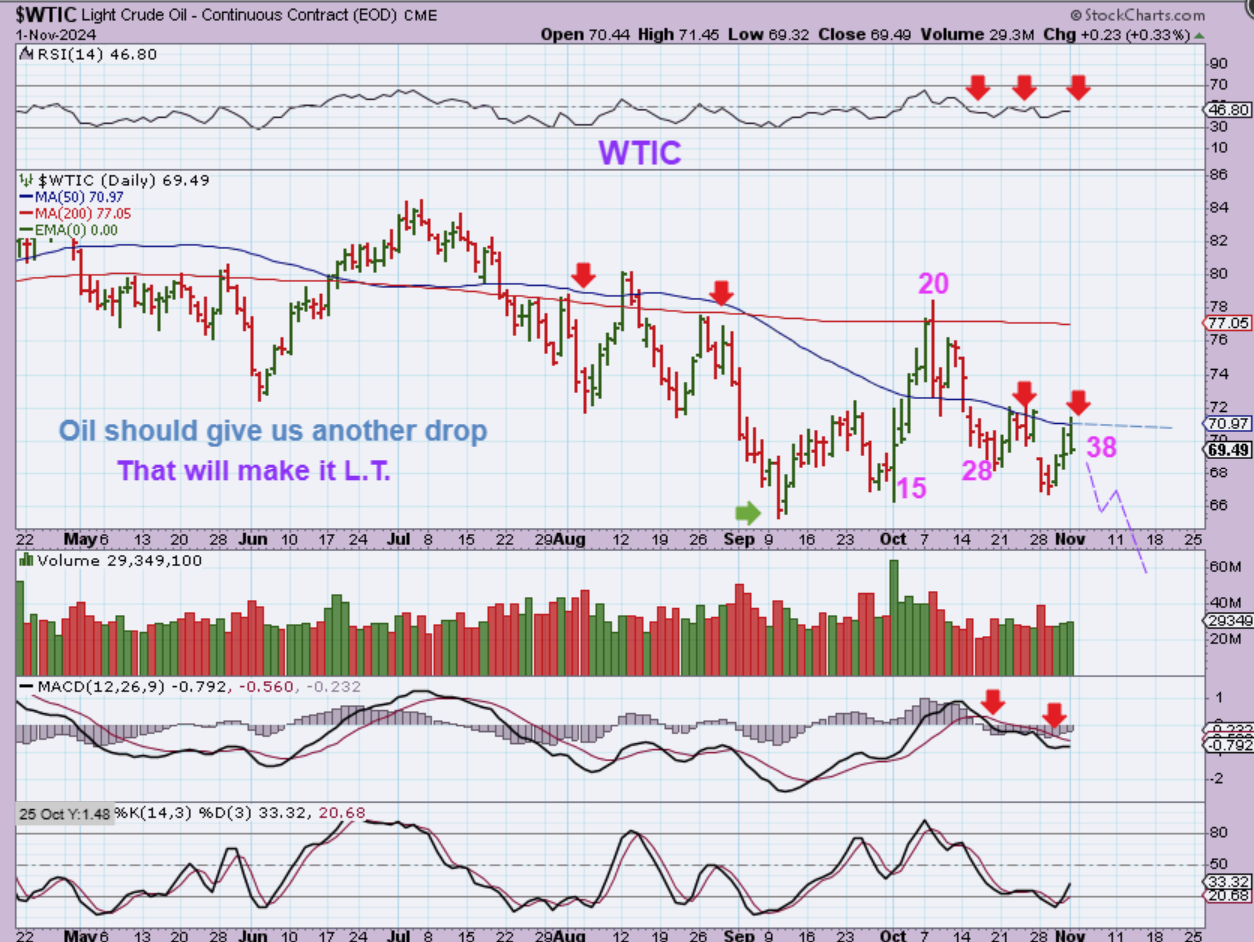
WTIC DAILY – Oils daily cycle can last 40-50days, and right now Oil was rejected at the 50sma a few times and will become L.T. in 2 days. Let’s look at the weekly chart.
.
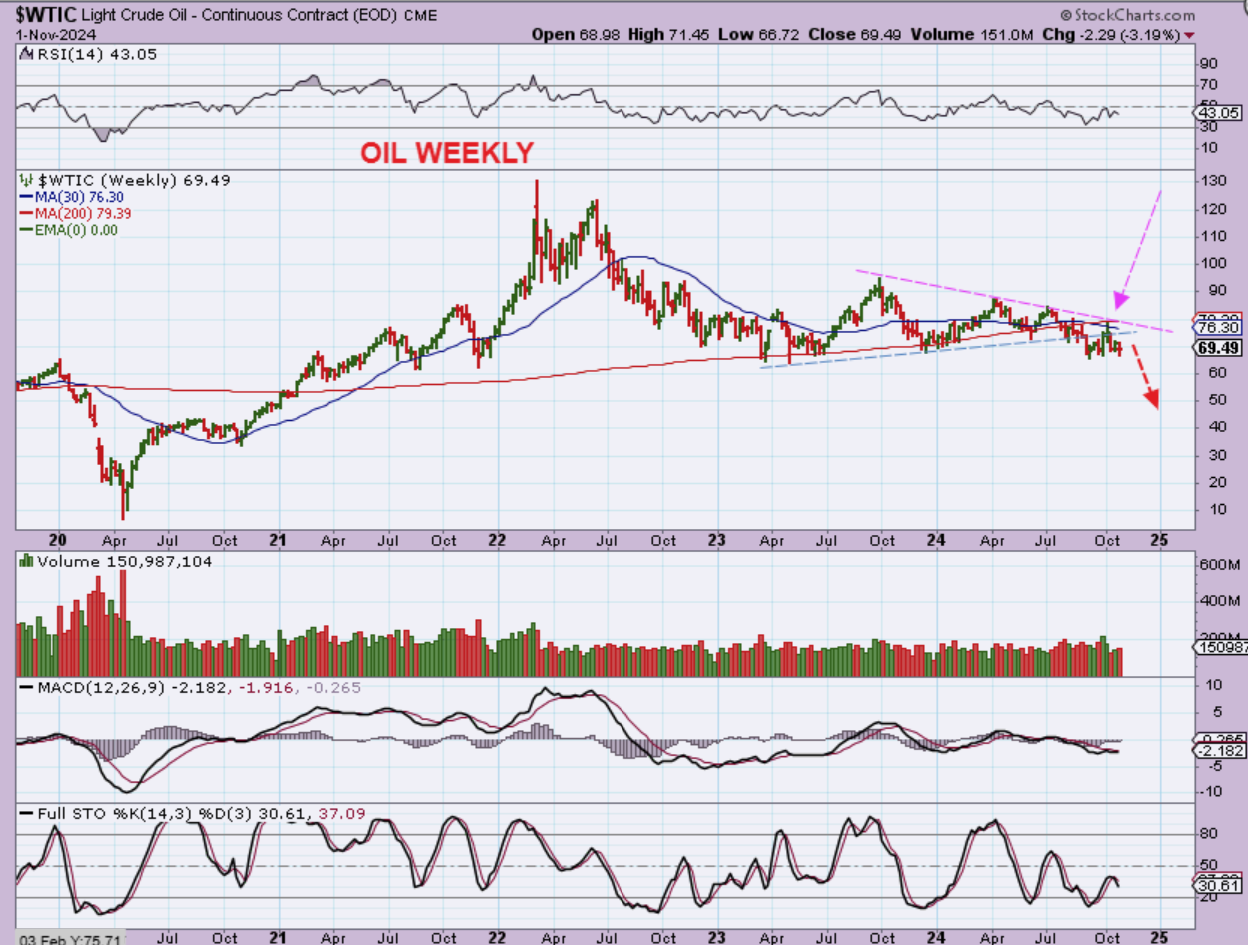
OIL WEEKLY – On this longer-term chart we see that Oil has broken down from that tringle and now it has back-tested the breakdown. It also back tested the 200 week ma. Oil could sell off further over time.
.
USD WEEKLY – On Oct 25th I noted on this chart that the current rally with the USD looked similar to that strong rally in mid 2023. If so, it can just continue higher as drawn here.
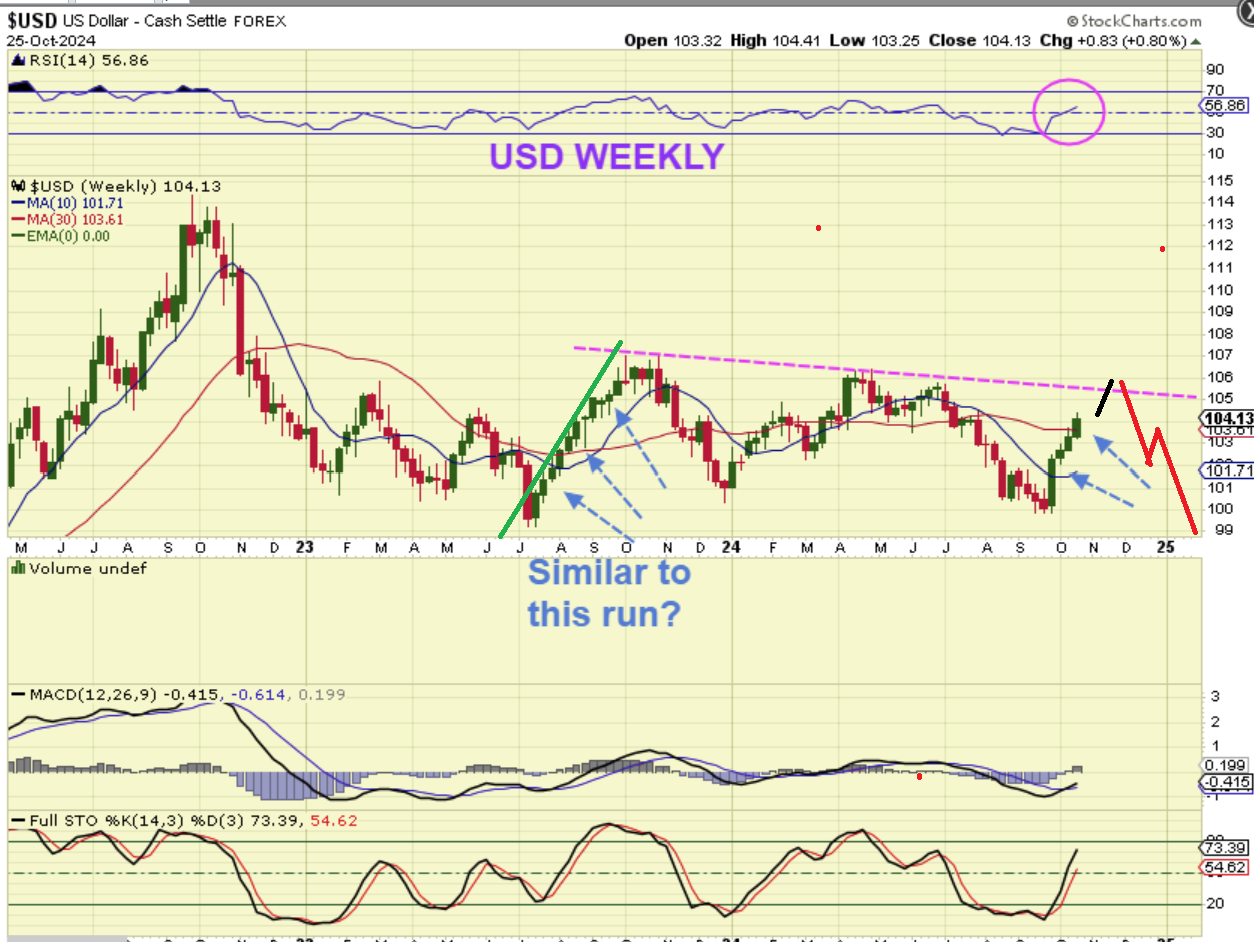
.
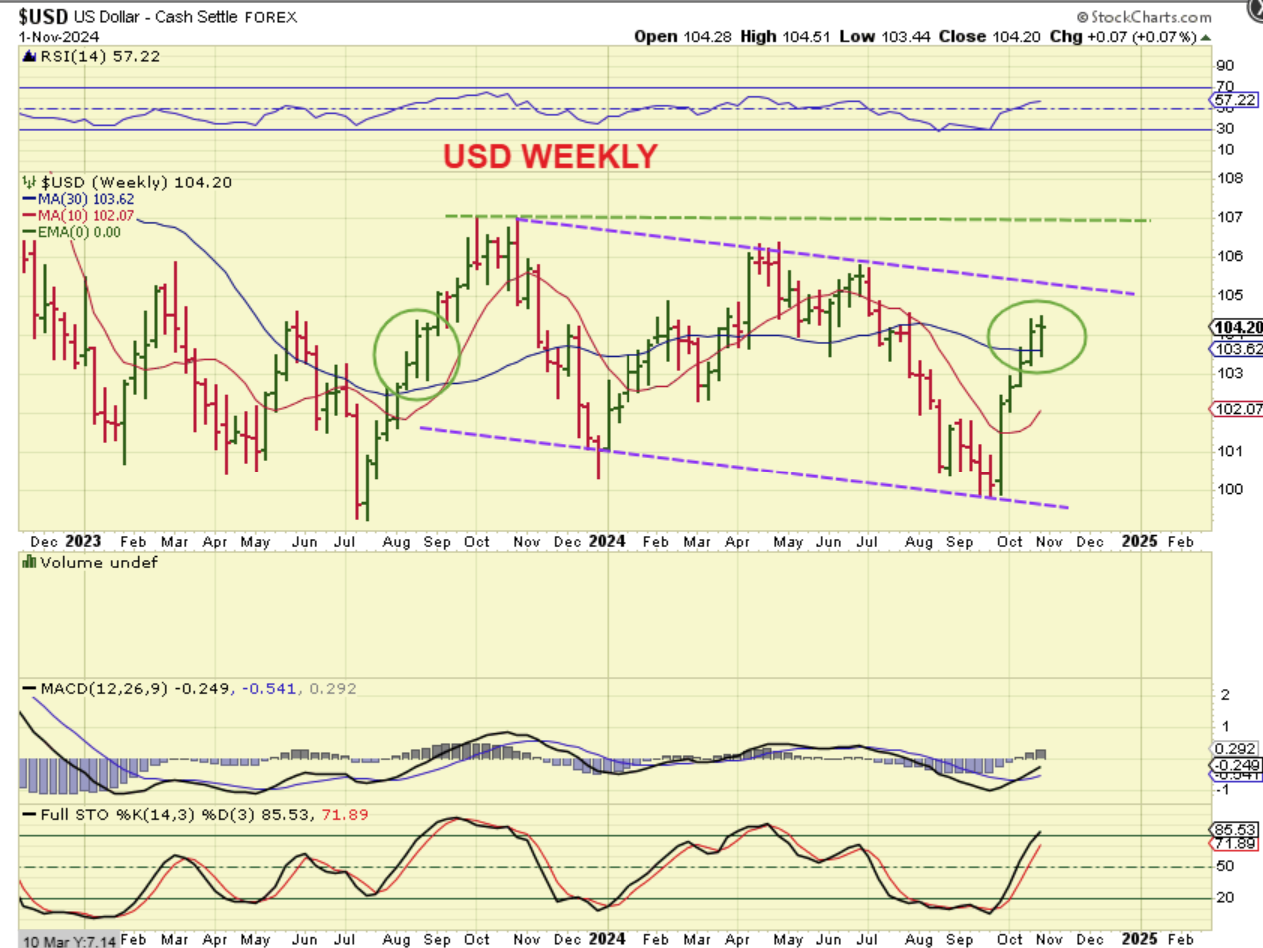
USD WEEKLY – I am still noticing that the USD does look similar to that rally in 2023, and if it is similar, it can continue higher.
.
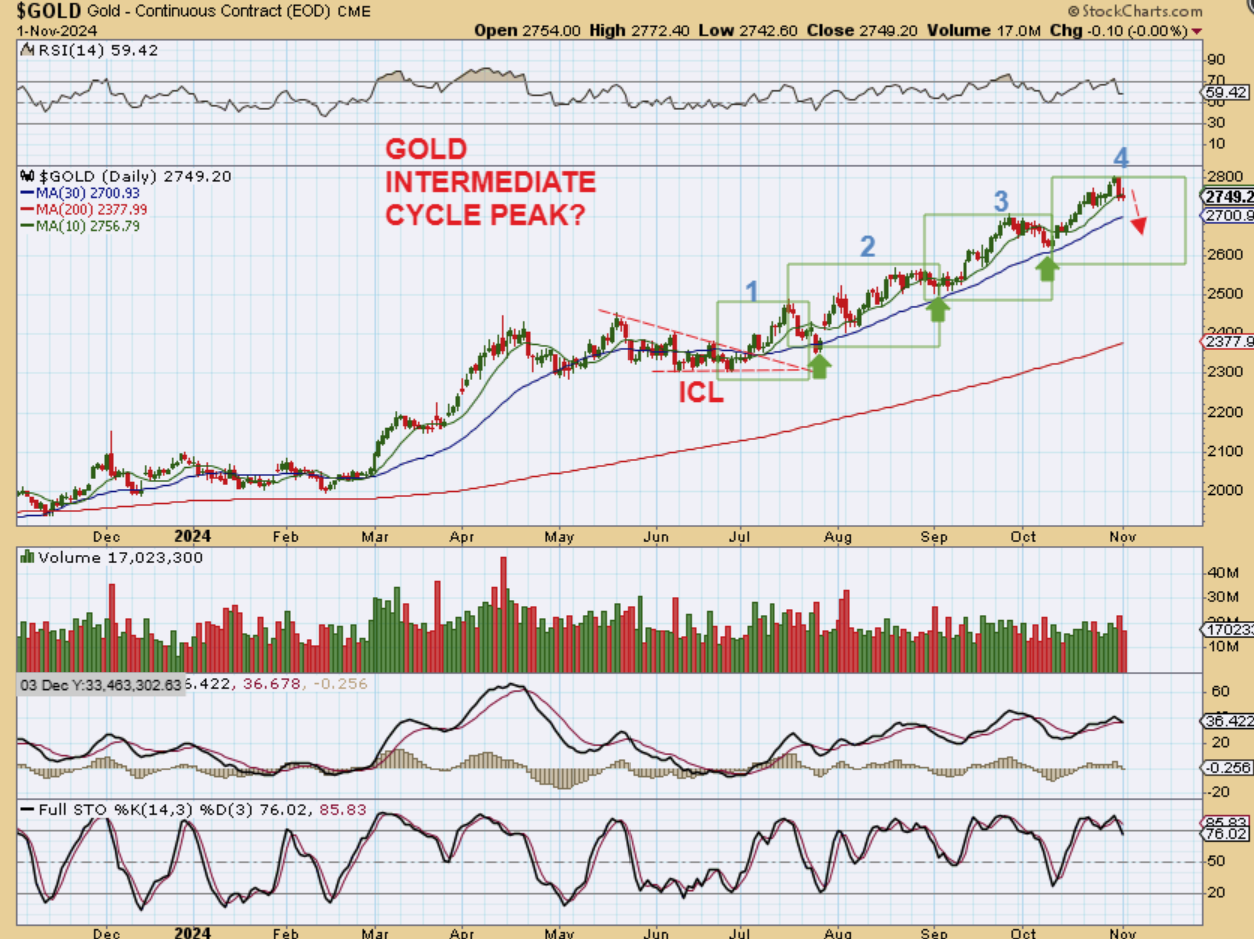
GOLD DAILY – We are on the 4th daily cycle of this intermediate cycle, and they do usually peak around this time, so this may be the peak of the intermediate cycle. We also could have a 5th daily cycle, so that would be another month of chopping lower.
.
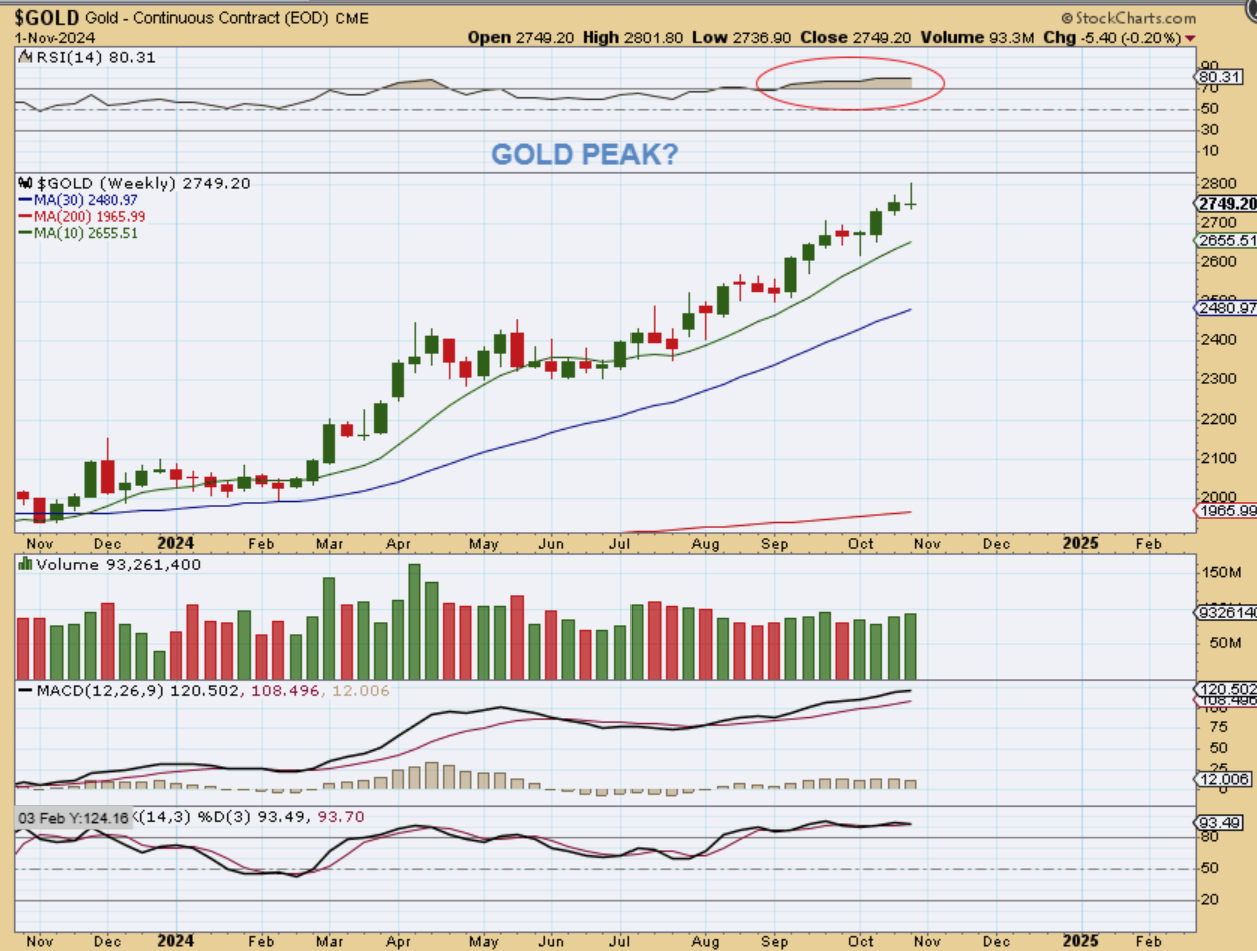
GOLD WEEKLY – Gold has what looks to be a topping candle on the weekly chart. Also take a look at the RSI and you’ll see that Gold is really overbought. This has been a strong run up and along the 10 week ma. We may chop sideways / lower and just reach that 10 week ma for an ICL.
.
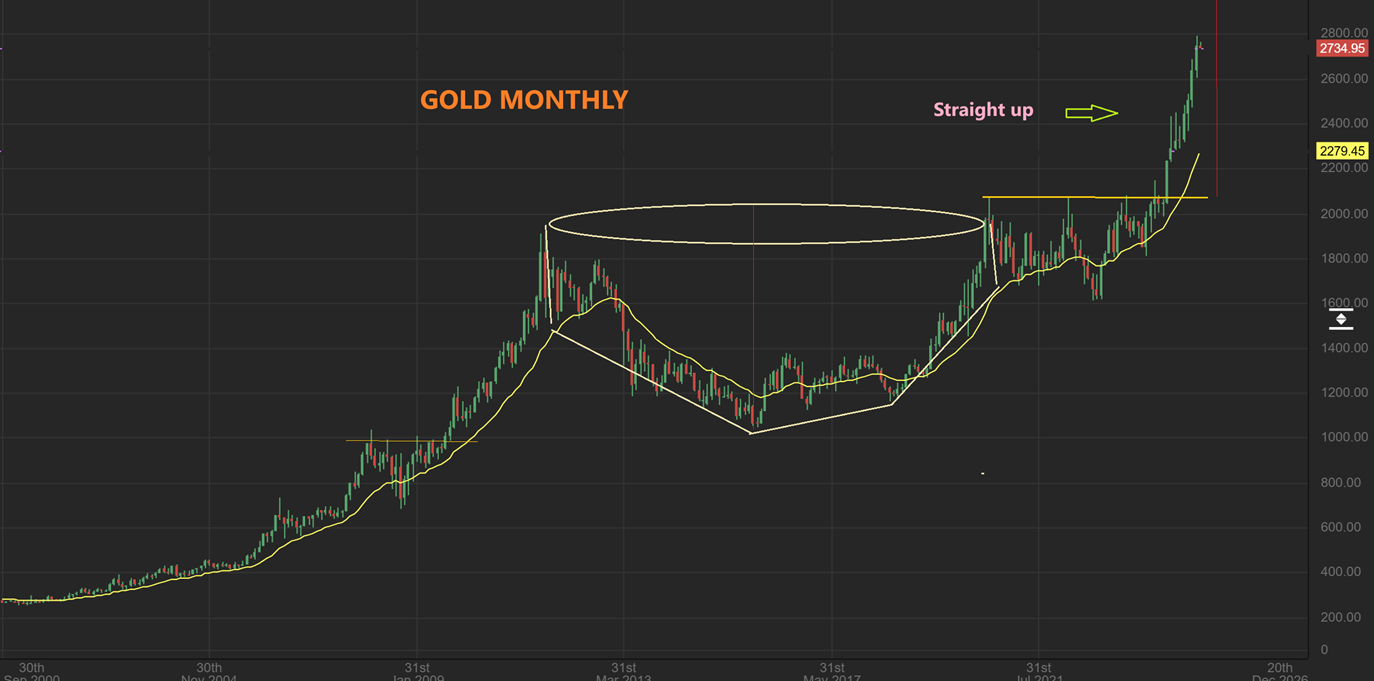
GOLD MONTHLY – I took a look at the Monthly chart since October ended last week and WOW, this has been a fairly straight up run since the break of the cup and handle. A run to $3000 would have seemed likely, as long as we don’t get a parabolic blow off top followed by a crash.
.
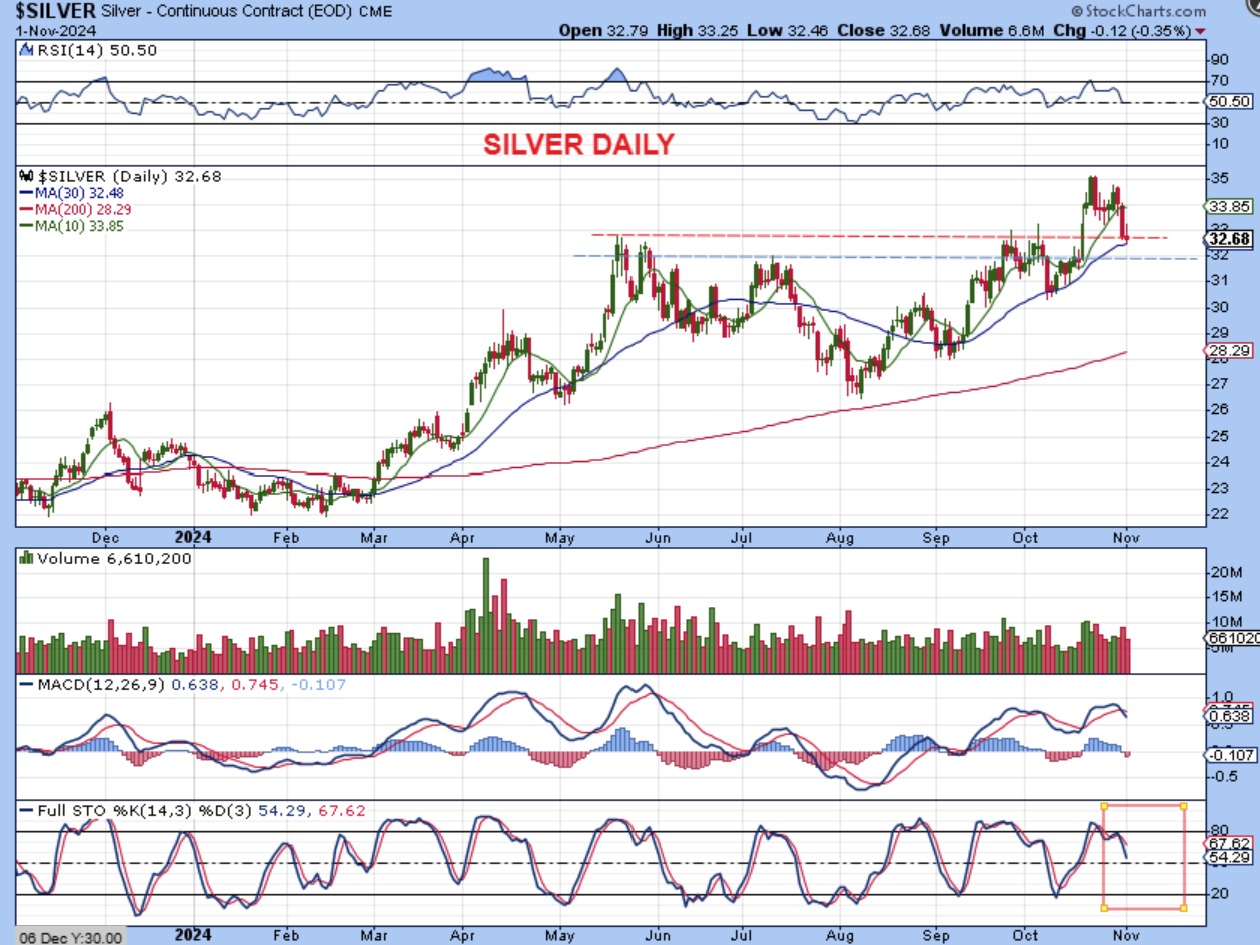
SILVER DAILY – Silver obviously didn’t join Gold in that massive rally. It has been putting in small daily cycles higher, but they have been choppy ones. It isn’t clear at this point as to whether or not Silver will try to run higher without Gold the way Gold ran without Silver, or will it chop around with Gold and put in an ICL first.
.
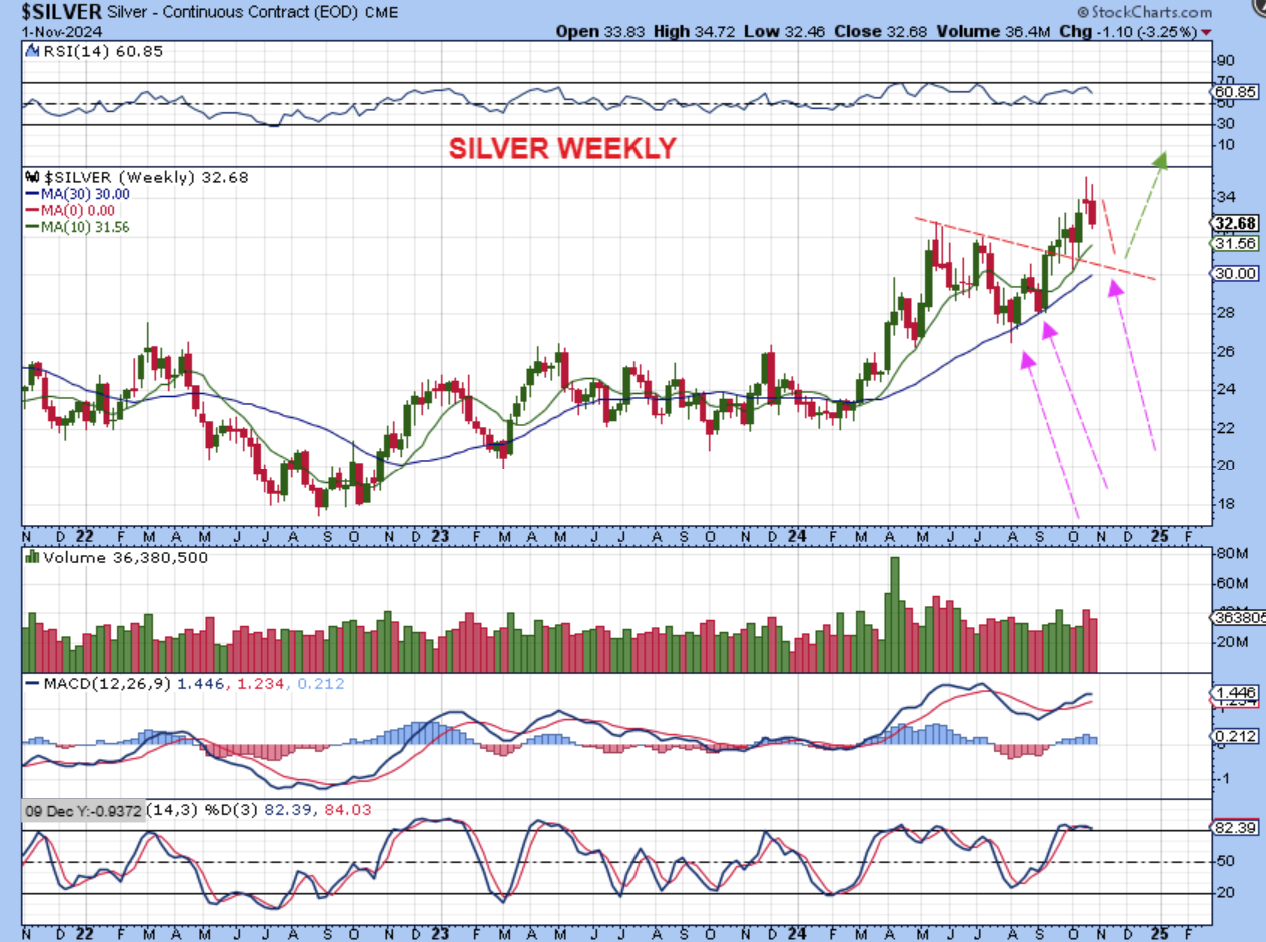
SILVER WEEKLY – If it sells off, Silver can drop down to the 30 week ma as it starts to dip into an ICL next. That would also back test the recent break of the downtrend (orange line), at roughly $30. The once we get an ICL, we could then see a strong rally out of that ICL.
.
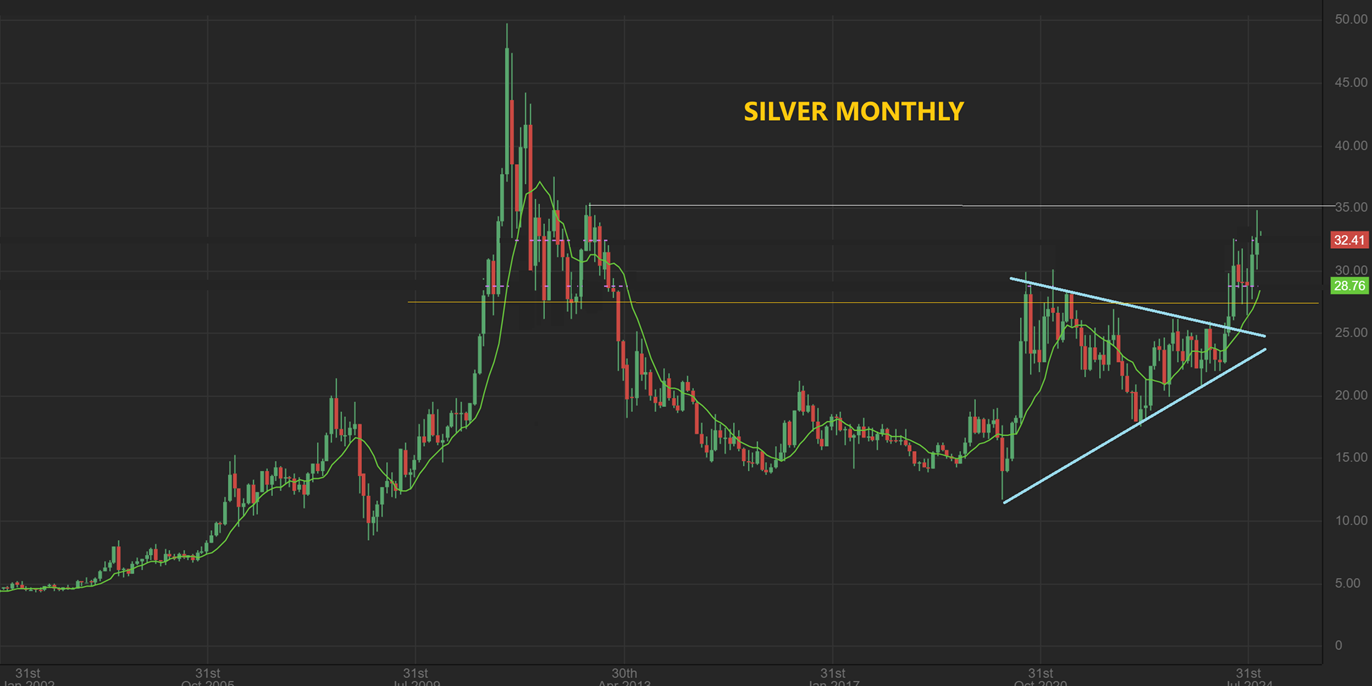
The SILVER MONTHLY CHART shows that Silver broke out from a larger triangle too, so it has made progress in 2024, but it has been choppy.
.
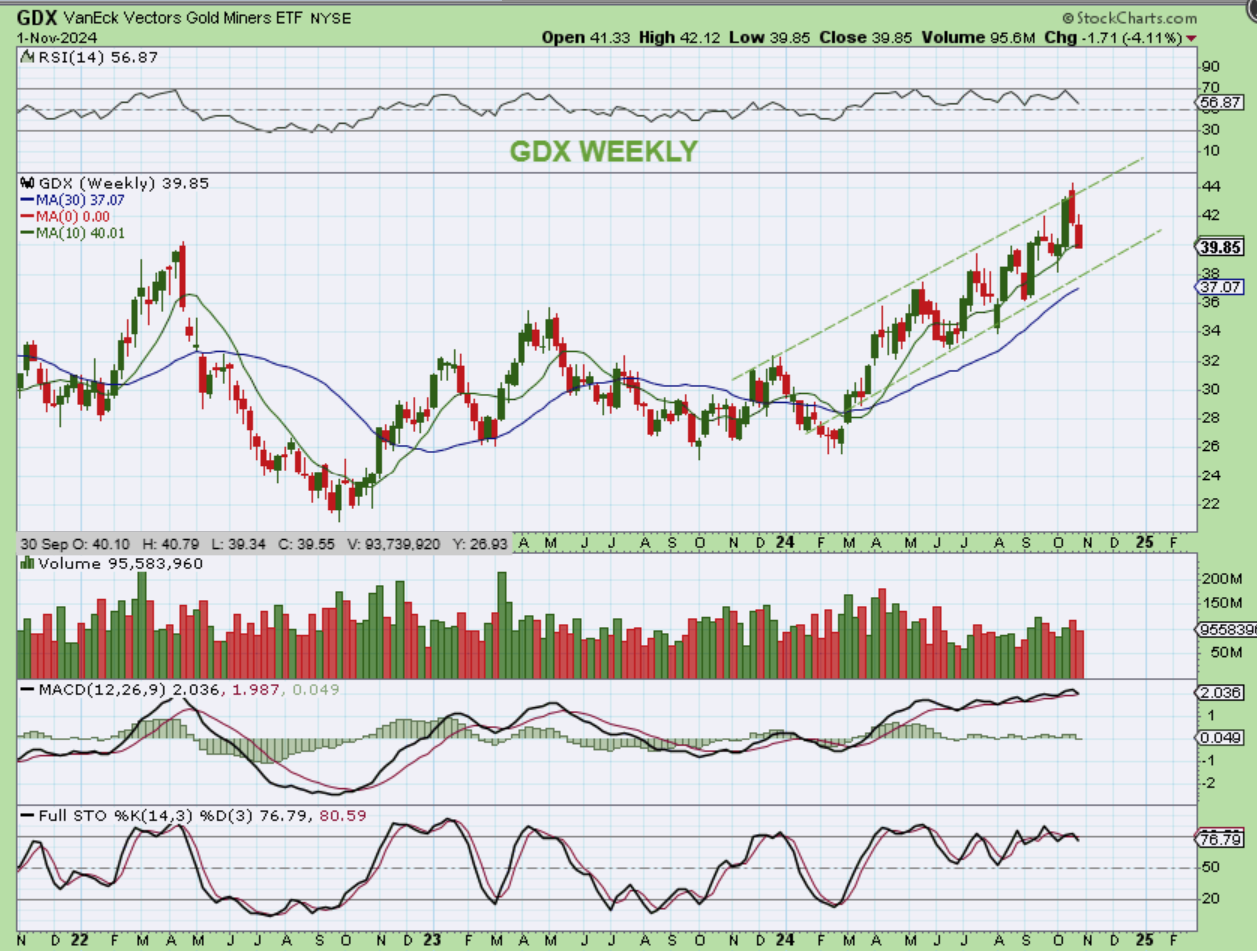
GDX WEEKLY – The miners have actually topped and dropped over the last 2 weeks and over time it could visit the lower green trendline, Or the blue 30 week ma. It is currently on the 10 week ma.
.
The General Markets sold off at the end of the week and Precious Metals Miners and the Crypto stocks dropped too. The drop wasn’t all that bad percentagewise, unless you were heavily invested (& I personally was heavy into Silver stocks and crypto). We have the U.S. Elections and the Fed next week, so I have to expect next week to be very volatile. I can’t say whether we’ll be UP on Monday into Tuesday, and then sell off after the elections & Fed(?), or will we rally with a strong multi-day bounce after the Elections and Fed(?), but the way things are currently set up—it looks to me like more selling heading into November for the General Markets. It is really up to each individual to decide how to be positioned next week, but I just don’t expect normal trading action, so keep that in mind. My positions will be smaller ones. One thing that I found in my weekend analysis is that Bitcoin does look like it may be ready for a low next week, so I’ll discuss why I see that with Bitcoin below.
.
I hope that you all are enjoying your weekend!
.
~ALEX
.
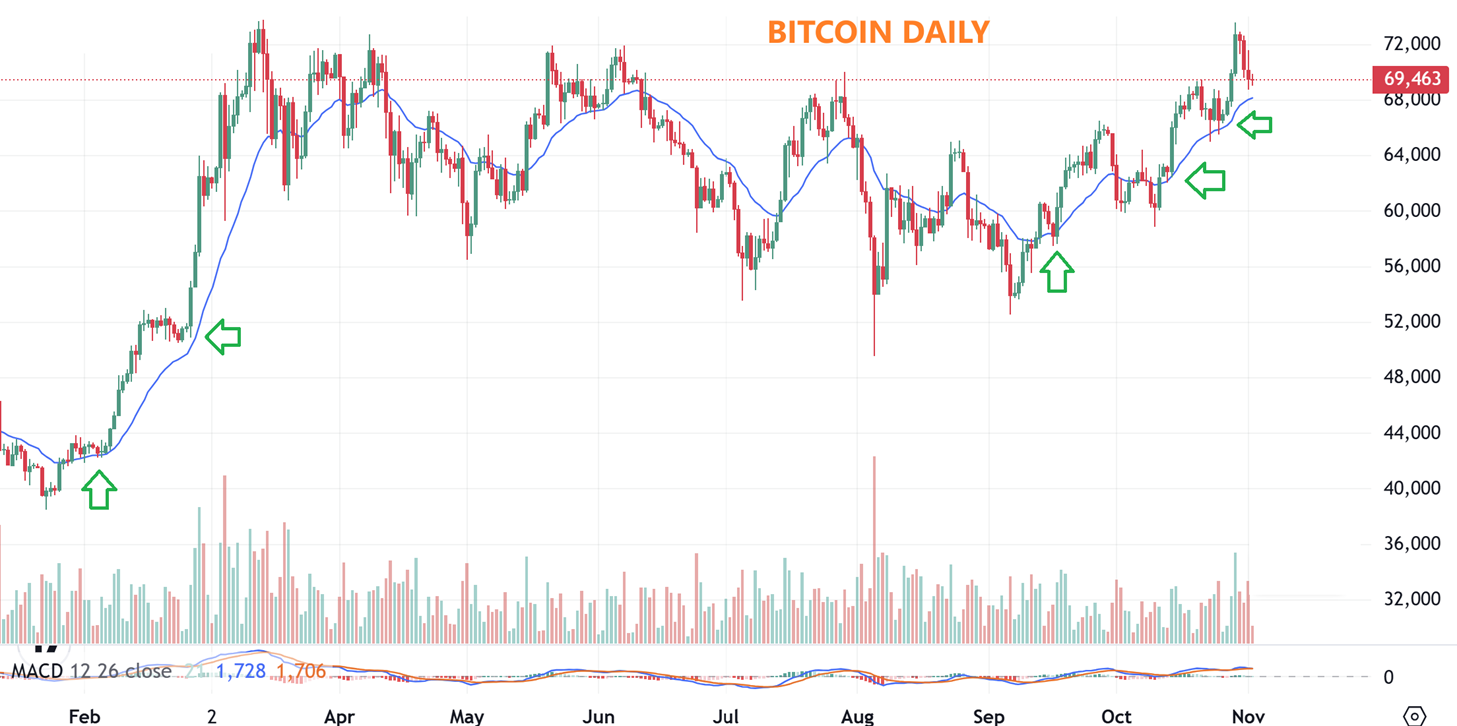
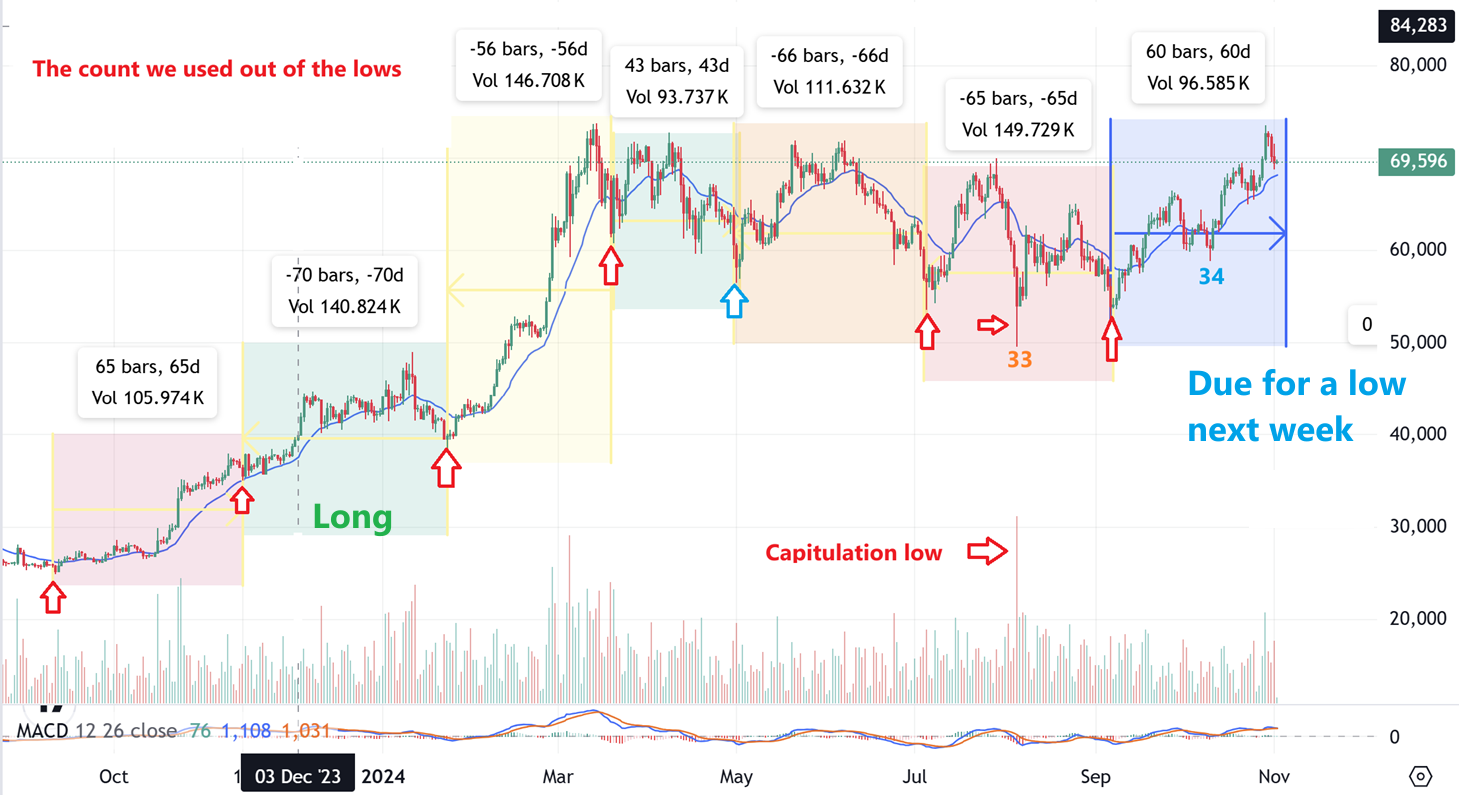
BITCOIN – Starting with a daily chart, I just wanted to show the 20 ema and we see that price is almost there. Now cycle counts show us that no matter how I look at it (I will use different counts), it looks possible that Bitcoin will put in a low next week around the Elections results or Fed Rate Cut Results.
.
I want to try to keep this as simple as possible, but we need to discuss the 2 different cycle counts that I pointed out in a report last week. No matter which one I use, they point to a low coming in next week.
.
BITCOIN CYCLE COUNT #1 – This one follows the original count that I had. Note: We have 1 area that, no matter how I count it out or divide it up, it only had 44 days, and I can’t adjust it in any way to split it up into a 60 day period. So this was the count that I was using BEFORE the sharp capitulation low that I set up as an ICL. WITH THIS COUNT, 60 days will be around next Wednesday, and it still could be at that moving average.
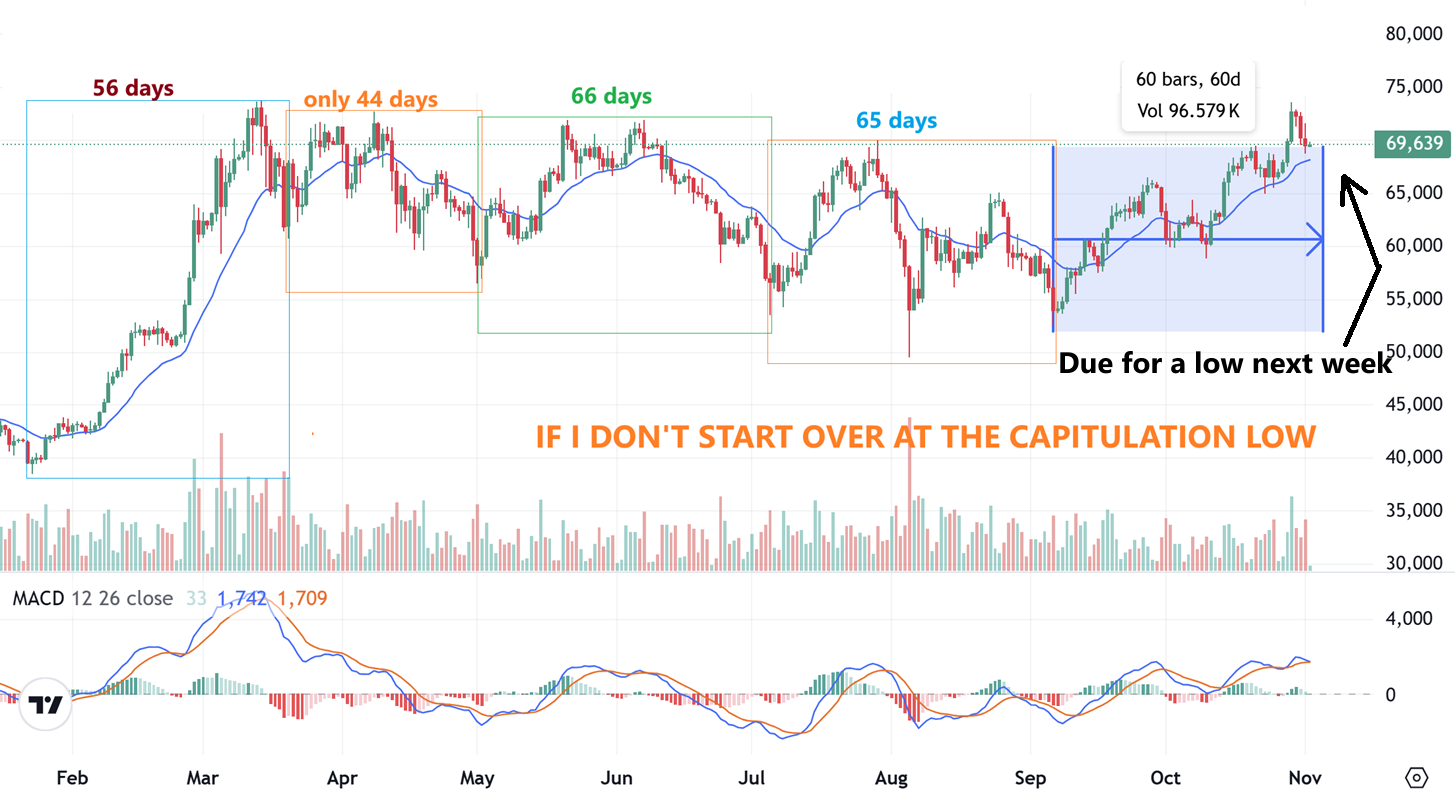
.
BITCOIN CYCLE COUNT #2 – After that High Volume Capitulation sell off at roughly day 30, I decided to count that as THE ICL LOW due to the capitulation. So starting at that Capitulation low— we are seeing day 30 show up around late next week too.
.
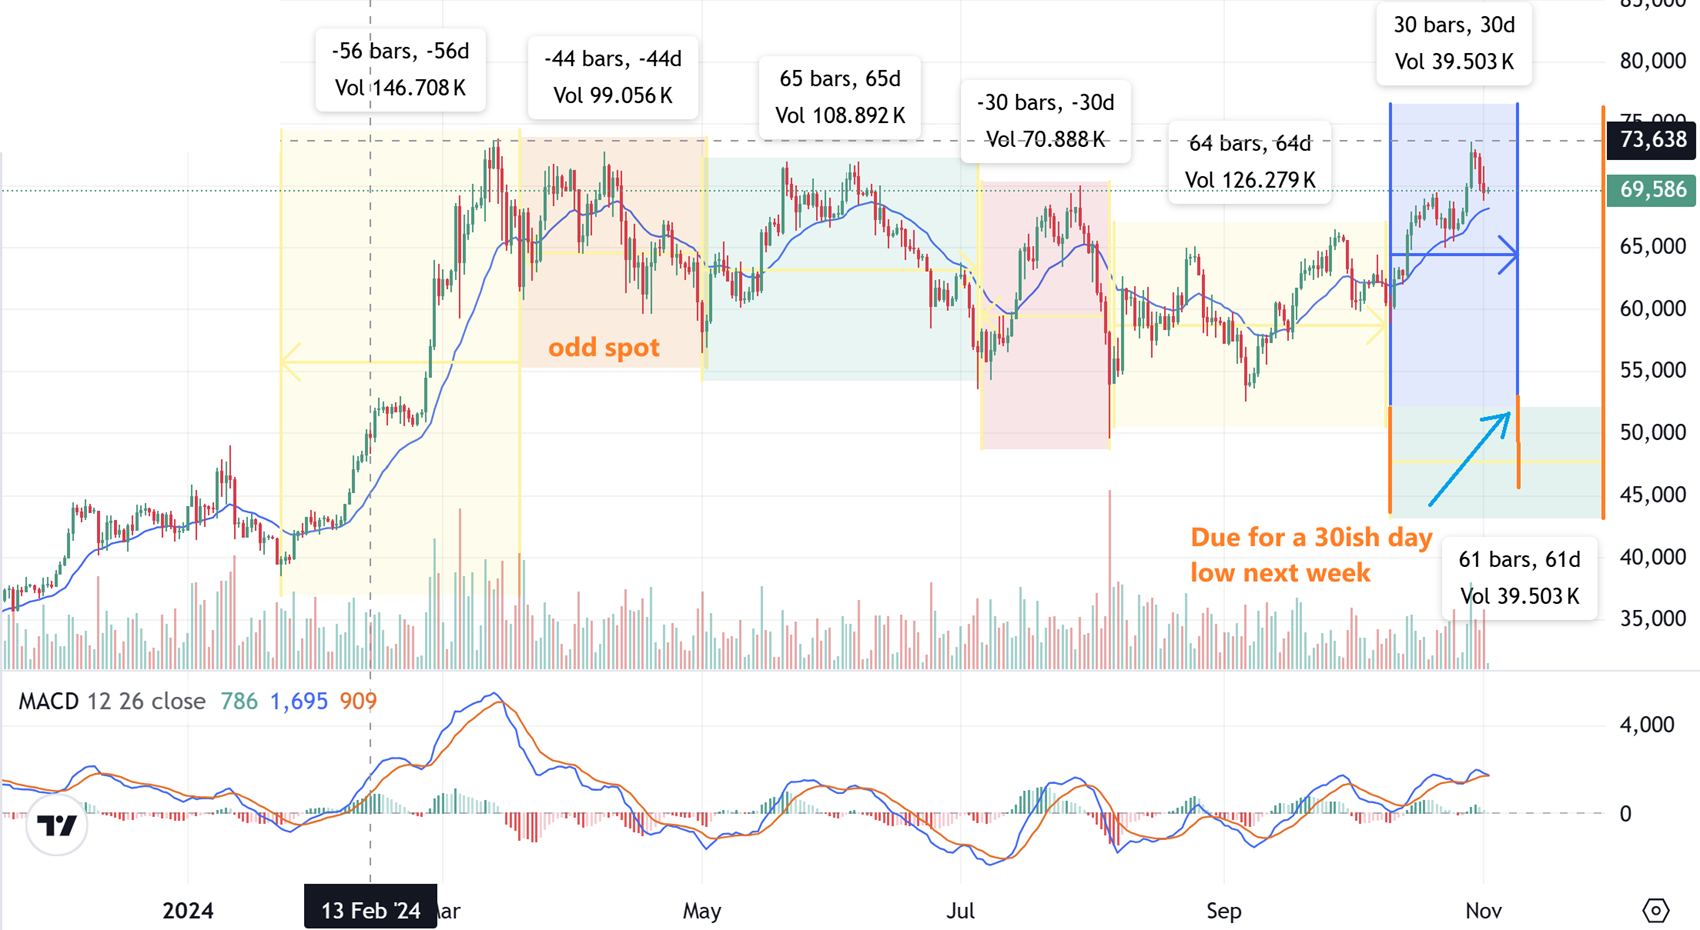
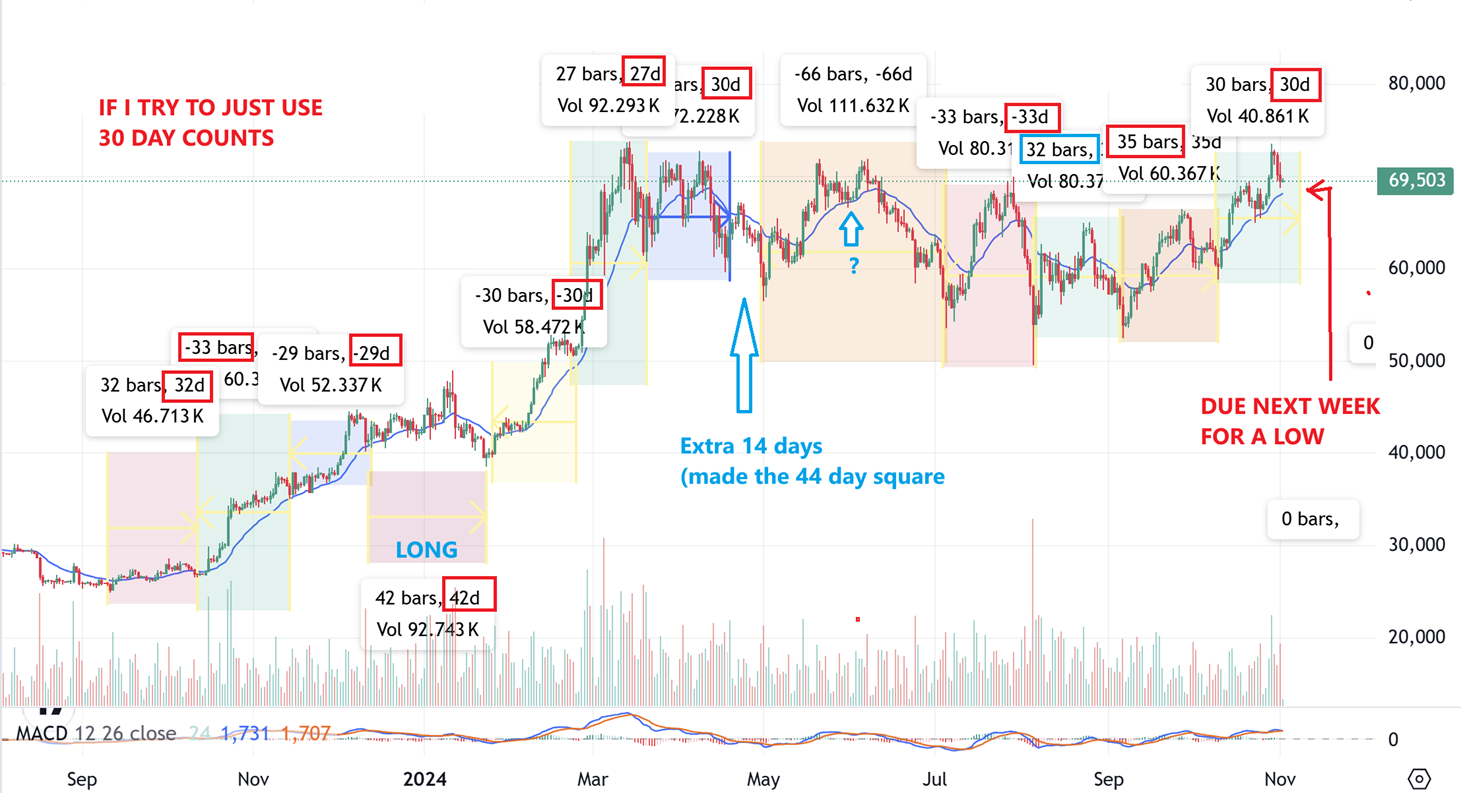
BITCOIN CYCLE COUNT $3 – Starting at the low in September 2023, you see that count again with ‘roughly’ 60 day boxes. That 43 or 44 day box is still necessary. Notice how shallow and mild that first dip into a dcl at the end of the first pink box was. We may get that now too. This count skips that capitulation low as a day 33 low, and then continues with us due for a dcl in a couple of days.
.
BITCOIN CYCLE COUNT #4 – This looks confusing, but what I did here was just skip 60-day periods and go 30 day to 30-day periods. The place were the 44 day box was shows up as 44 days or 30 & 14 extra days. That 66 day orange box has a Very Mild Dip in the middle that could be 30 & 30. From this cycle count of mostly roughly 30 days, we are due next week too. I expect…
.
1. So whether we use 30 day cycle counts, 60 day counts from the last lows in 2023, or start over with an ICL used for the recent capitulation slam down, we are due for a low next week (roughly).
2. Along with that let me remind you that we have the Elections and the Fed Rate Cut next week and I really have to expect some high volatility.
3. In our past cycle counts we DID have that 44 day long cycle once, and I can’t remember why, but if we ever get another one that deviates from a ‘normal’ count, it could be the Elections and Fed Mtg next week. That being said—-we are due for a low next week. We’ll see how it plays out.
.
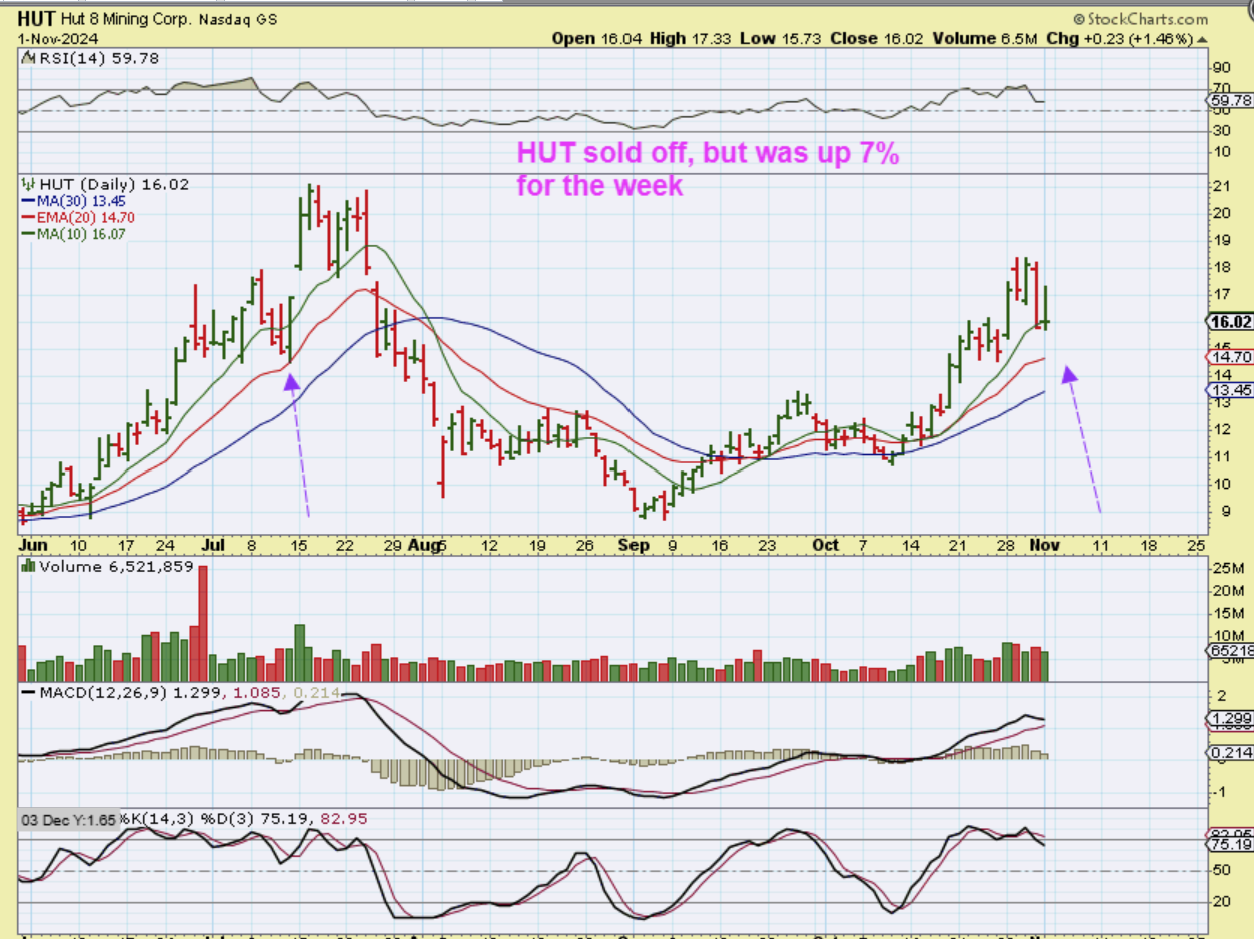
HUT – You may not believe this after the slam down on Thursday, but Hut was still up 7% for the week. It could tag the 20 ema next week.
.
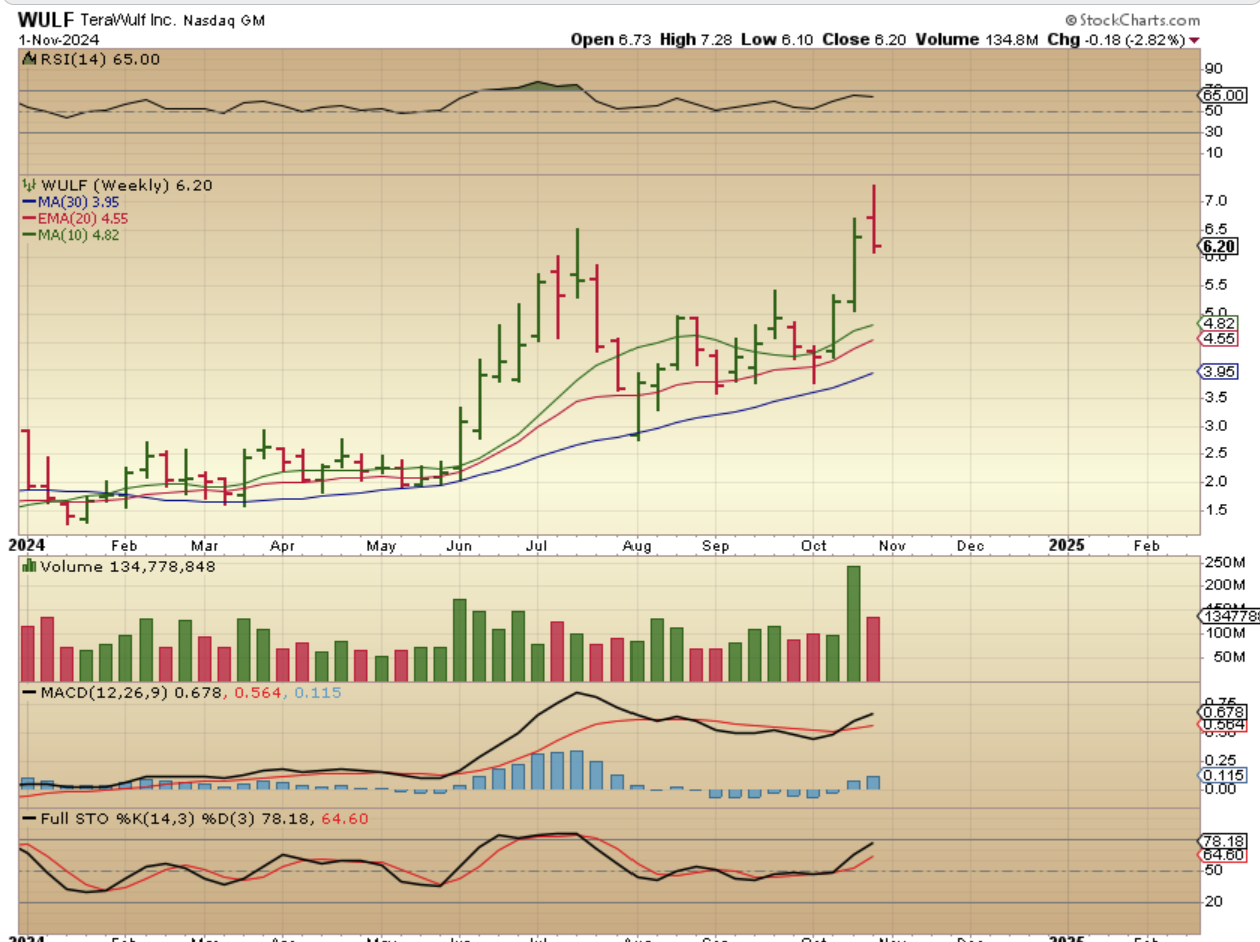
WULF rallied and dropped at the end of the week, so it was only down 2.82%. You can see that with these Crypto Stocks, you need to buy early in the run and hold on so that the bigger drops don’t hurt. If you bought this earlier in the week near $7, this was a big drop to $6.20.