Tuesday October 15th – Looking Good
.
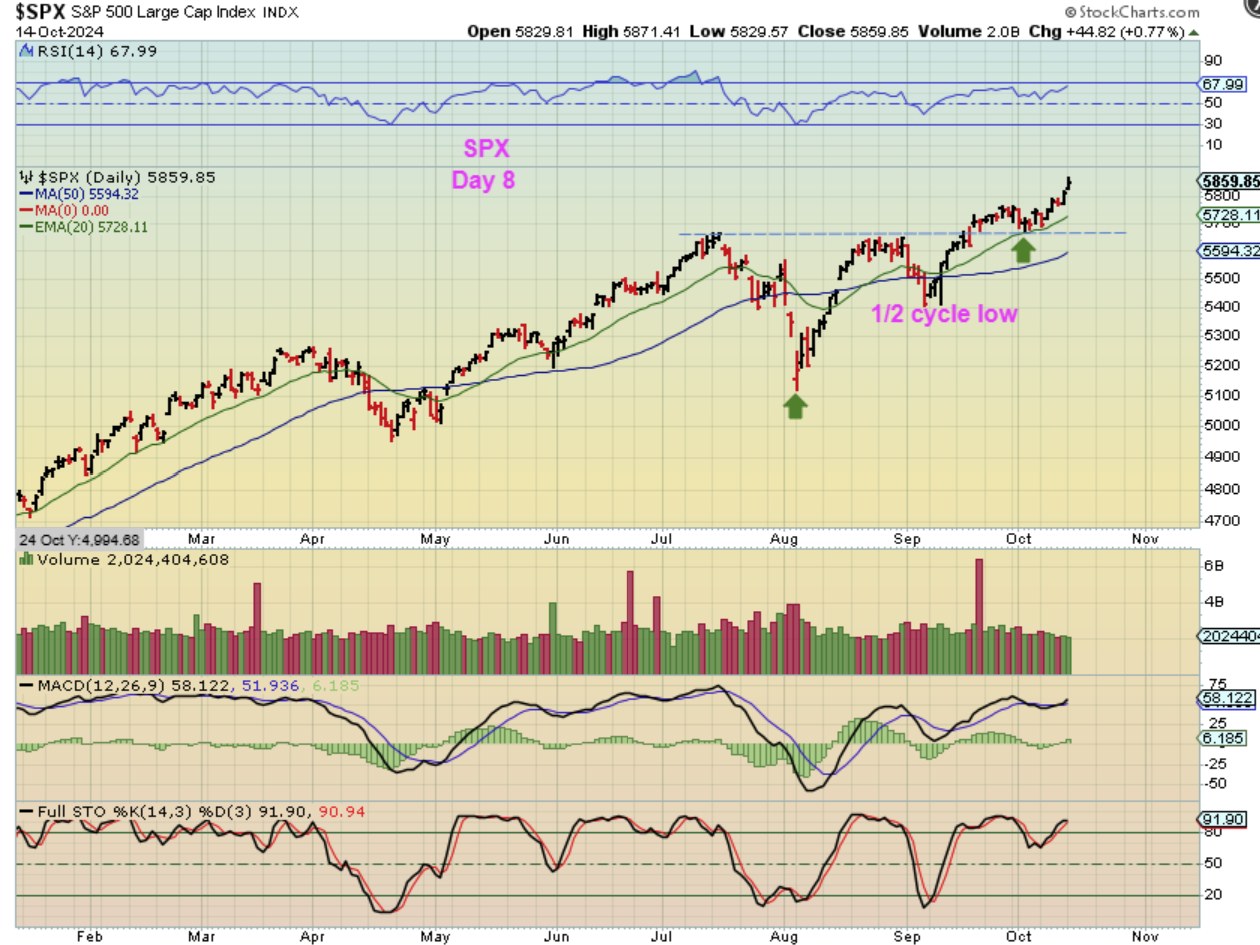
THE SPX (and General Markets) are on day 8 and they were a buy or ‘add’ at this last dcl. That dcl came at the 20 ema and now price continues to run higher.
.
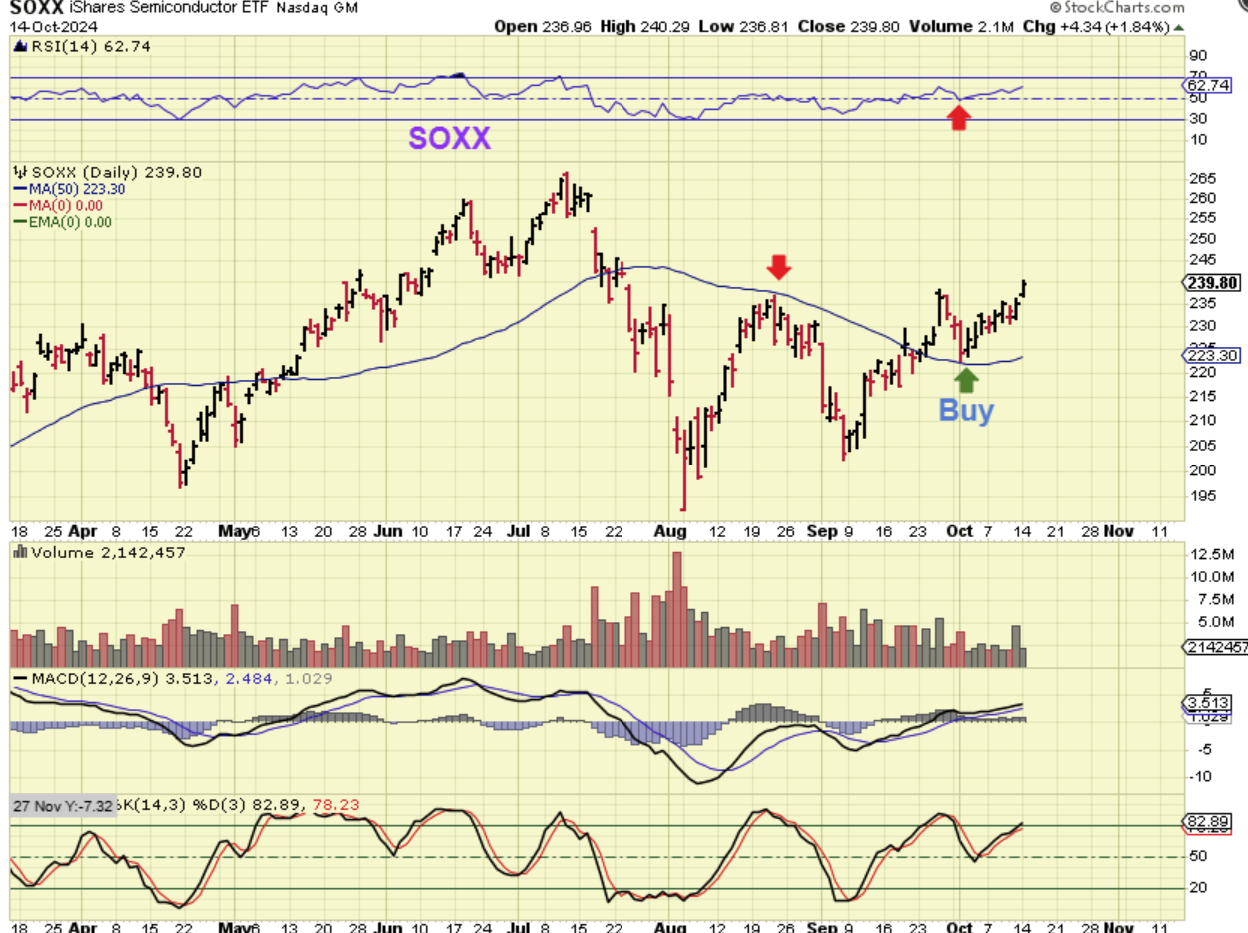
I have been saying that The SOXX was a buy because it could play catch up as it moves toward the former highs. We see that slowly taking place now.
.
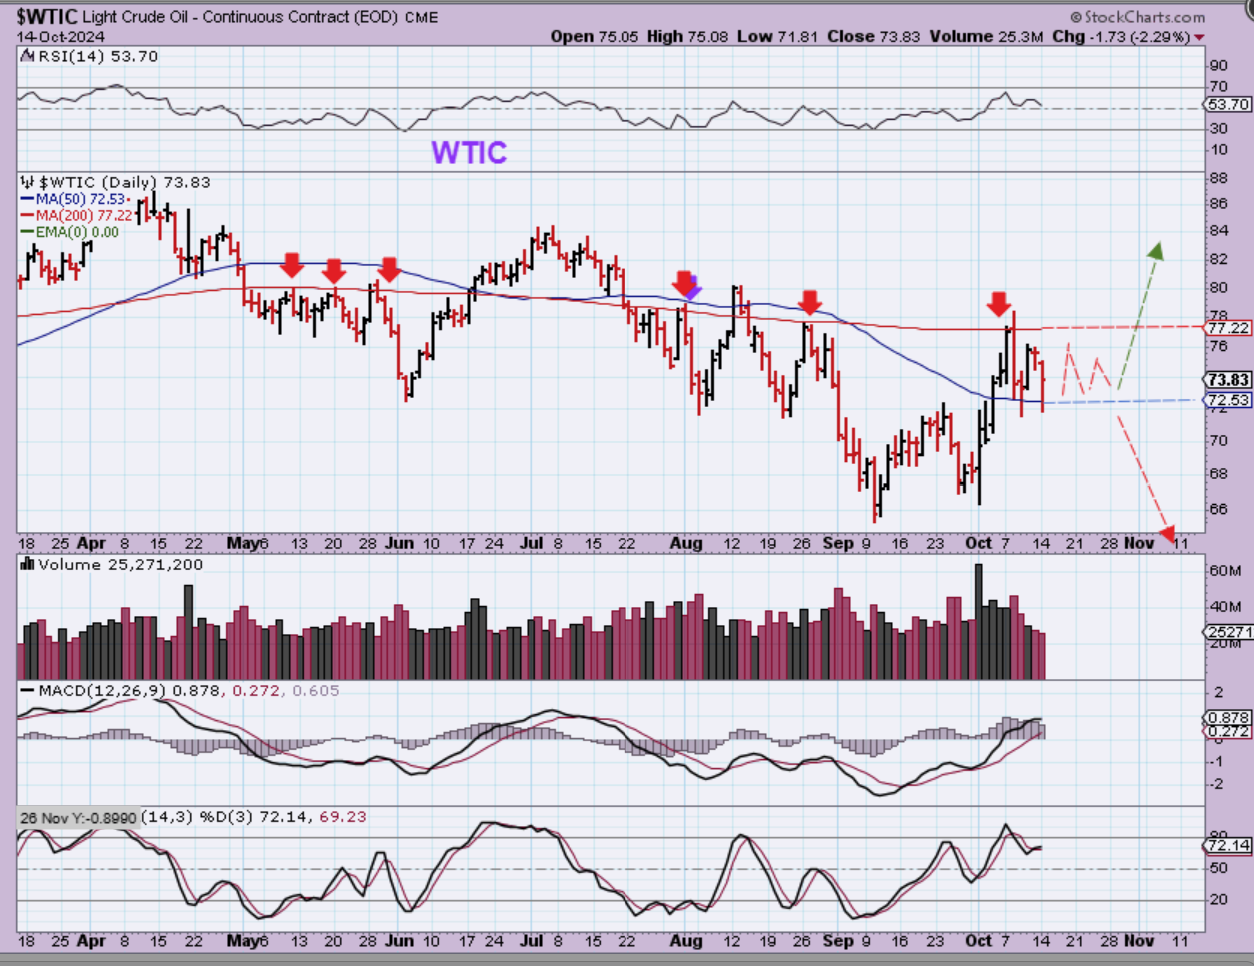
WTIC – Oil dropped again on Monday, but it does keep bouncing or finding support at the 50sma. I think that it is too choppy to comfortably trade for many, but the Oil stocks have been acting more bullishly.
.
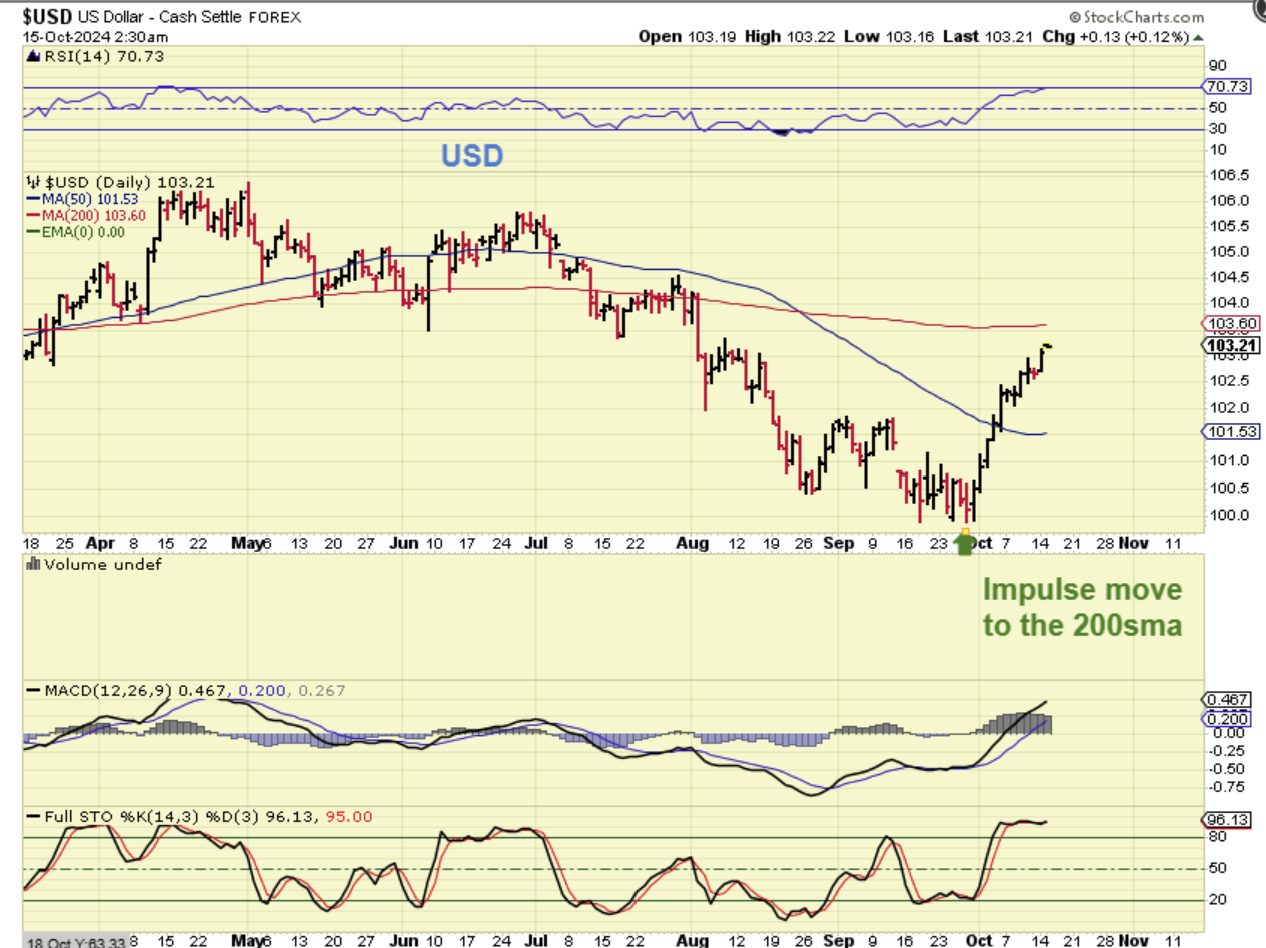
The USD still has a date with the 200sma.
.
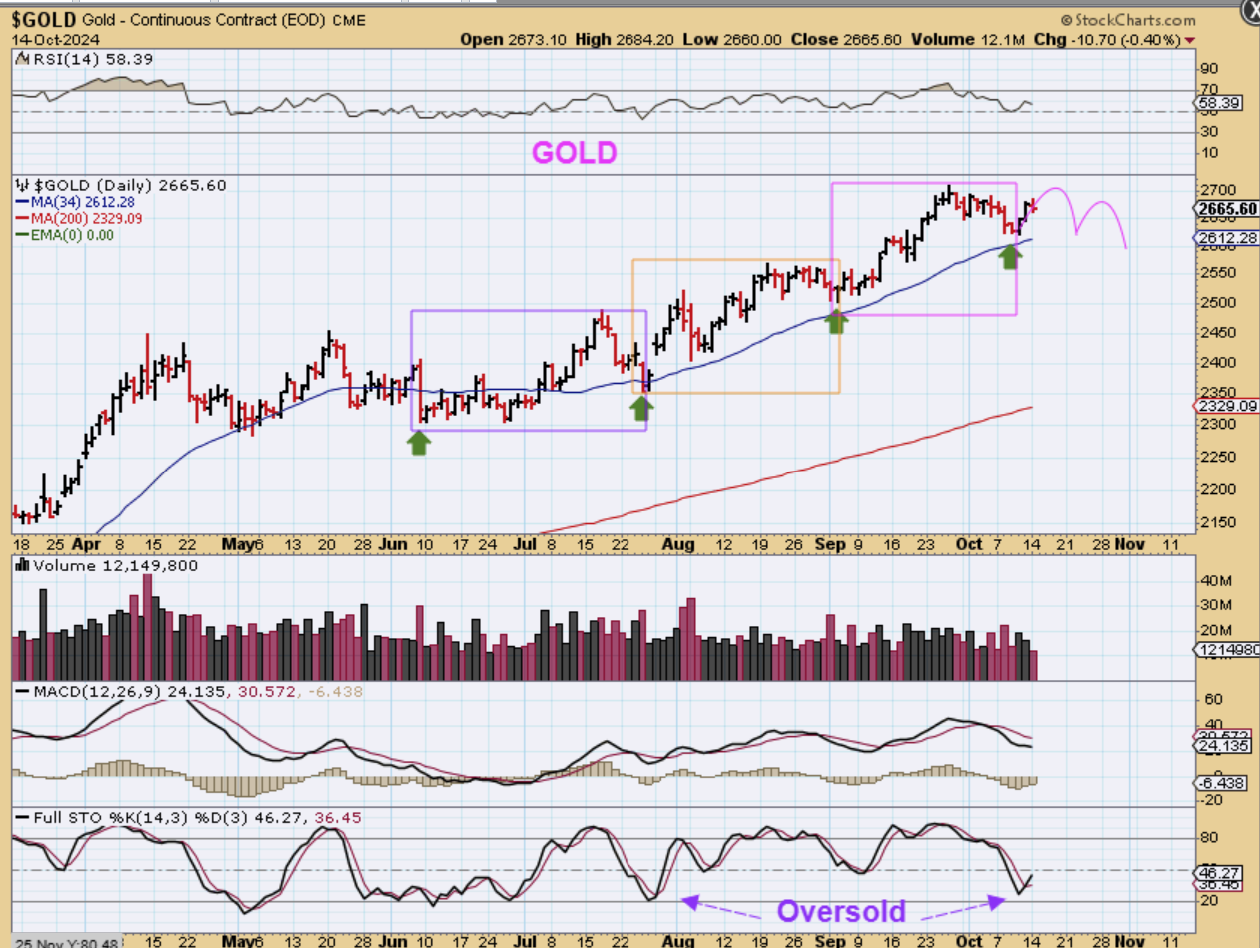
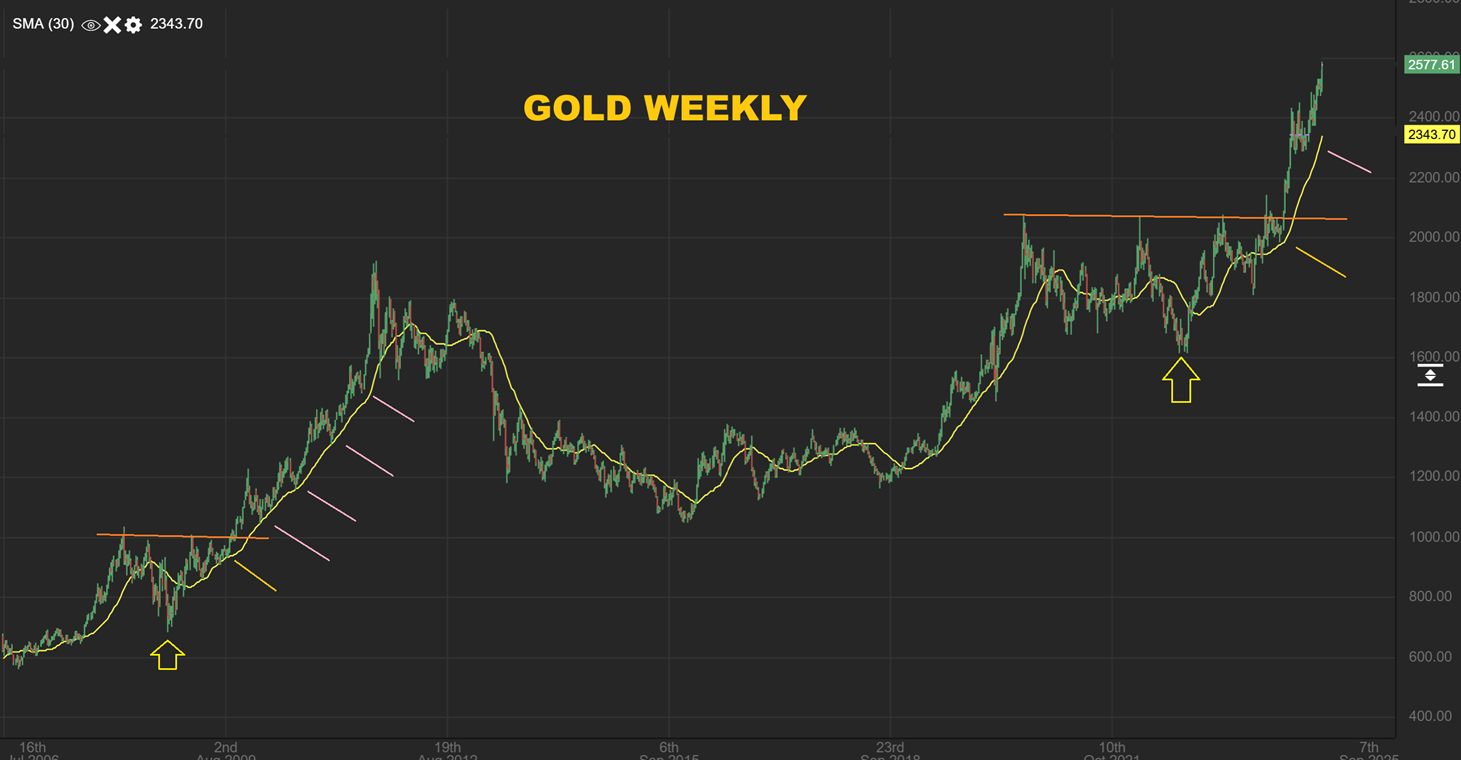
GOLD dropped to a dcl last week and is now trading in the 4th daily cycle. Those are often weaker & choppy. It could roll over as L.T. shortly after making new highs, or before it even can make new highs. I expect it to be a L.T. Daily cycle, choppy, with a probability of peaking around day 5-13.
.
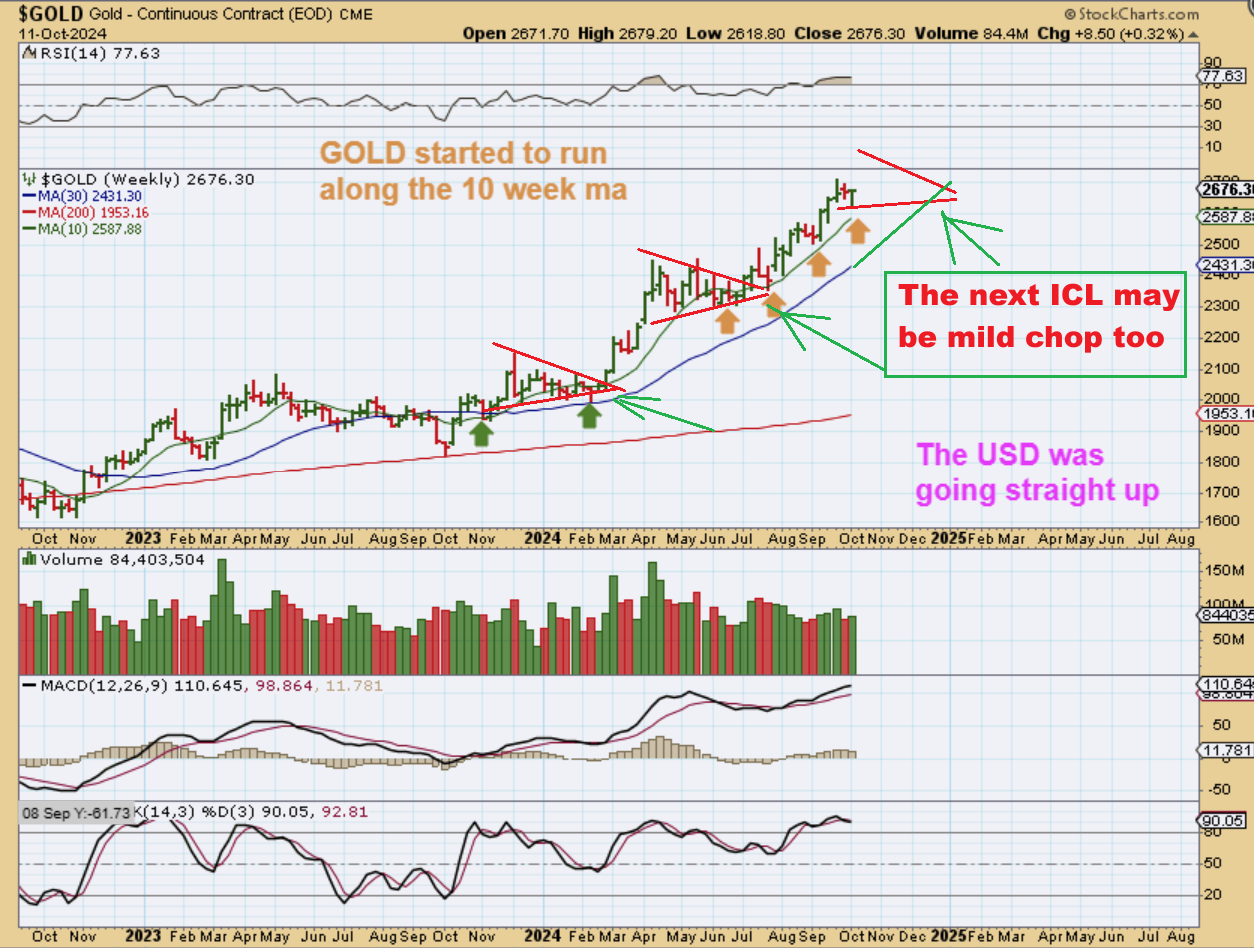
The weekend report posted this as a reminder:
The current pattern for Gold is showing us that we may just have another mild choppy dip into the next ICL.
.
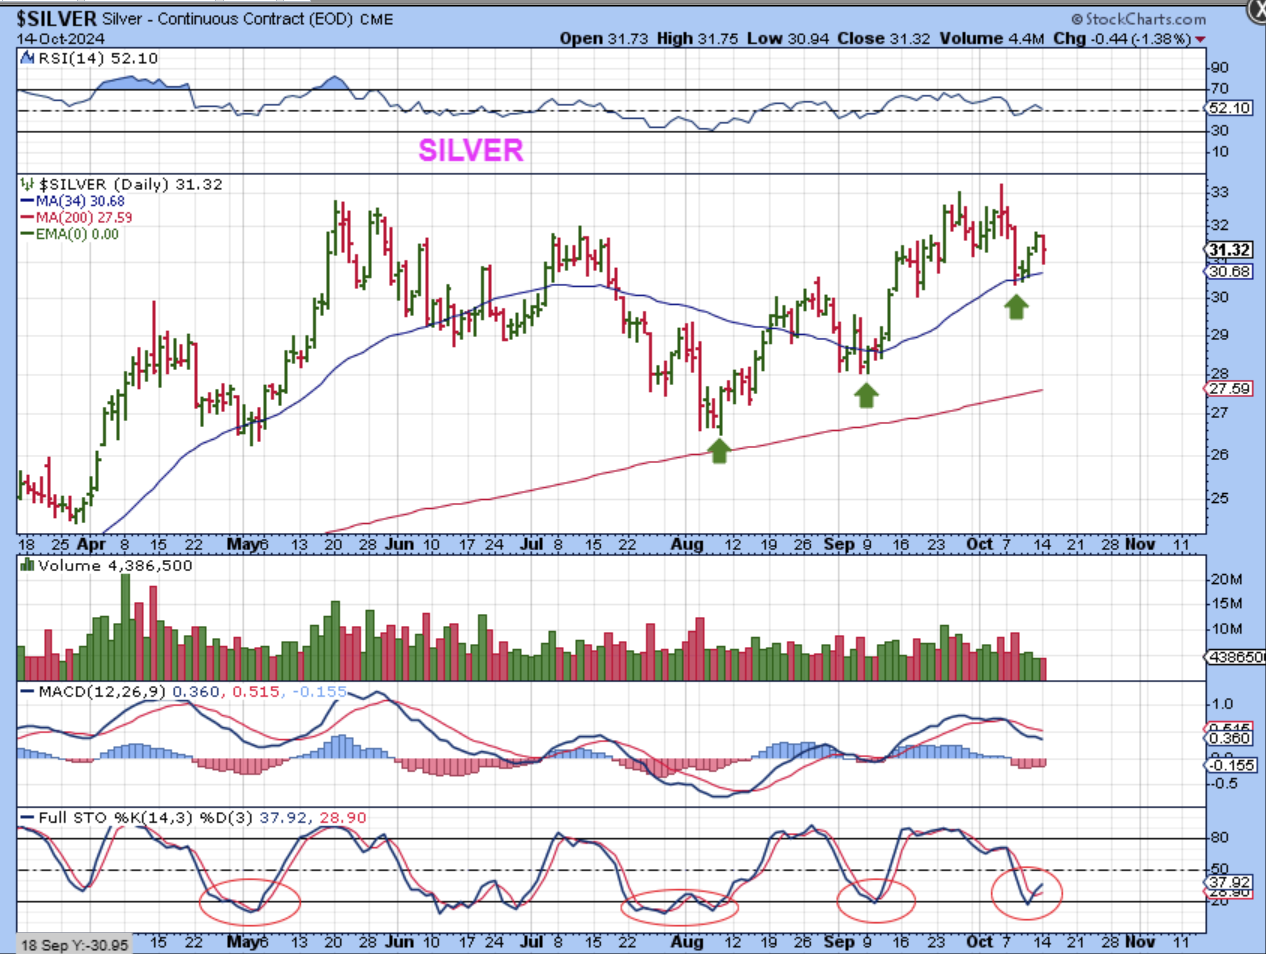
SILVER is choppy and has had some wide swings, but it bounced off of the 34 sma and looks to have a dcl in place with Gold too.
.
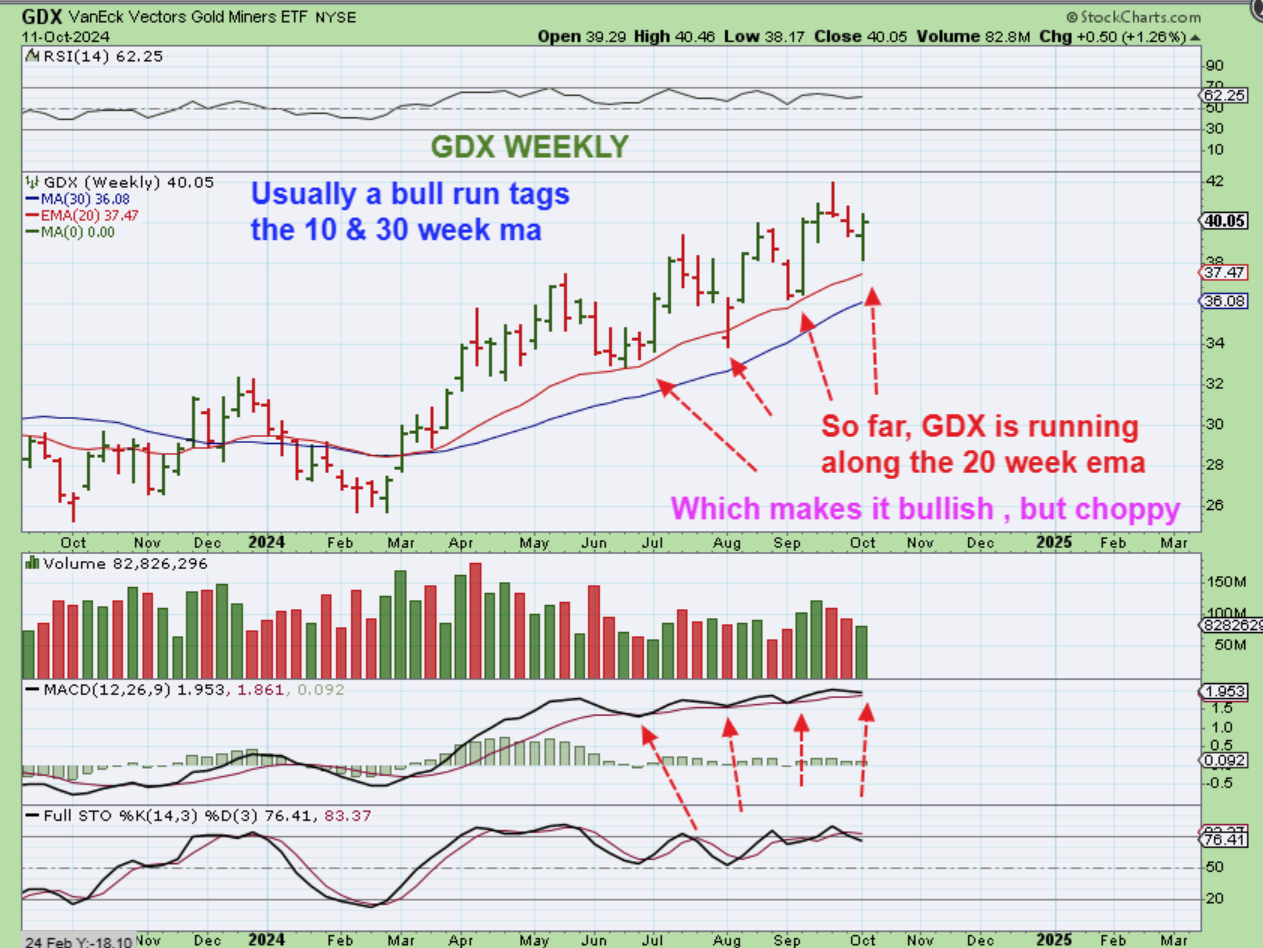
From the weekend: GDX is Choppy, but in an uptrend. I was looking for follow through Monday.
.
GDX WEEKLY – A strong bull run often runs up along the 10 week ma, but we are currently ‘chopping’ along the 20 ema with wider swings. That could change at any time and last week we did get a reversal, so we’ll look to see if we can get some follow through next week.
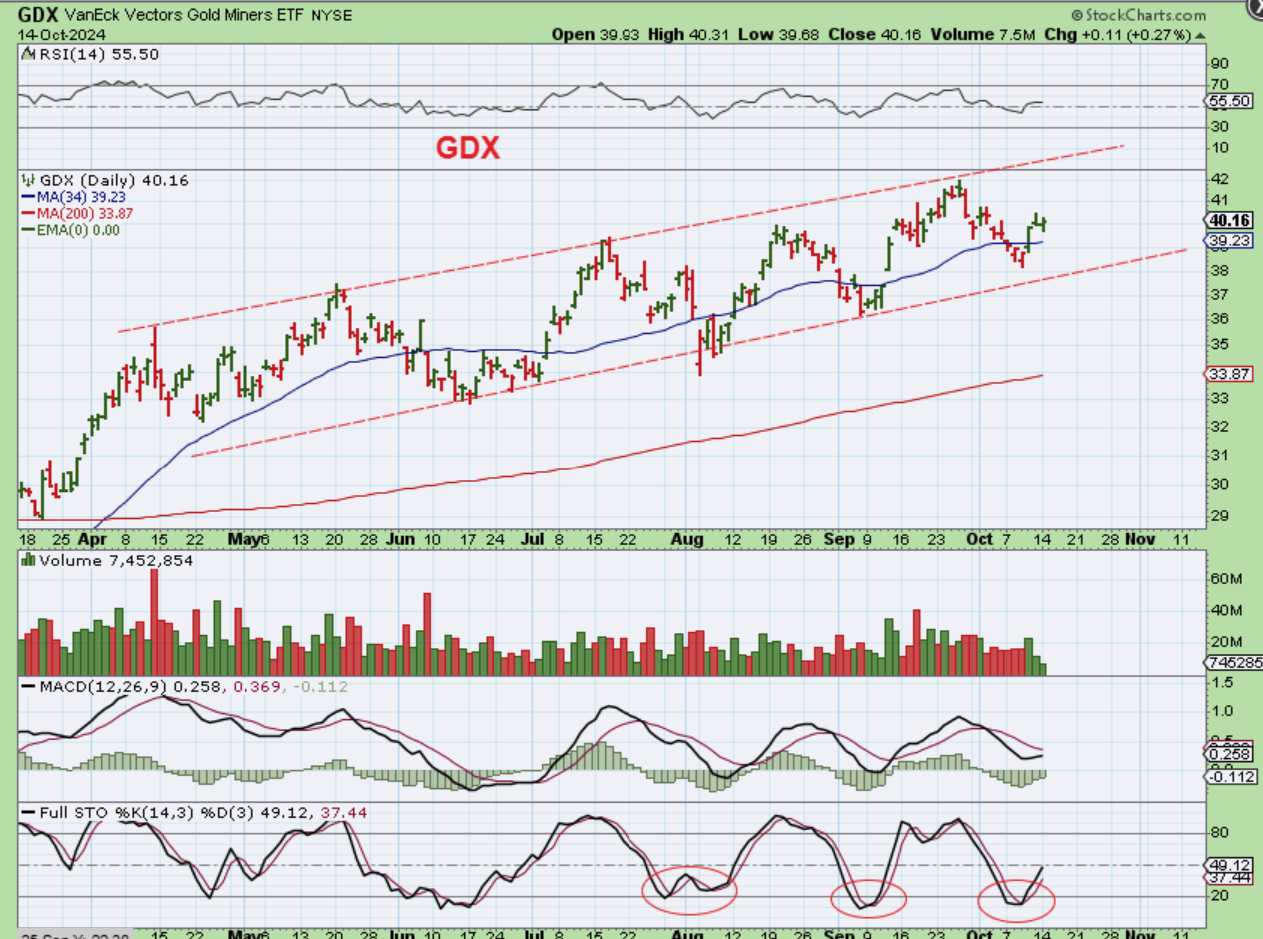
.
Well, GDX didn’t really give us strong follow through, but there is time to see if it can get to the upper trendline.
.
The markets remain bullish, and Bitcoin had another good day, so I’ll discuss crypto below. Enjoy your Tuesday trading!
.
~ALEX
.
From Friday:
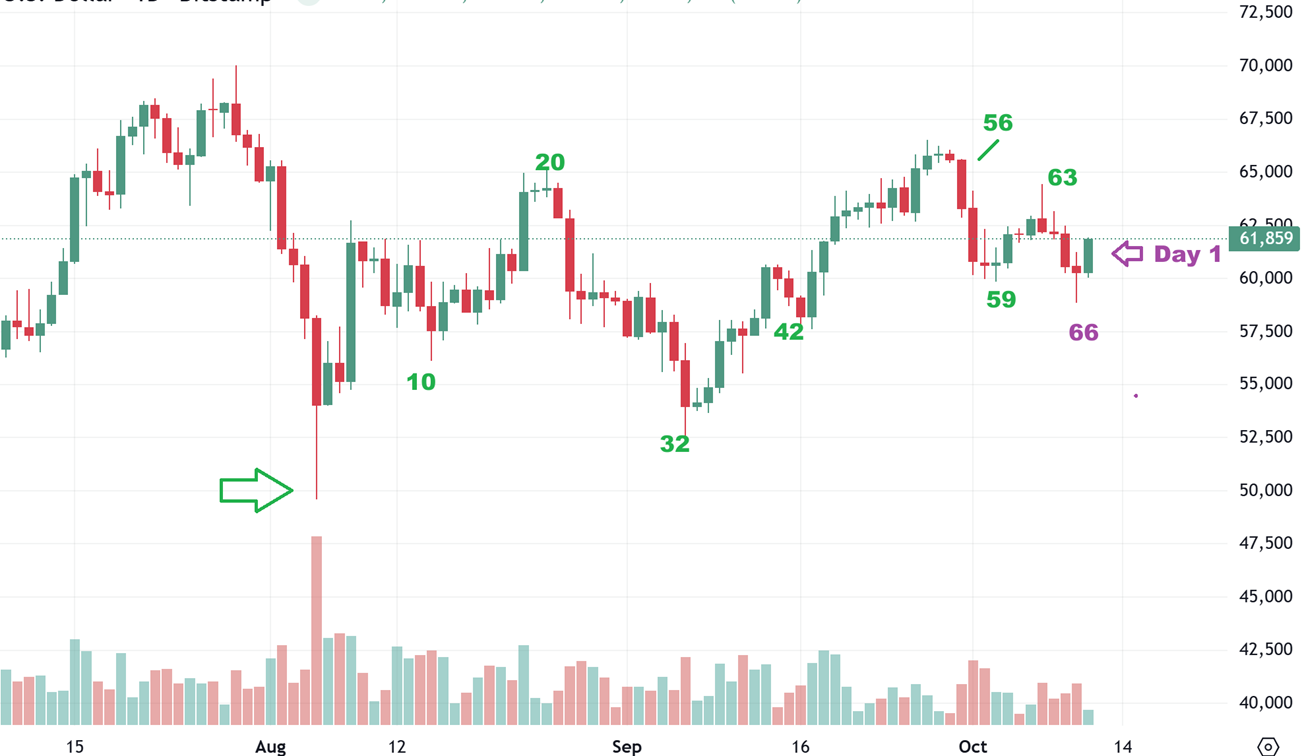
Bitcoin only had a 1 day spike down, and now we have a day 66 low with a swing. I captured this chart on Friday. Saturday would be day 2 and Sunday day 3, so day 4 is Monday.
.
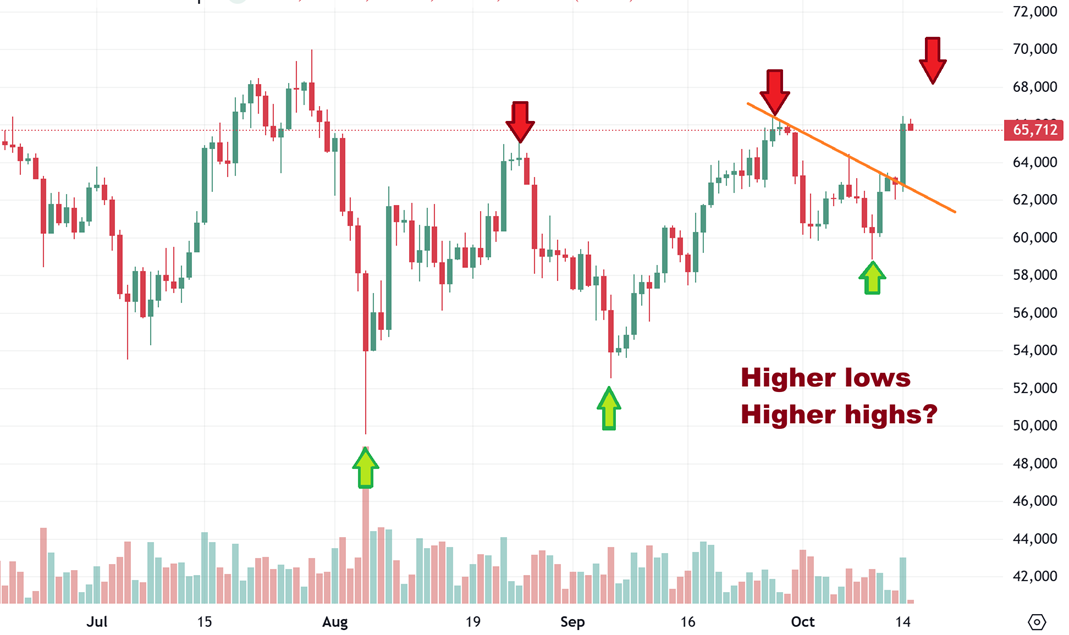
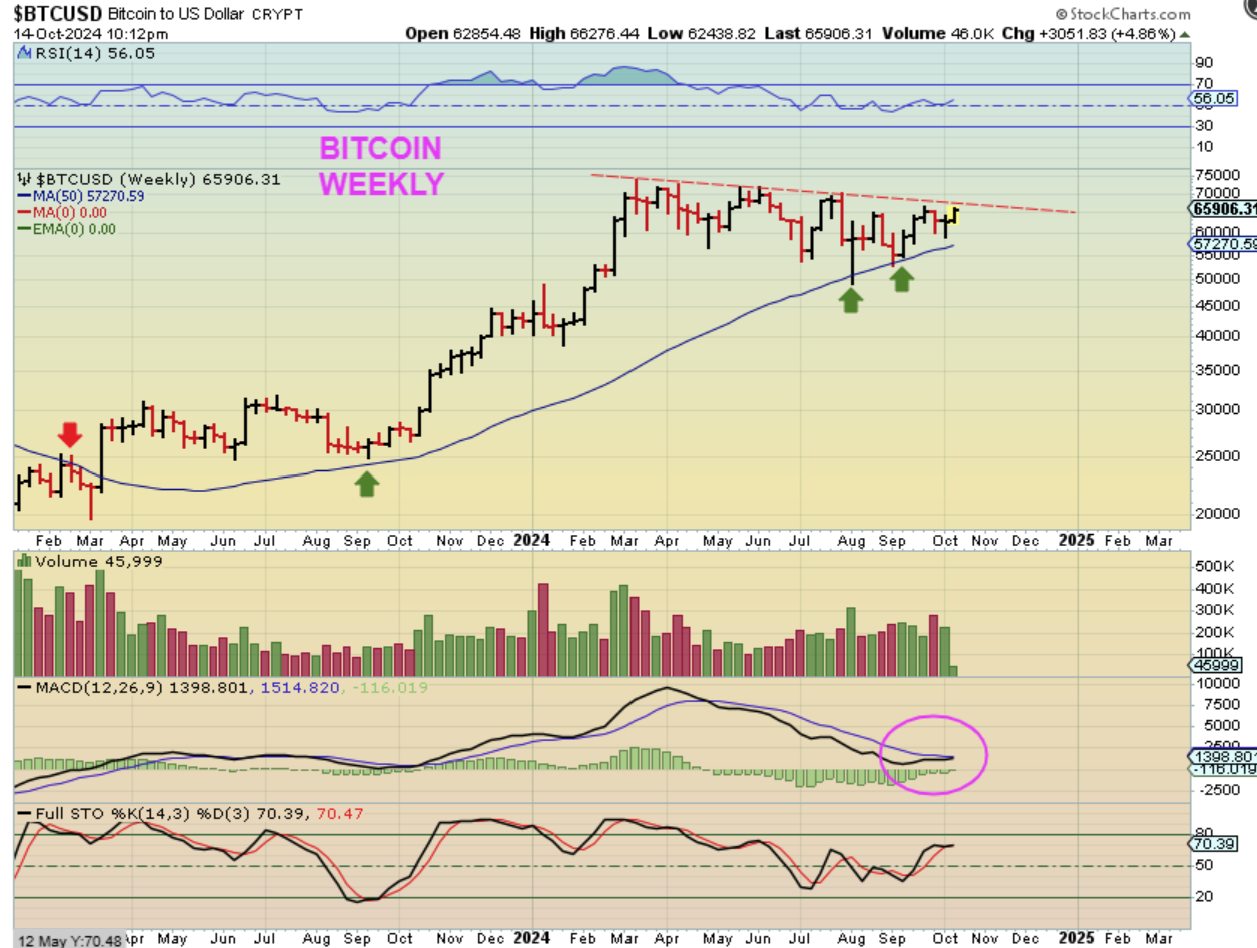
Bitcoin – With a series of higher lows and higher highs starting to show up, I want to go to the bigger picture, because this is starting to look like a bullish uptrend developing. We all know that we have an upper trend line on the long consolidation as resistance, so let’s take a look…
.
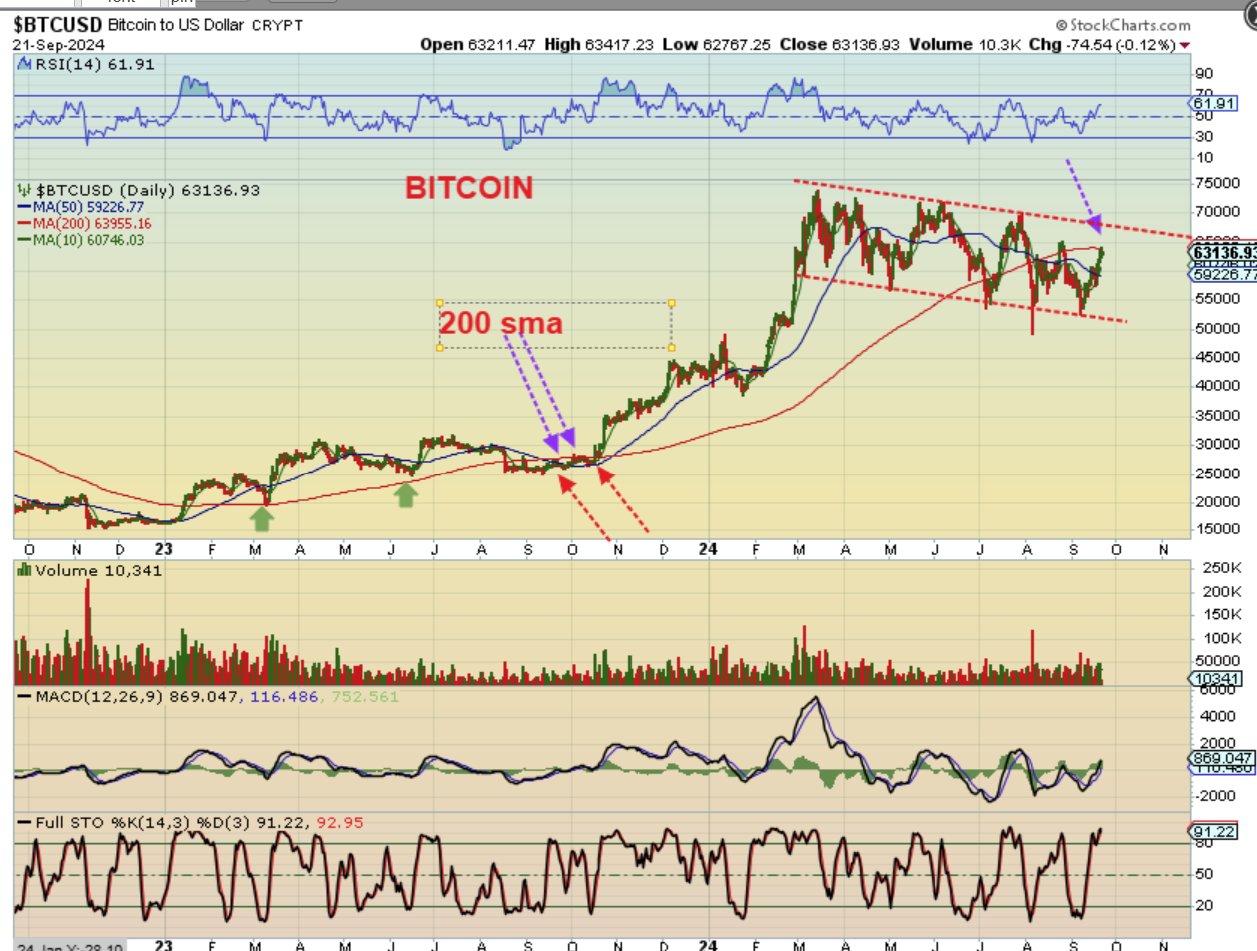
On September 21st I pointed out
1. The 200sma as resistance in September and October 2023 & also now in September – October 2024.
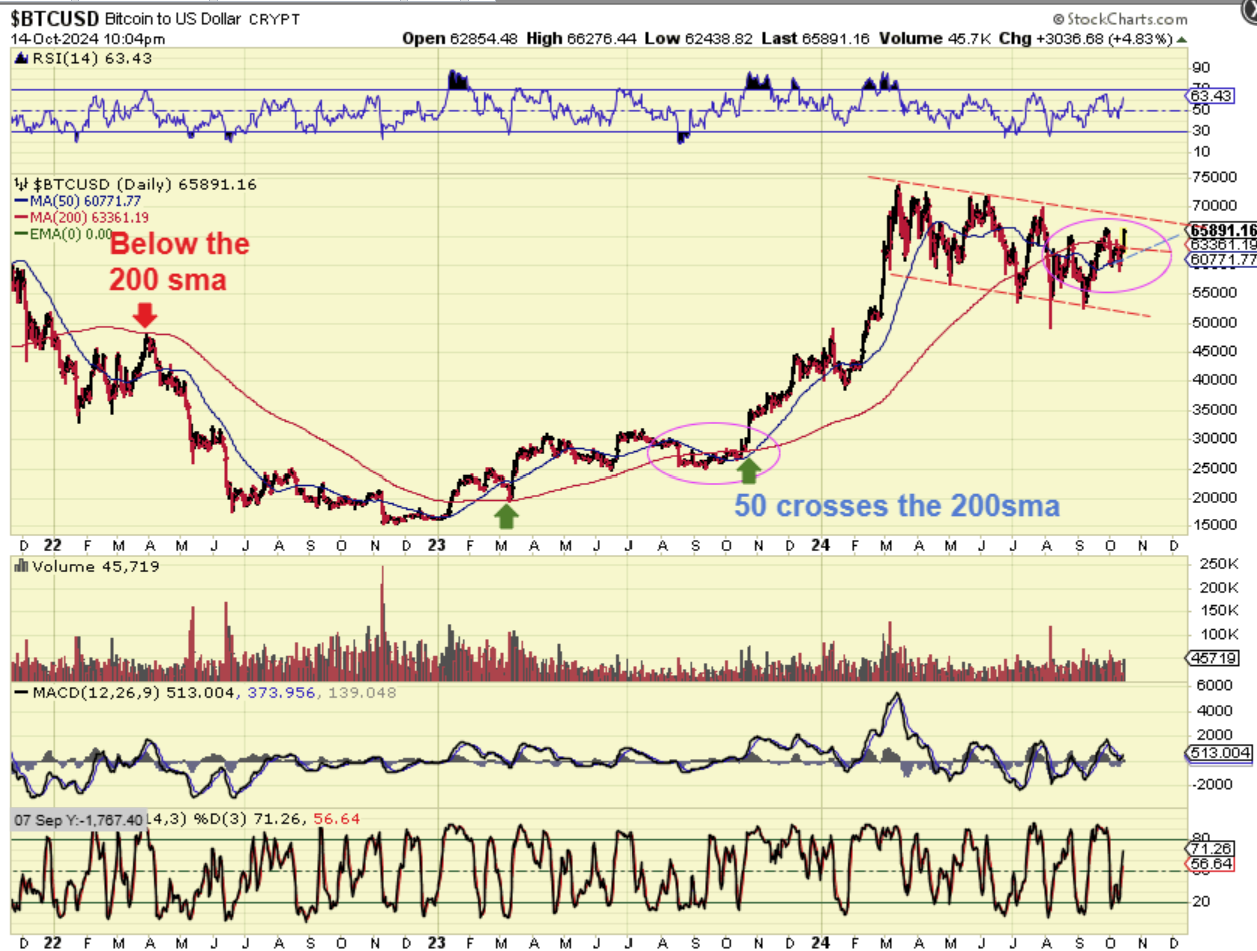
2. The 50sma was under the 200sma then also. NOTICE: A break above the 200 sma in OCT 2023 started the rally. Will it in Oct 2024?
.
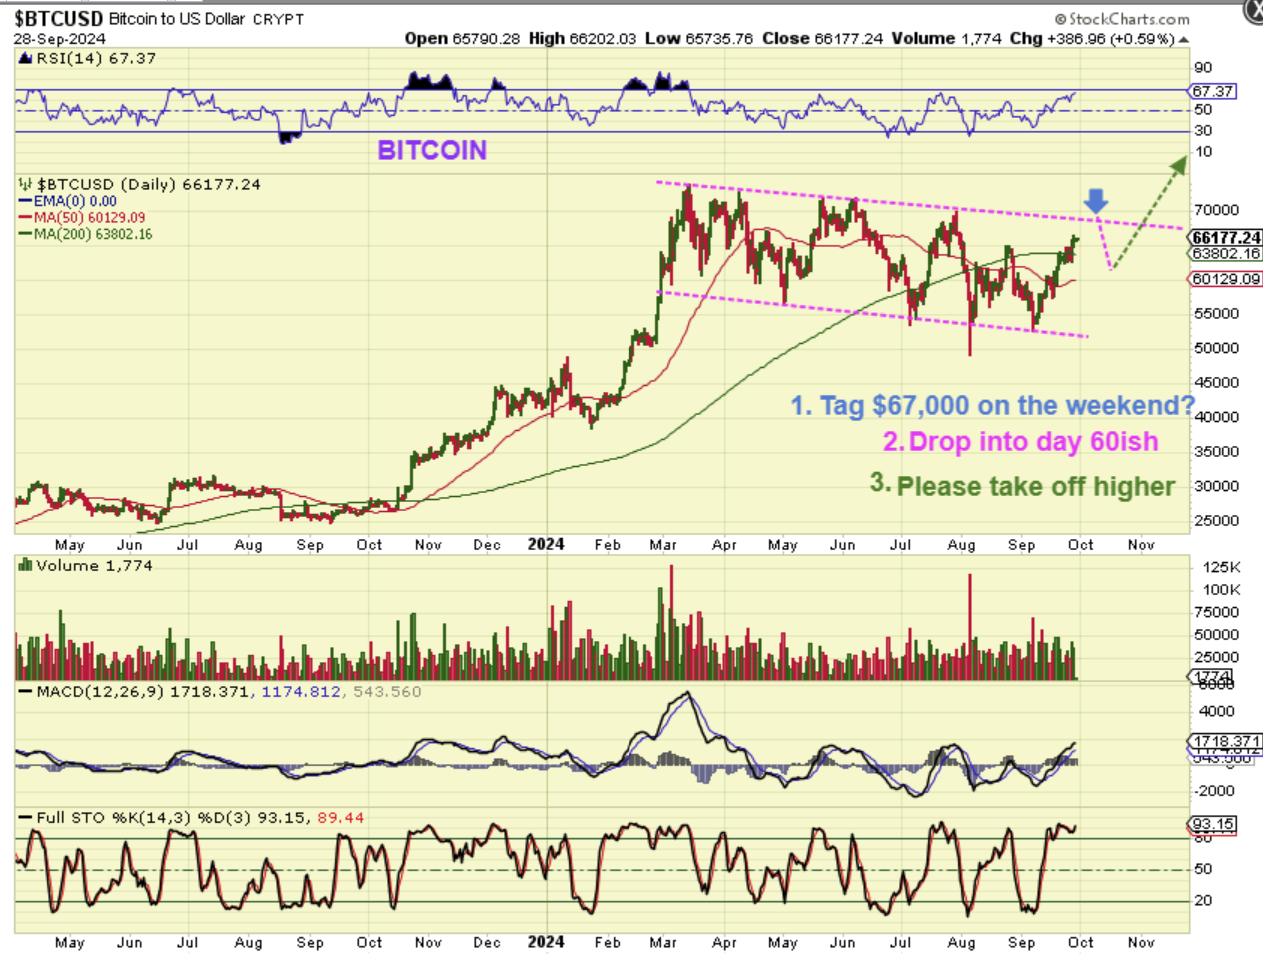
Bitcoin – On September 28th, I said that Bitcoin could tag $67,000 and then drop into a dcl, roughly near day 60. Then I would expect a run higher.
.
Bitcoin tagged $66,500 and then dropped into that dcl at $58,800, and now we are at Oct 14 on this chart and we are rallying out of that dcl. BITCOIN did bounce off of the 50sma and did breakout above that 200sma now. This gives us a series of higher lows, as we climb to the highs of this consolidation. Will Bitcoin breakout?
.
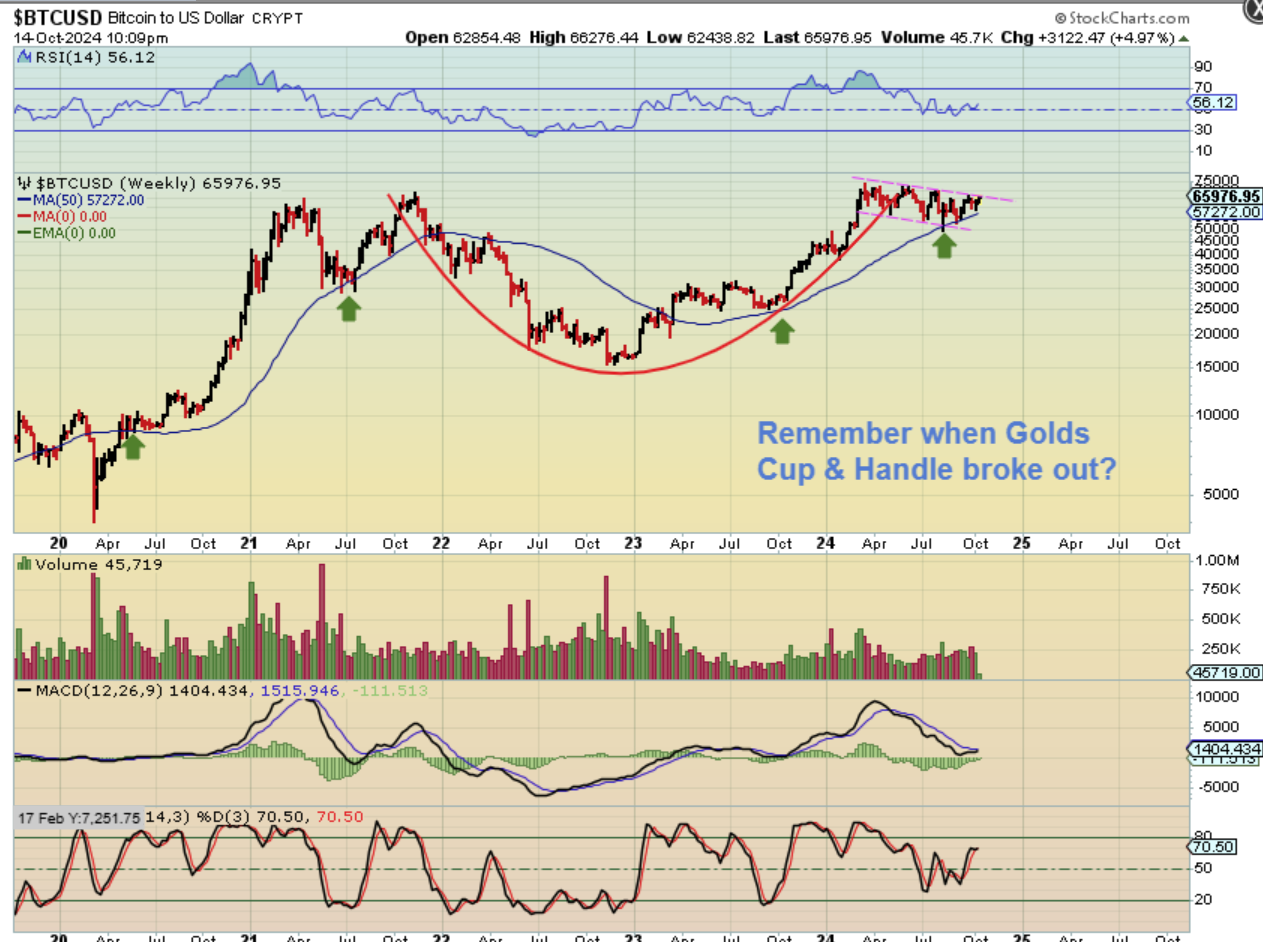
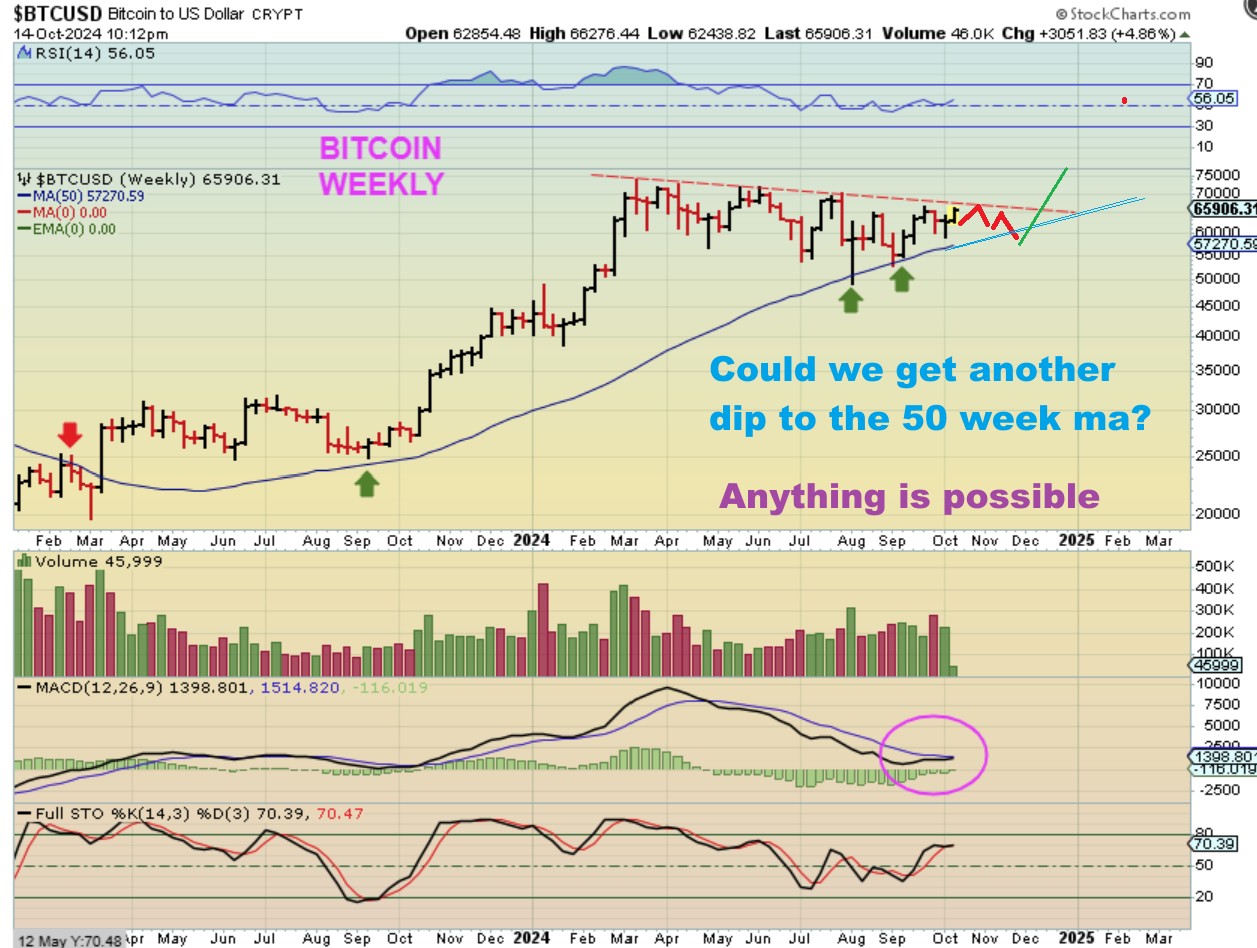
Bitcoin has formed a massive cup and handle and as price climbs that 50 week ma, it may be ready to break out. Do you remember how quickly Gold ran higher when it broke out from its cup & handle? It also moved the Miners up quickly.
.
GOLD was very choppy right before it finally broke out, but when it did breakout, notice that it pretty much rallied straight upward.
.
So Bitcoin is starting to look like it wants to breakout near $70,000 on the weekly charts. It is still bouncing above the 50 week ma and now we have higher lows. The weekly MACD is about to cross upward. Things look good in the big picture.
.
Bitcoin is known to be choppy and so it could chop along the highs on a daily chart (This is a weekly) and then drop one more time. It DOES look ready to break out with the recent strong move out of the lows, but I just want us to be prepared for anything. This would construct a more symmetrical pattern for the right side to match the left side of this consolidation.
.
Finally:
.
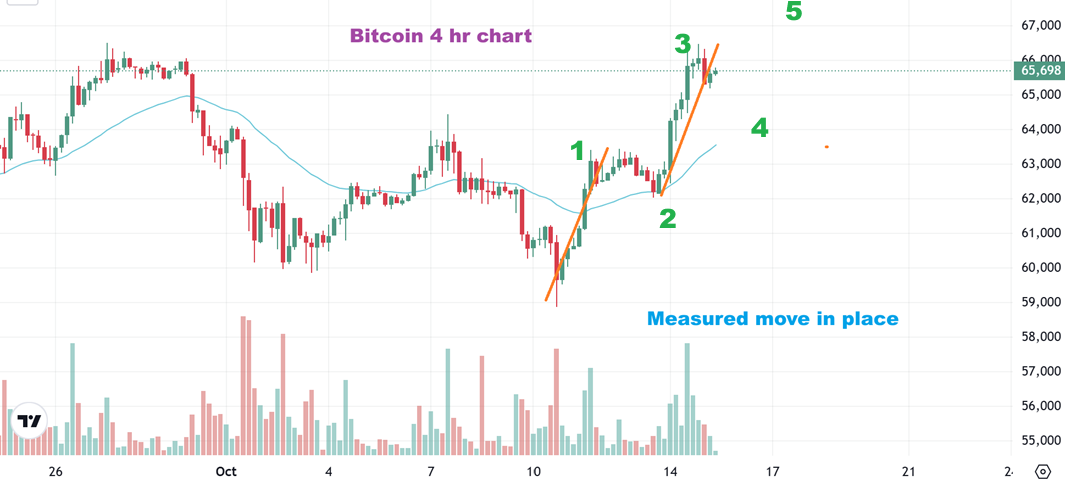
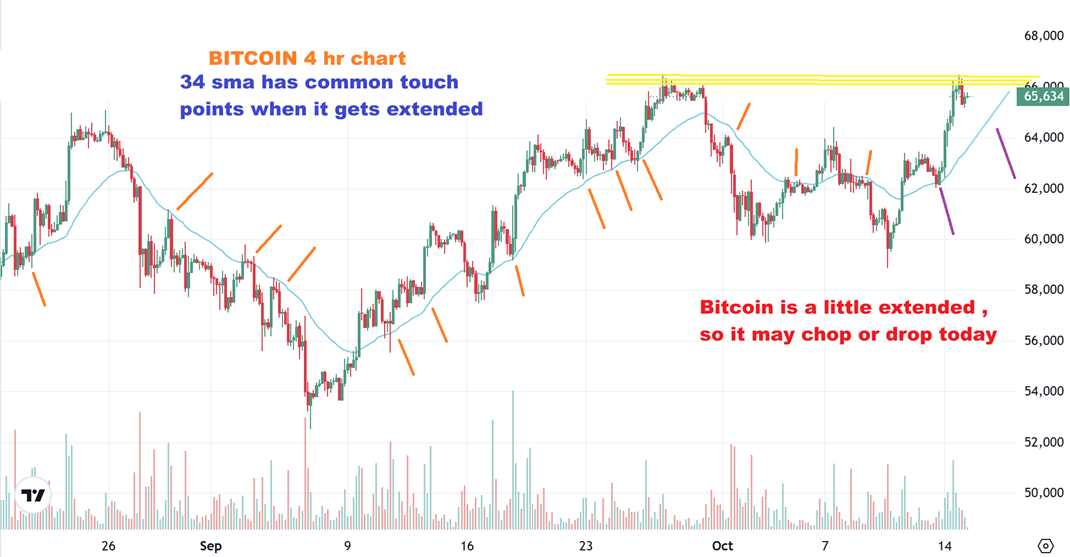
Bitcoin has been running straight up out of the lows and that eventually causes price to pull away from the moving averages that it often rides along.
.
On the 4 hr chart (each candle represents 4 hrs, so only 2 candles will represent todays trading), each rally straight up did chop or drop back toward the 34 sma. Since we are at a prior high and that can act as resistance, today may be a choppy day for Bitcoin. We’ll see, since this could also break out and pull back later.
.
Bitcoin I did mention that we could see a 5-wave run, and so far, the first and 3rd wave match size-wise. Wave 3 can be longer than wave one, so again, we’ll just have to wait and see how today unfolds. I just wanted to show you that if we get a pull back, it is normal.