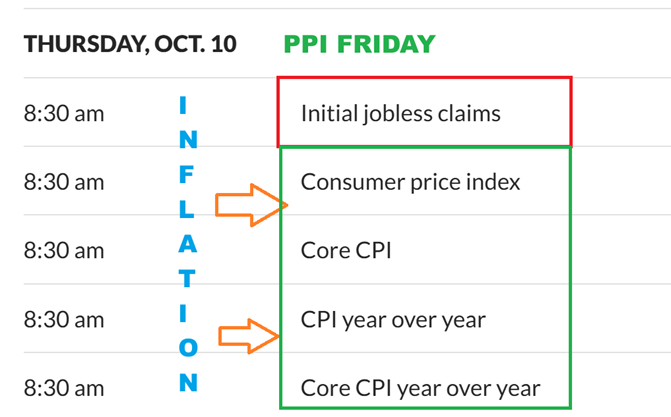
Thursday October 10th – CPI & PPI Numbers
.
DATA – We have market moving data to be released on both Thursday and Friday. Recently the Jobless Claims and Inflation data has been bullish for the General Markets and Precious Metals, because it indicated future rate cuts were still in the works. FROM WHAT I SEE RIGHT NOW, this data does look good for the markets (Maybe Jobless Claims), but the charts aren’t quite aligned with a positive reaction yet in the Precious Metals. THAT MAY CHANGE, but in this report I am simply going to ‘report’ what the charts seem to indicate. Let’s go to the Charts!
.
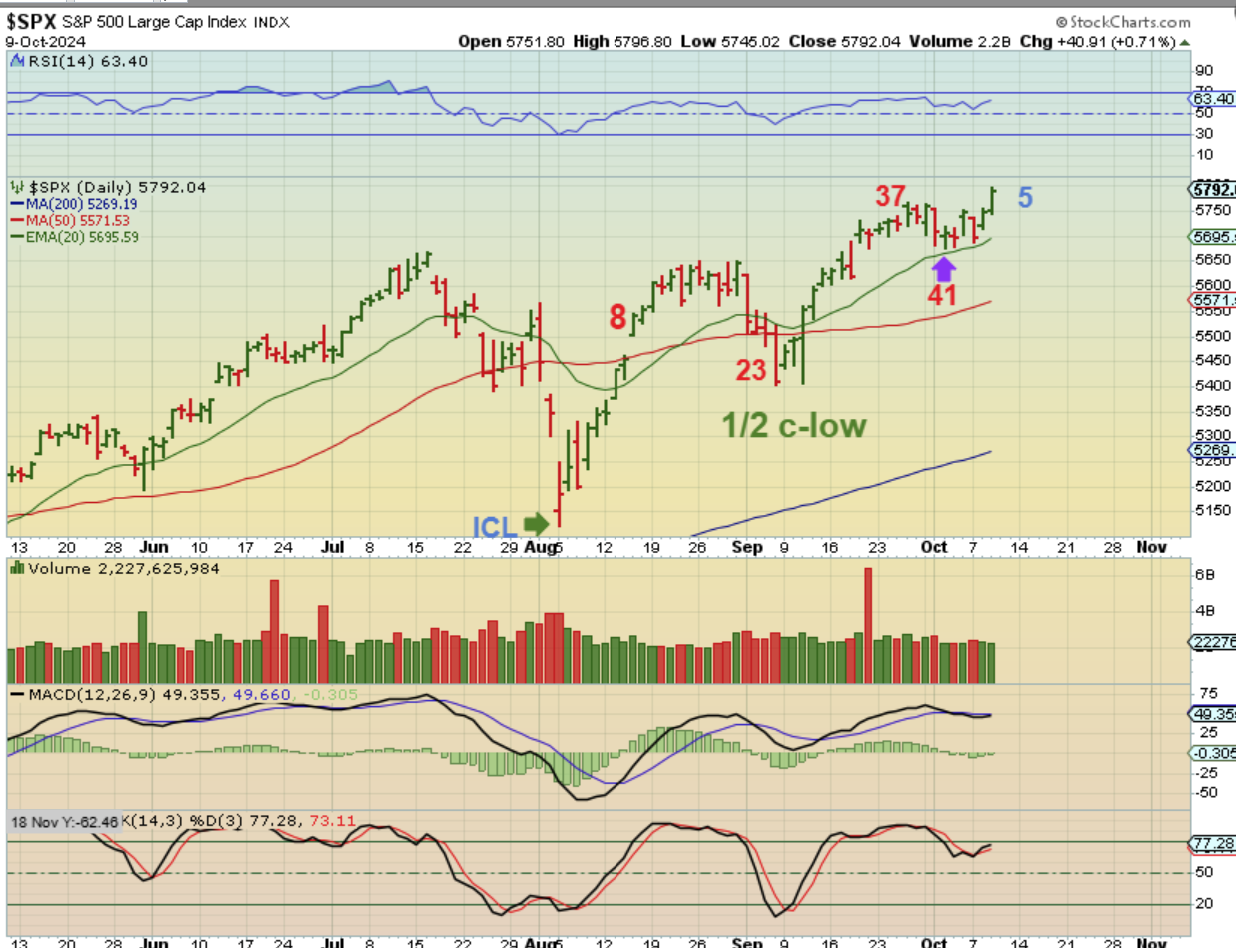
THE SPX continues to have a bullish set up and the 2nd daily cycle is on day 5 as it breaks to new all-time highs. This looks like it can react bullishly to the data.
.
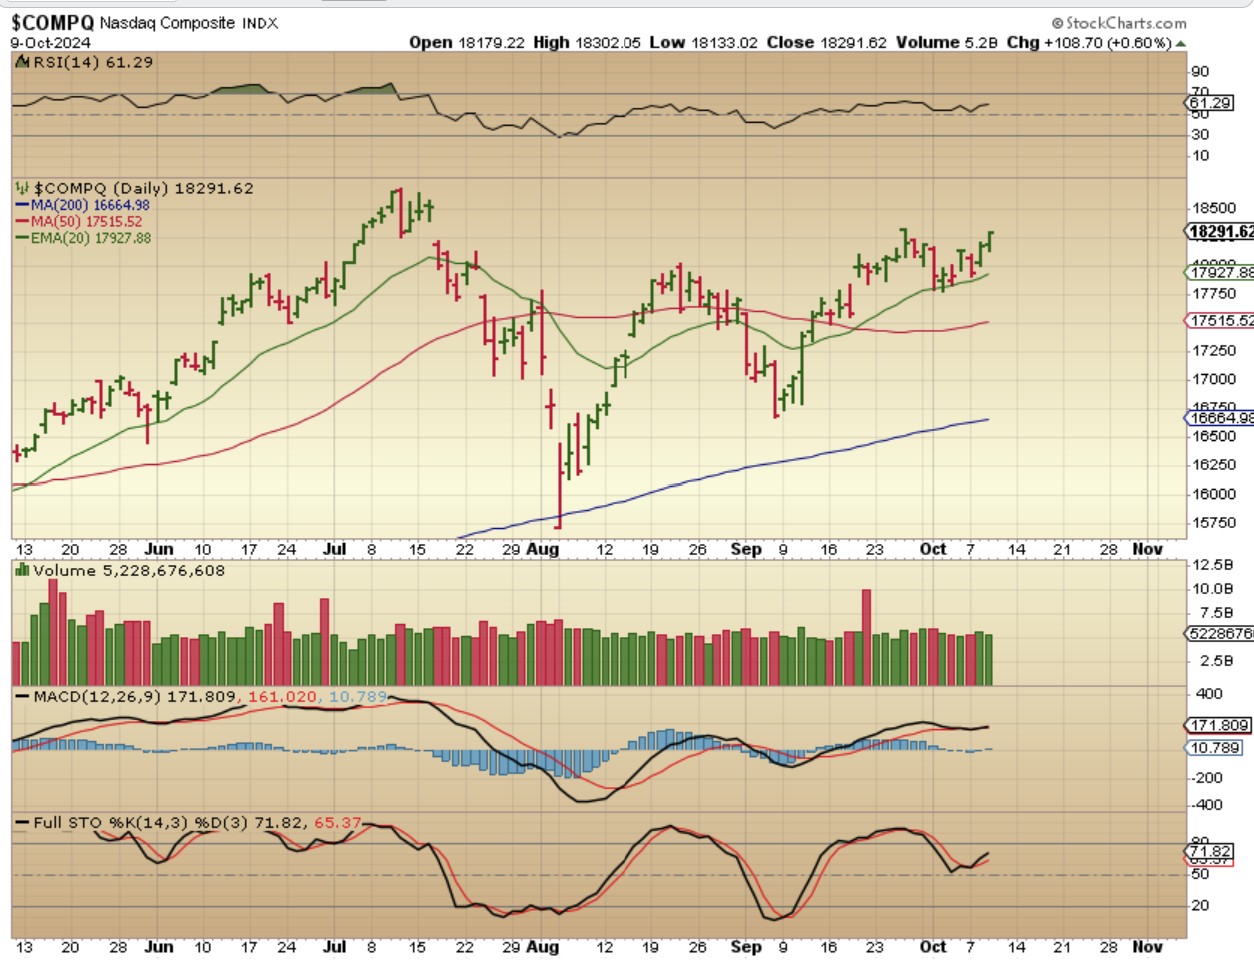
THE NASDAQ also has its dcl in place and looks ready to continue higher.
.
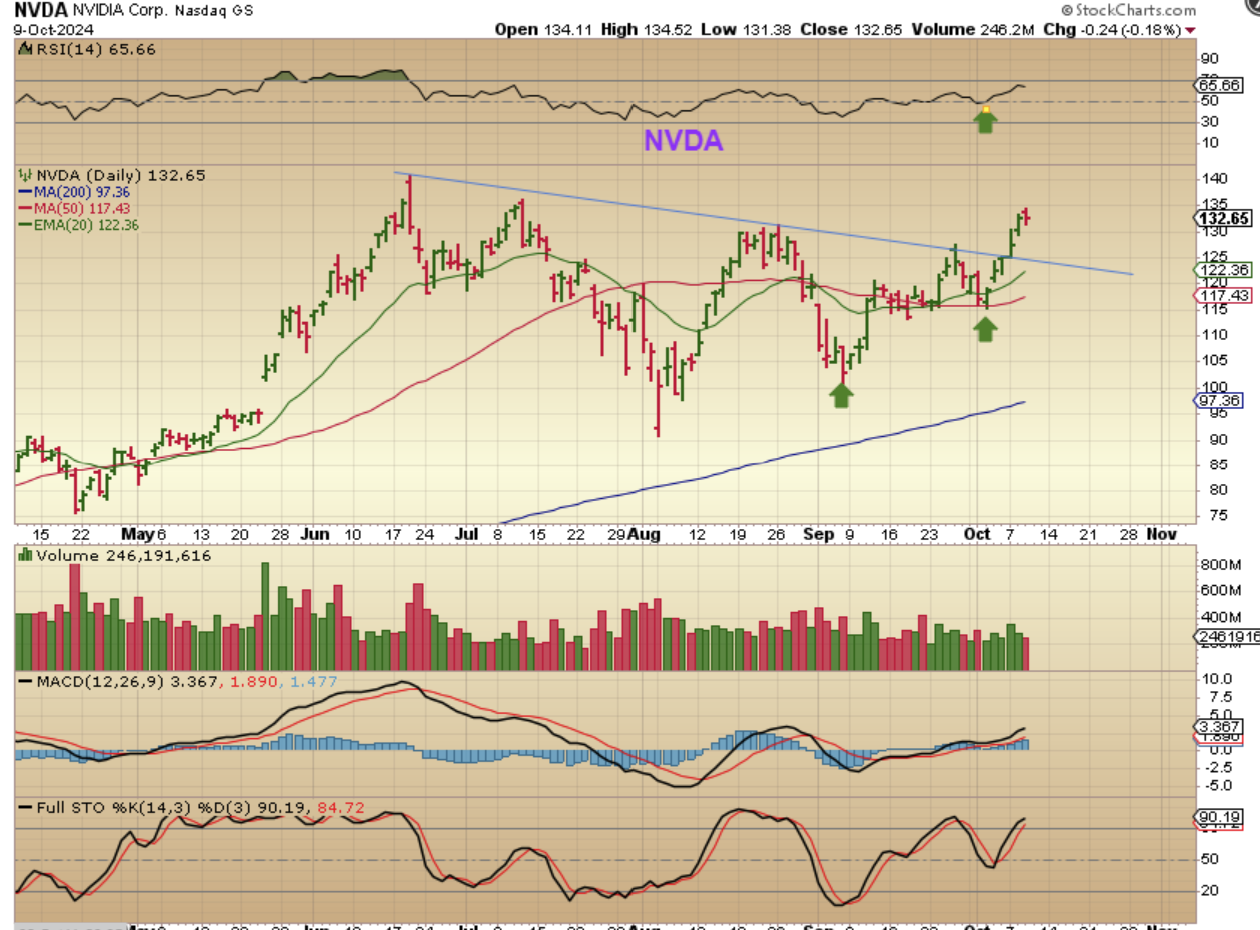
NVDA was mentioned as a buy recently and has been playing out rather nicely. Unfortunately, AMD and MU (also mentioned) are moving at a slower pace, but that may mean that AMD may still be a buying opportunity.
.
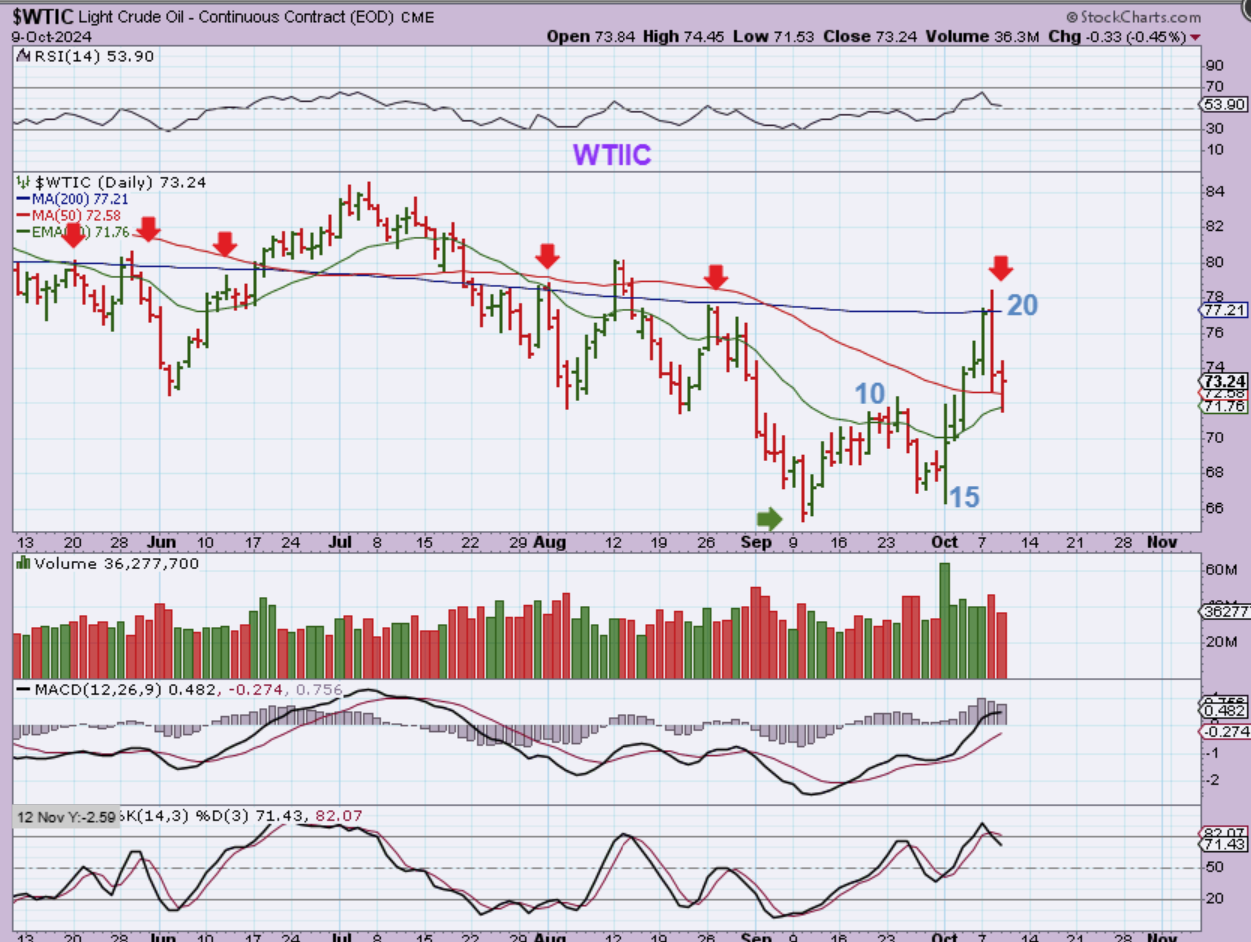
WTIC – Oil fell again, but it did try to bounce off of the 20 ema, so it may chop around between the support and resistance areas, but it also could just drop to the lows and repeat what it has done. I am not recommending Oil trades right now, due to this choppiness, but I will mention this…
.
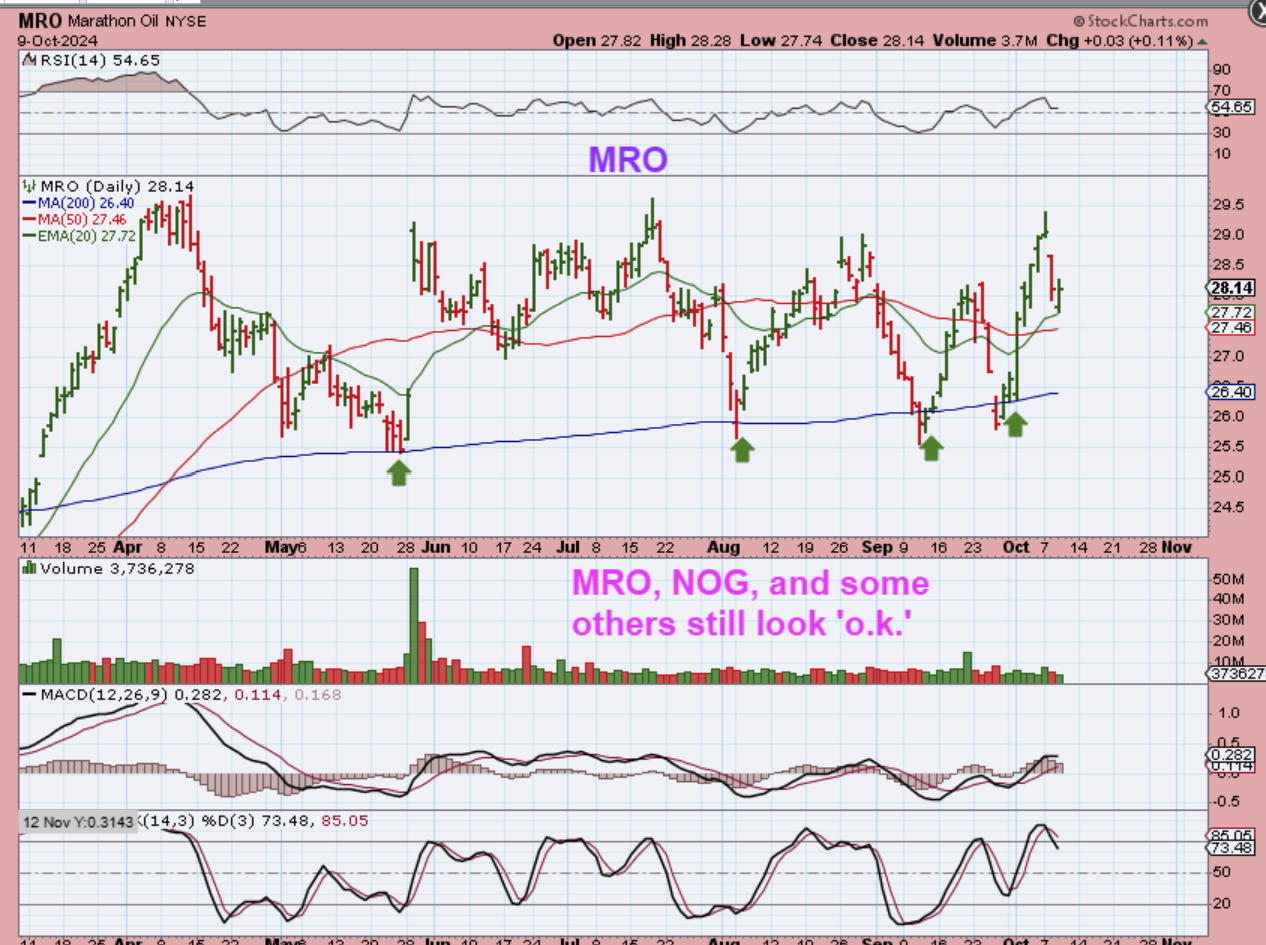
I am not recommending Oil trades right now, but I will mention this: MRO, NOG, and a few other Oil stocks do still look pretty good, despite what Oil has been doing.
.
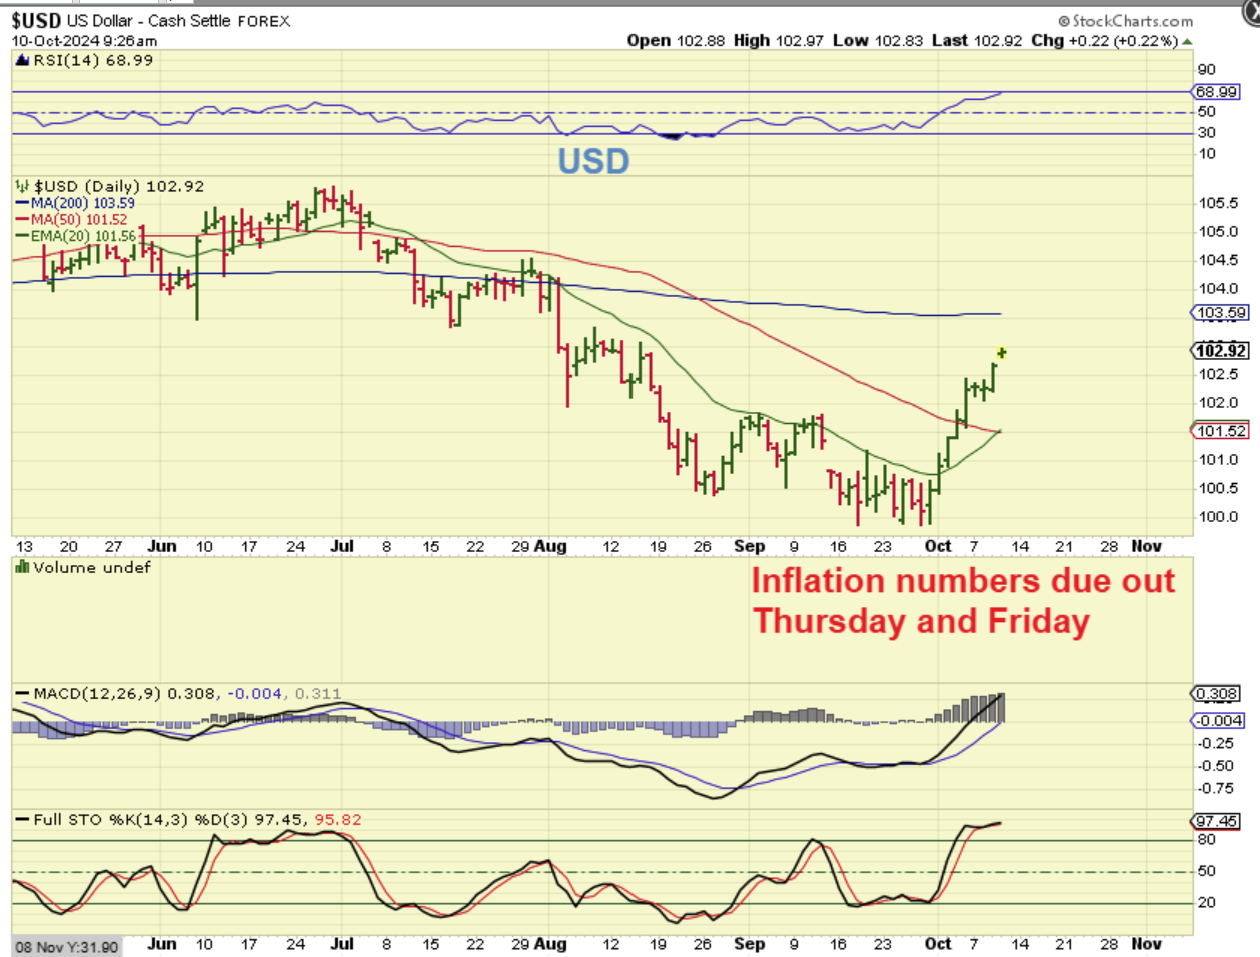
USD, GOLD, SILVER: THIS IS WHERE I THOUGHT THAT THINGS MIGHT LOOK DIFFERENTLY THAN I WOULD HAVE EXPECTED, WITH THE CPI & PPI INFLATION DATA DUE OUT (& A RATE CUT POSSIBILITY):
.
USD – The thought of a rate cut usually drops the USD, but it looks like it still wants to go higher. The USD didn’t reach the upper level yet. MAYBE it drops to the 50sma on CPI (?) and does a 2nd leg up later? Or maybe the data doesn’t show that a strong cut (.50) is needed, so the USD does just continue higher for a few more days? We’ll see.
.
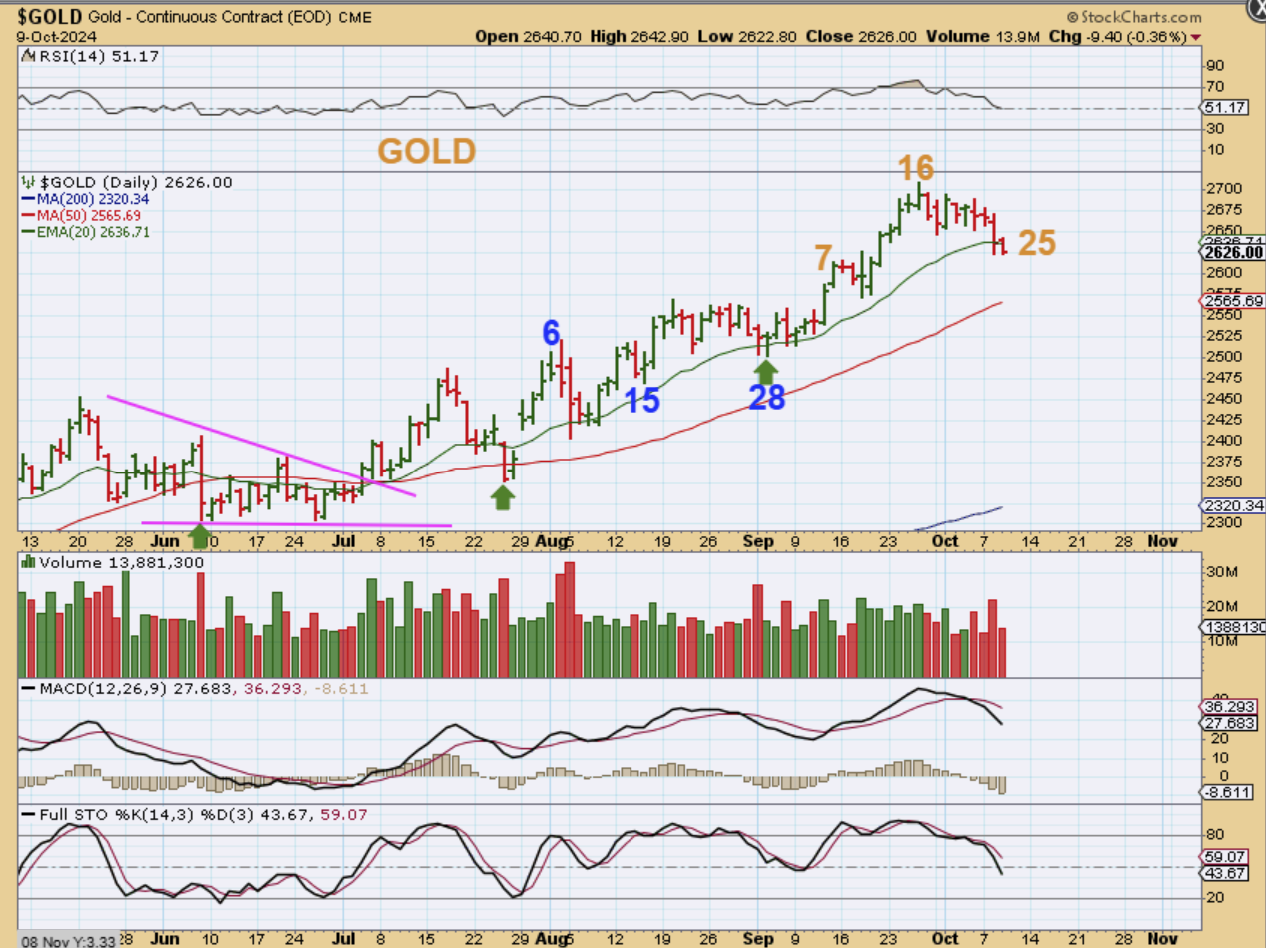
With GOLD, we could form a dcl here, since past dcls were anywhere in the 22day plus range, but this also looks like it could drop to the 50sma into maybe day 28-30, if the USD kept running higher. Did inflation spike a bit, and thus a strong cut is not needed? We’ll see. If inflation dropped as expected, it would seem that a rate cut is coming and it COULD be another .50, and that should send Gold higher. Again, we’ll see.
.
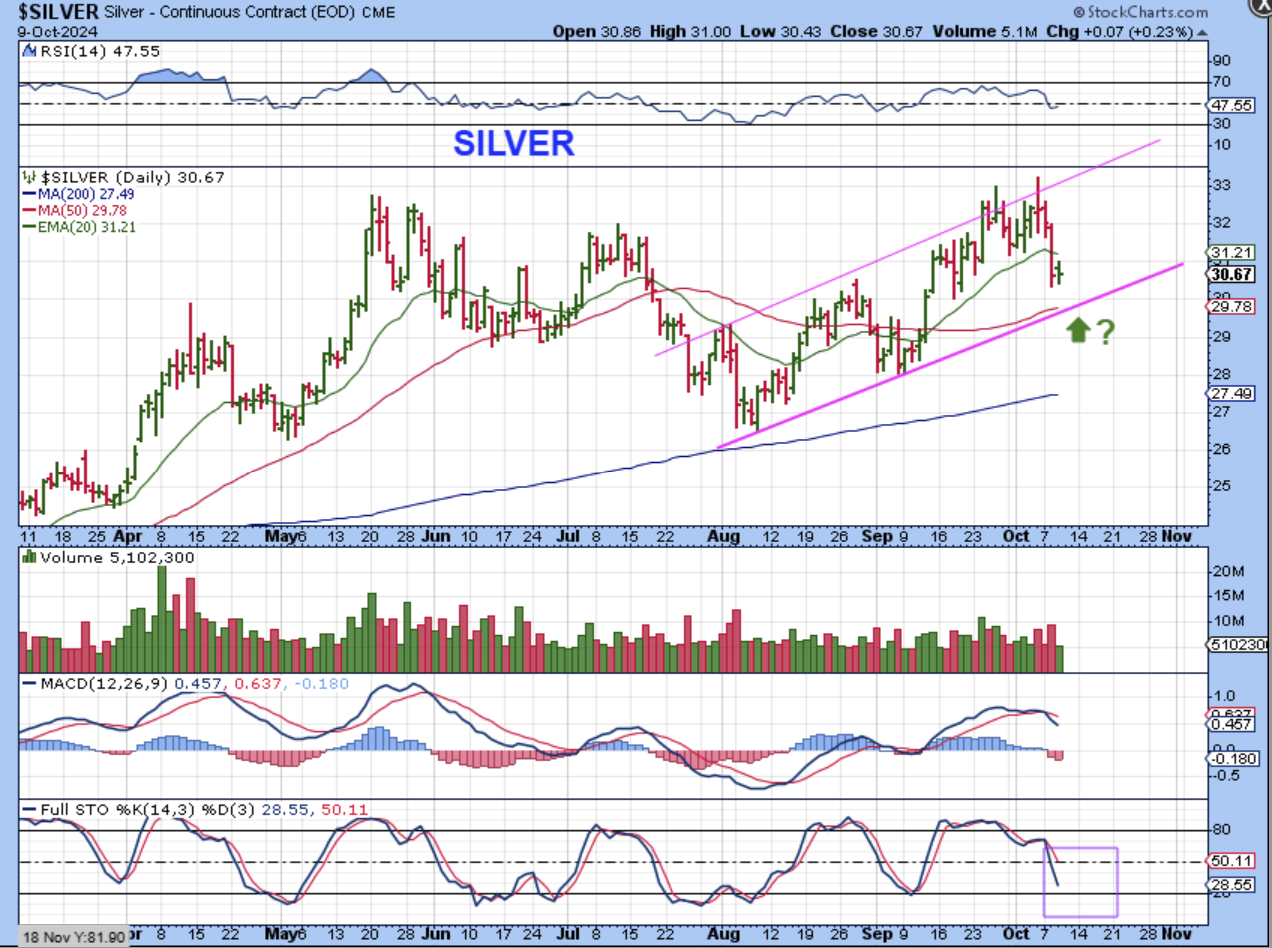
SILVER – Doesn’t this also look like it wants to drop a little more if the USD runs up to the 200sma? Silver stocks aren’t really selling off recently, so that’s good. They have dropped and tried to recover over the last 2 days, so a low may be very close. The 50sma & lower trendline could be a downside target? We’ll see.
.
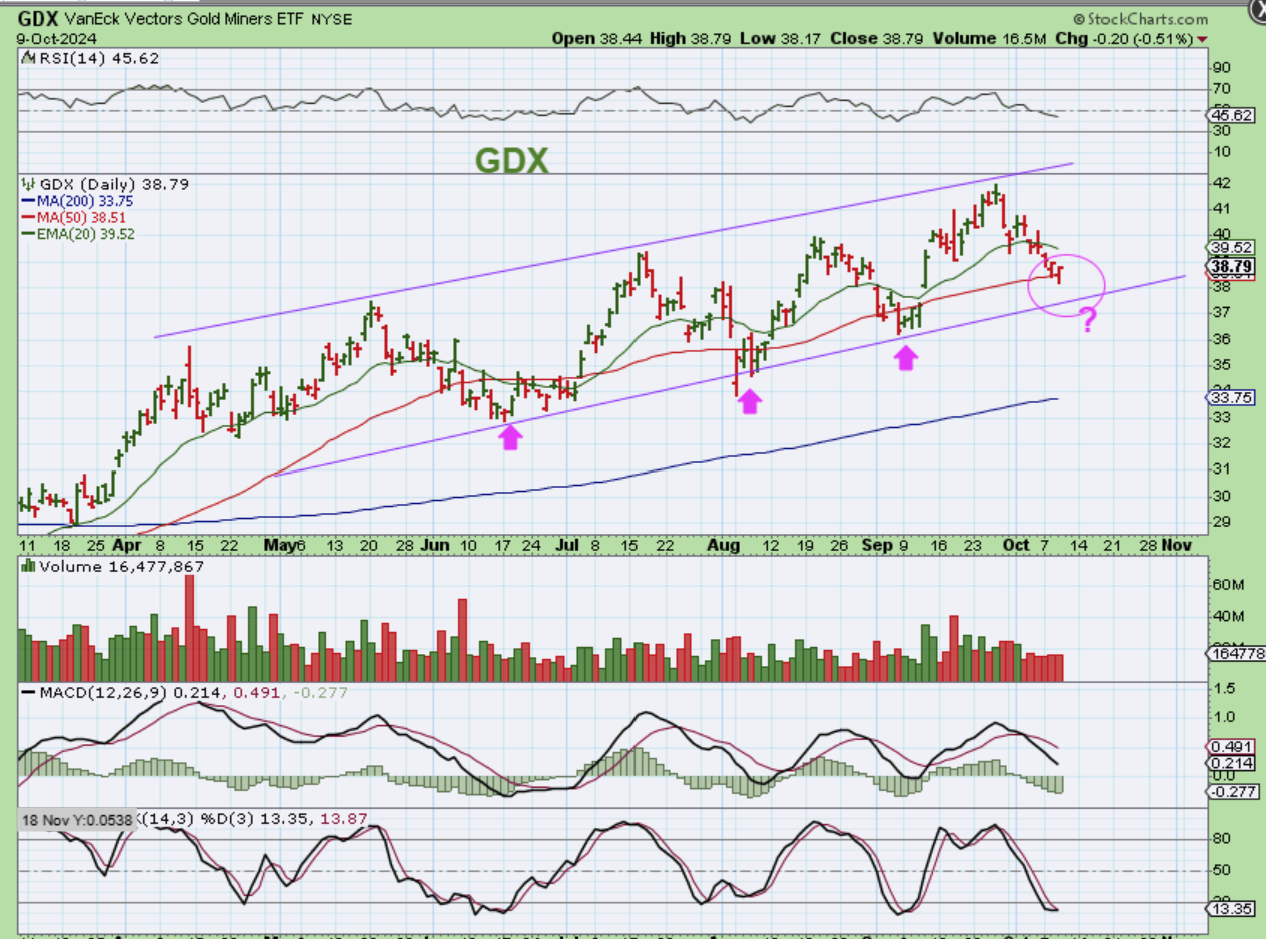
GDX was also dropping toward the lower trend line, but then it reversed at the 50sma twice. It did this when Silver and Gold dropped sharply, so that seems bullish. That said, this set up looks like it would drop if the USD rises to the 200sma with the CPI & PPI Numbers. Gold, Silver, and the Miners do look like it would be normal for them to continue to drop just a little lower. So COULD WE get a dcl with CPI & PPI? Yes, we could, but the charts just seem to be indicating that a little more downside would fit in as a normal pull back.
.
The General Markets still look good, but some of the charts are set up slightly different than I would have expected with inflation data being released. We are expecting the data to indicate the need for further rate cuts, but MAYBE the initial reaction will be a dip with no thought of a 50% cut, and then a rally next week after a fake move lower finishes up this week. Or, it is possible that the charts progress is cut short with the data, and the USD, GOLD, and SILVER do change direction today. Data comes out at 8:30 a.m. All eyes on the futures at that time. Enjoy your Thursday trading!
.
~ALEX
.
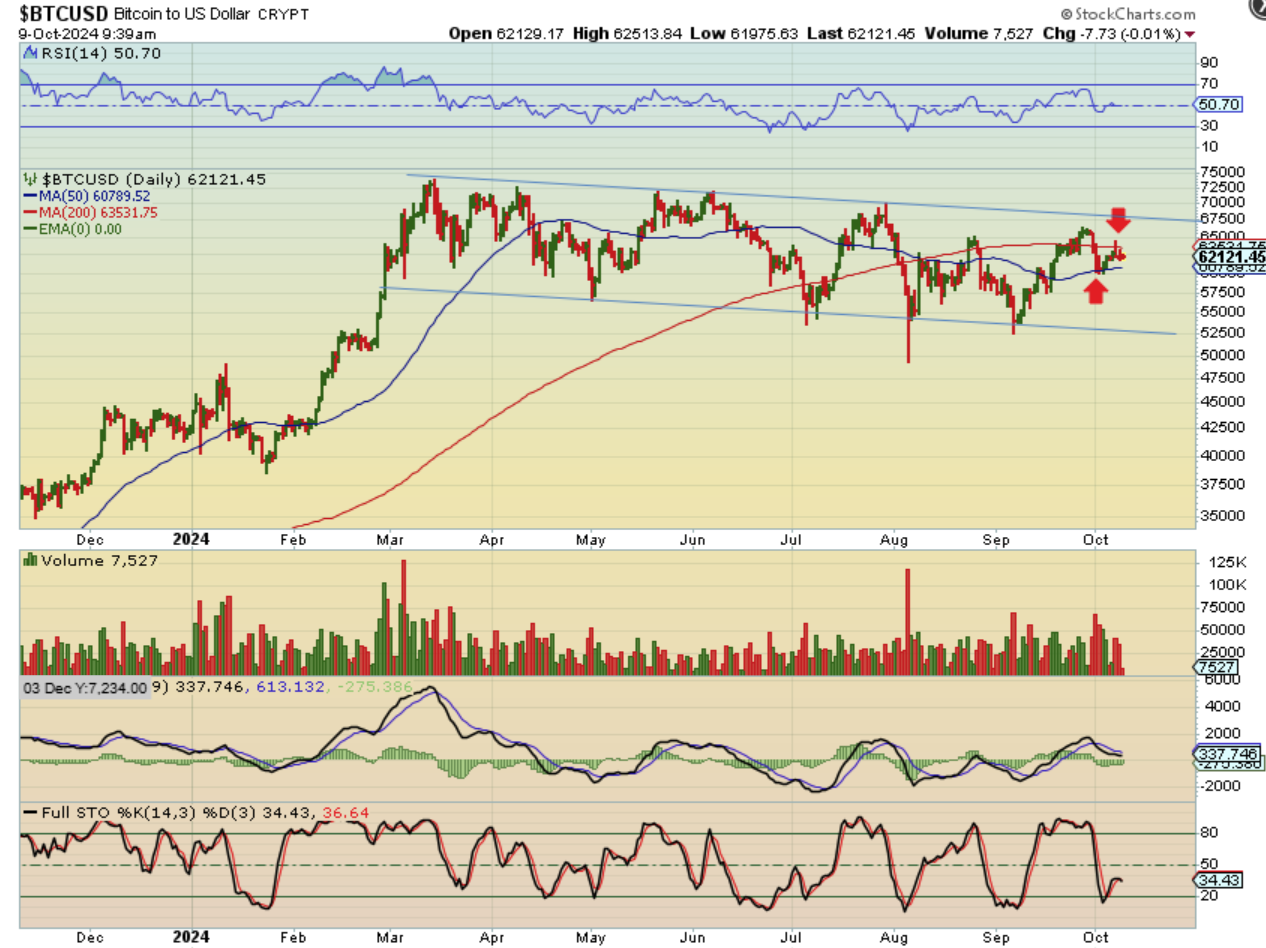
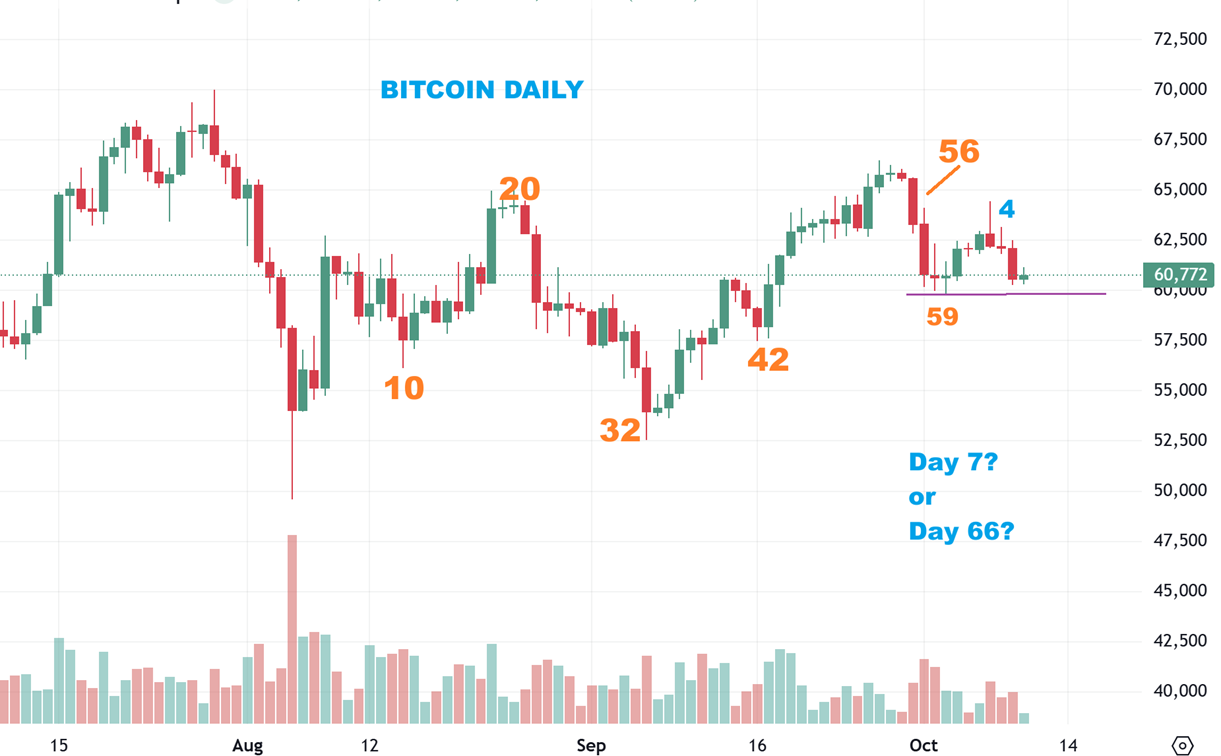
BITCOIN sold off and THAT was a little unexpected too. The lows have not been taken out but let’s briefly discuss expectation here.
1. We expected a day 60ish low, so the reversal and move higher at 59 was rather perfect.
2. After a pop & drop spike on what should be day 4, Bitcoin sold down. This raises the question: “Are the lows behind us or could they still be ahead?”
3. Today would be day 7 if the lows hold and Bitcoin turns up, but if the day 59 lows are broken, then I would have to do a continuation of that count and today would be day 66. We would then be very much due for a low, but this does get frustrating.
.
YESTERDAY I SHOWED THIS FOR BITCOIN – So basically, we dropped back to the 50sma again.
I just noticed on this chart that Bitcoin seems to be bouncing or stuck in between the 200sma overhead and the 50sma below price. This may be what is causing a ‘stall’ in the price return to former highs. It SHOULD be temporary resistance. Crypto stocks are choppy and difficult.