
Thursday October 3rd
.
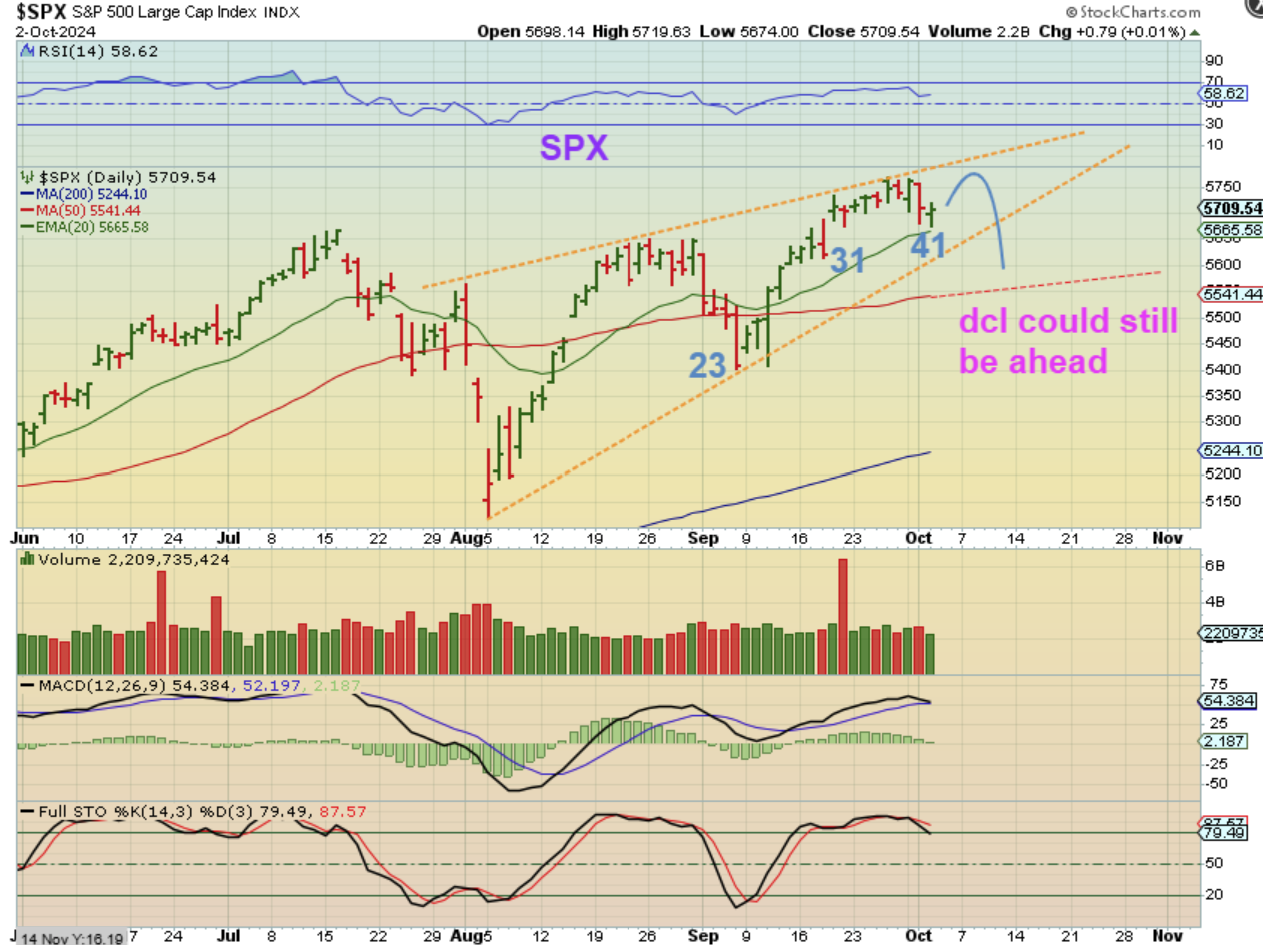
THE SPX dropped to a slightly new low on day 41 and then reversed and turned green. That would be a pretty mild dcl, so I am thinking that we will go lower. Data released on Thursday or Jobs report Friday could bring it to the 50sma.
.
THE SPX – I am showing the 20 ema a lot, because it tends to act as support in a bull market too, but here I just wanted to show that the General Markets that I cover (SPX, NASDAQ, and SOXX) are currently under the 10sma, which is common when we drop into a dcl. So these may ‘crawl along the 10sma’ and dip a little lower before a dcl is in place or they could break higher and possibly give us a mild dcl. At day 41, We are now within the timing for a dcl.
.
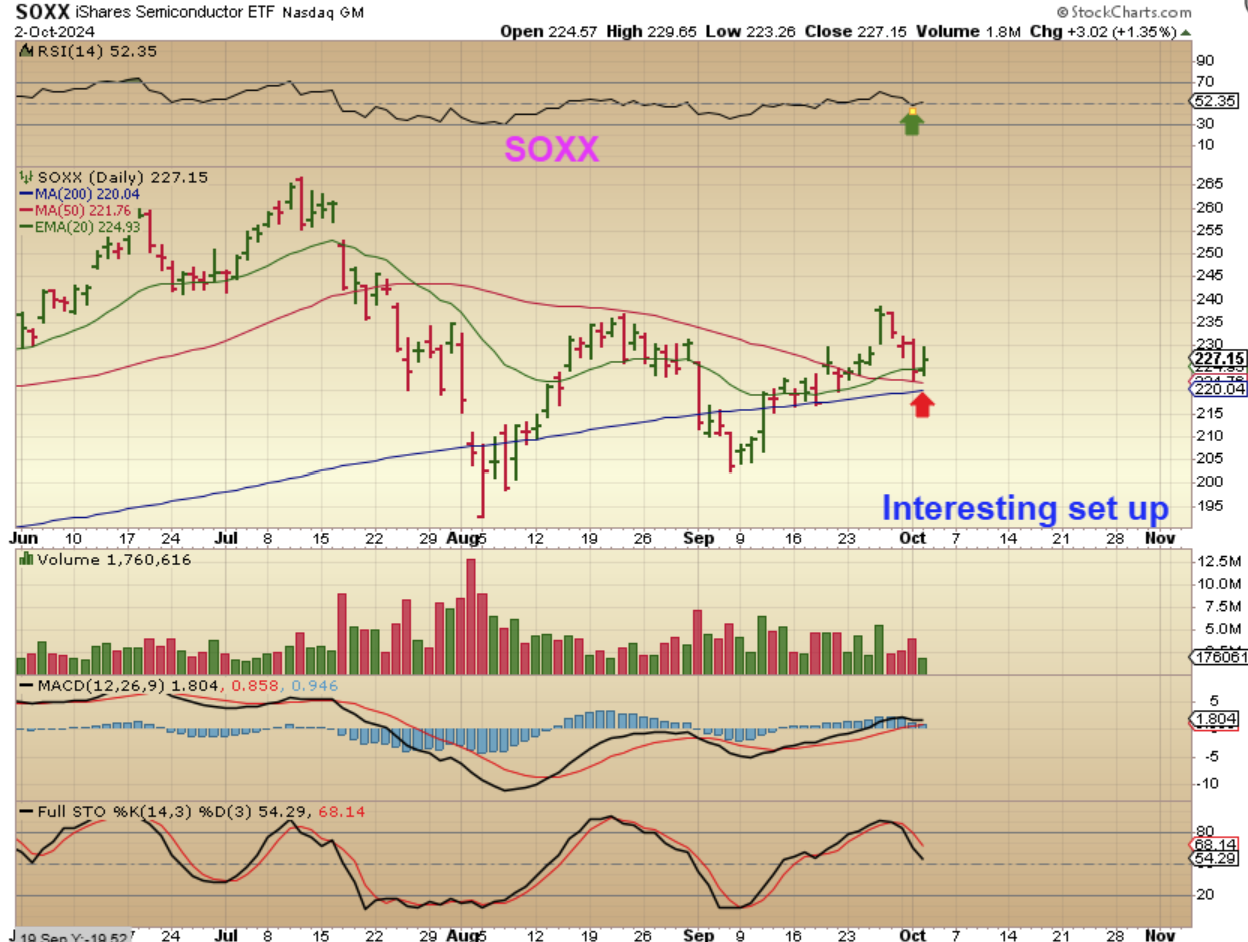
THE SOXX has become interesting, since price is reversing above the 20 ema and 50sma & 200sma. That COULD act as support going forward, even if price drops down a little more. Of course, this is a chance that we get the ‘shakeout’ move of a quick drop below support and recovery (That is a buy if so). Could this also turn out to be a dcl? It may, if price takes off higher from here.
.
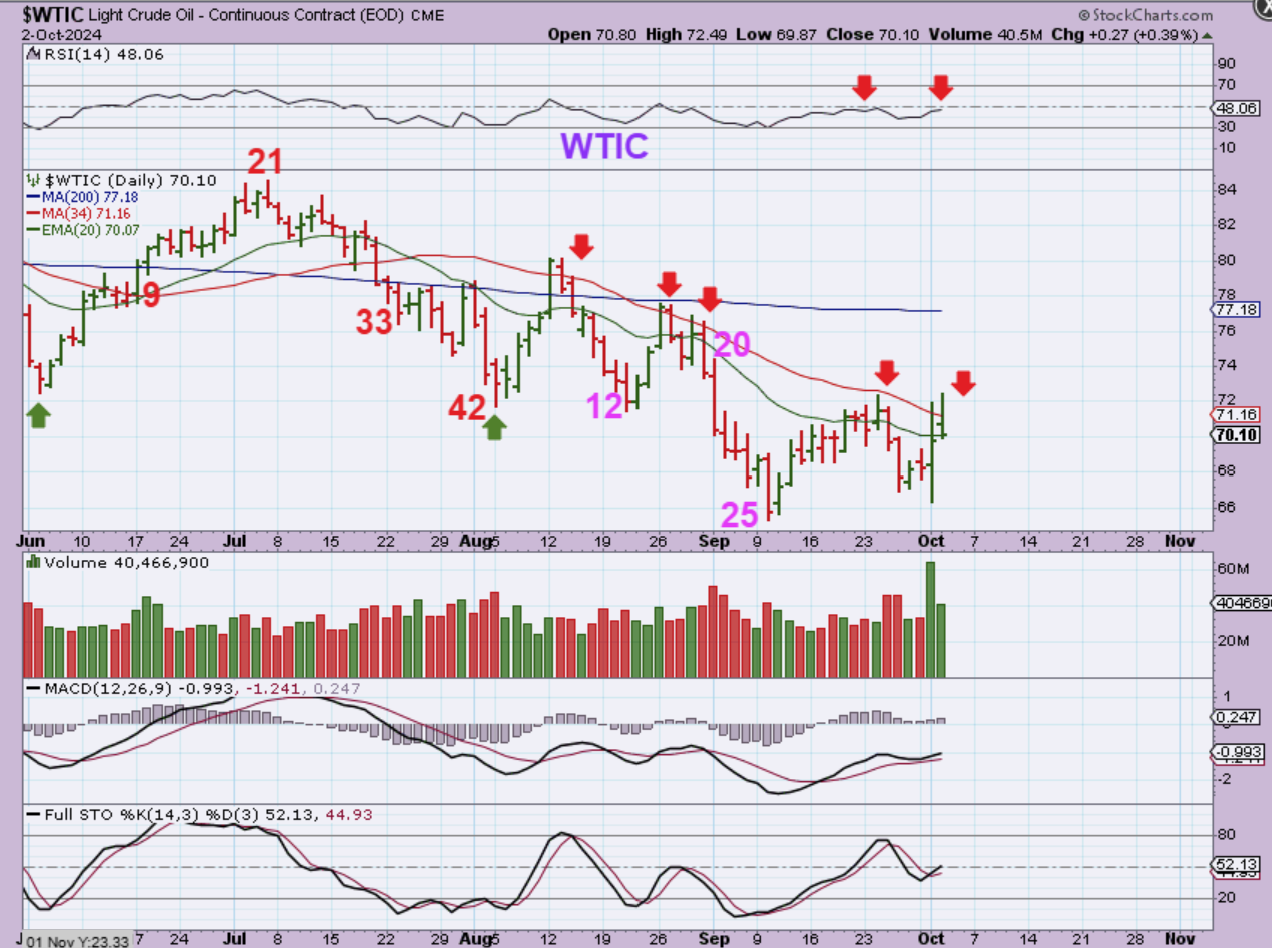
WTIC – 1. Oils daily cycles are usually 40-50 days long. 2. The last one was 42 days long. 3. War in the Mideast caused Oil to spike and the follow-through on Wednesday lost steam, closing Oil back below resistance. 4. This daily cycle may still be playing out as day 41 here.
.
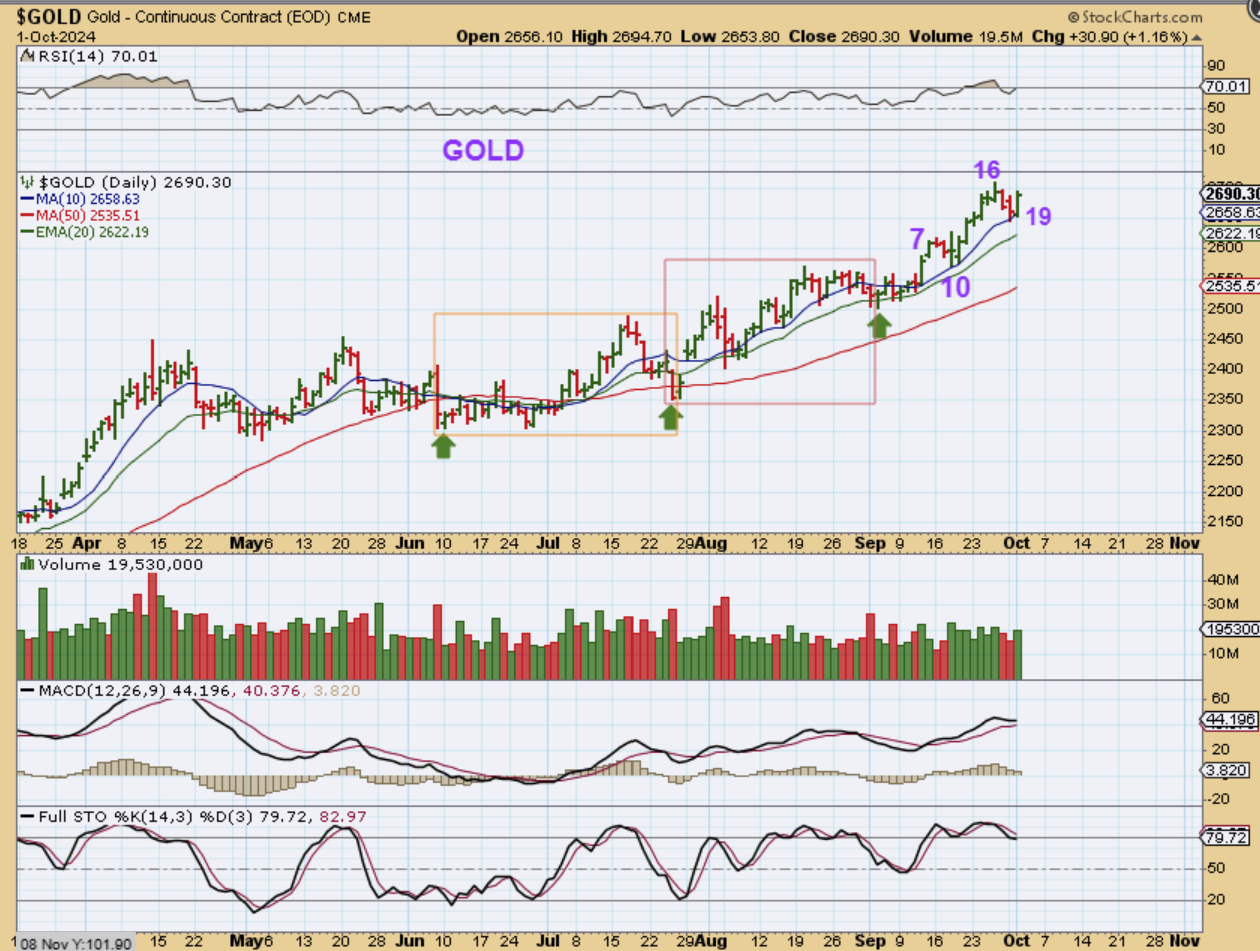
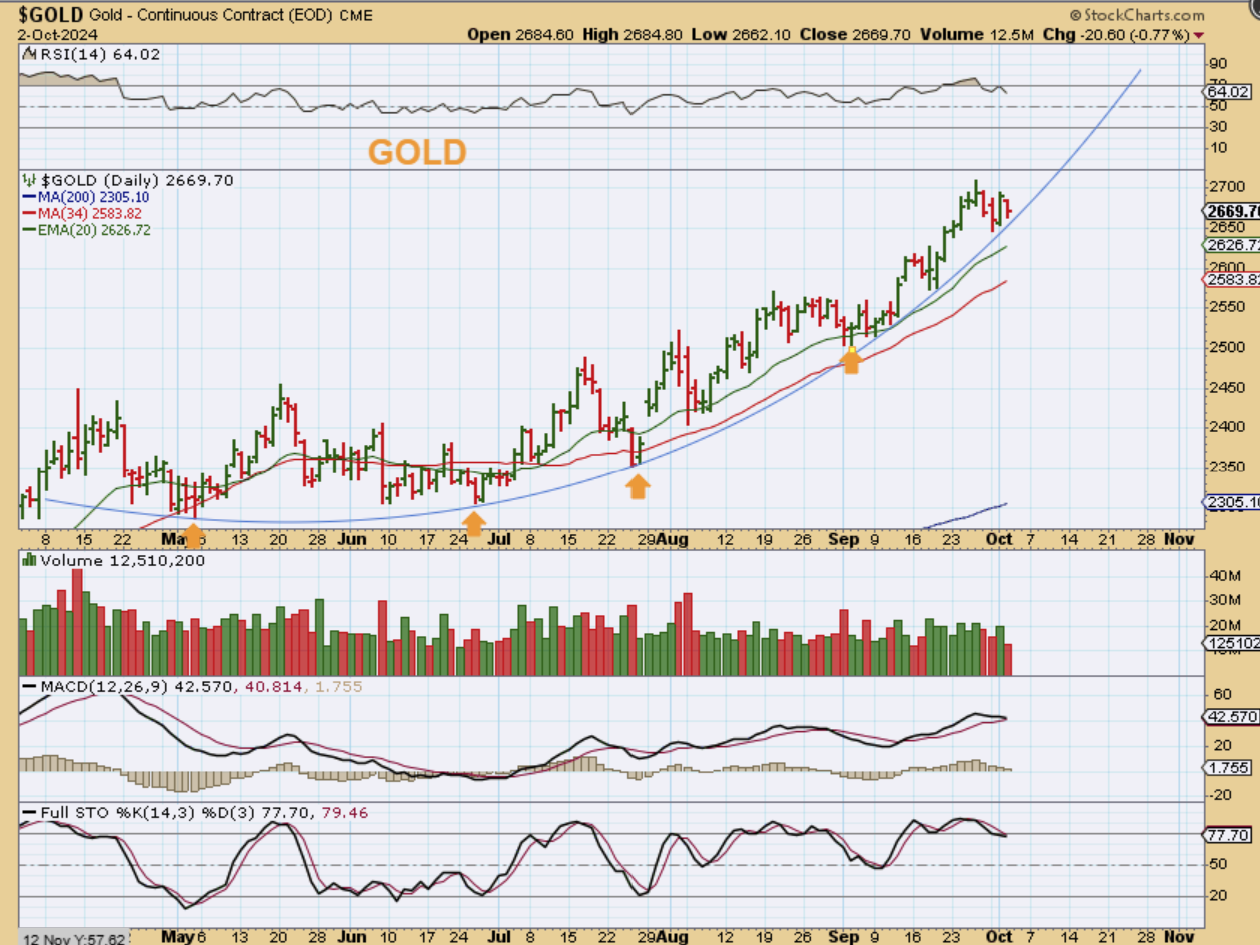
On Monday October 1st GOLD found support again at the 10sma on day 19 and reversed higher.
.
GOLD dropped on Tuesday day 20, but it still seems to be travelling within a parabolic curve and the 20 ema. It can go higher and then dip into a dcl later, or it could just drop to the 50sma area next.
.
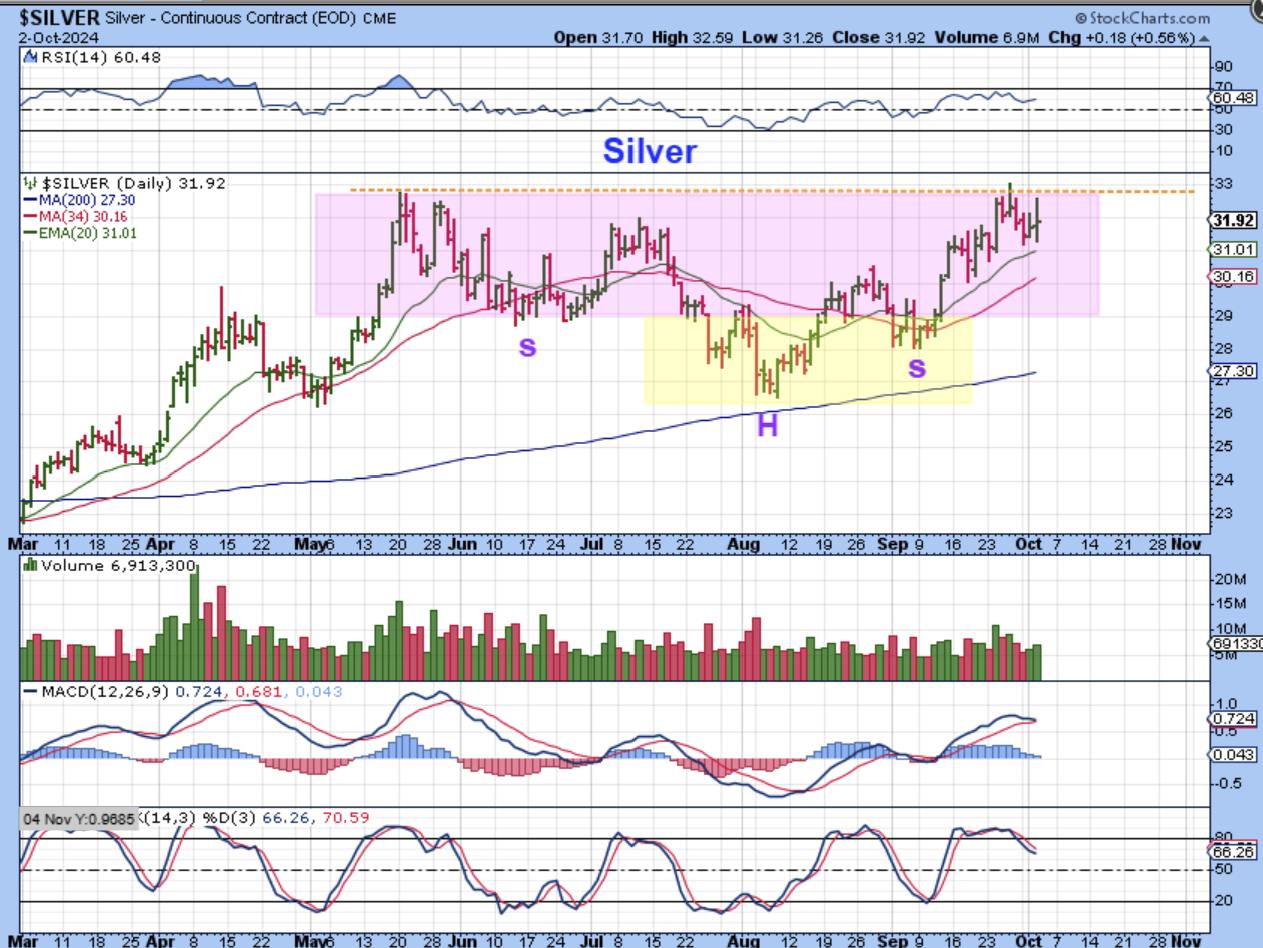
SILVER rallied on Tuesday, but then pulled back a bit as the day went on. Silver is acting like it wants to breakout and then back-test as the dcl. We’ll see.
.
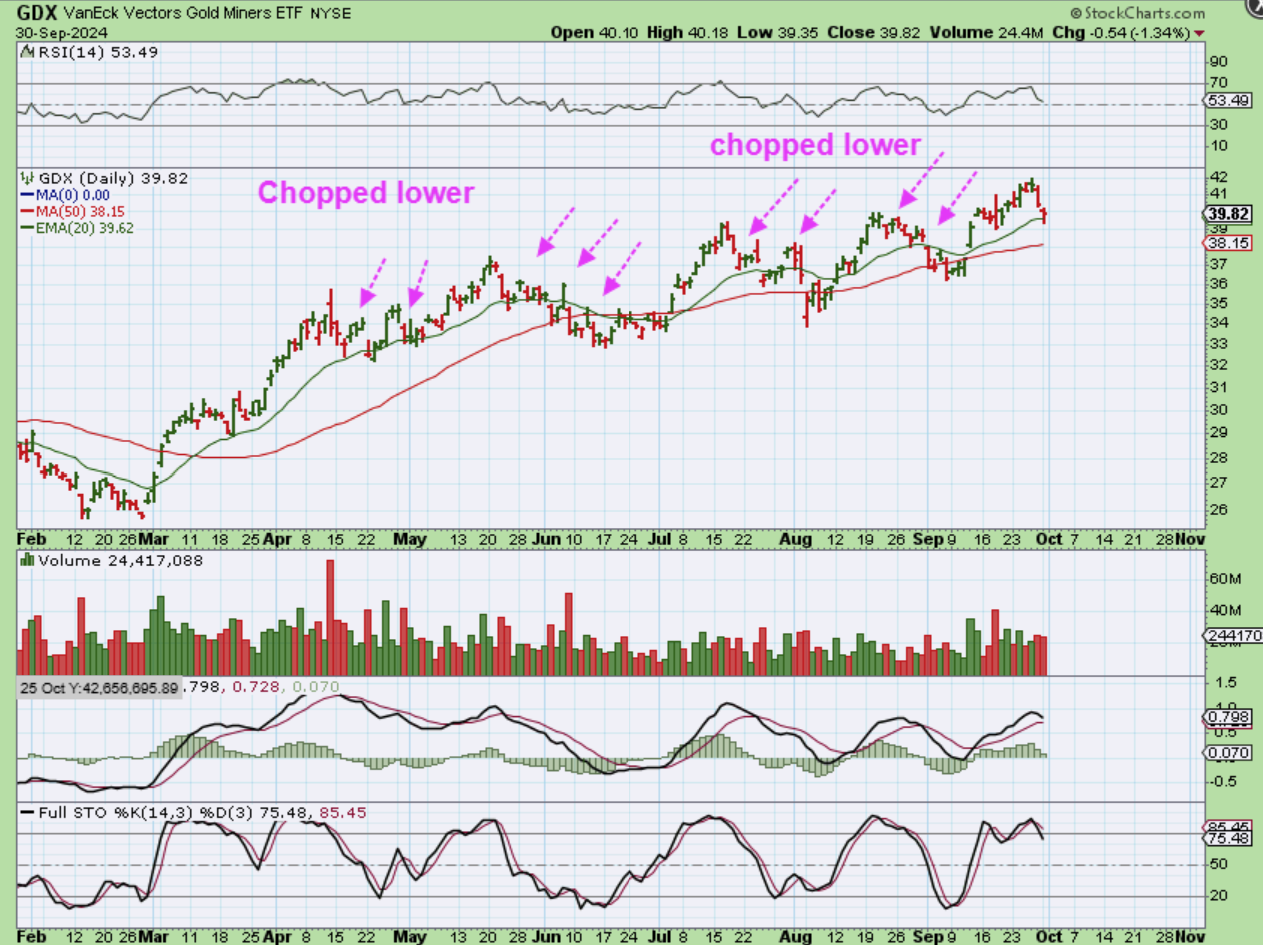
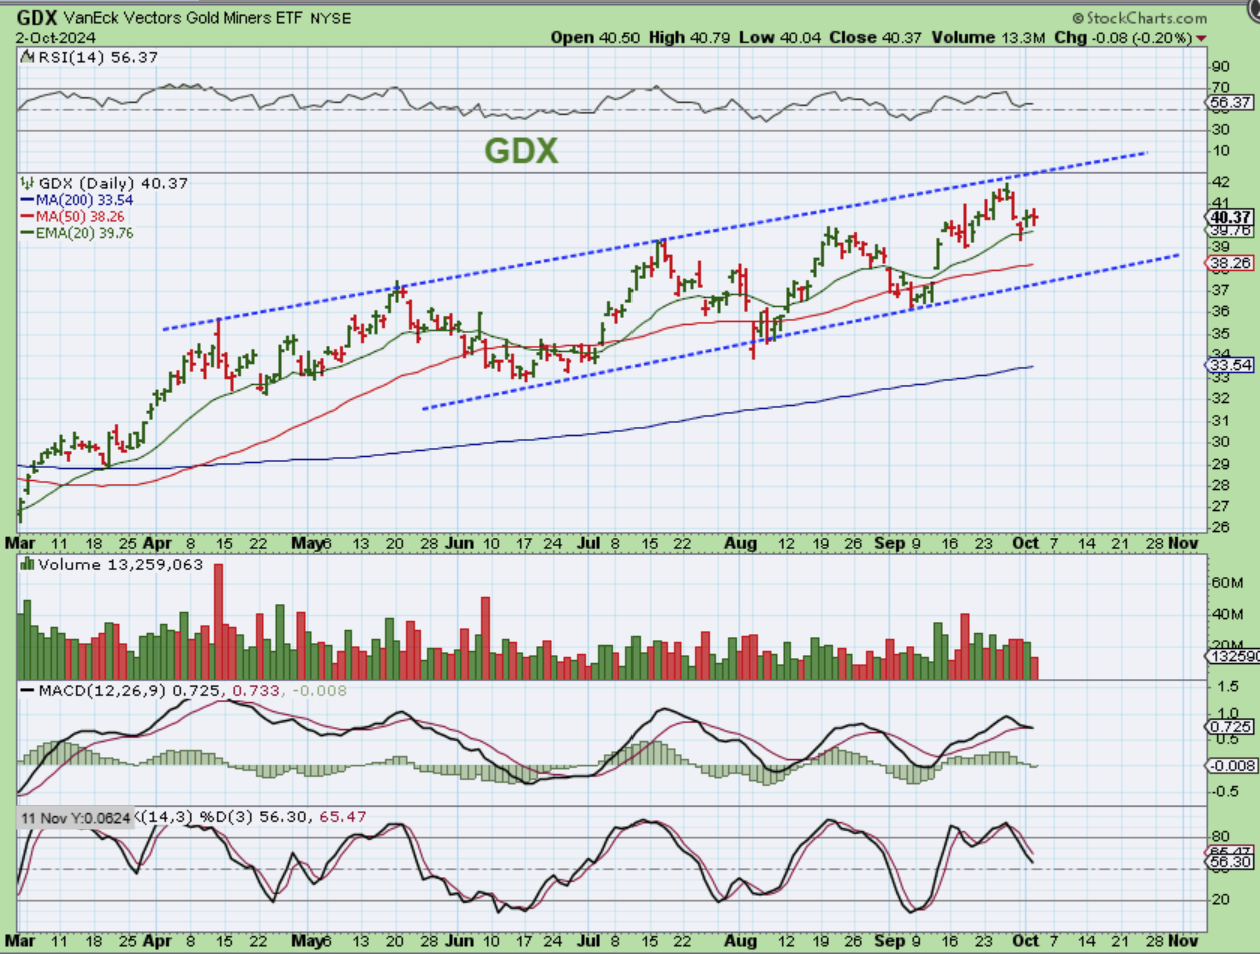
As mentioned in a prior report using this chart, GDX can bounce off of the 20 ema area, but it might just remain choppy and eventually chop lower….
.
GDX is still riding along the 20ema and is choppy, as mentioned in that report.
.
.
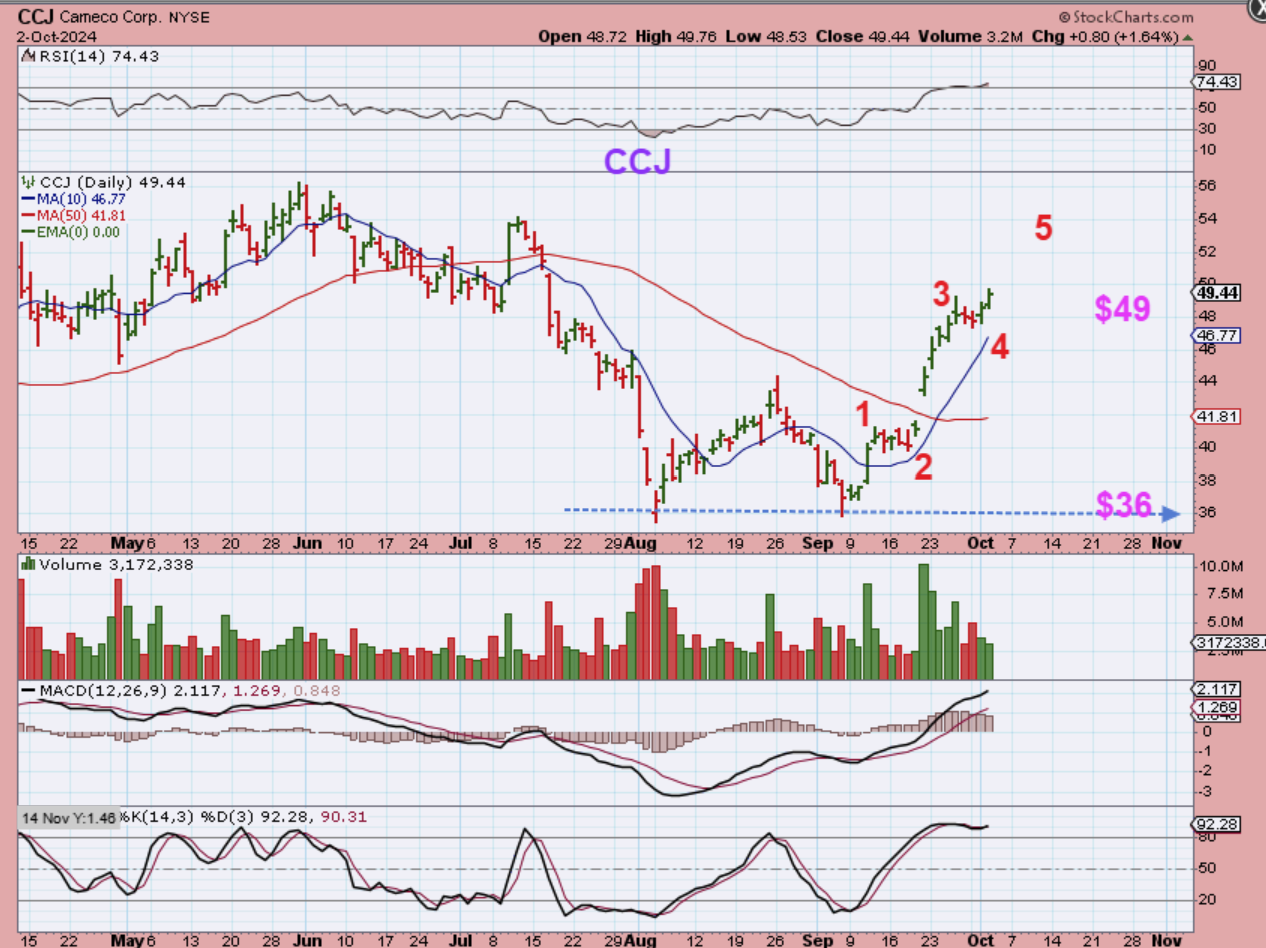
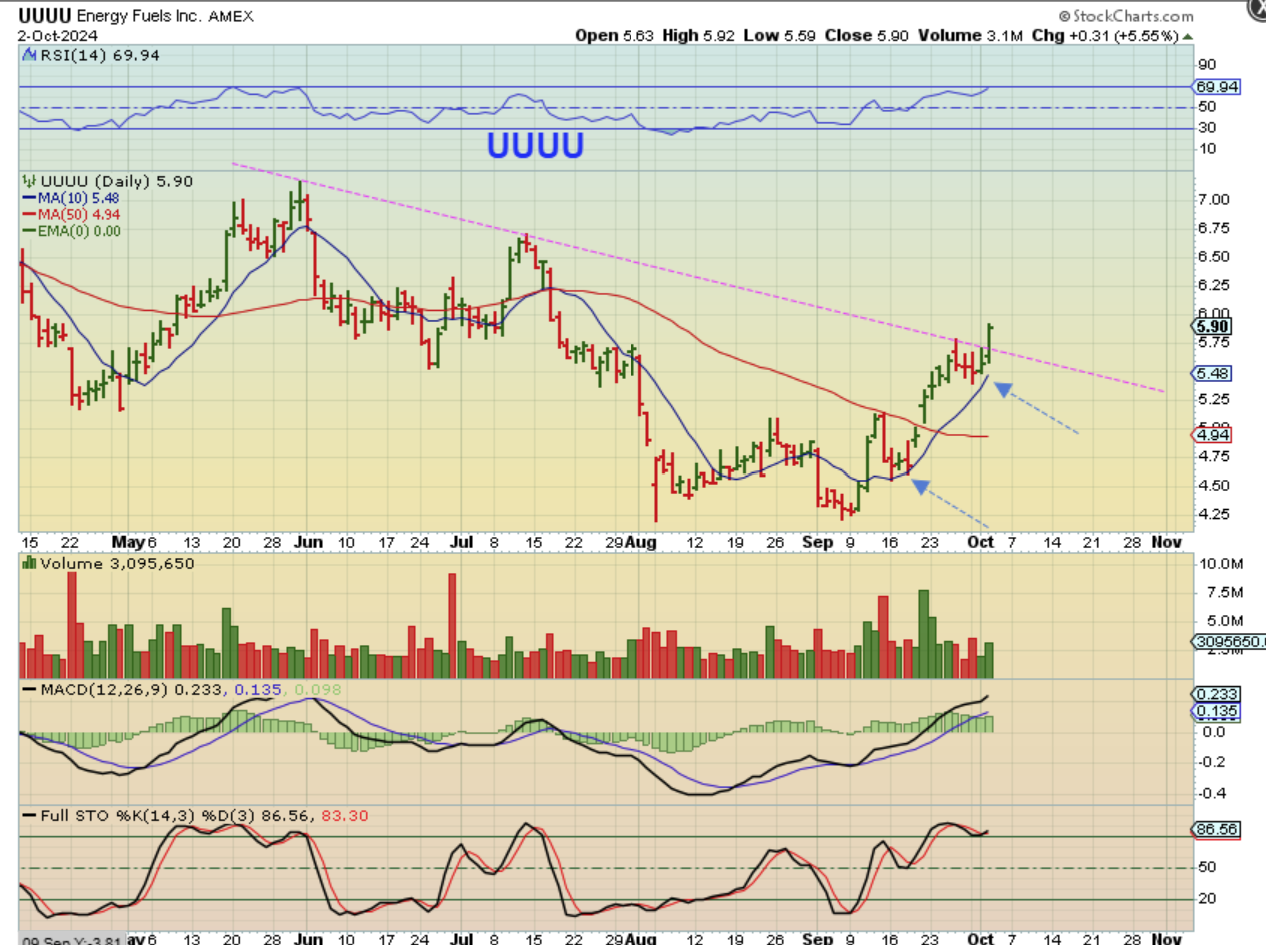
Yesterday Jamie mentioned in the comments that Uranium Stocks were doing well, and they really have been. Most that I looked at have put in a double bottom and then rallied strongly (possible 5 waves up), so let’s take a look at a couple of the stocks.
.
CCJ – Double bottom (the first daily cycle?), then a rally (the 2nd daily cycle 1-5). You could buy and try to ride 4-5, sell and buy the next dcl.
.
UUUU has a double bottom too, and then 1-2-3-4 up so far. A stock like this might not do 5 waves up, but it may just continue higher to former highs at $6.75 and then over $7.
.
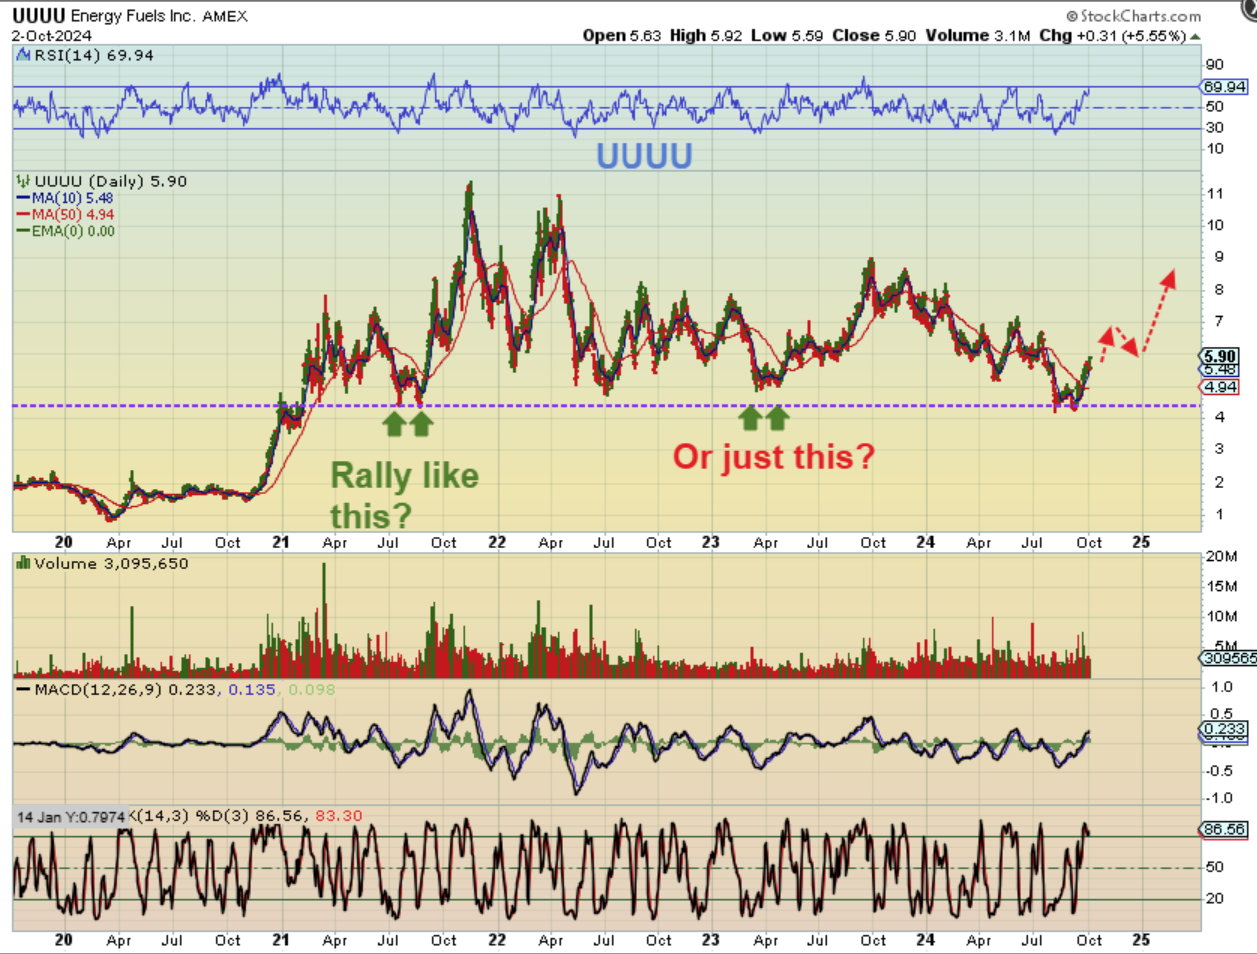
HOW HIGH WILL THEY GO?
.
So the Uranium Stocks are moving off of the lows again, and they can be very choppy, however the run continues?
We could see more upside over time.
.
Enjoy your Thursday trading!
.
~ALEX
.
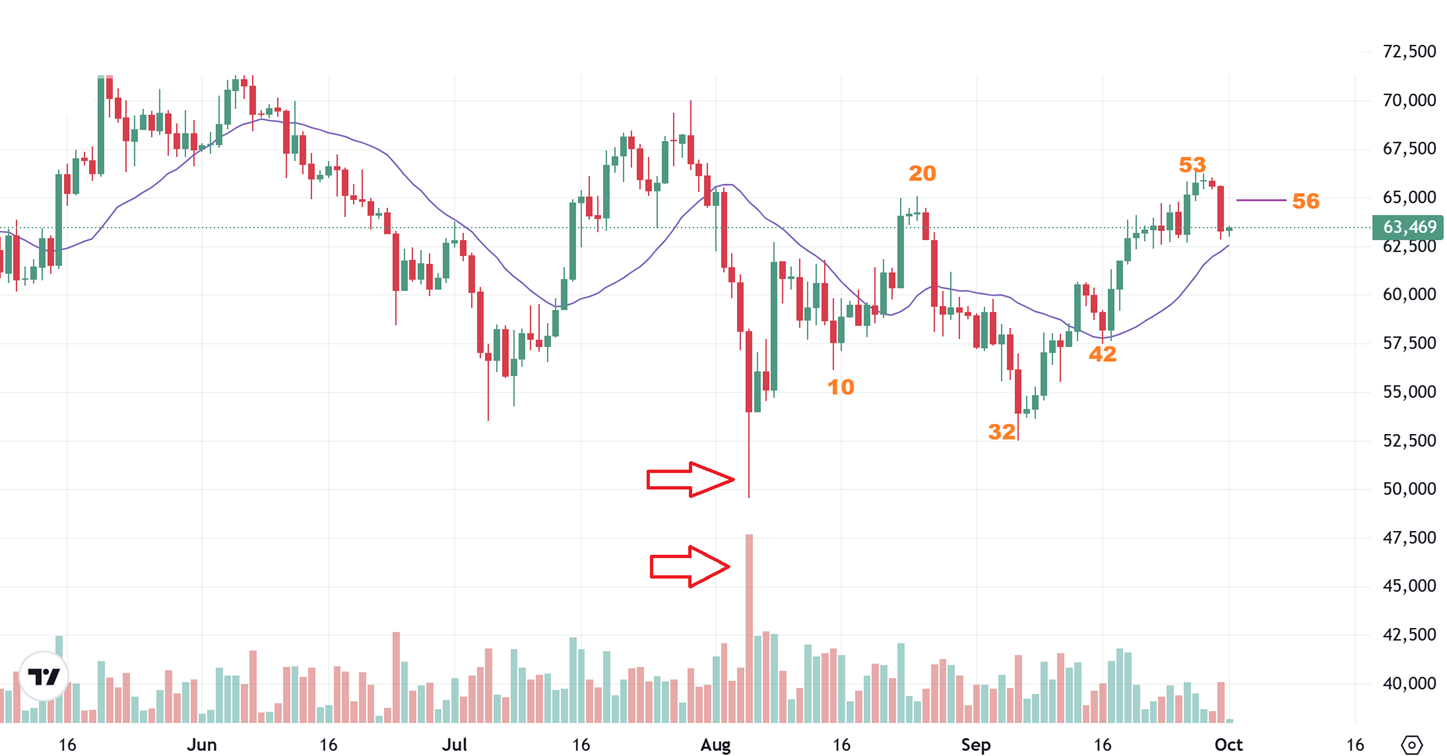
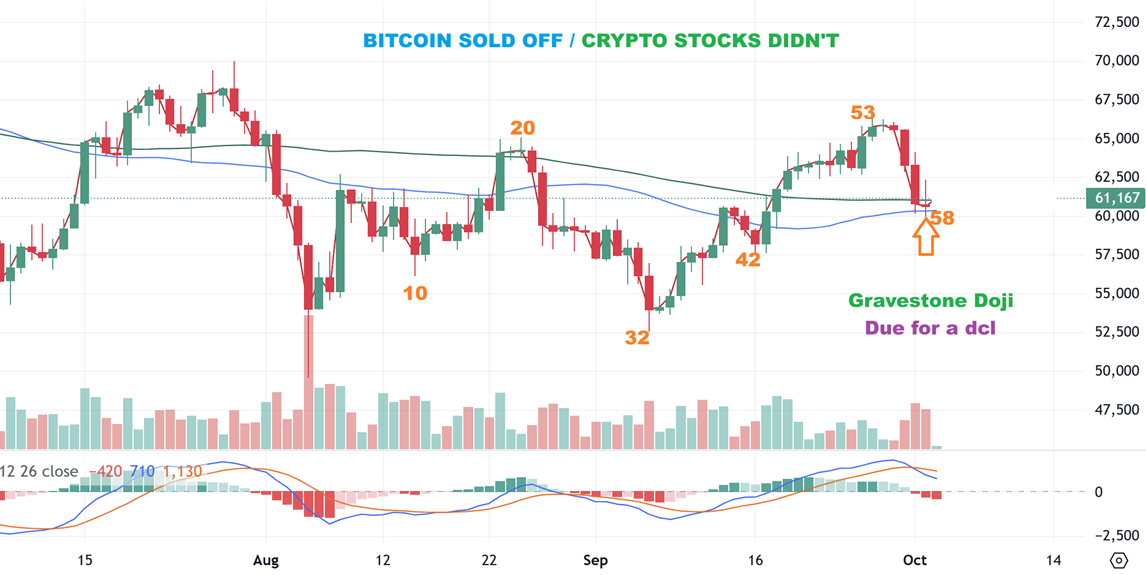
To give us the Cycle count, I will re-post this from Tuesdays report, where Bitcoin dropped on Monday day 56:
BITCOIN did drop on day 56 and honestly, I see a small green candle starting now, but it just seems to early and too shallow for a dcl in Bitcoin. Again, this could even bounce and put in a quick double top as seen on the above chart in July and then drop into day 63 or so, but we just have to wait and see.
BITCOIN did a pop & drop and ended the day red, but I see a gravestone doji, and they can be bullish. We are due for a dcl around day 60 too, so I got the feeling that the crypto stocks maybe be under accumulation (They stayed green).
.
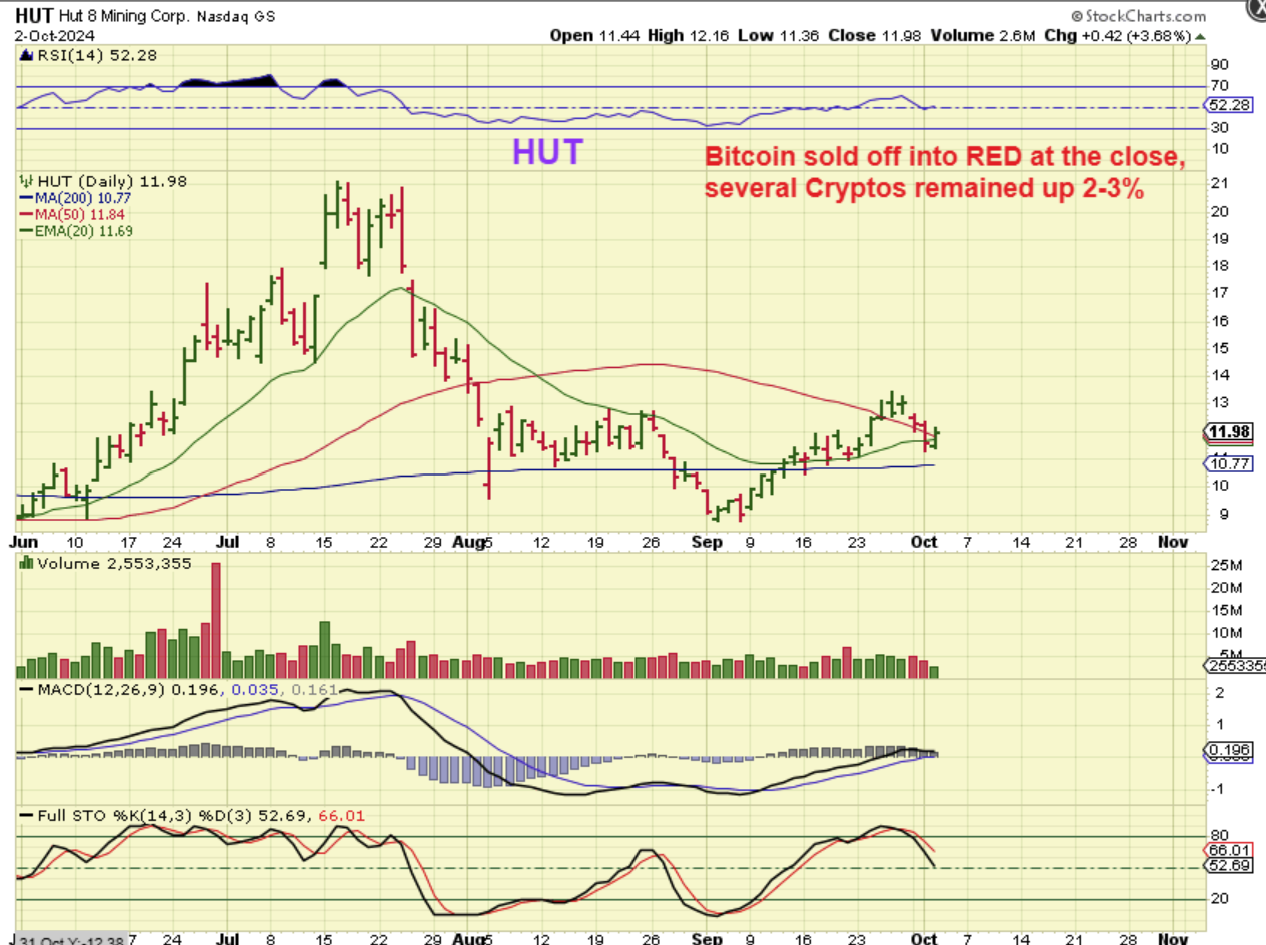
Bitcoin went Red and HUT was still up 3.68%. THAT has NOT been happening lately.
.
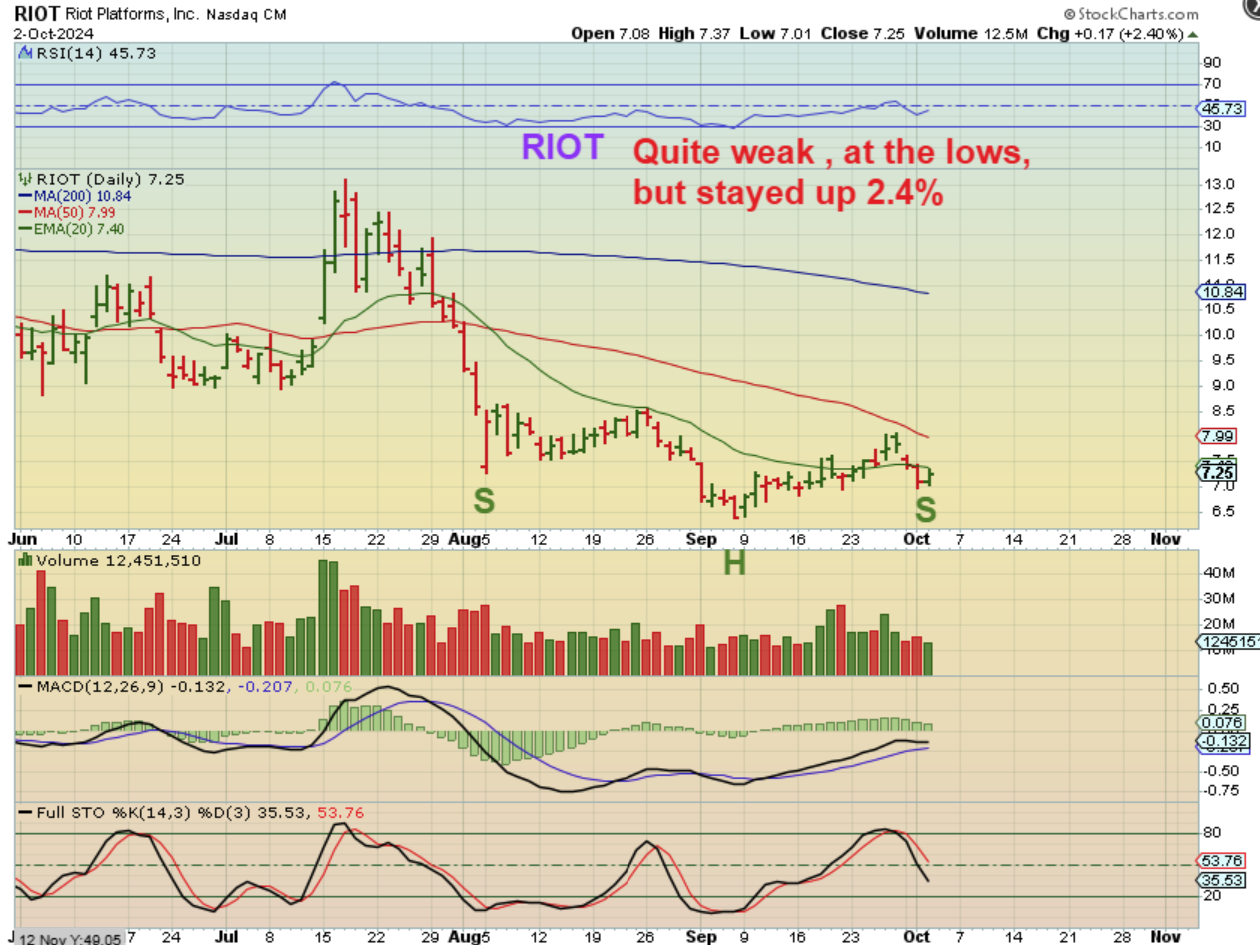
Bitcoin went Red and RIOT was still up 2.4%. Lately, when Bitcoin dips a little, the Crypto Miners dipped a LOT.
.

