Tuesday September 17th – The F.O.M.C. Countdown
There really isn’t much to write in todays report that wasn’t covered in past reports and especially in the Weekend report, so I’ll just do a review to show WHERE WE ARE as we approach the Fed Mtg Wednesday.
.
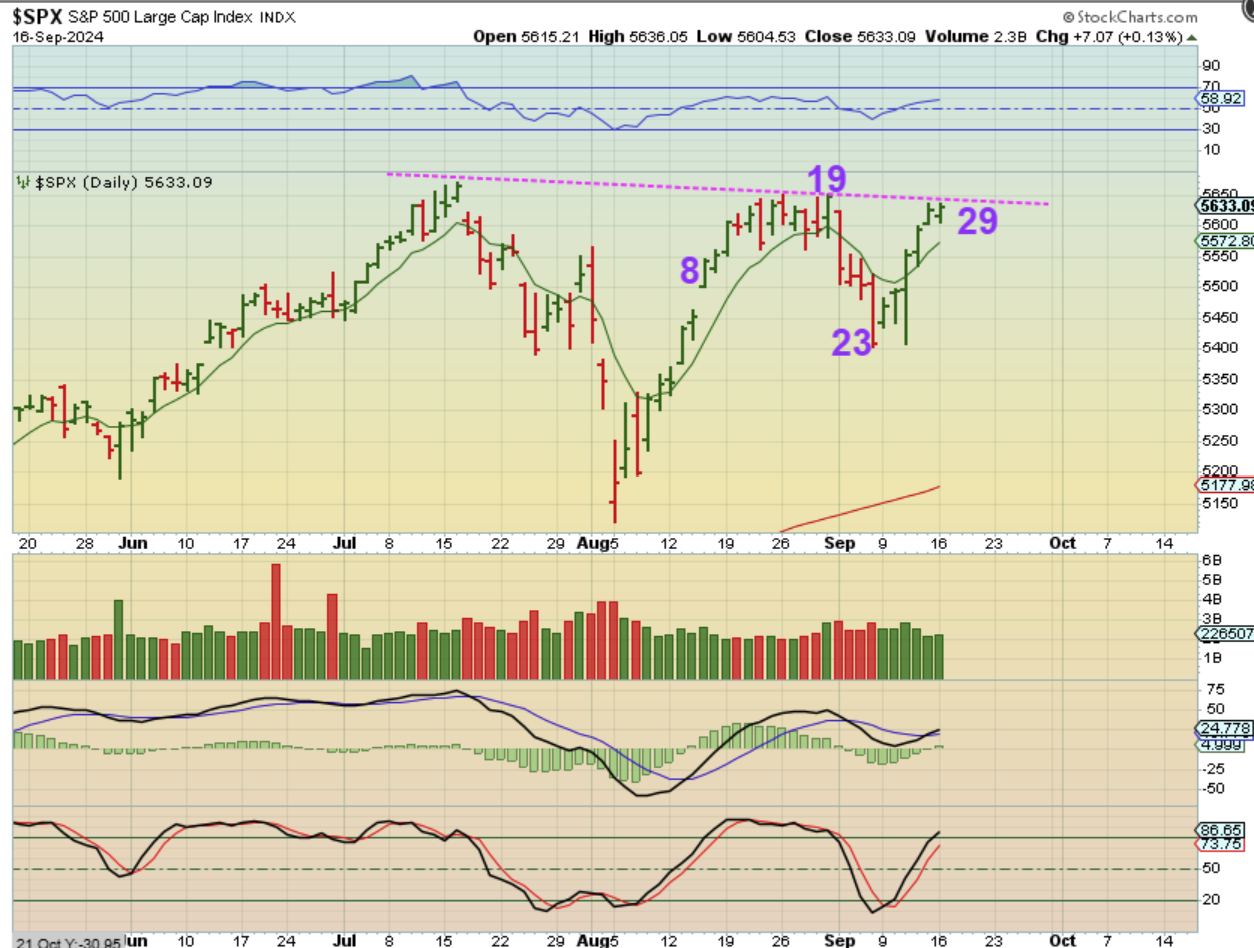
THE SPX did not break that trendline yet and since it is on day 29, it could do it this week. Many daily cycles for the SPX are 35 – 40+ days long, so this DOES have time to run higher.
.
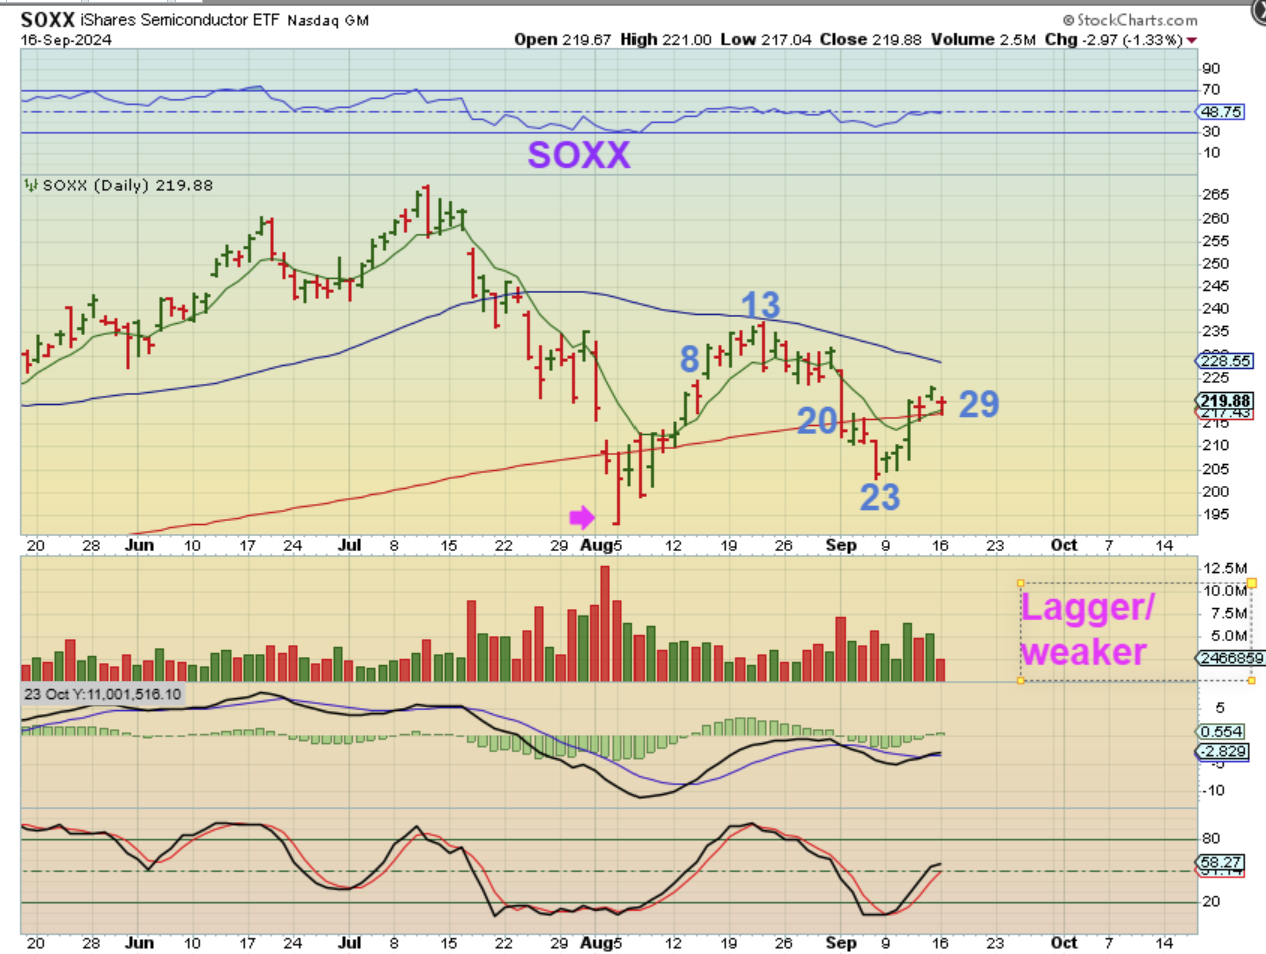
THE SOXX is weaker and was rejected at the 50sma on day 13 and just regained that 200sma. The Semiconductors usually lead the markets, so this is at least a little concerning. Why concerning? If the SOXX cannot recover the 50sma, it is very L.T. with a day 13 peak. Keep that in mind as we roll through Fed Wednesday and the rest of the week.
.
IN THE WEEKEND REPORT:
.
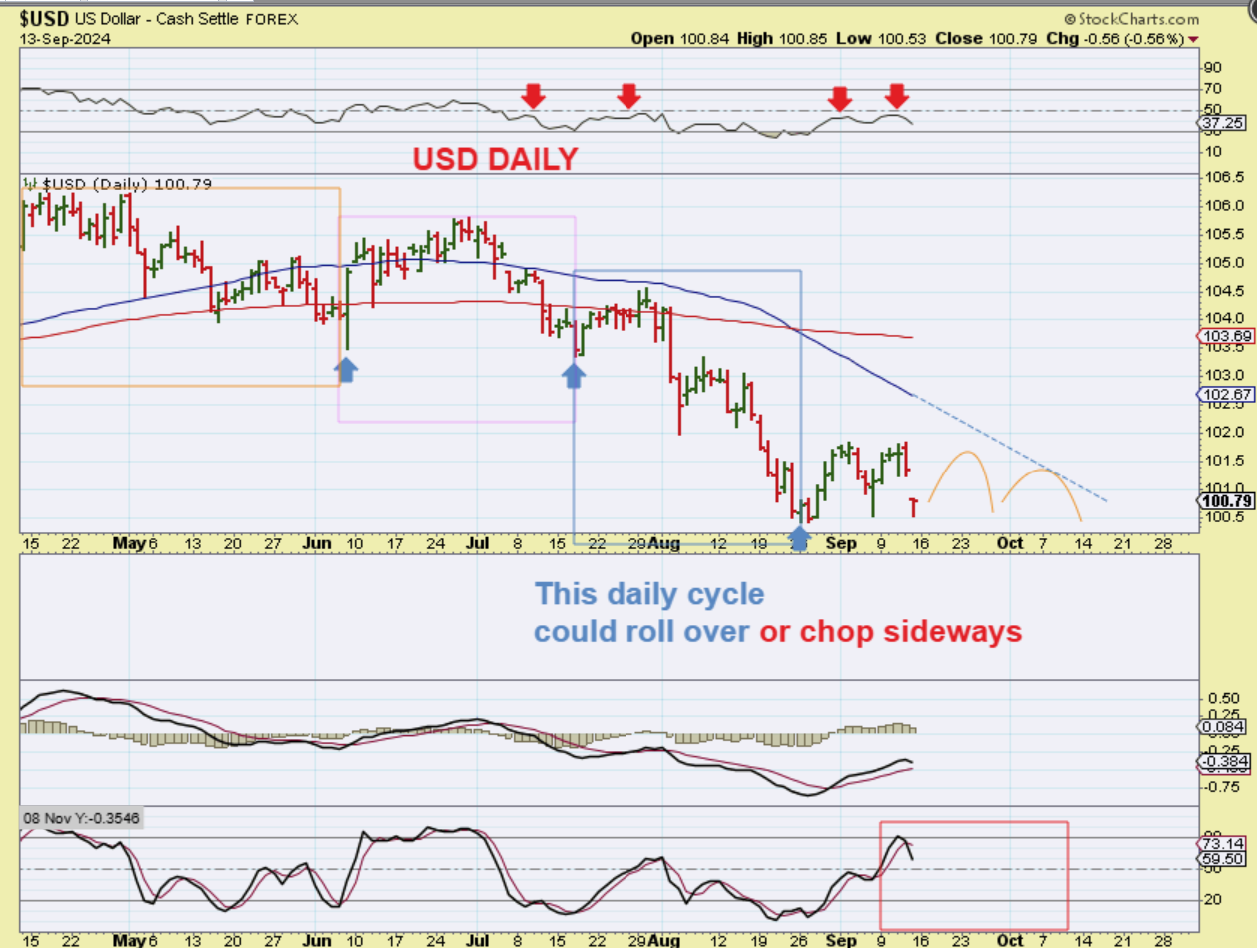
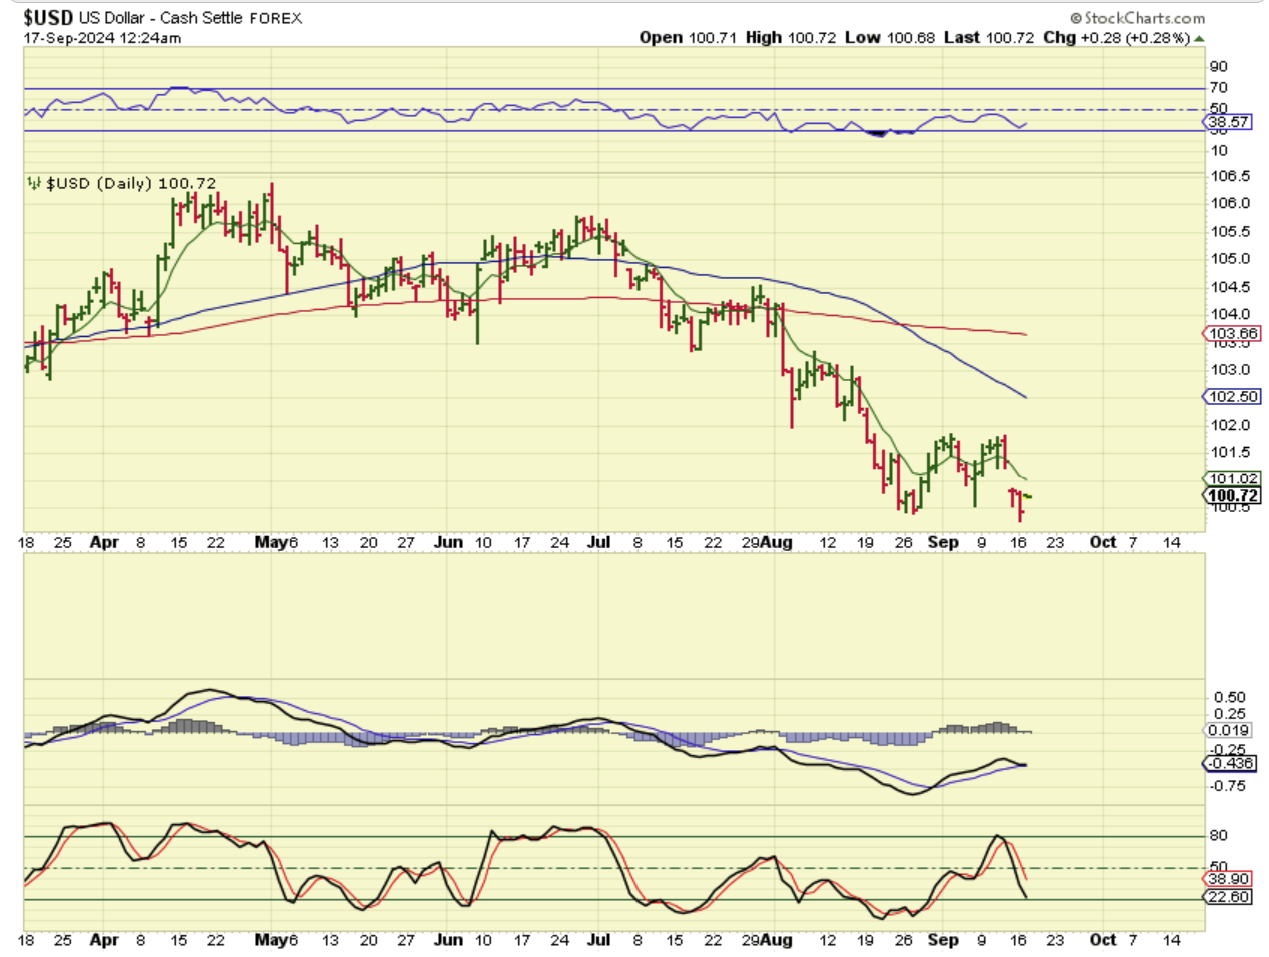
USD DAILY started a new daily cycle in August, but so far it cannot get above the RSI 50% yet, and it is chopping around at the lows here. It definitely could roll over and sell off to new lows, or it may chop sideways, as drawn on this chart. News of a rate cut has hindered the USD. What does the weekly chart show?
.
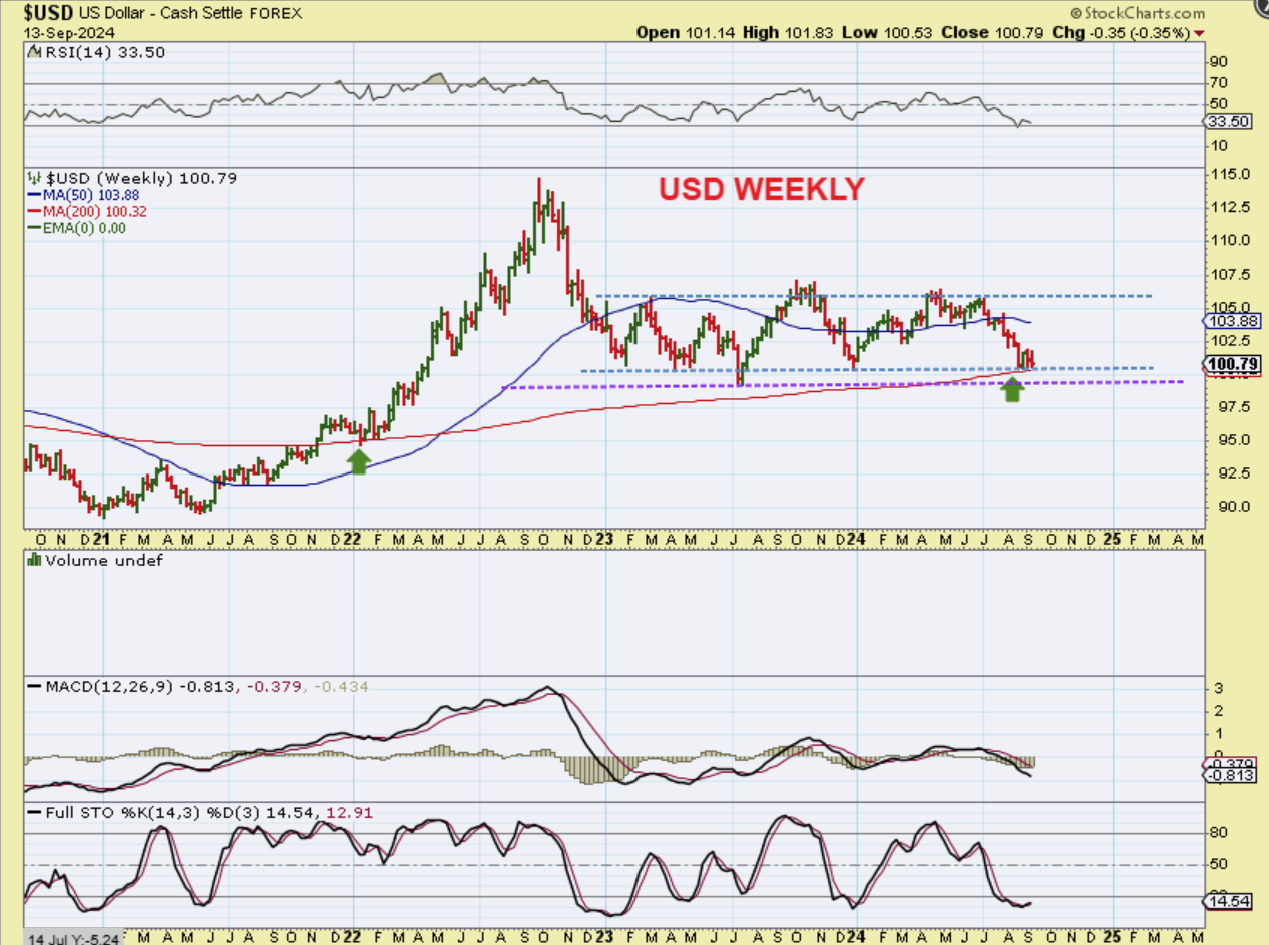
THE WEEKLY USD Chart shows that the price of the USD is actually bouncing along a support area at the very lows of the consolidation and the 200week ma. If the USD breaks down as a result of the Fed Rate Cuts, it could break that 3 yr low from 2023!
.
USD – On Monday we saw no change.
.
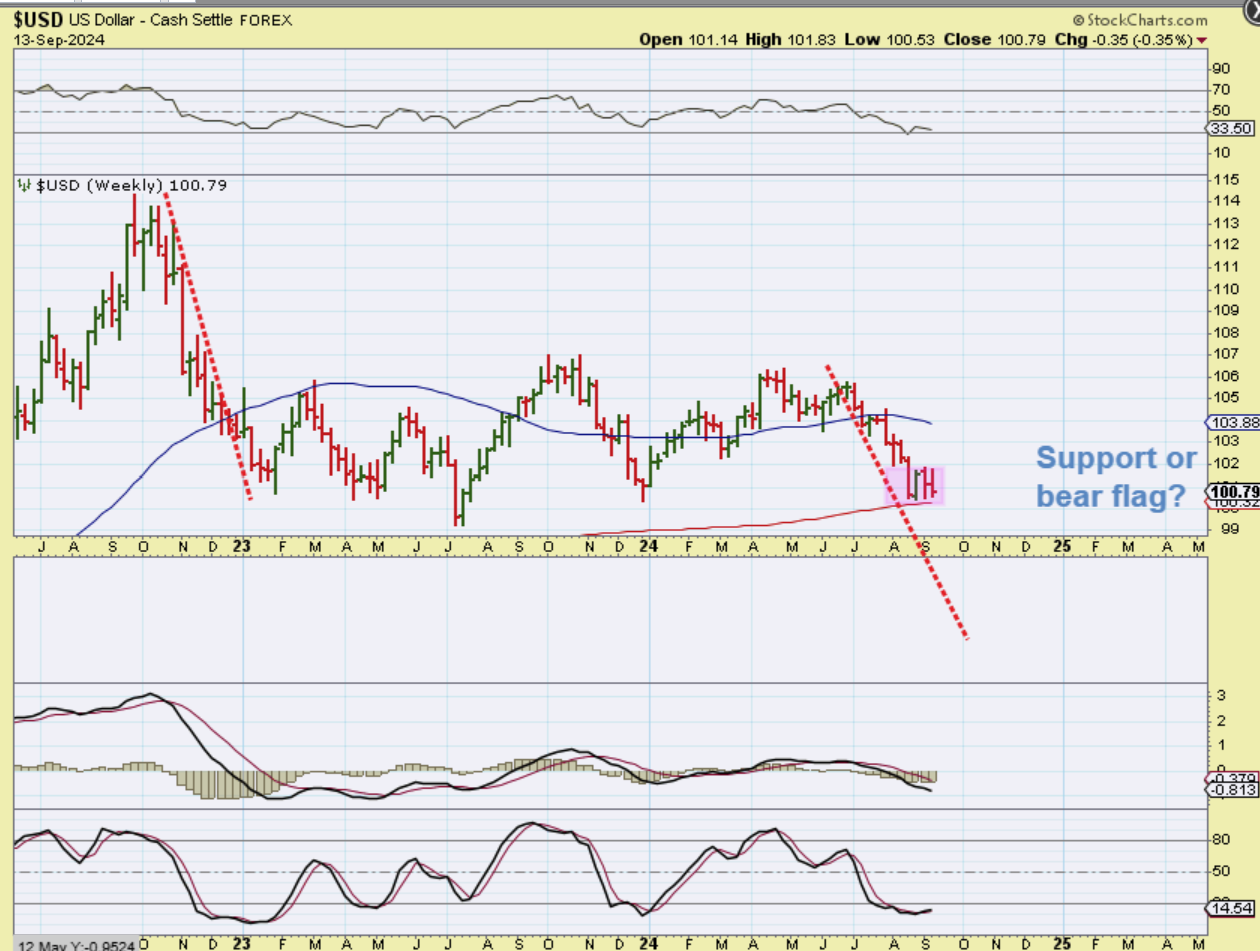
USD WEEKLY – Look at the weekly MACD. And is that a bear flag? A breakdown would send the USD even lower over time as more rate cuts are made. What might this do to the Gold Bull Market? It could be very good for a continuation of the Bull Run, and Silvers run to all-time highs and more.
.
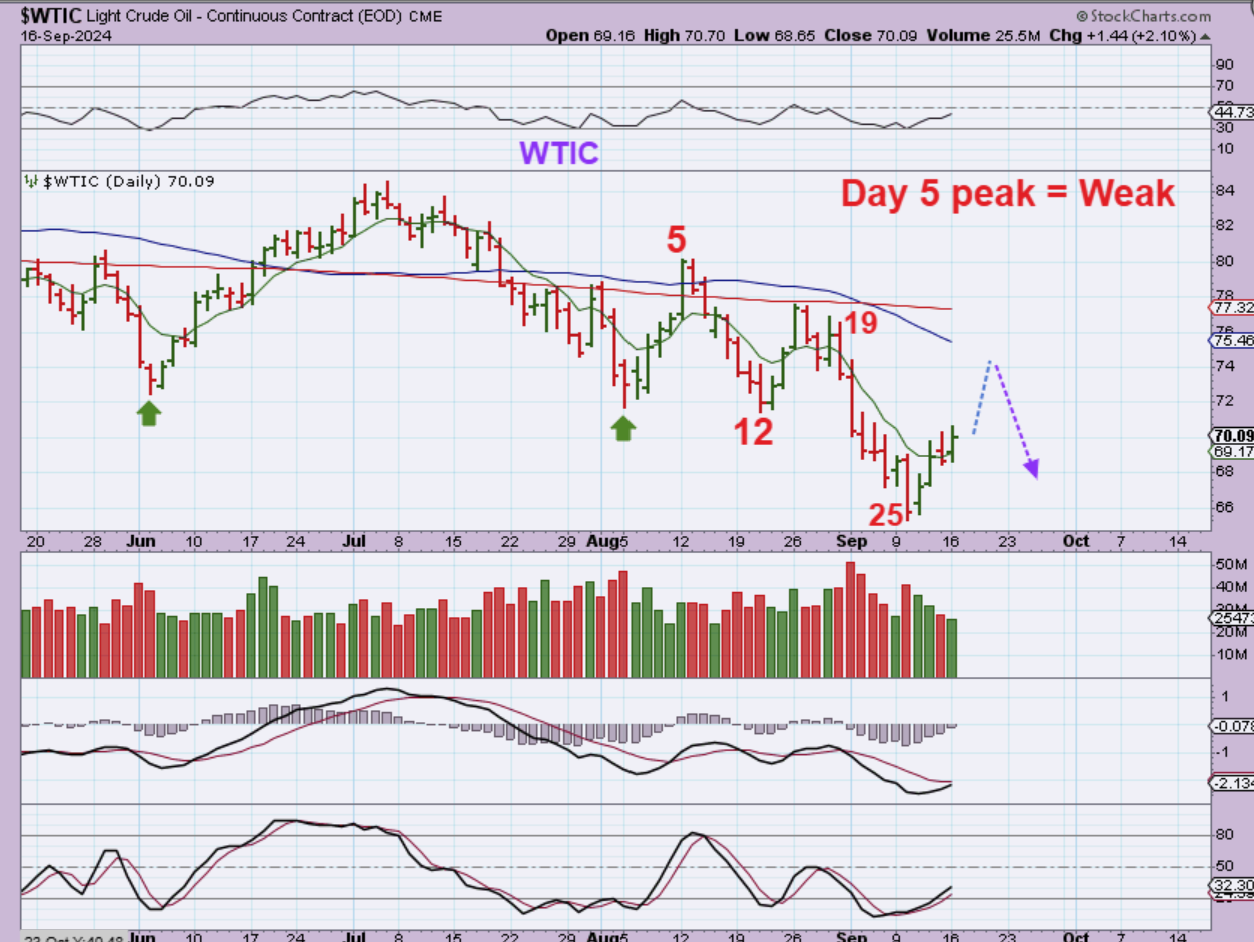
WTIC – Oil has a day 5 peak, and the daily cycle is only on day 29. Oil can have daily cycles 45-50 days long, so I have been saying that this can roll over & go lower after this bounce.
.
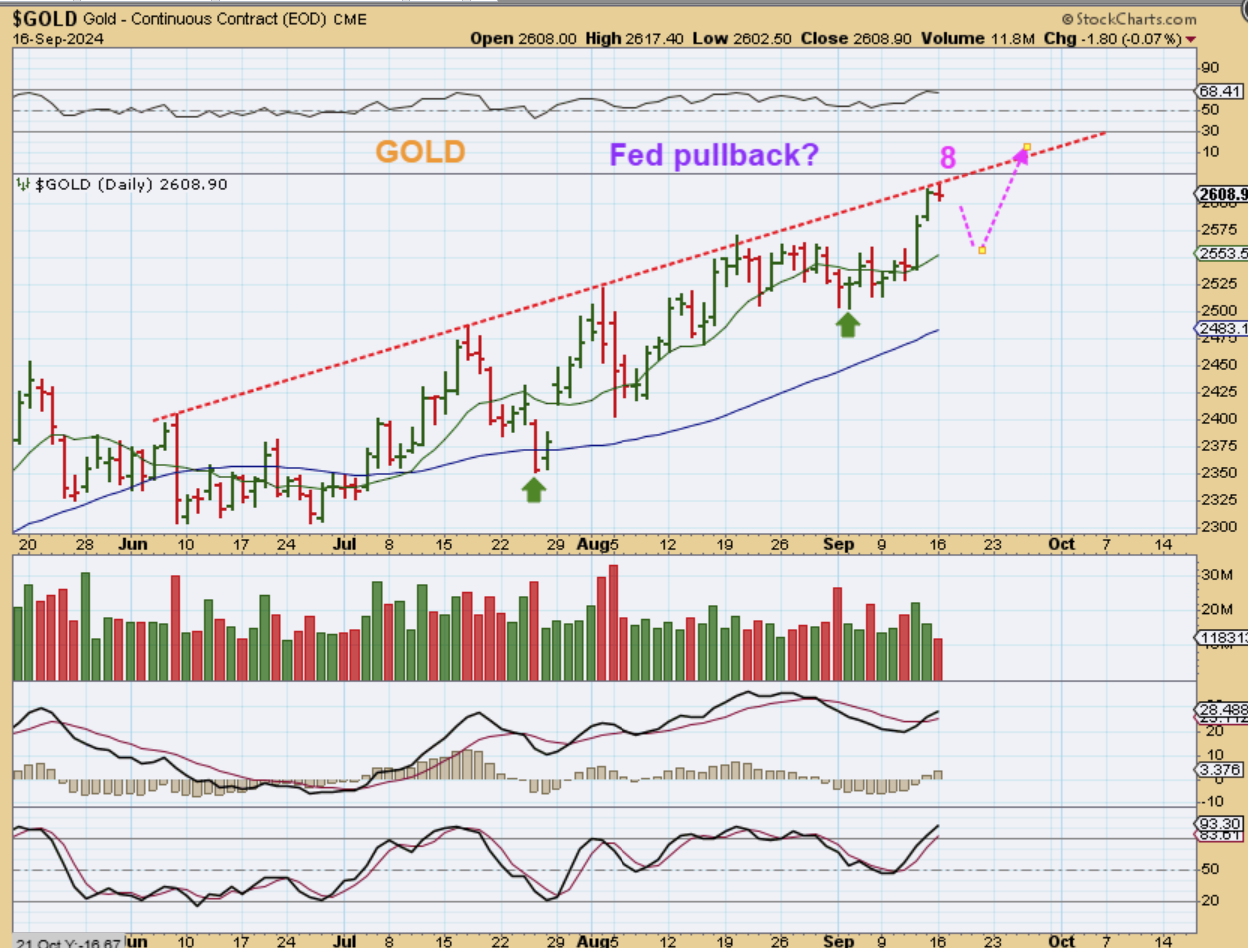
GOLD is on day 8, so it can blast higher, but it has reached an upper trendline & stalled too. So is it possible that we get a dip after the Fed & then push higher, or maybe a breakout and reversal lower later for a half cycle low back test? Those are both possible, OR this breaks out and runs.
.
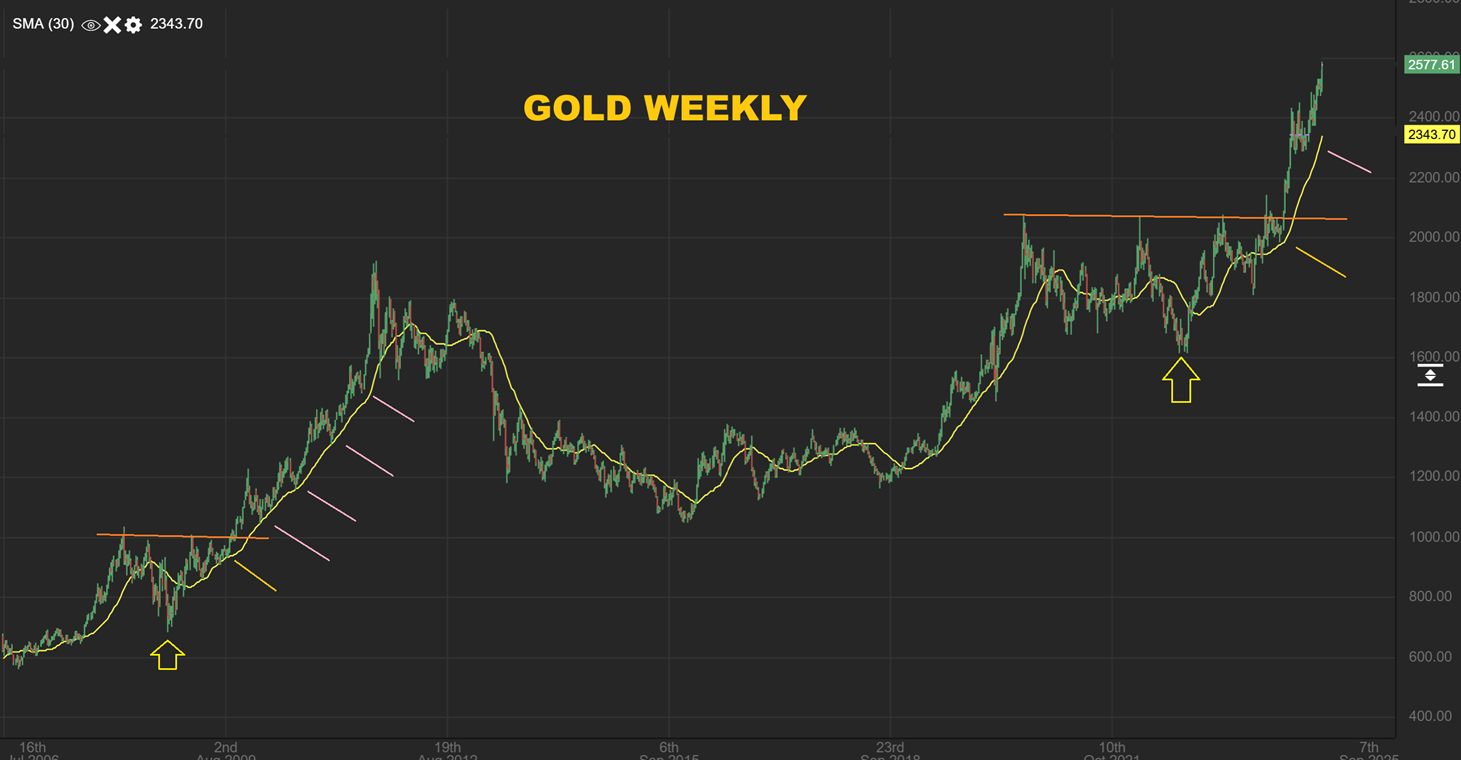
Noteworthy: Golds Bigger Picture shows that this Bull may have plenty more gas in the tank over time, but it will hve normal dcl pullbacks and ICL corrections.
.
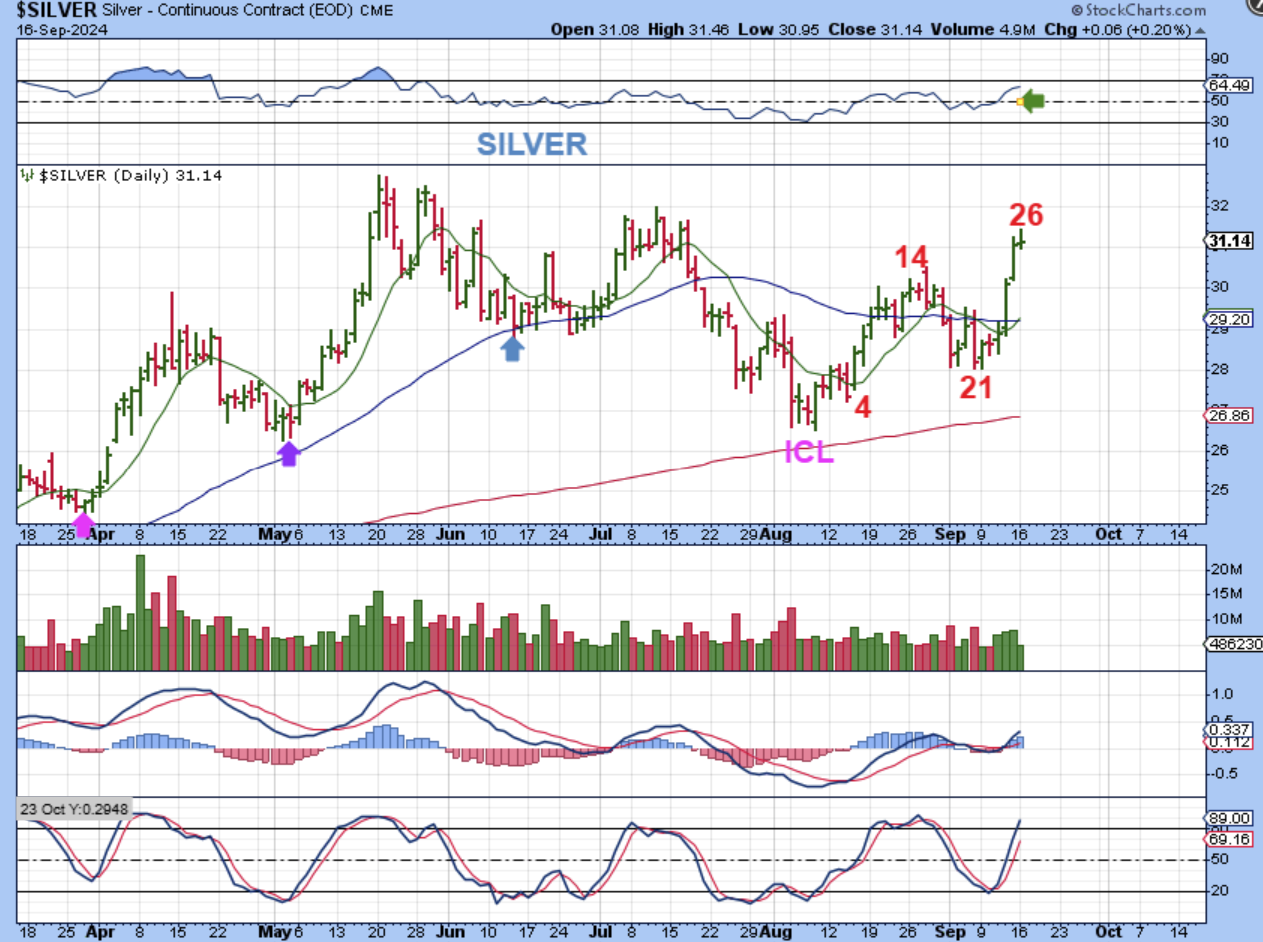
SILVER is different. Gold is only day 8, but Silver is on day 26 & coming due for a dcl. Think about that and where we are at ( 2 days from a BIG Fed decision). I have to think that Tuesday is day 27, Wednesday is day 28, and we could POP & DROP over the next few days. The good news is that it should just be coming out of an ICL and this is only the first daily cycle.
.
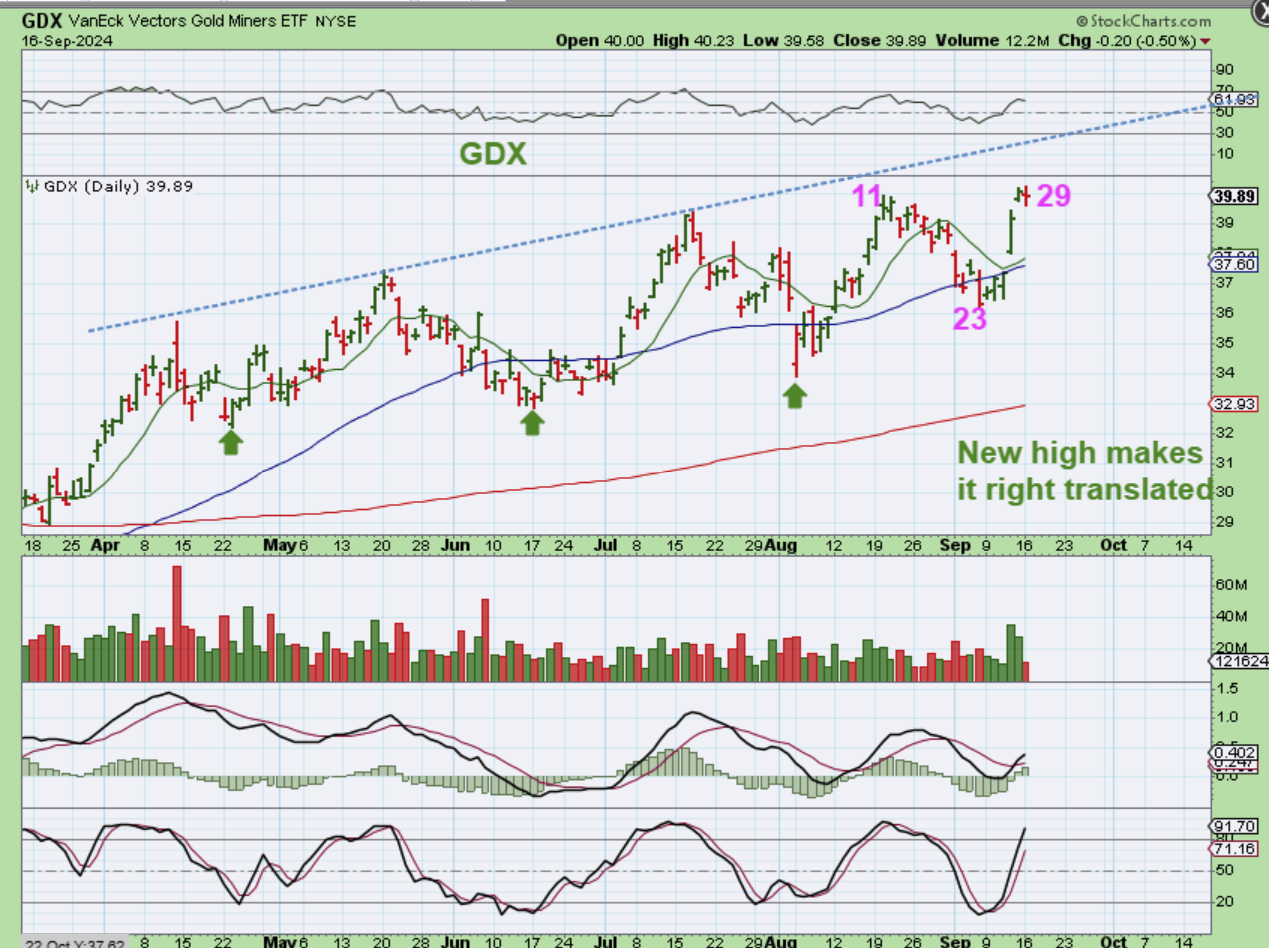
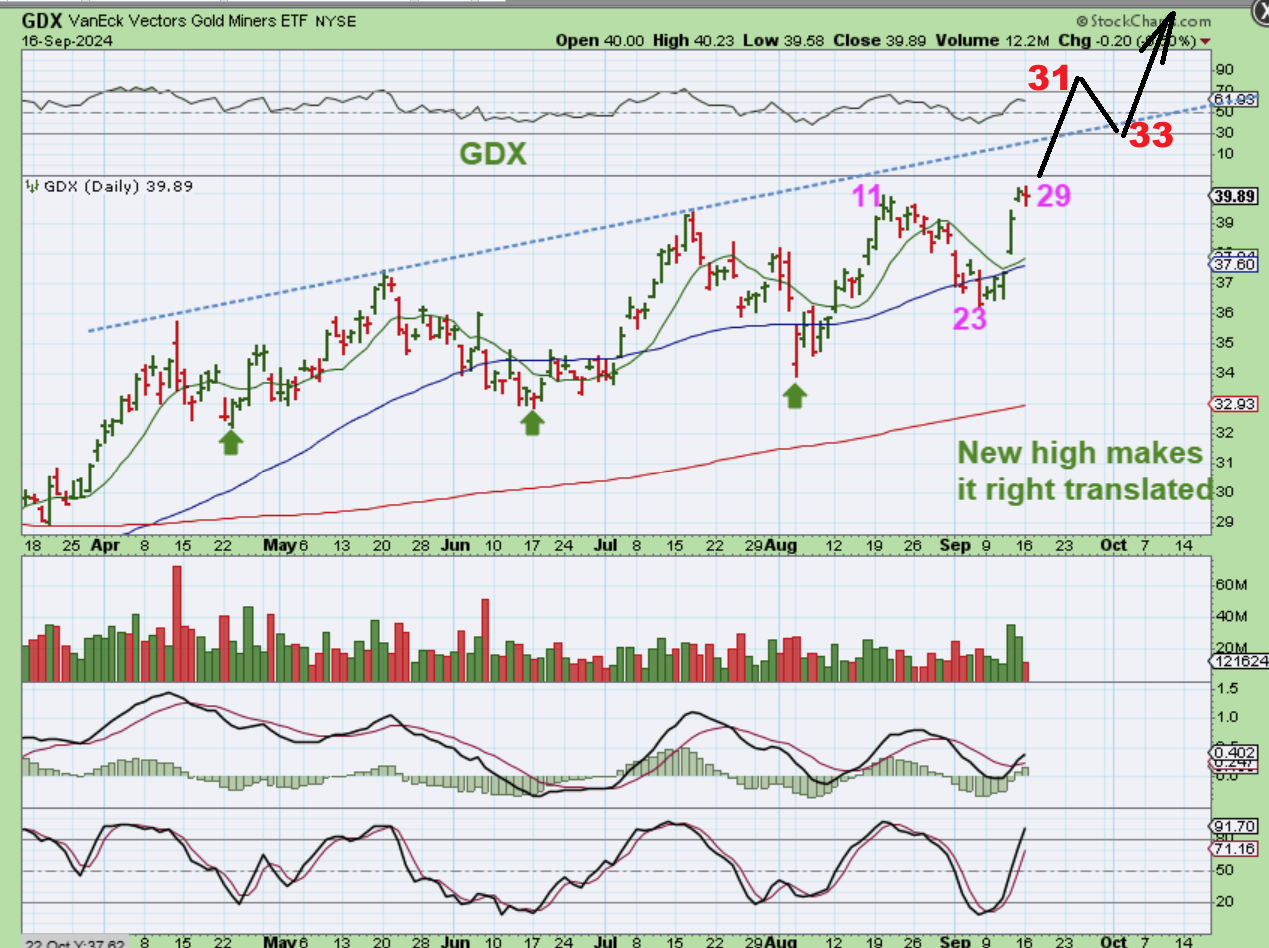
GDX matches Silver, so Tuesday is day 30 and the Fed day is day 31. I almost just have to believe that we will get a false rally after the Fed, and then a quick dip as a shakeout in the following couple of days into a dcl. We also could see…
.
We also could see a strong rally out of the Fed Mtg into Friday and a pullback to a dcl.
.
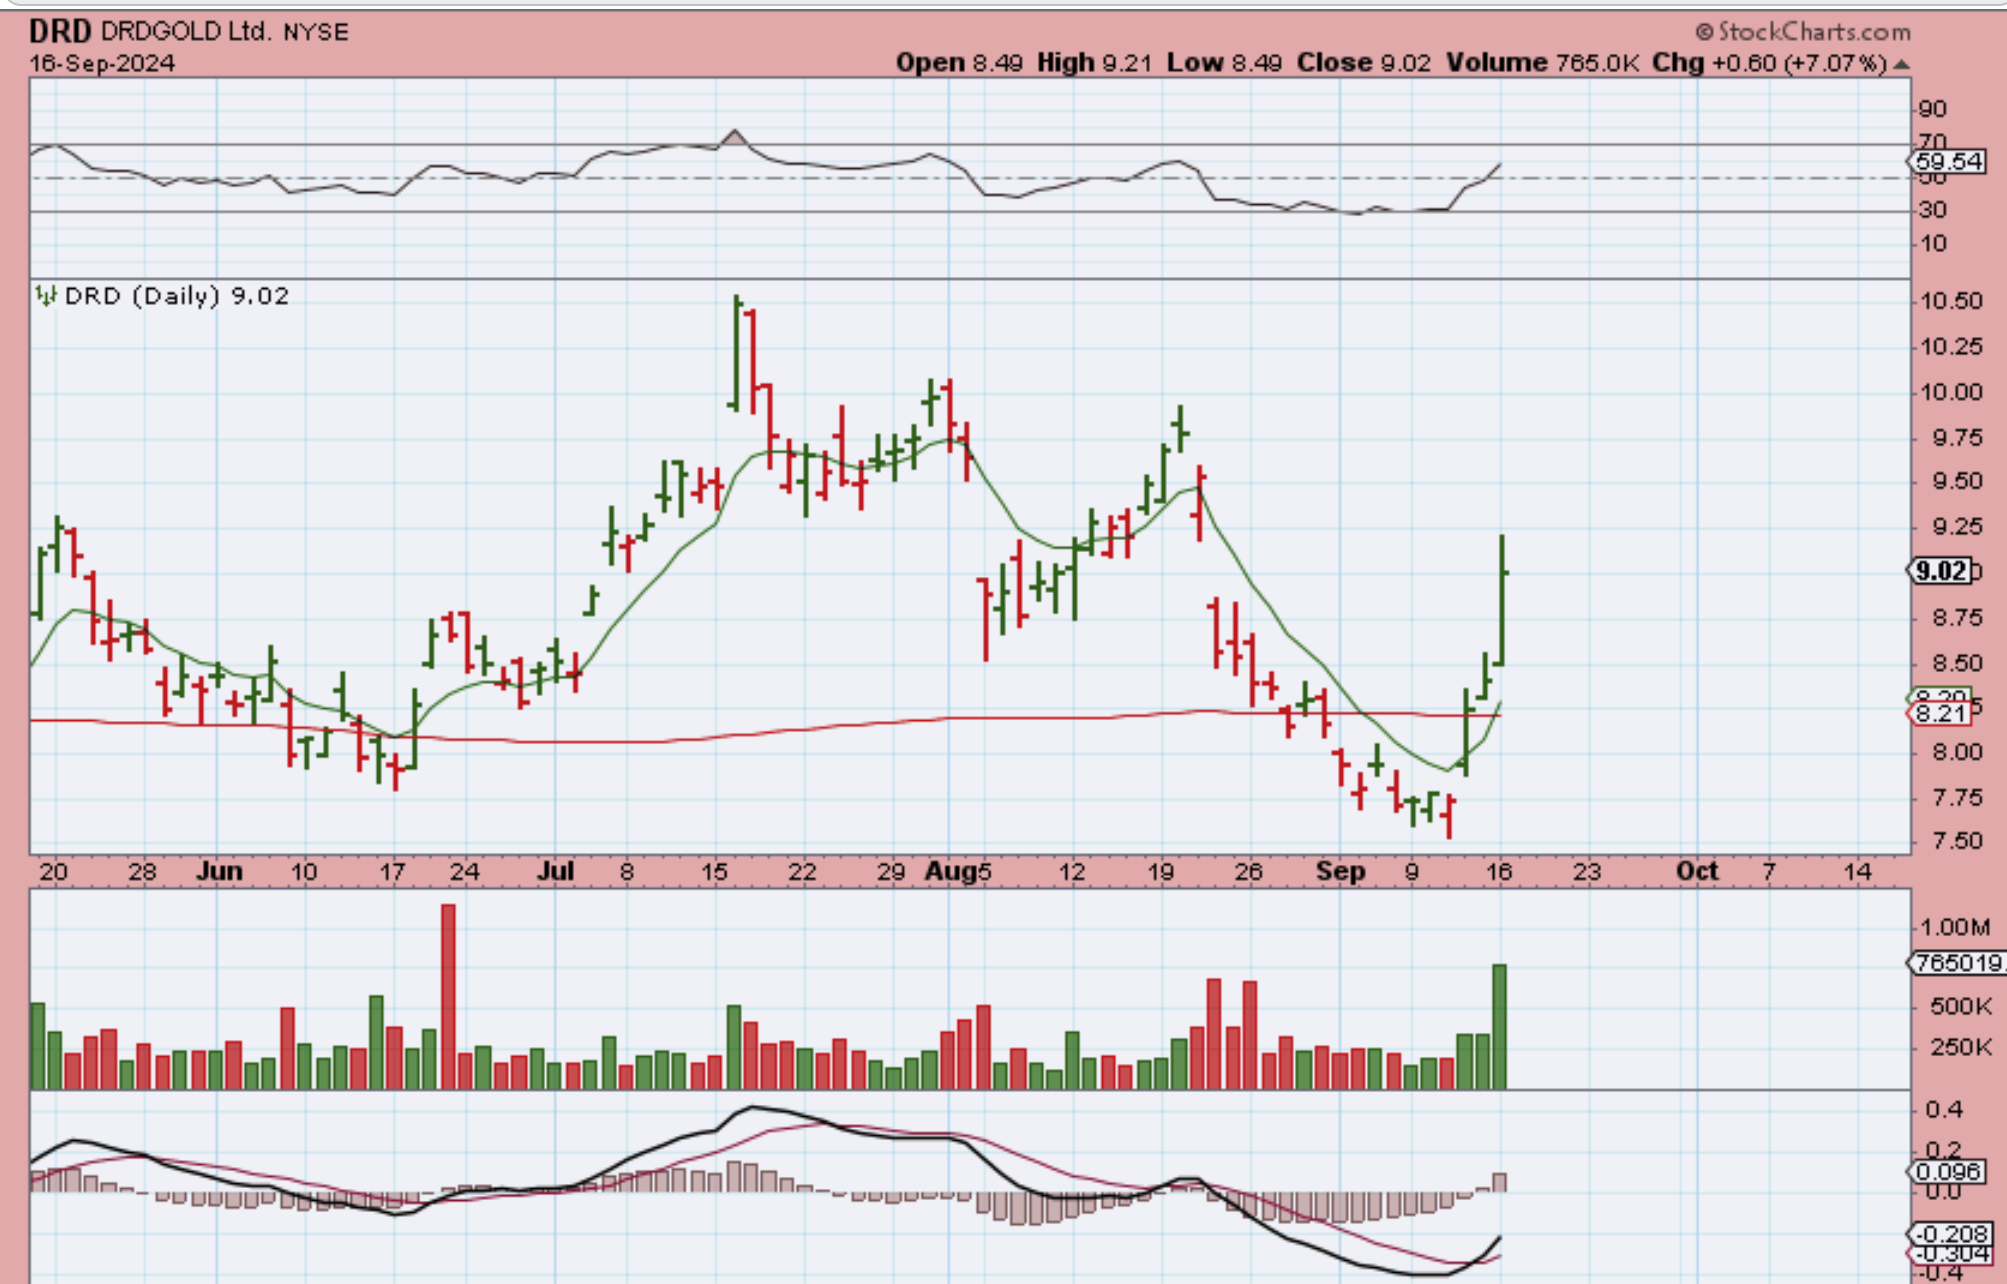
I thought that it was interesting that some miners were pulling back, but others (like a few of the S. African Miners) did well on Monday. DRD was up 7% and HMY was up over the 50sma.
.
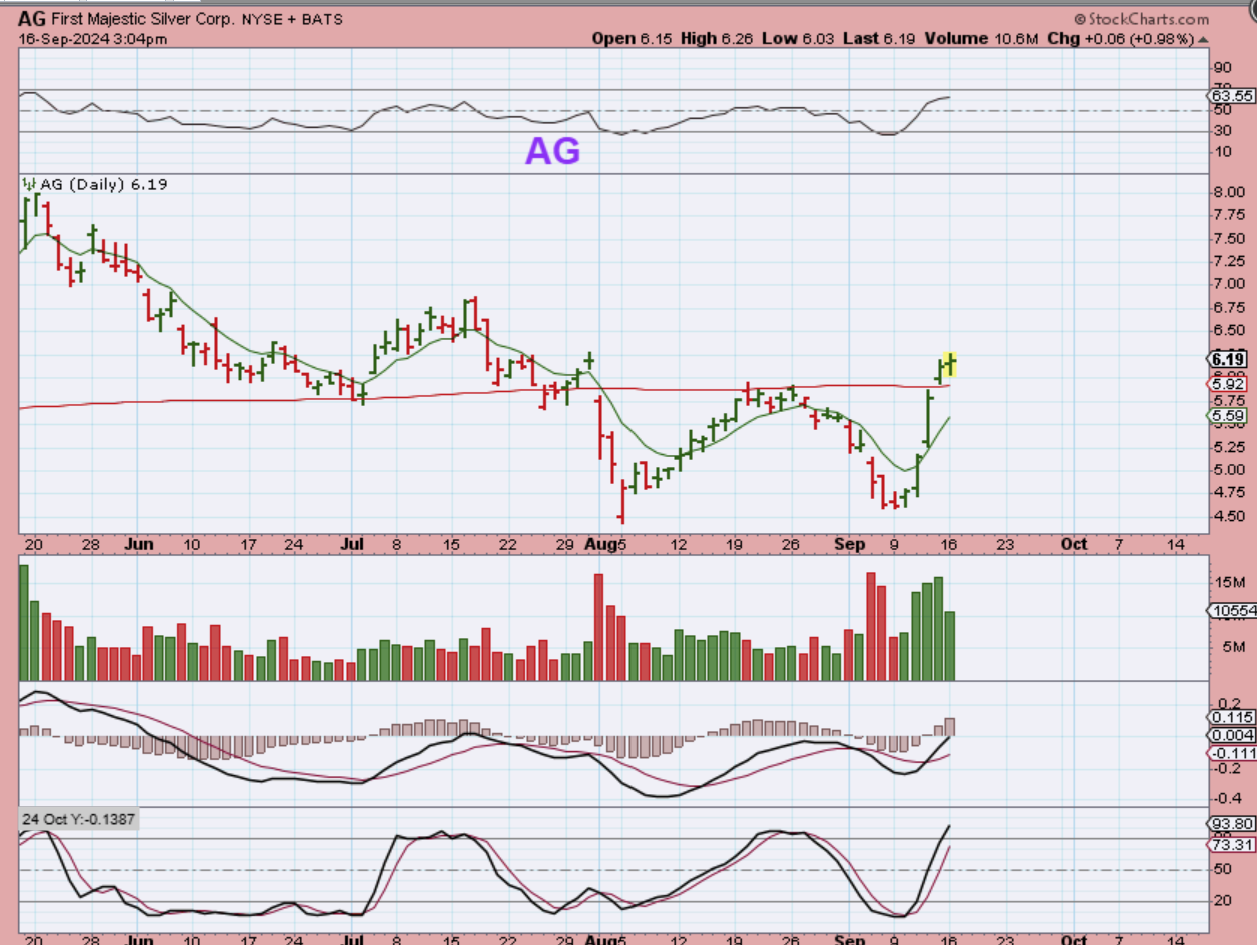
Also some of the Silver stocks are holding up over the support areas too. AG, EXK, FSM, etc dipped and recovered on Tuesday.
.
So we could have pulled back into a low heading into the Fed Mtg, and then see a strong rally the day after, but at this point, we are sideways with a dogi in many areas. From here, we really just have to see how things play out as we approach the Fed mtg. Enjoy your Tuesday trading!
.
~ALEX
.
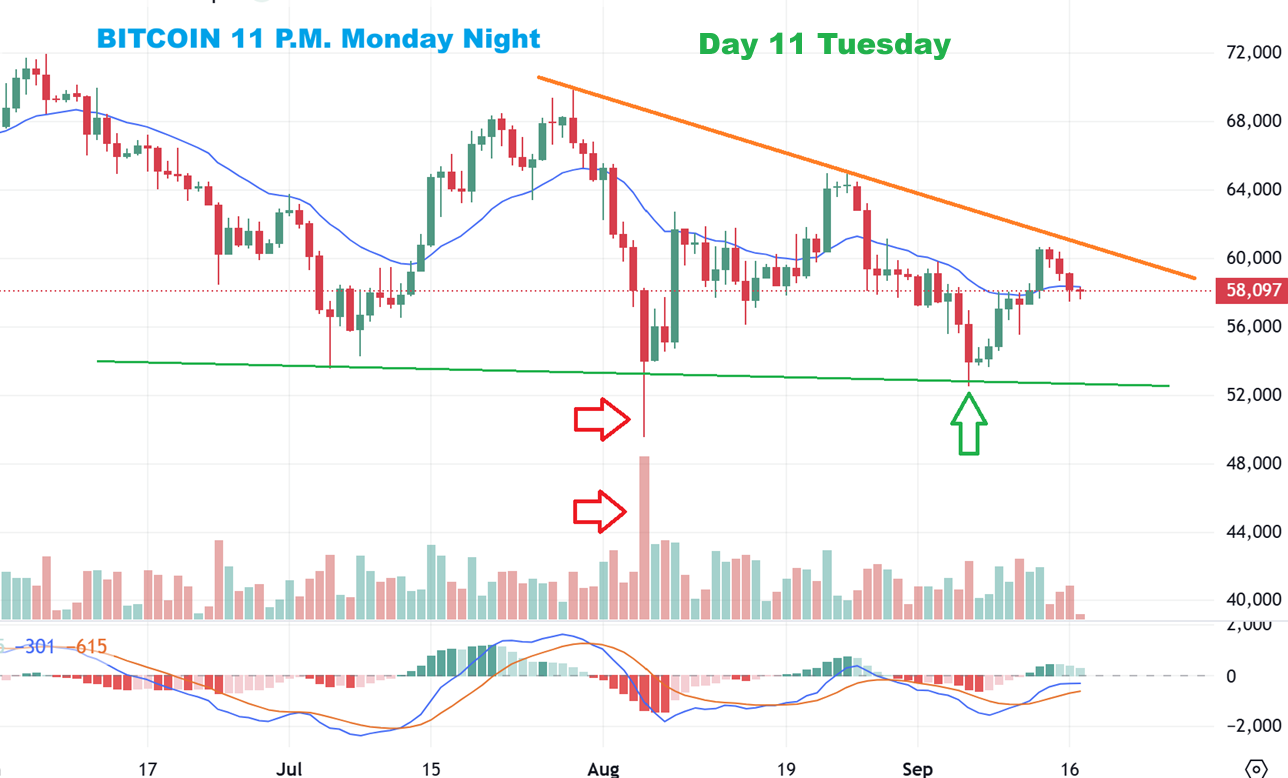
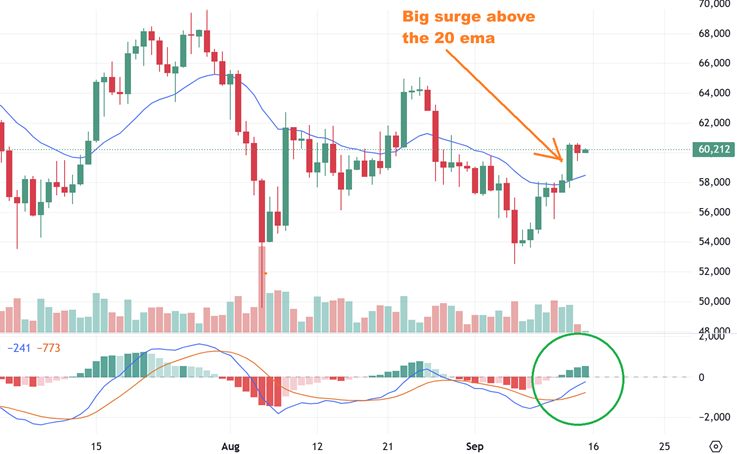
On Friday, BITCOIN surged above that 20 ema and it looks strong, but as you’ll see that we dropped back to the 20 ema area over the weekend…
.
BITCOIN– So Bitcoin dropped back to the 20 ema area, but it should be early in the move out of the lows. I expect Bitcoin to move higher, but that Fed Mtg could cause some volatility.