
September 14th Weekend report
We had a week of Inflation Data that set the markets on fire From Wednesday into Friday. I want to do something just a little different in todays report. Instead of showing the daily and then the weekly chart of each sector, I want to show all of the daily charts and then all of the weekly charts.
THIS WEEK IS A BIG WEEK, WITH THE FED DECISION ON RATE CUTS COMING ON WEDNESDAY, and the charts also show us to possibly be at an important point.
.
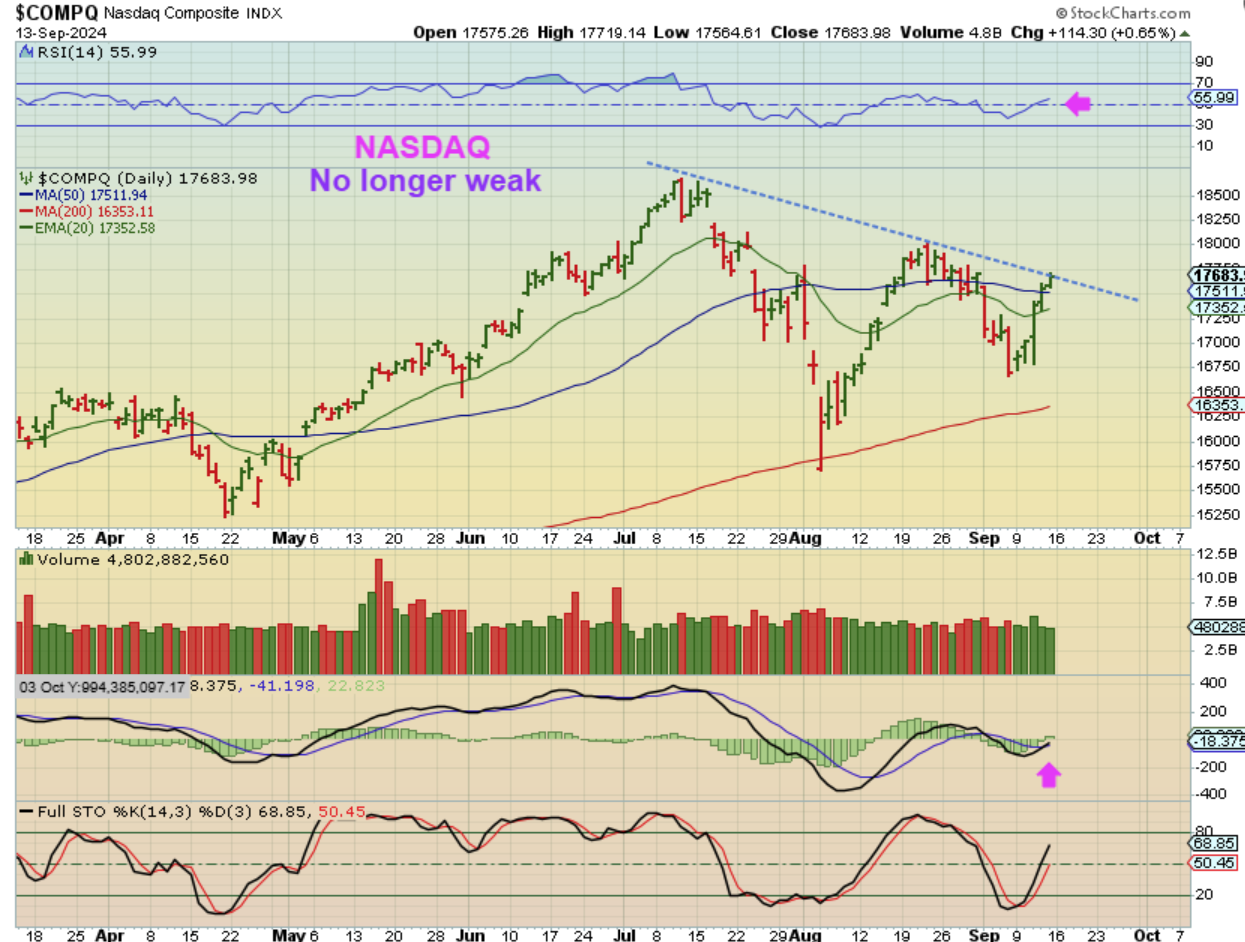
NASDAQ DAILY – The daily charts do not look to be weak anymore, and you can see that large surge that the Nasdaq had 3 days ago on Wednesday changed things. We are now at a downtrend line, but above the 50sma again.
.
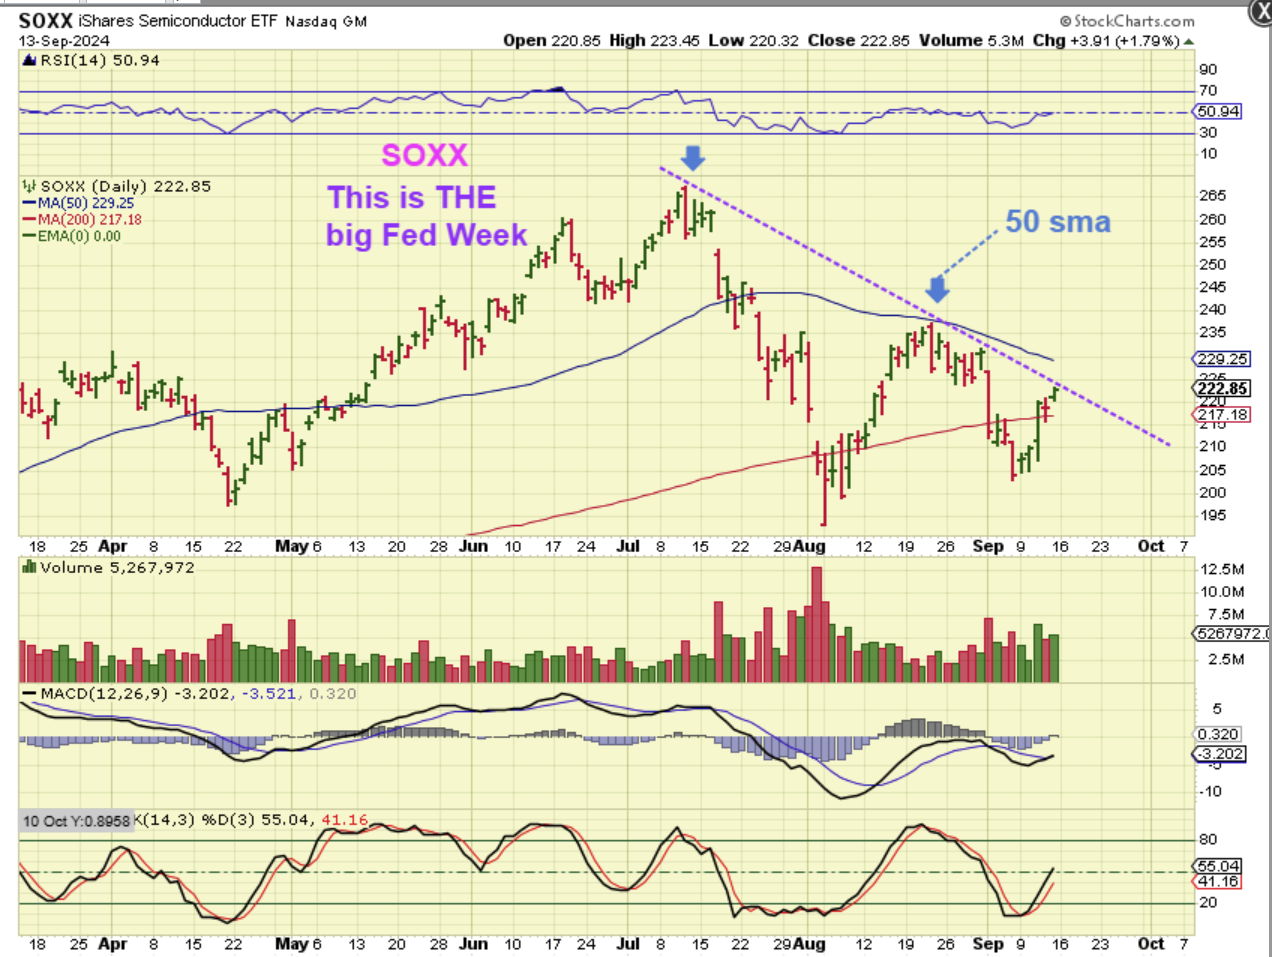
THE SOXX DAILY remains weaker than the SPX and NASDAQ, just making it back over the 200sma. Wednesdays inflation data surge helped there. Can this break the downtrend and 50sma? Stay tuned, because if it does, it would be a sign of strength rather than problematic weakness.
.
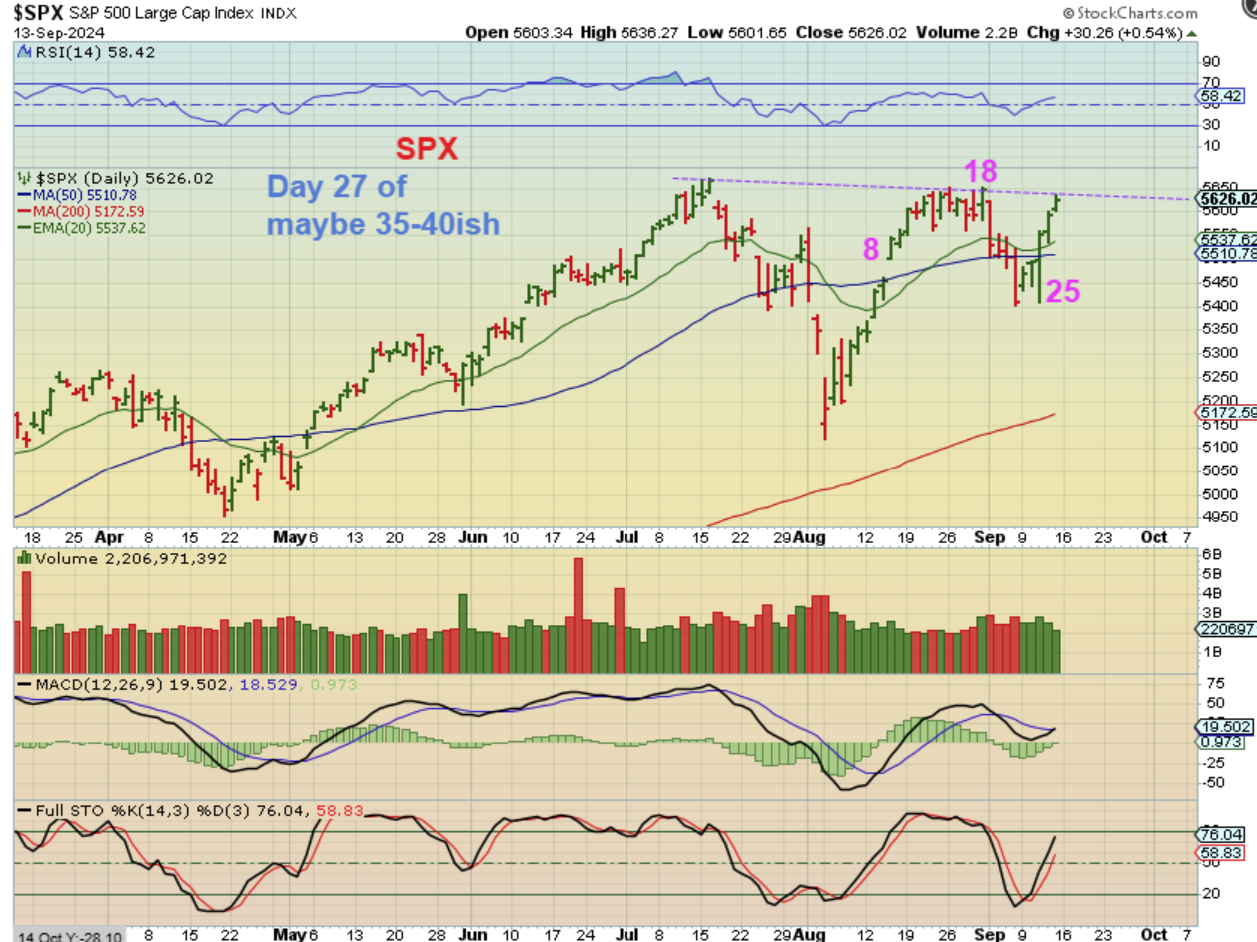
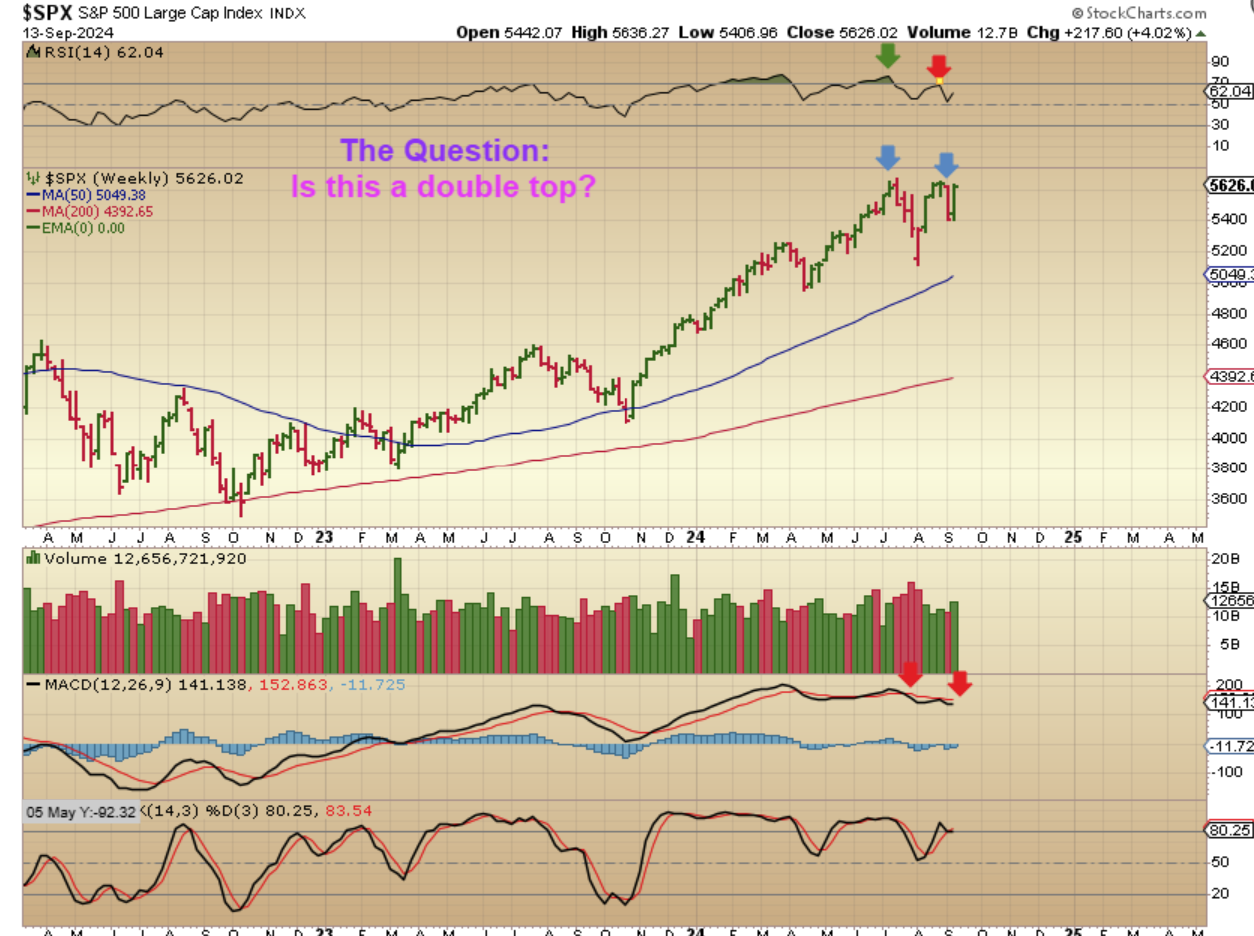
THE SPX DAILY is strong and it is also at the downtrend line, so all 3 markets are at a downtrend line. The difference here is that the SPX is almost back to all-time highs, so it really does look strong. So what about the weekly charts?…
.
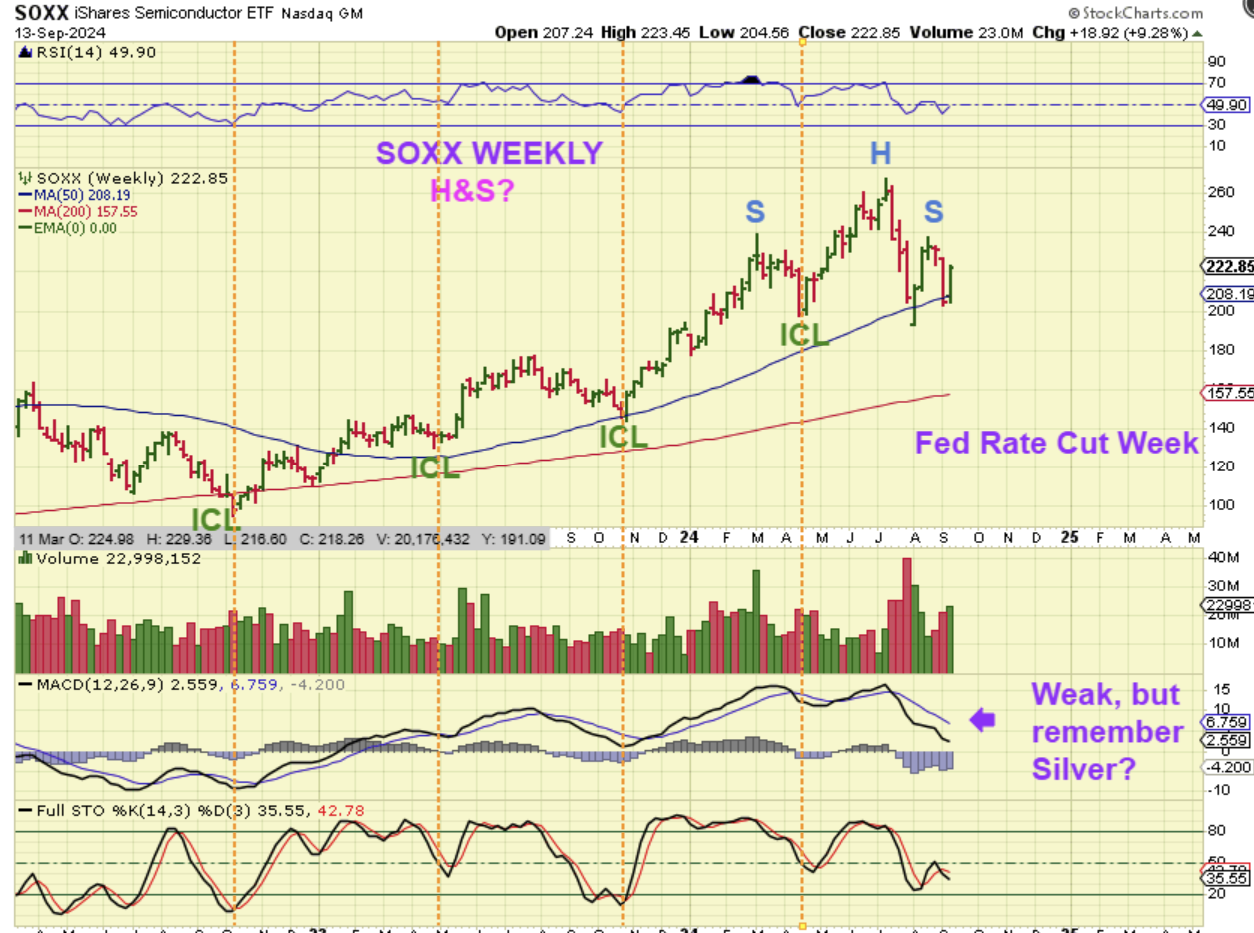
THE SOXX WEEKLY actually dropped to the 50 week ma and reversed with Wednesday & Thursdays inflation data. It has a weak macd, but that can repair itself, however we also may be seeing a H&S formation. So Fed week is important. I also marked the ICL to ICL areas and if that straight down July-August crash was an ICL, it would only be 3.5 months ahead of the last one. Very different from what we usually see.
.
THE SPX WEEKLY: Again, it is back near all-time highs, but this could also be a form of a double top when you look at the RSI & MACD Divergence. In all honestly, this really does look very bullish, so we may have…
.
In all honestly, those charts really do look bullish, and that would mean that we may have that 3.5 month ICL to ICL in play. That seemed too short, but what the Fed is doing with rapidly raising rates and then cutting them again is something new too. A break of the downtrend also usually identifies that an ICL has taken place, so this week may tell us that the Fed rate Cuts will save the day for the markets. At least for now.
.
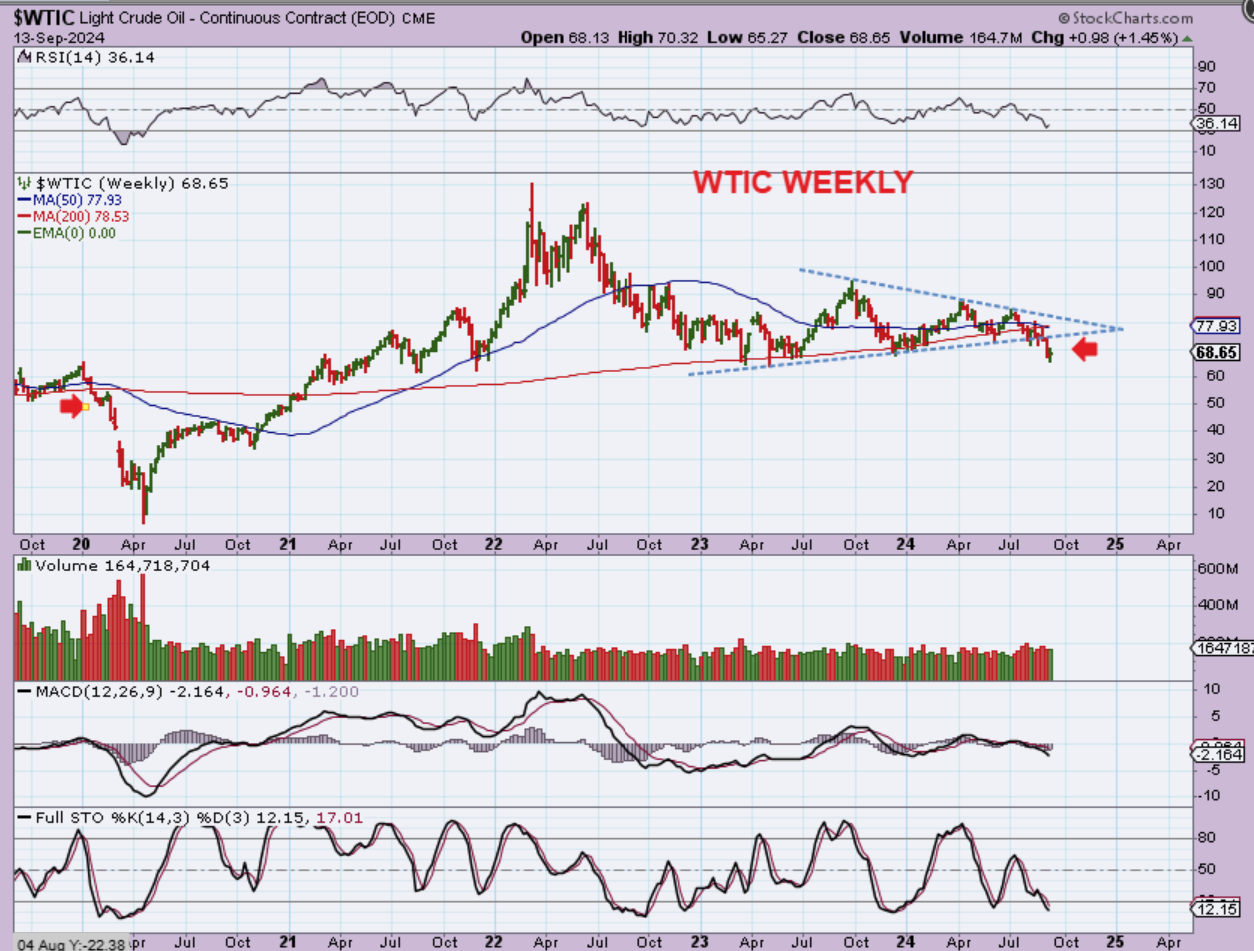
WTIC WEEKLY – Oil broke down below the 200week ma and the triangle lower trendline, and it does have time to sell off further. It can bounce, but I don’t think that the selling is done.
.
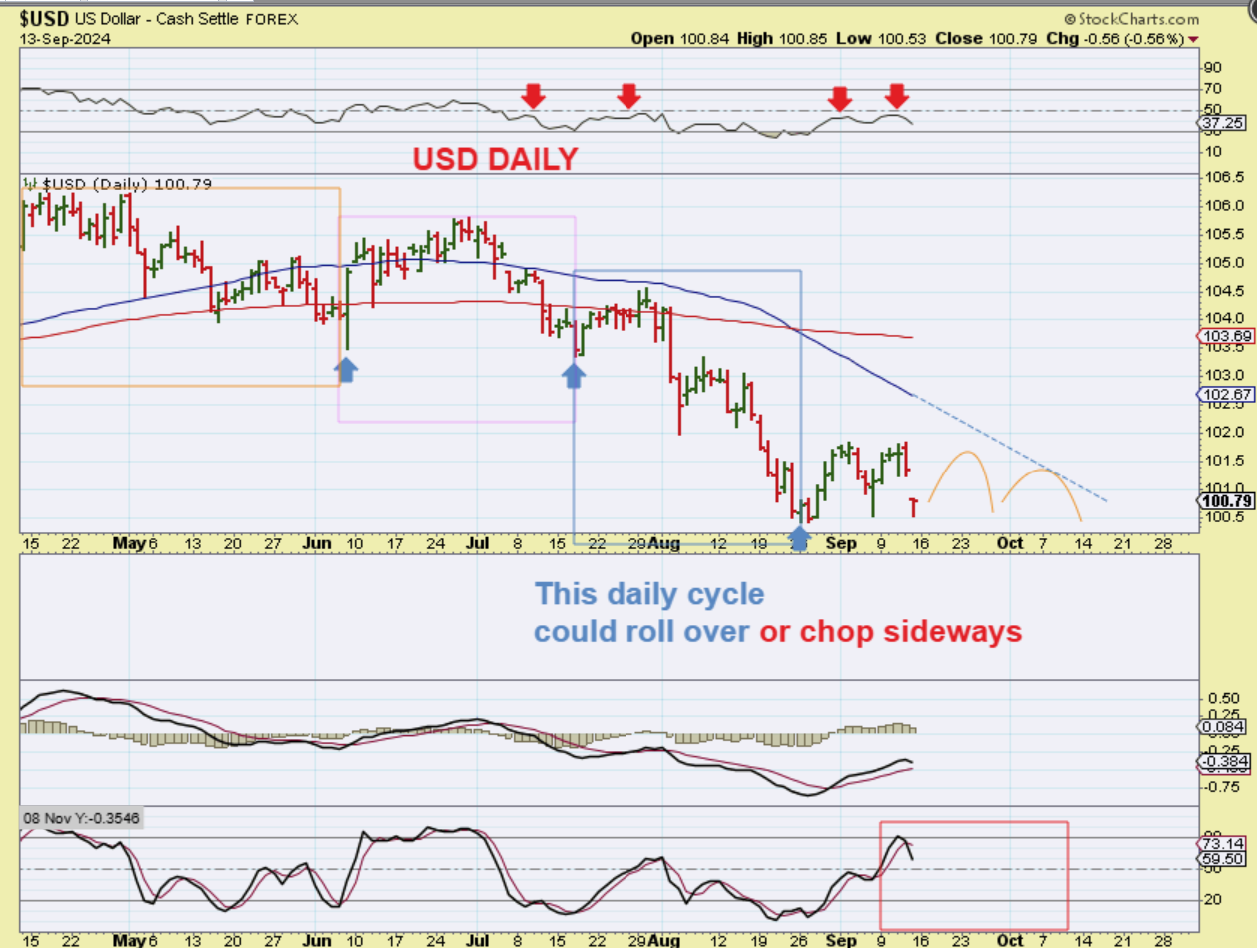
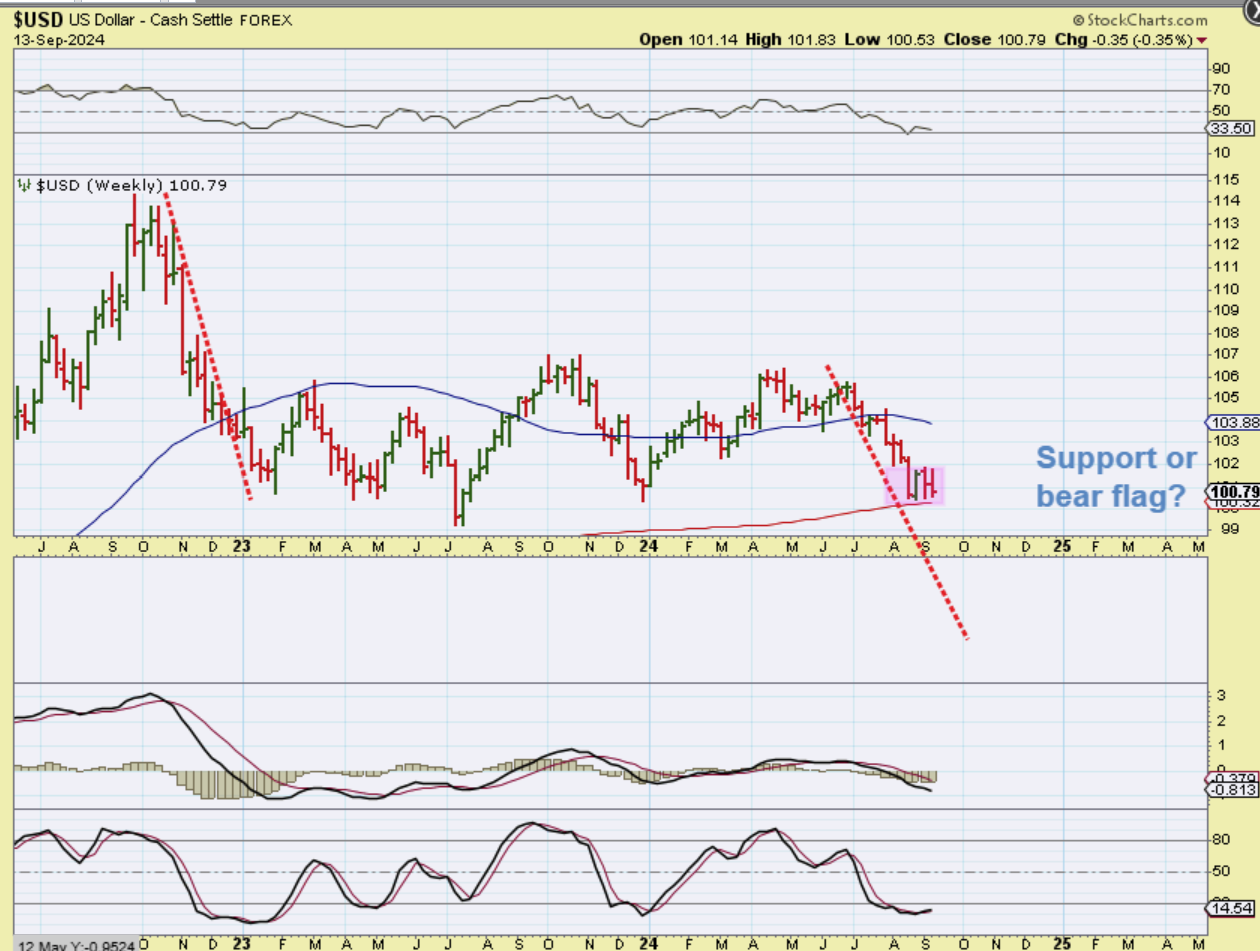
USD DAILY started a new daily cycle in August, but so far it cannot get above the RSI 50% yet, and it is chopping around at the lows here. It definitely could roll over and sell off to new lows, or it may chop sideways, as drawn on this chart. News of a rate cut has hindered the USD. What does the weekly chart show?
.
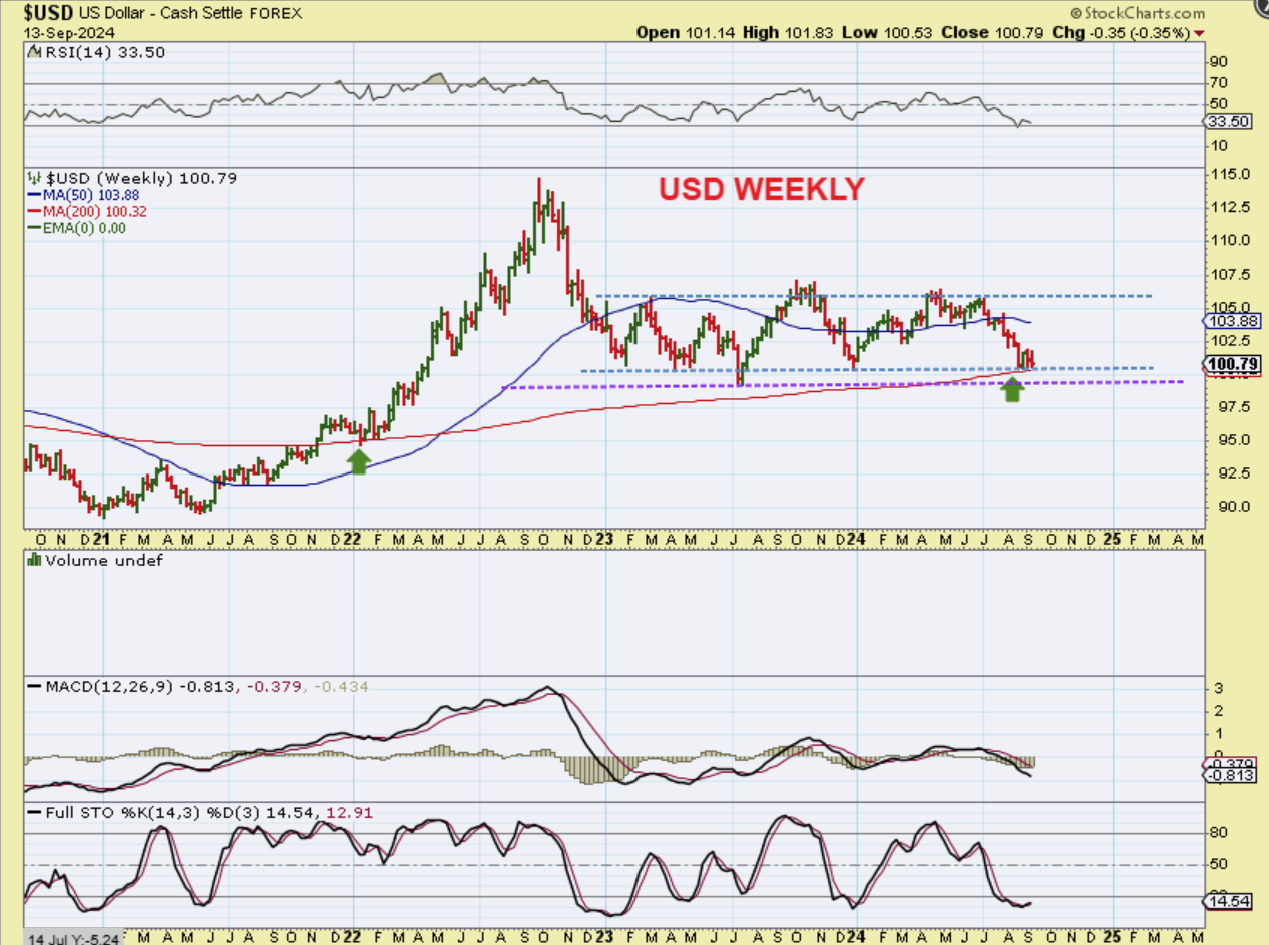
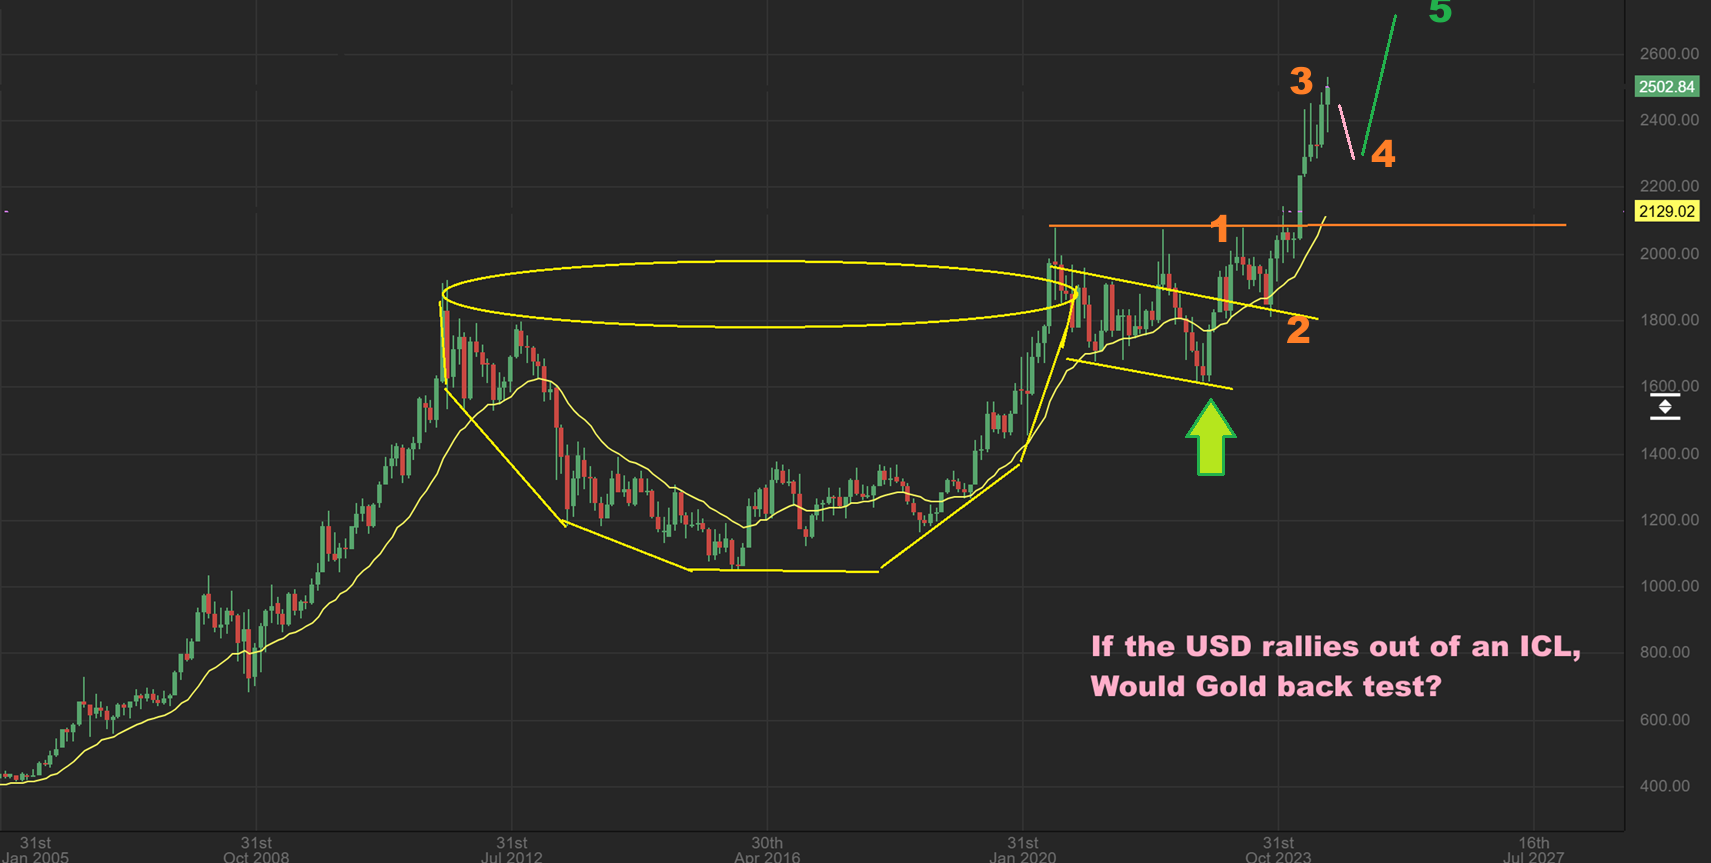
THE WEEKLY USD Chart shows that the price of the USD is actually bouncing along a support area at the very lows of the consolidation and the 200week ma. If the USD breaks down as a result of the Fed Rate Cuts, it could break that 3 yr low from 2023!
.
USD WEEKLY – Look at the weekly MACD. And is that a bear flag? A breakdown would send the USD even lower over time as more rate cuts are made. What might this do to the Gold Bull Market? It could be very good for a continuation of the Bull Run, and Silvers run to all-time highs and more.
.
Speaking of that Gold Bull Run…
.
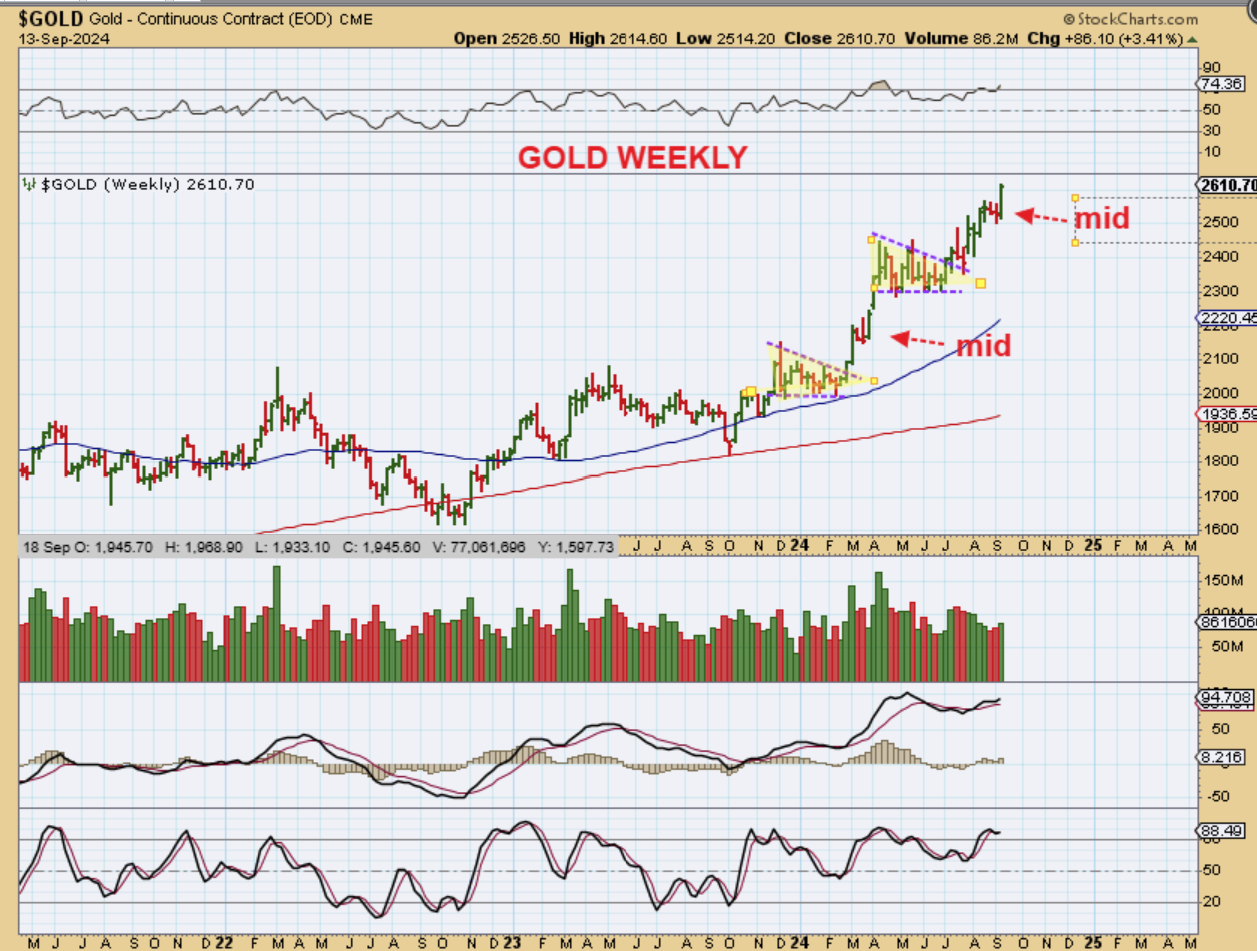
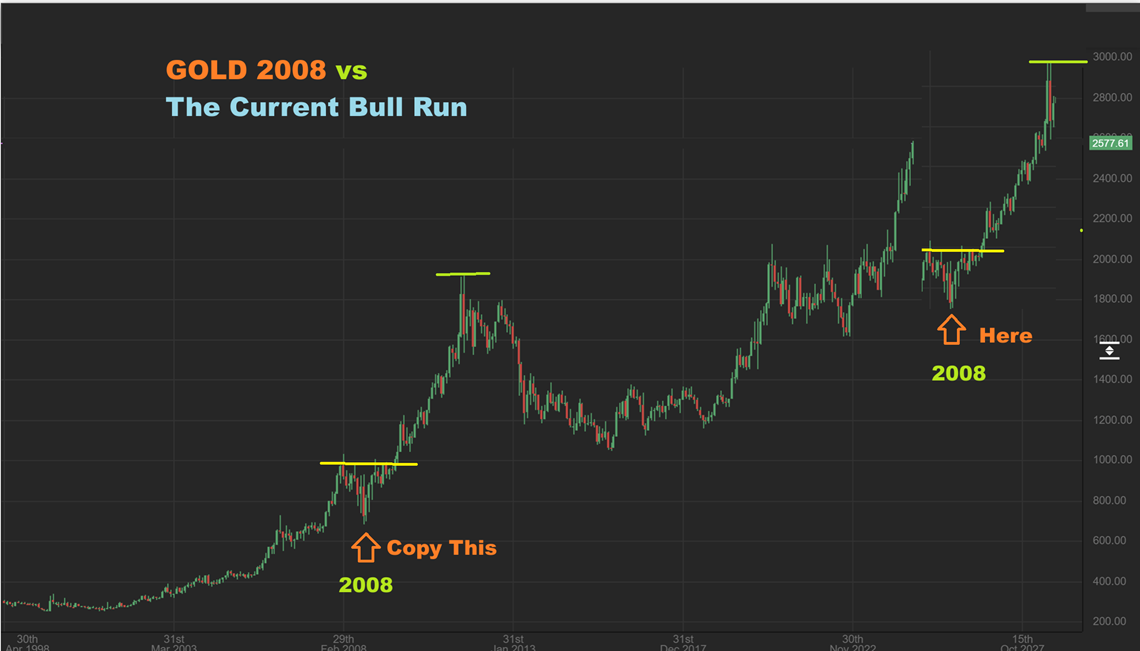
GOLD WEEKLY – Gold has been strong all through 2024, despite the lack luster times for Silver in 2024. Please study the patterns that I have outlined here.
.
GOLD WEEKLY – In the past I have mentioned the obvious Cup and Handle, but I have also…
.
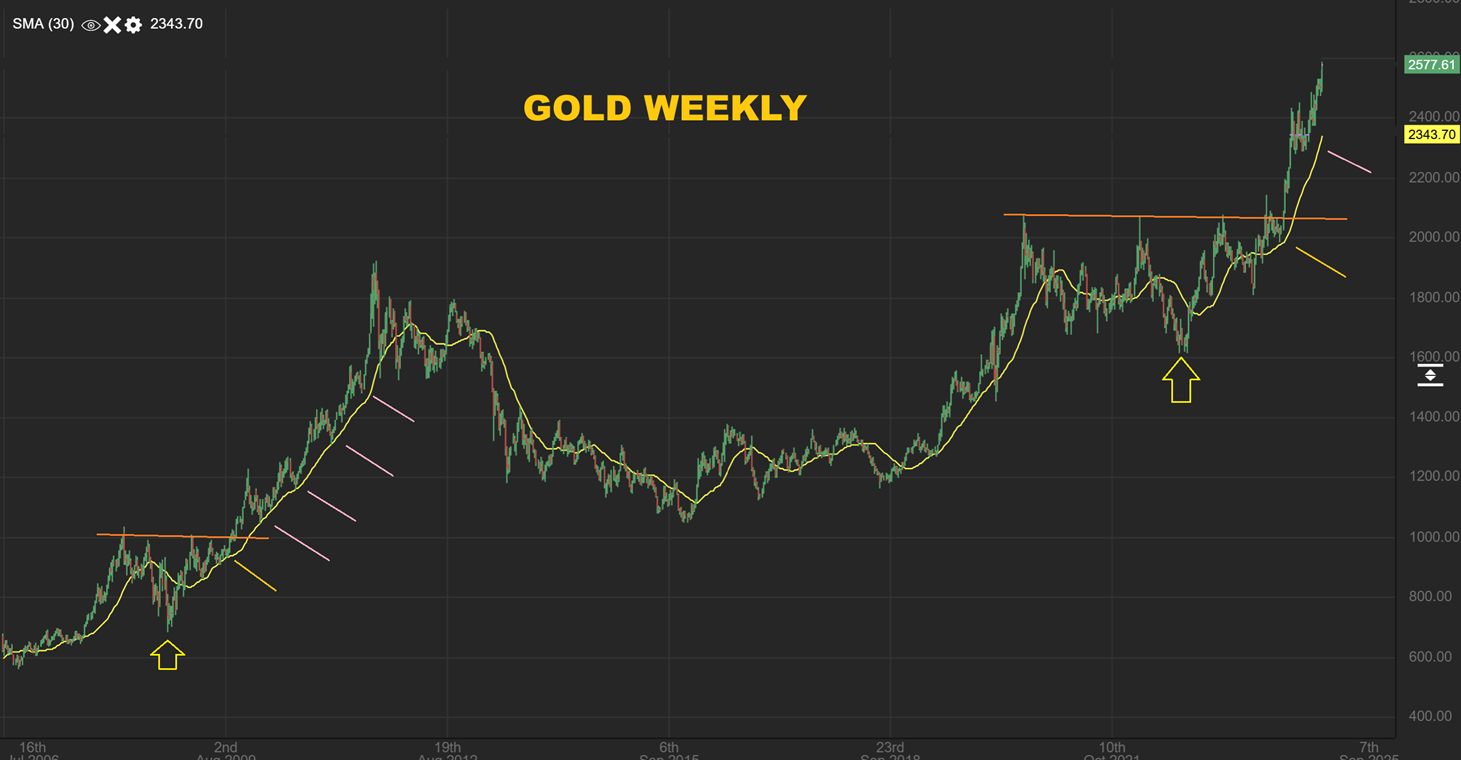
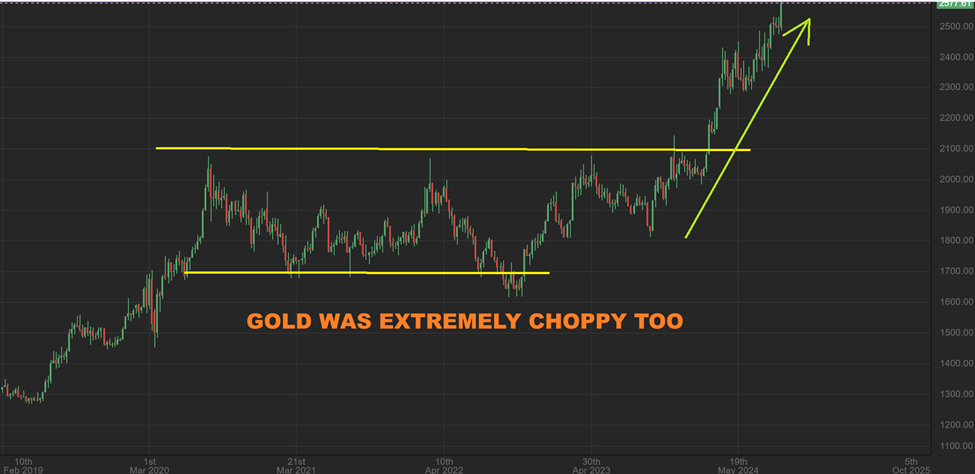
…But I have also pointed out that 2008 Gold consolidation and compared that to now. The reason that I wanted to show it again now is because now that we have the breakout, you can see just how long Gold ran higher out of that 2008 consolidation. This recent consolidation was longer than the one in 2008, so the rally could be longer too. In Fact…
.
In Fact, if I copy that 2008 consolidation and rally and place it beside the current one, you can see that the consolidation was smaller, and yet it ran even higher than we are now. So this gold Bull Run should still have a way to go (with pullbacks along the way). This rally does look a bit more ‘straight up’, so we need to be careful of a parabolic blow off top move.
.
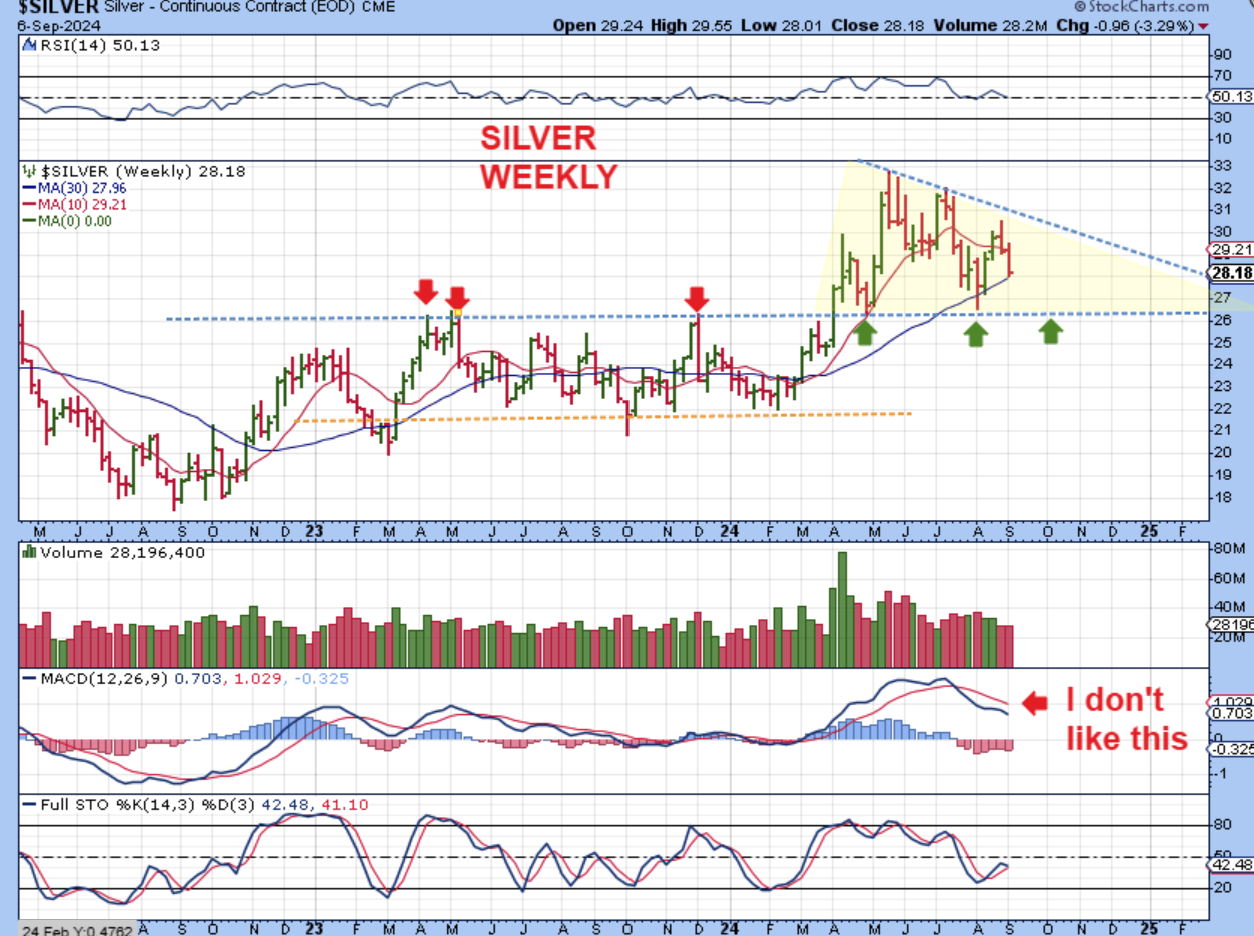
LAST WEEK:
SILVER WEEKLY September 6th, I was concerned about the weekly drop to support, with that MACD. This needed to hold and the MACD needed to repair.
.
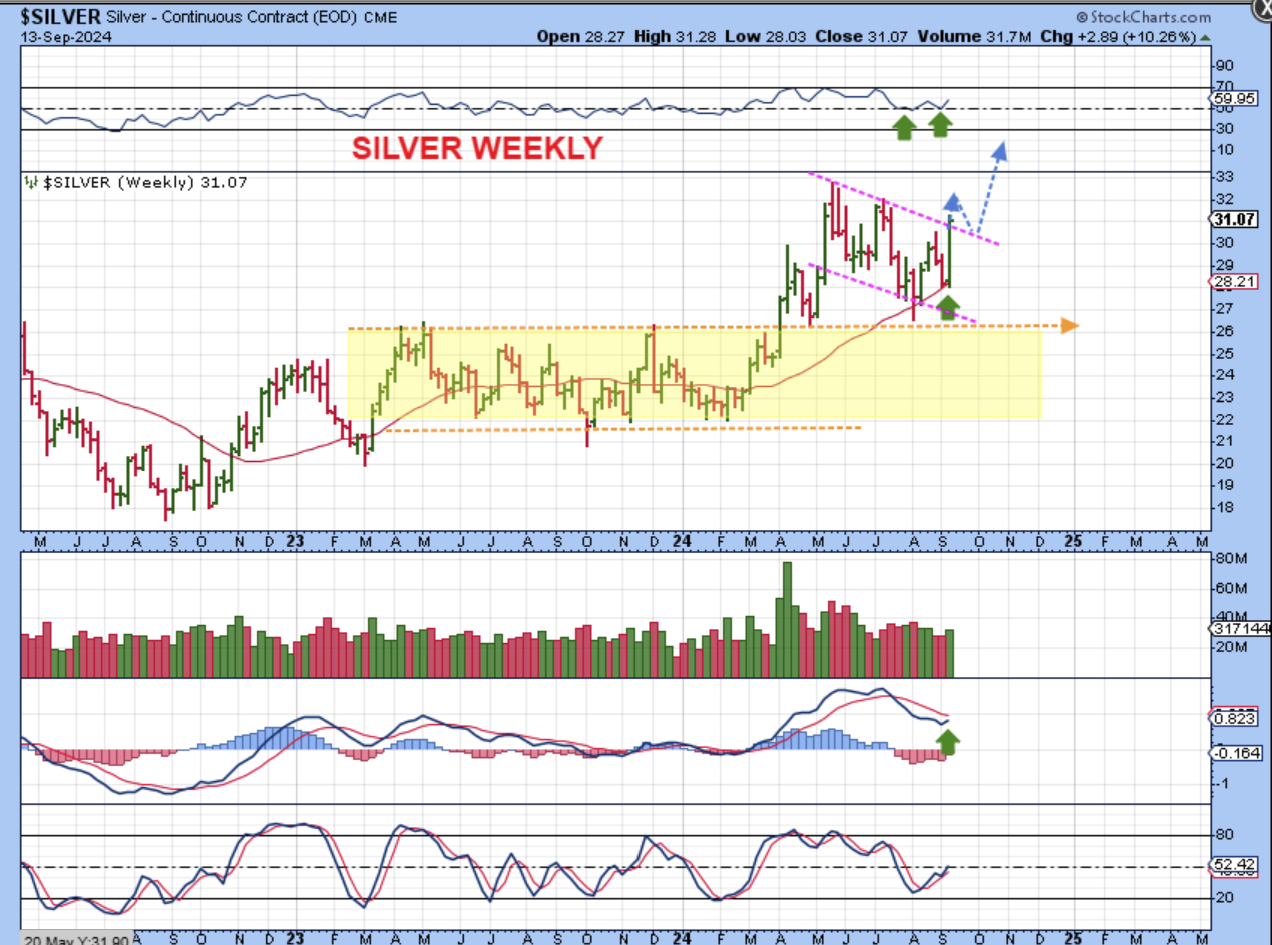
We got a perfect reversal this week and the MACD is starting to curl upward, so this looks like the ICL is in for Silver and this is the first daily cycle. We have:
1. A back test of the yellow consolidation areas breakout
2. The weekly RSI 50% held up
3. A reversal right at the support of the weekly moving average.
.
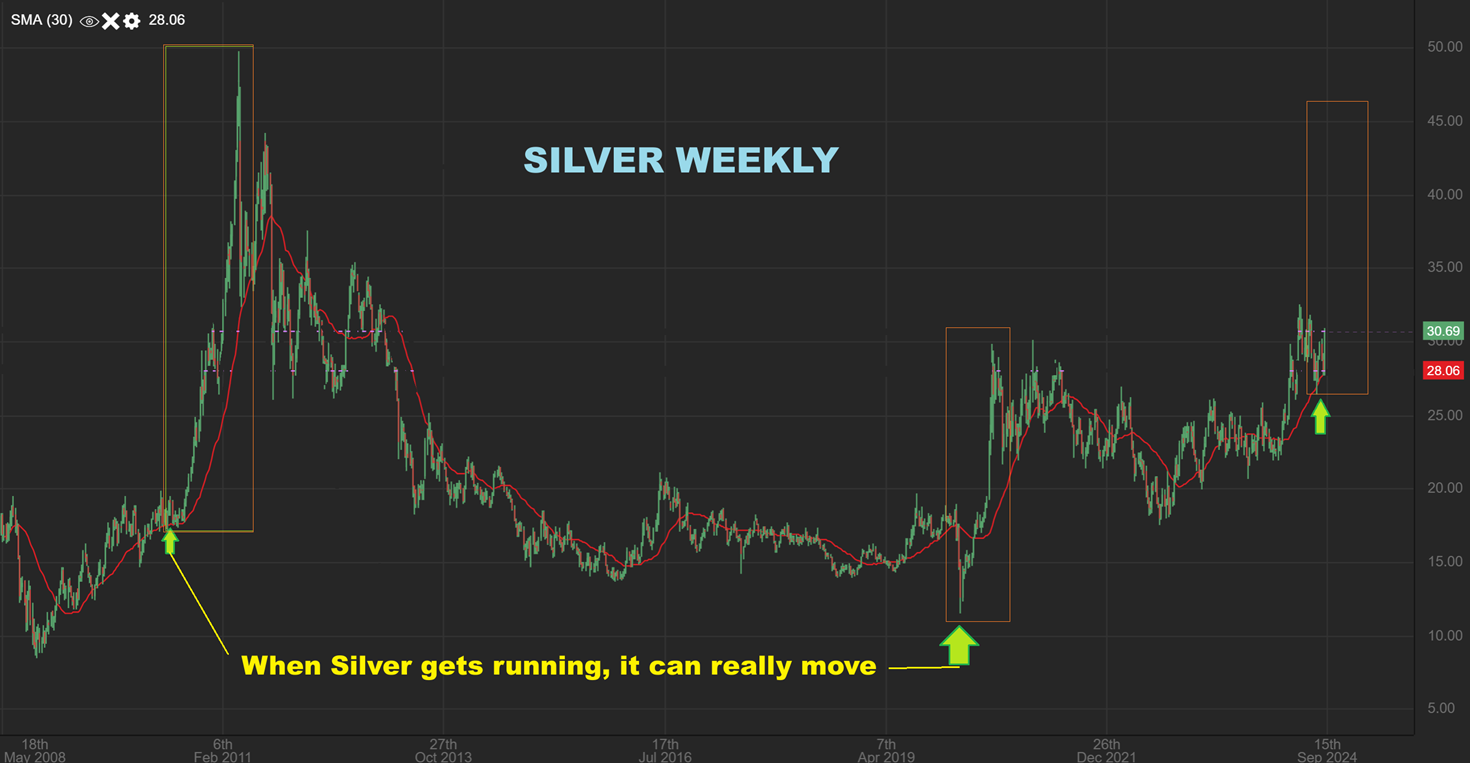
SILVER WEEKLY – When Silver really starts to run, you can see how fast it can go. We could see that into the end of 2024.
.
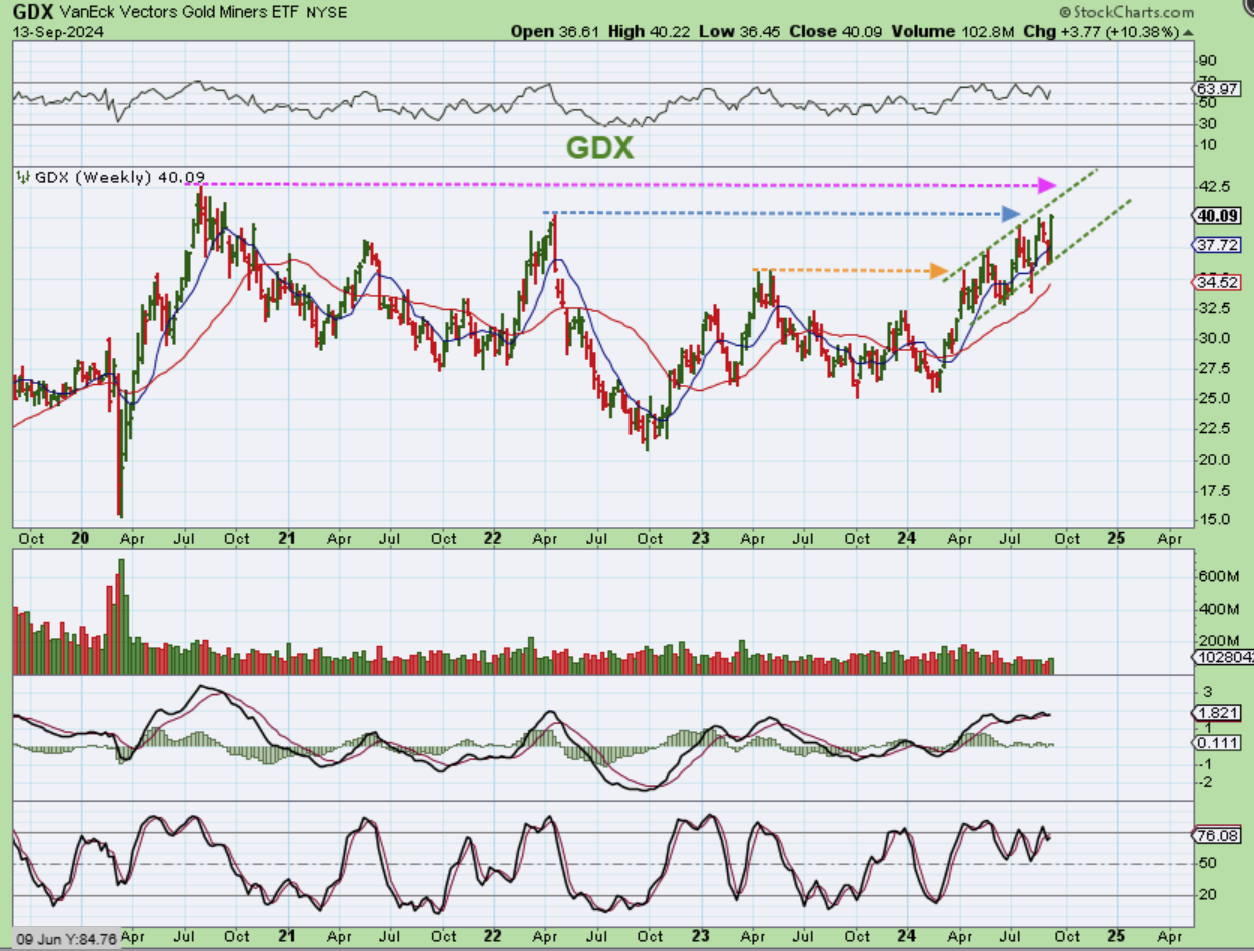
GDX WEEKLY – The Miners have been very choppy, as usual, and this chop has really made it a little hard to buy and hold lately. This is often due to the amount of trading to the left of current price. That said, you can see that they are in a channel climbing higher and this channel can be broken to the upside later in the year as rate cuts continue to be provided. Once it breaks to new highs, it can move higher much easier, as seen with gold.
.
Once it breaks to new highs, it can move higher much easier, as seen with gold. Gold was pretty choppy in that consolidation too, but when it broke free it was straight up for a while.
.
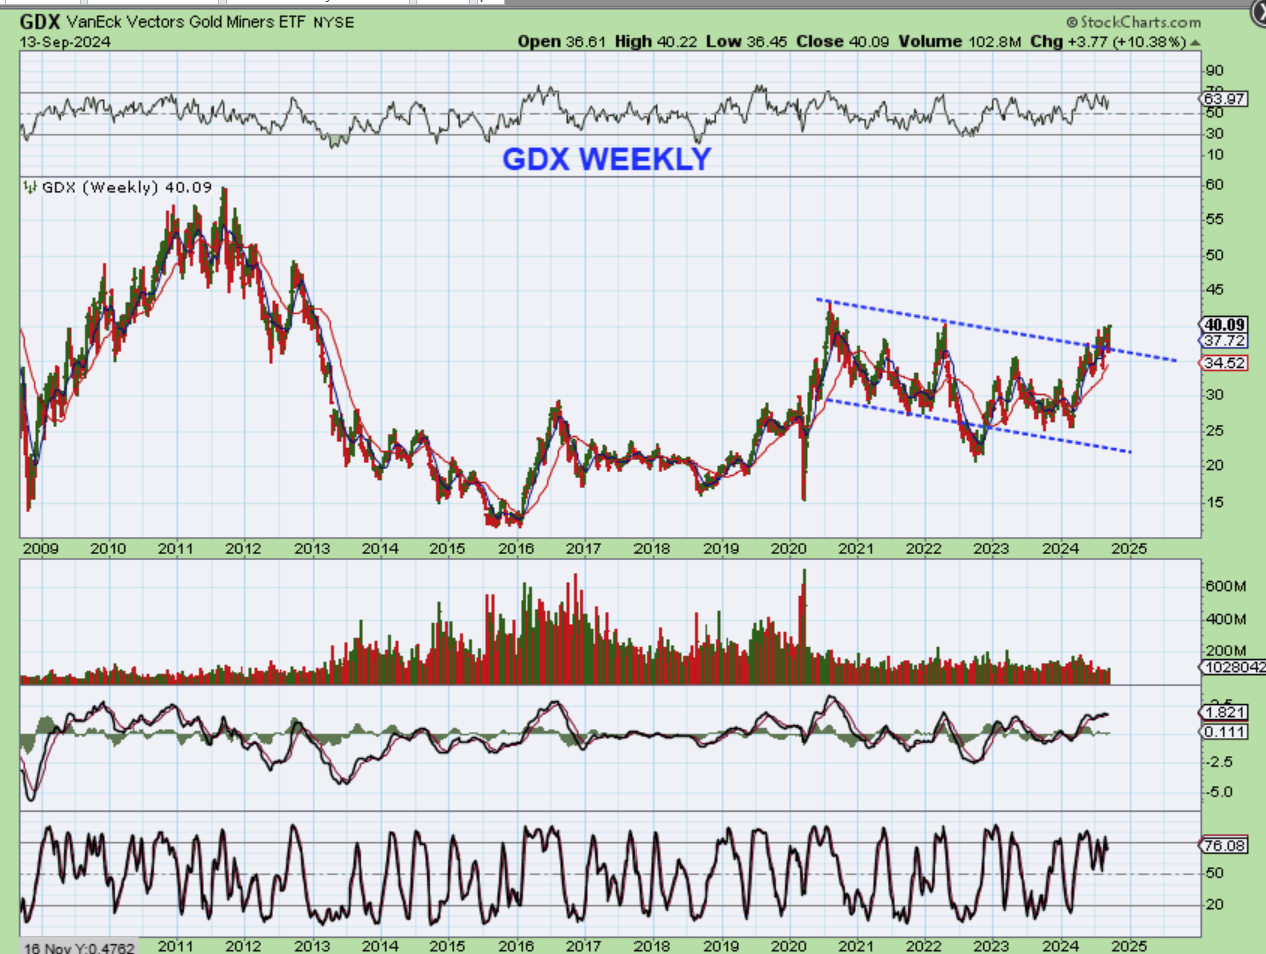
GDX WEEKLY – GDX is breaking free from that downtrend in the choppiness, but it should run even easier once it gets above the 2020 highs too.
.
This weeks inflation data signaled the need for rate cuts, and the Markets took off higher. We have the FOMC MTG this week and a rate cut, so we’ll see if they go .25% (expected) or 50% (unexpected by most). This week we’ll see what happens when the Fed actually cuts rates AND SPEEKS. Enjoy your weekend and thanks for being here with me at Chartfreak!
.
~ALEX
.
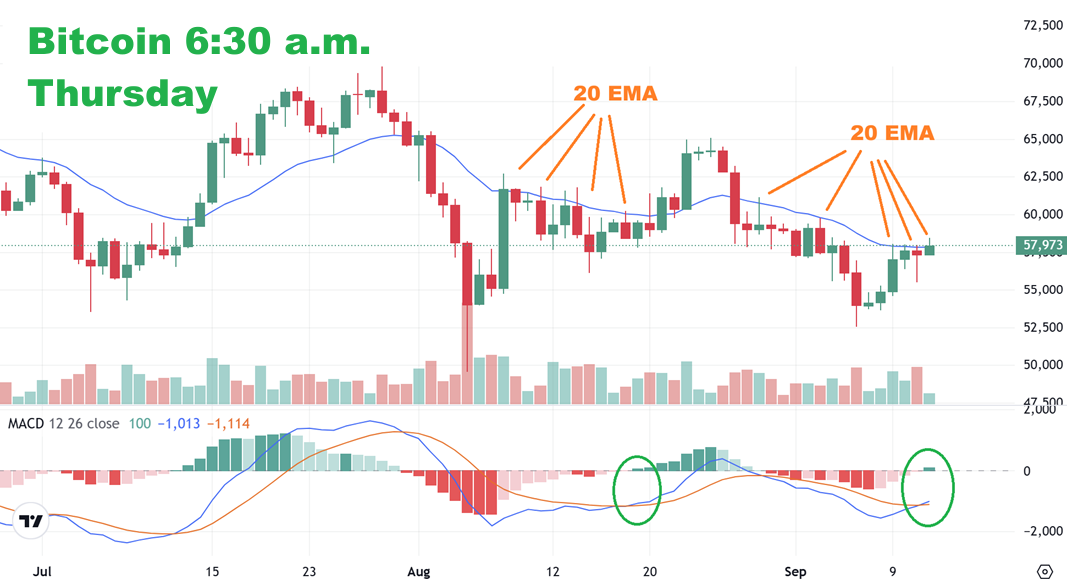
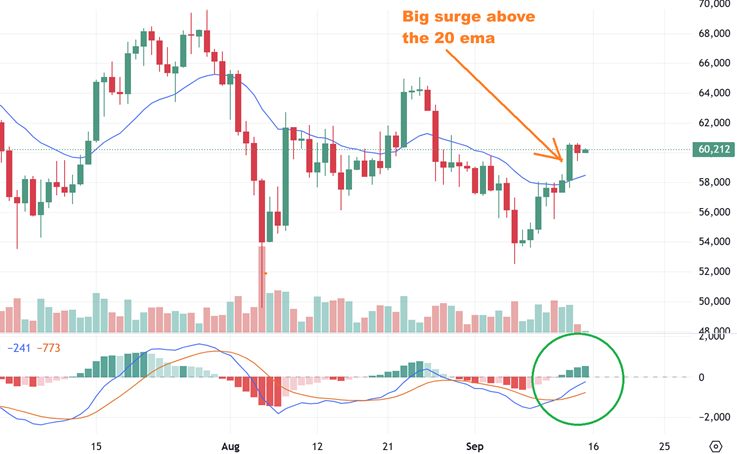
We were on day 6, and watching for Bitcoin to break and close above the 20 ema.
.
BITCOIN is still trying to break and hold above that 20 ema this morning. This should be day 6 with the rare chance that that slam down capitulation low near day 31 re-started the count as an ICL and in that case we’d be on day 30+.
.
BITCOIN surged above that 20 ema and it looks strong, but I did notice that MARA, RIOT, IREN, WULF, etc etc did not close at the highs like Bitcoin. Let me show you…
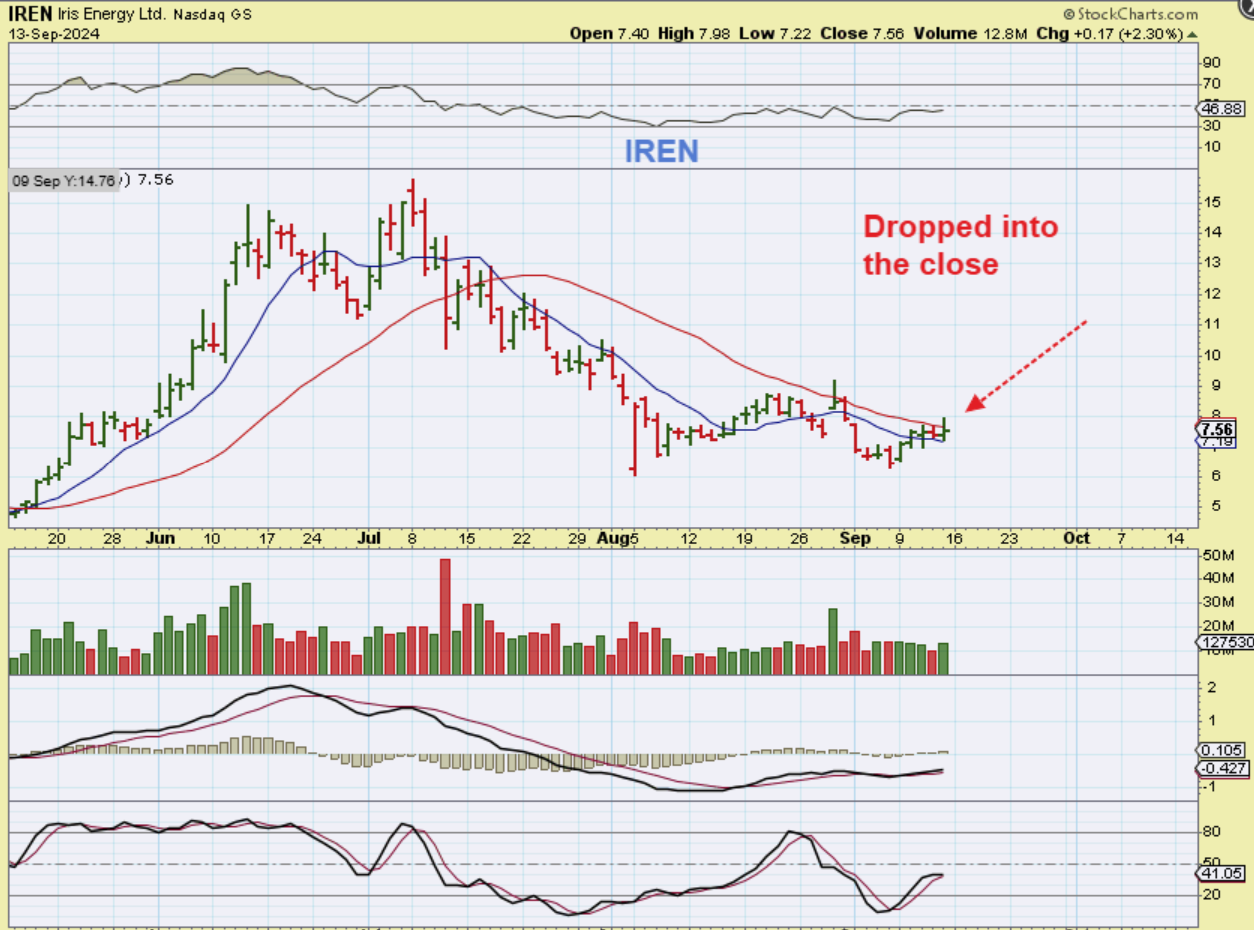
IREN close a little weak on Friday, with Bitcoin near the highs. Notice how it sold off into the close, while Bitcoin did not.
.
MARA also closed a little weak on Friday. It sold off into the close, with Bitcoin near the highs. This makes me wonder if the move higher is ready to go yet.
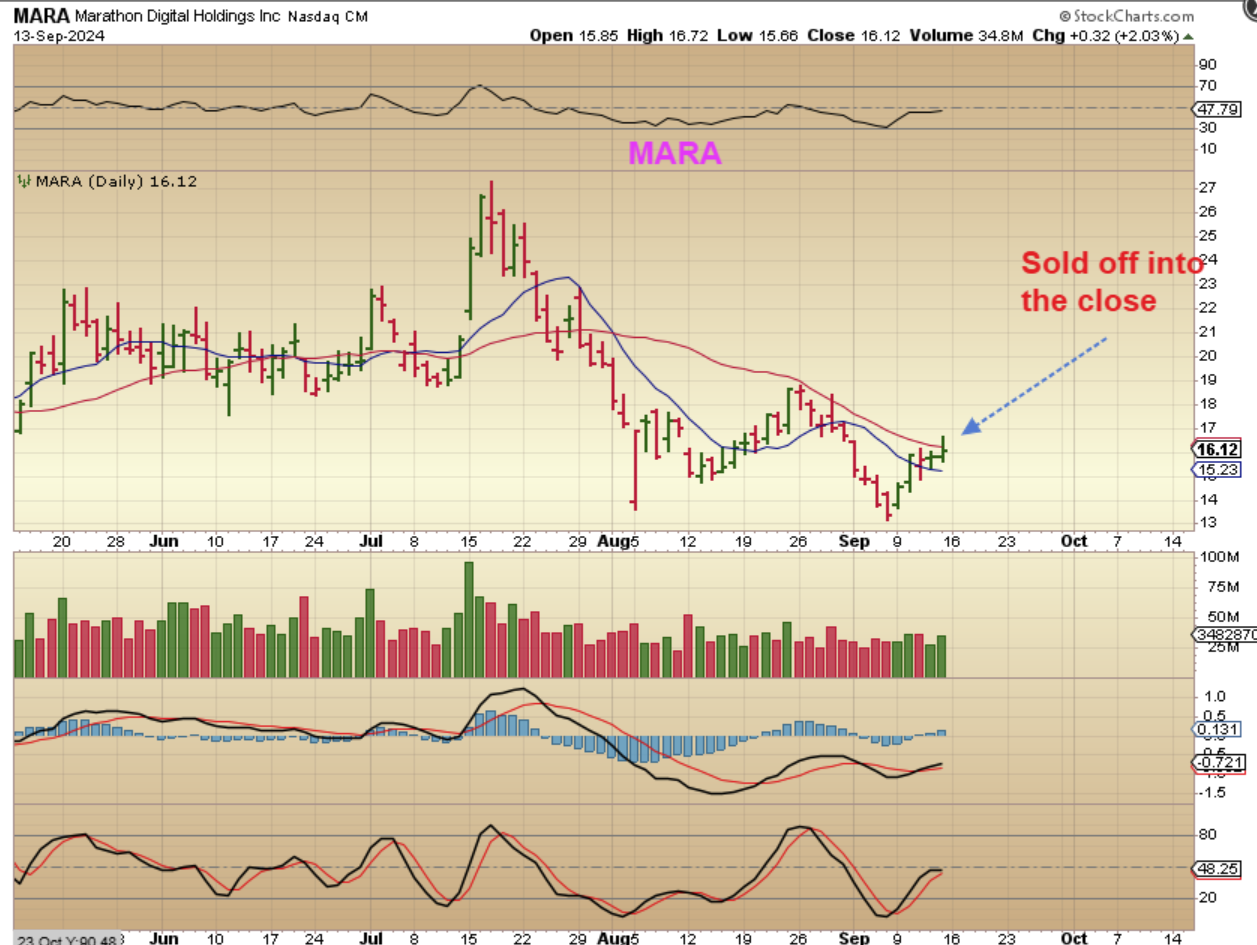
.
Many of the Crypto stocks acted this way as Bitcoin remained strong, so I want to watch this sector and see if this continues. It does make me wonder if the move higher is ready to go yet.

