Thursday September 5th – A Temporary Pause?
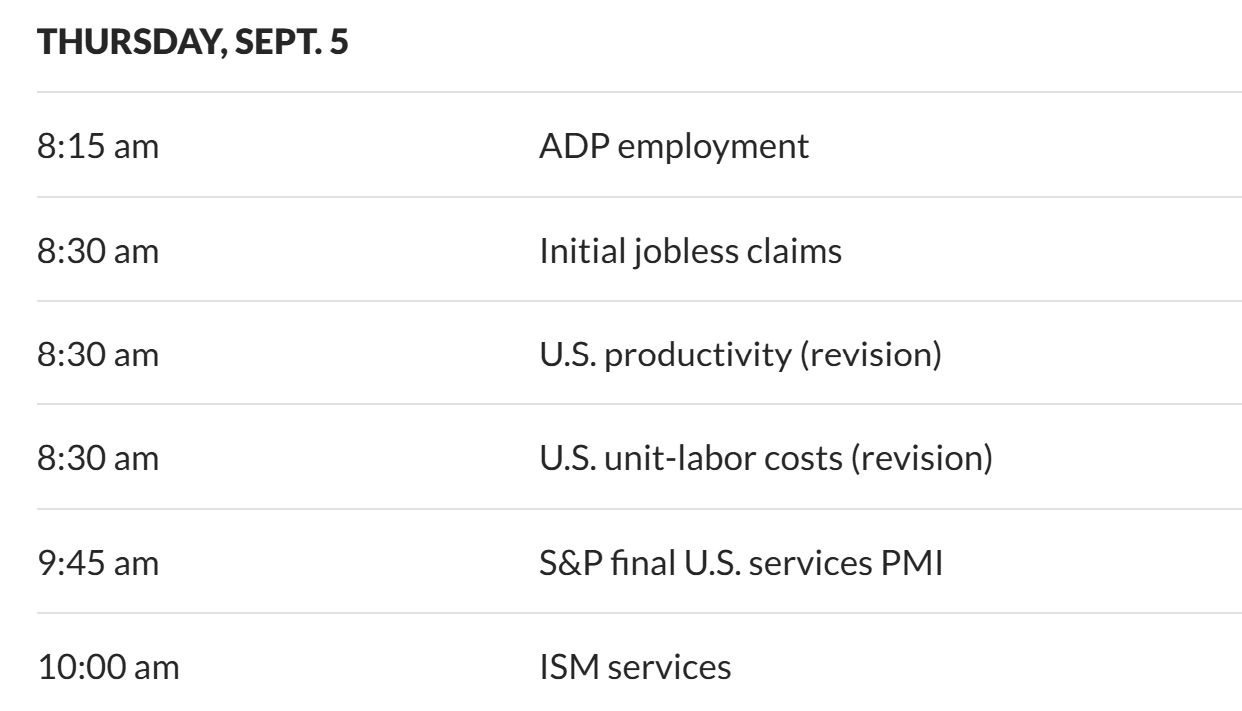
DATA – We saw a pause in the selling with the various market sectors, but we do have the Jobless Claims, PMI, ISM to be released. These are usually Market movers.
.
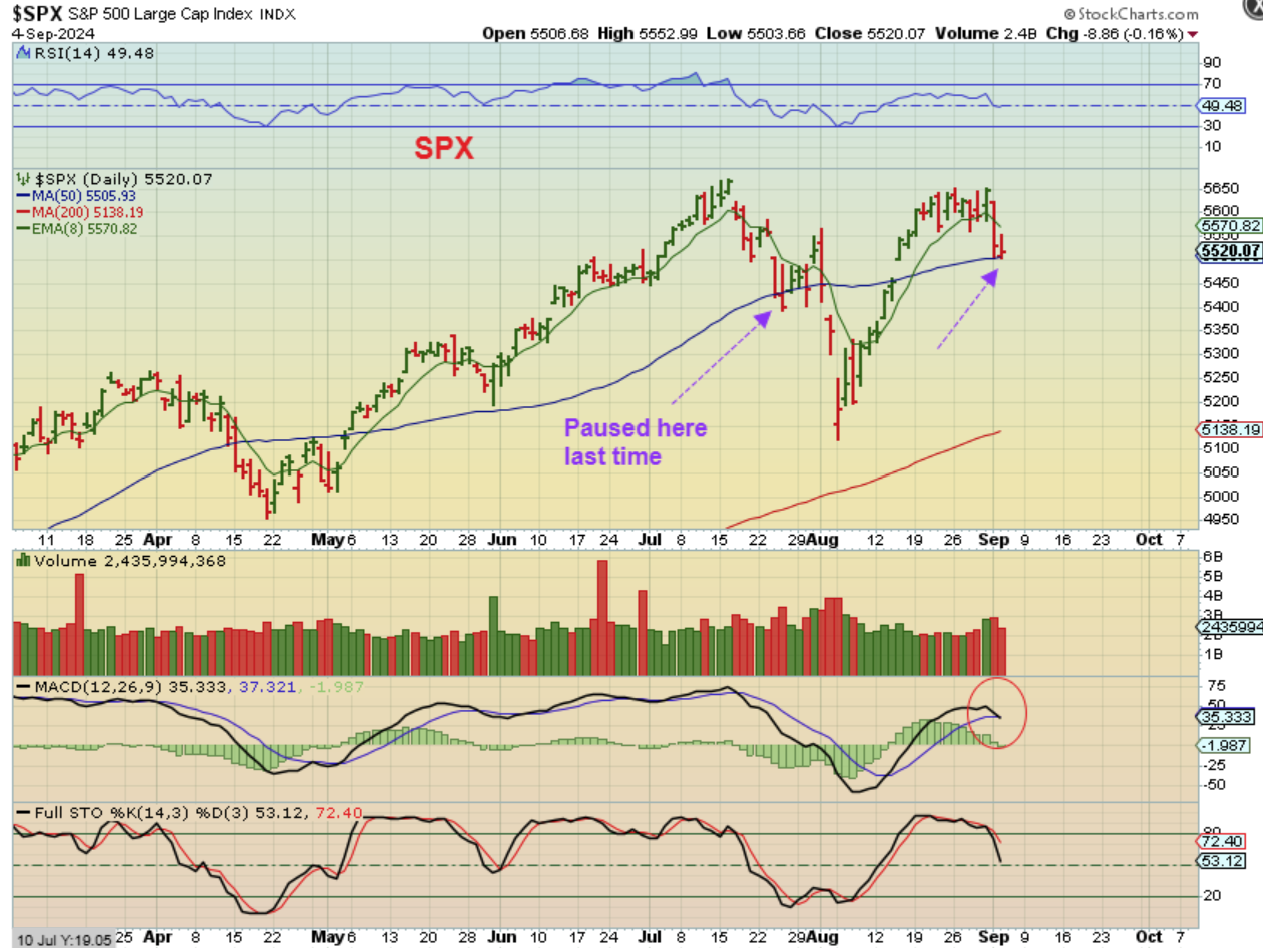
SPX – We saw that crash day on Tuesday and a pause at support here on Wednesday. Will it hold? I doubt it will hold for long, but that selling did ‘pause’ for a few days in July…
.
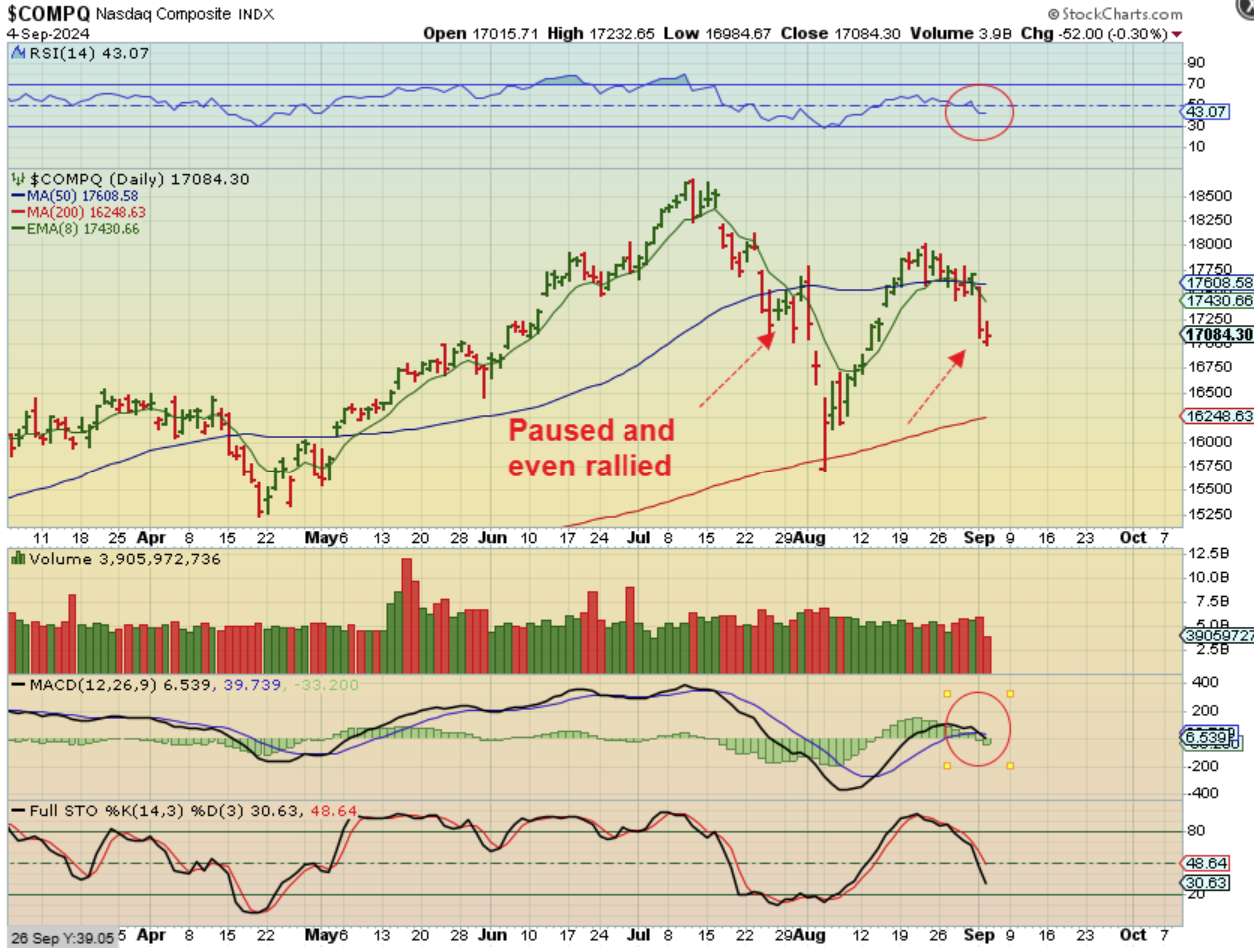
THE NASDAQ lost the 50sma with a large down day on Tuesday. Notice the circled areas on the charts, I think that we will continue lower after a pause. Notice that in July, that ‘pause’ was a 5 day run up to back test the 50sma, but I can’t say for sure whether or not this pause will last that long.
.
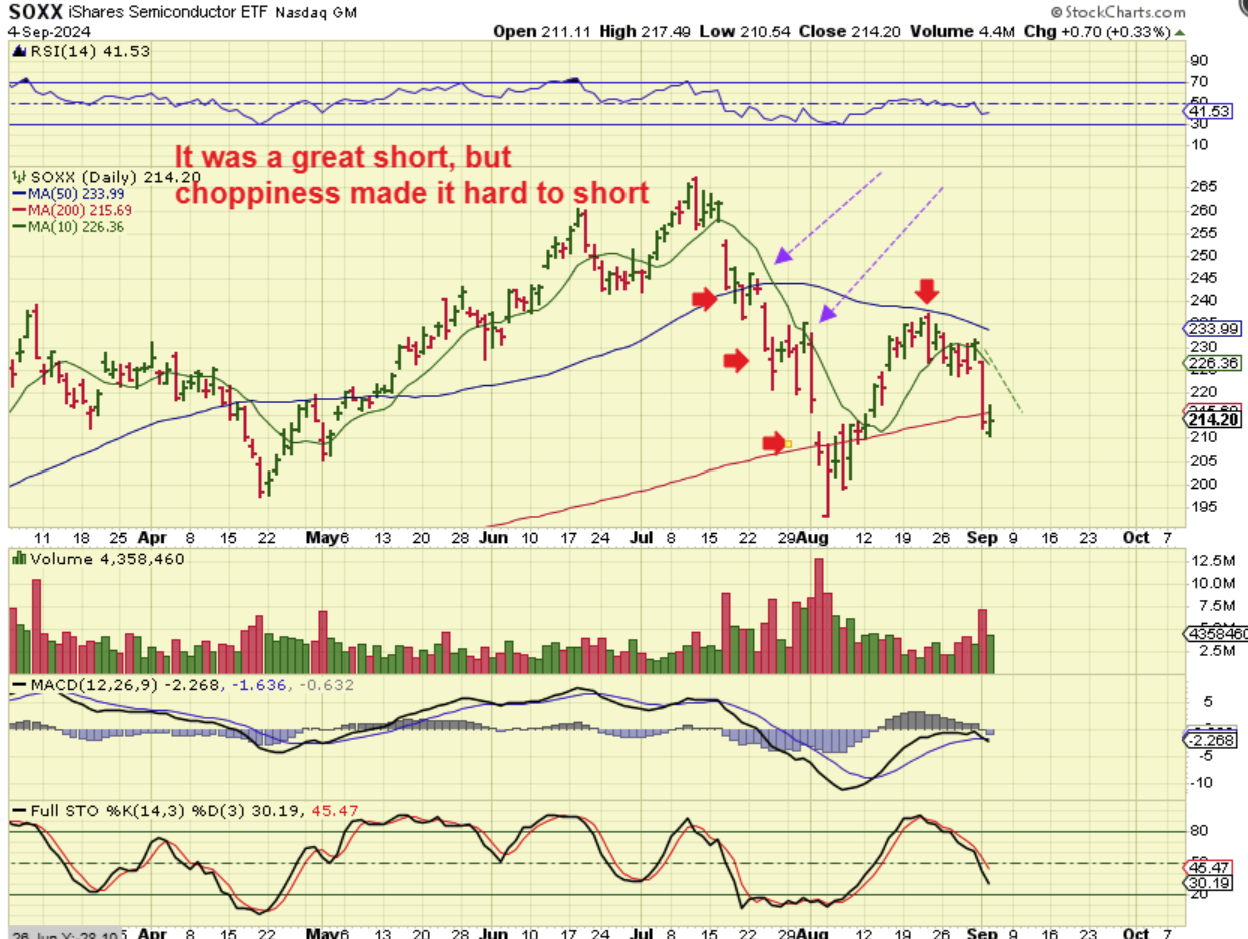
We all know that The SOXX has been the weakest of the indexes, and it is now under the 200sma again. On the last drop in July & August, you can see that it bounced to the green 10sma and then sold off again. It MIGHT do that again, so if you are thinking of shorting, that could be an entry point. DATA could send it lower before it gets there too, though.
.
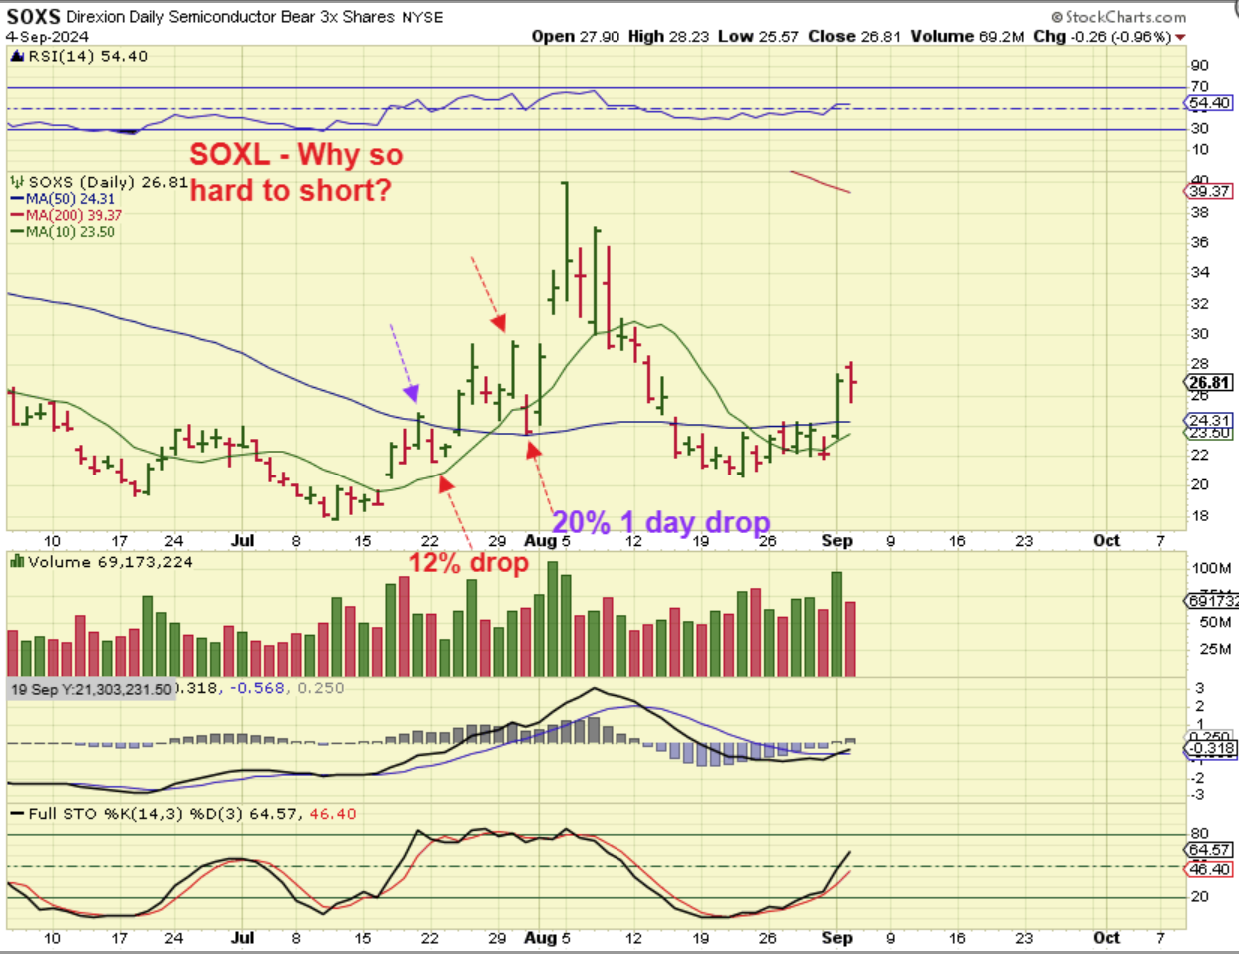
I wanted to show you how difficult shorting this market can be, using The SOXL:
On this chart I have pointed out what might look like very bullish pops for the ‘short’ ETF, but the next day saw a 12 or 20% drop. I tried to short the July drop/selloff, but I could only get a couple of day-trades out of it, scalps, even though I expected it to drop.
.
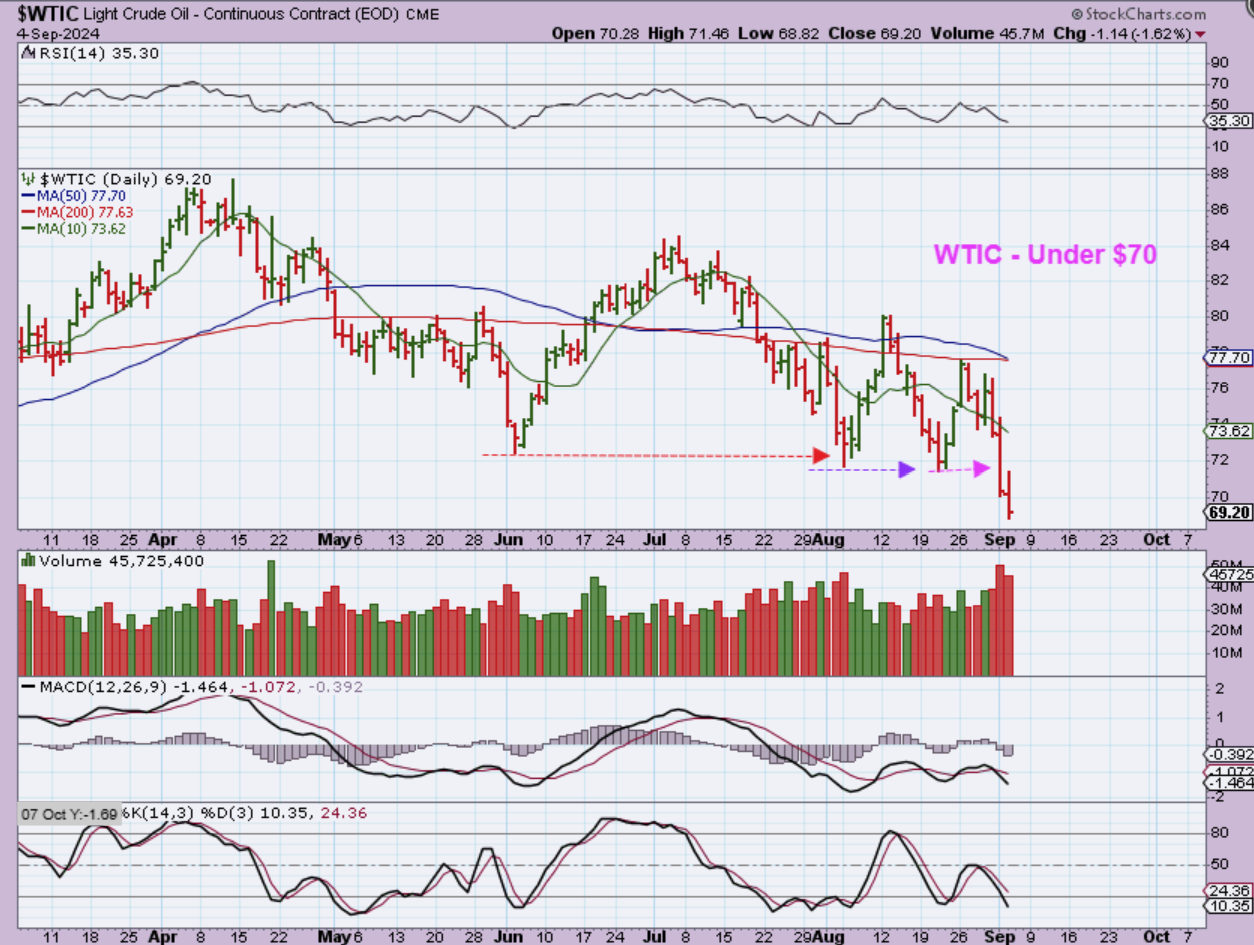
Yesterday I said this: OPEC and LIBYA announce that they will be increasing Oil output. More Oil on the market would drop the prices, and that certainly did happen Tuesday!
.
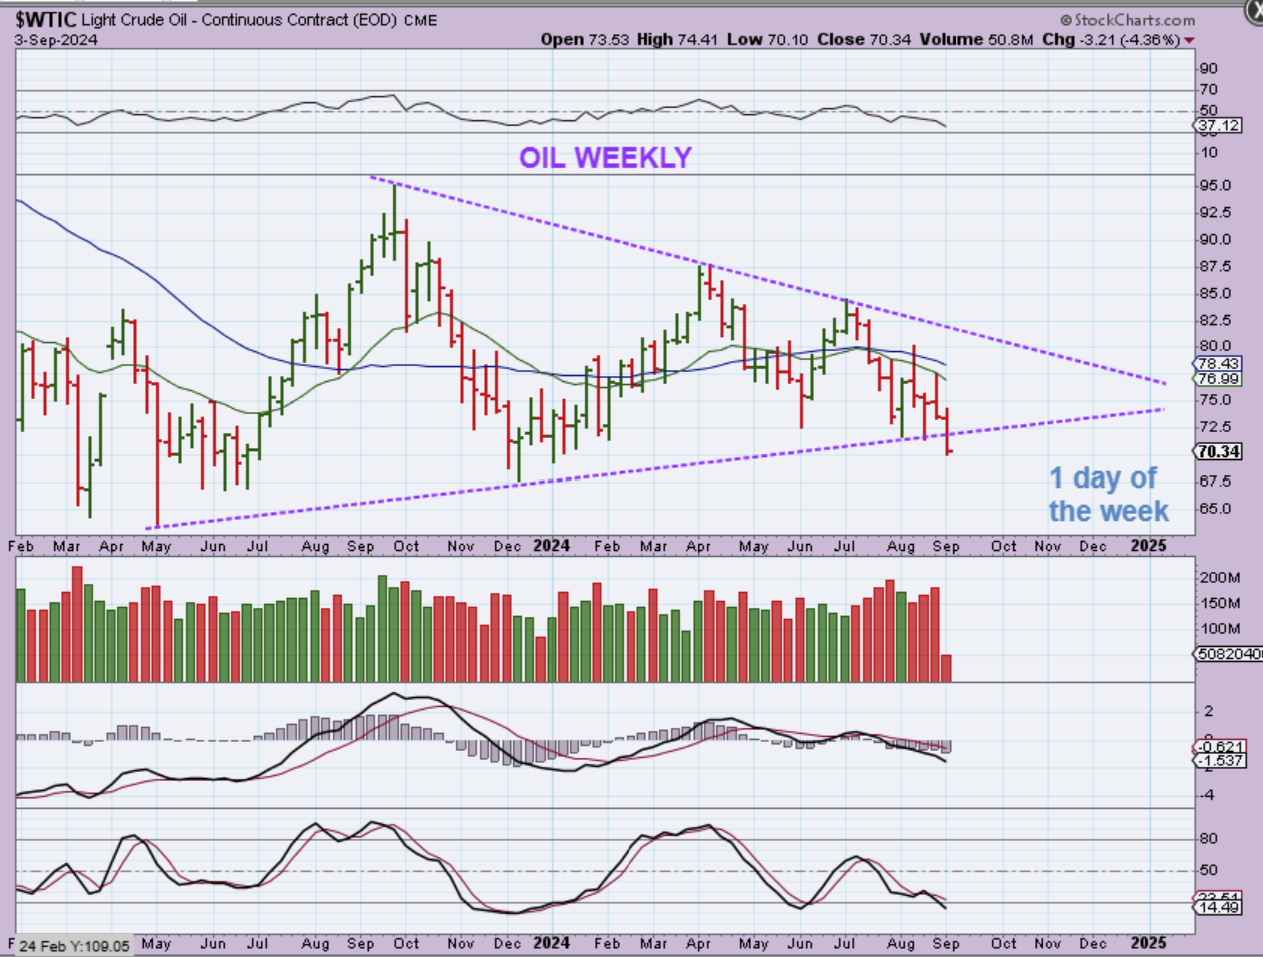
YESTERDAY I SHOWED THIS WEEKLY BREAK DOWN: and I mentioned…
.
When I switch to the WTIC WEEKLY CHART, we see that triangle that I’ve been pointing out now breaking down. The selling is taking place across all sectors.
.
WTIC: It was mentioned that this may be a false breakdown, but with Opec increasing Oil output? Well, now we see that oil sold down even further. At this point, that weekly break down is even deeper. Oil can continue to drop if Opec increases production.
.
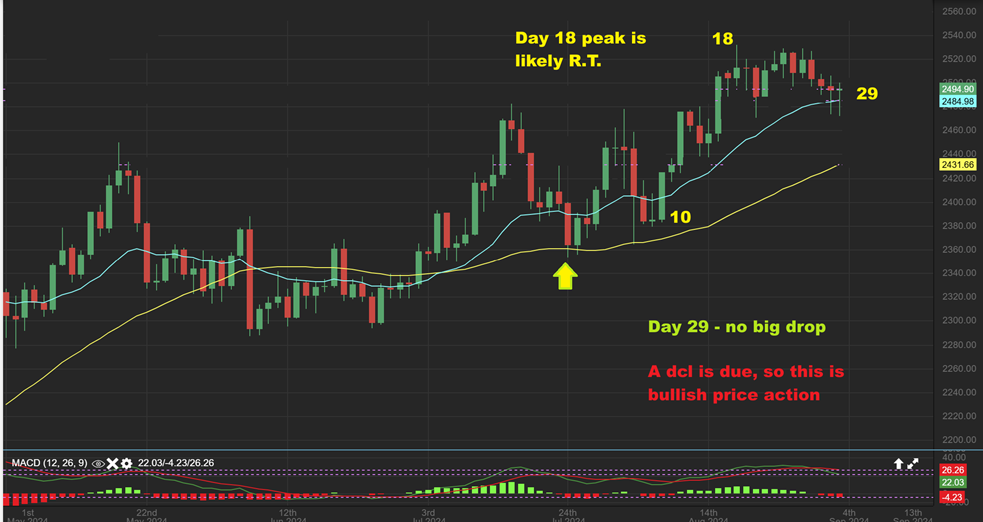
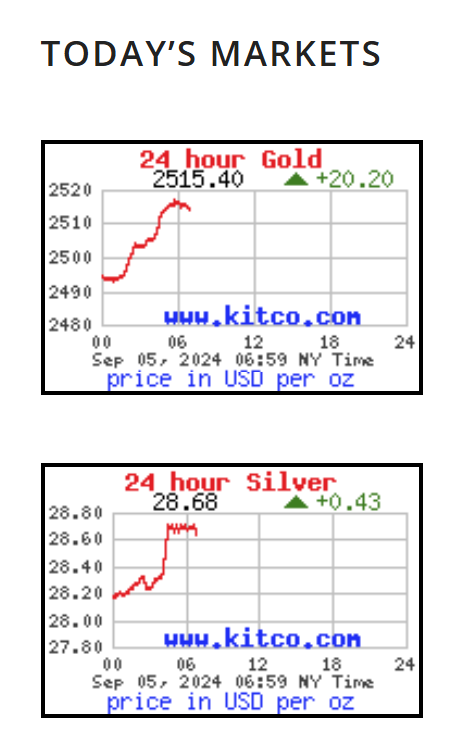
GOLD is impressive to me, especially with that market drop: We are on day 29, due for a dcl, and it is not really selling off. We see a day 18 peak, so it is also likely a R.T. Daily cycle. It also is still up at the 20 ema, so it is holding up well. Gold remains bullish and can still make another run higher with the 3rd daily cycle.
.
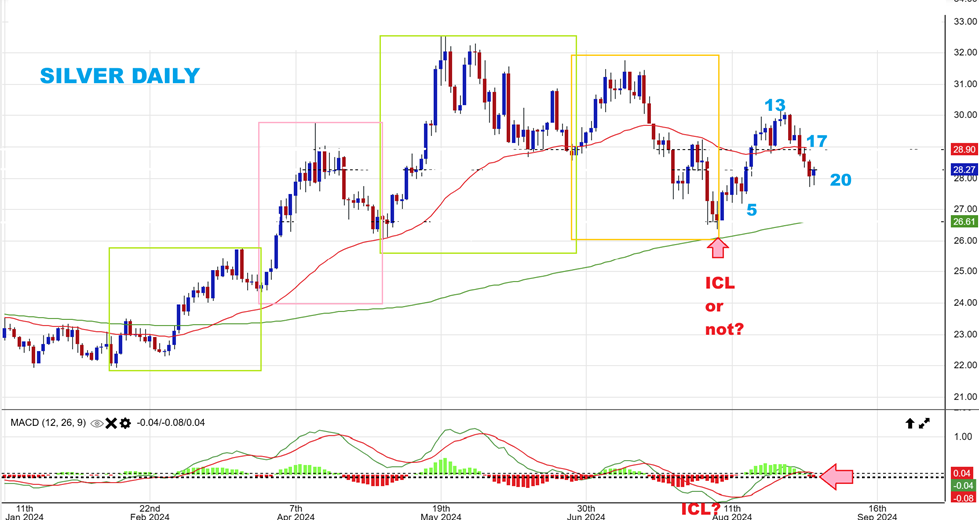
SILVER SPOT is on day 20 (my chart yesterday didn’t include holidays, but Spot does). Silver now has 2 day in a row with ‘wicks’ below the candles and that is often a rejection of lower price, so Silver may be trying to bottom here as a half cycle low or an a-b-c down into the next dcl (As though an ICL is in place).
.
YESTERDAY I SAID:
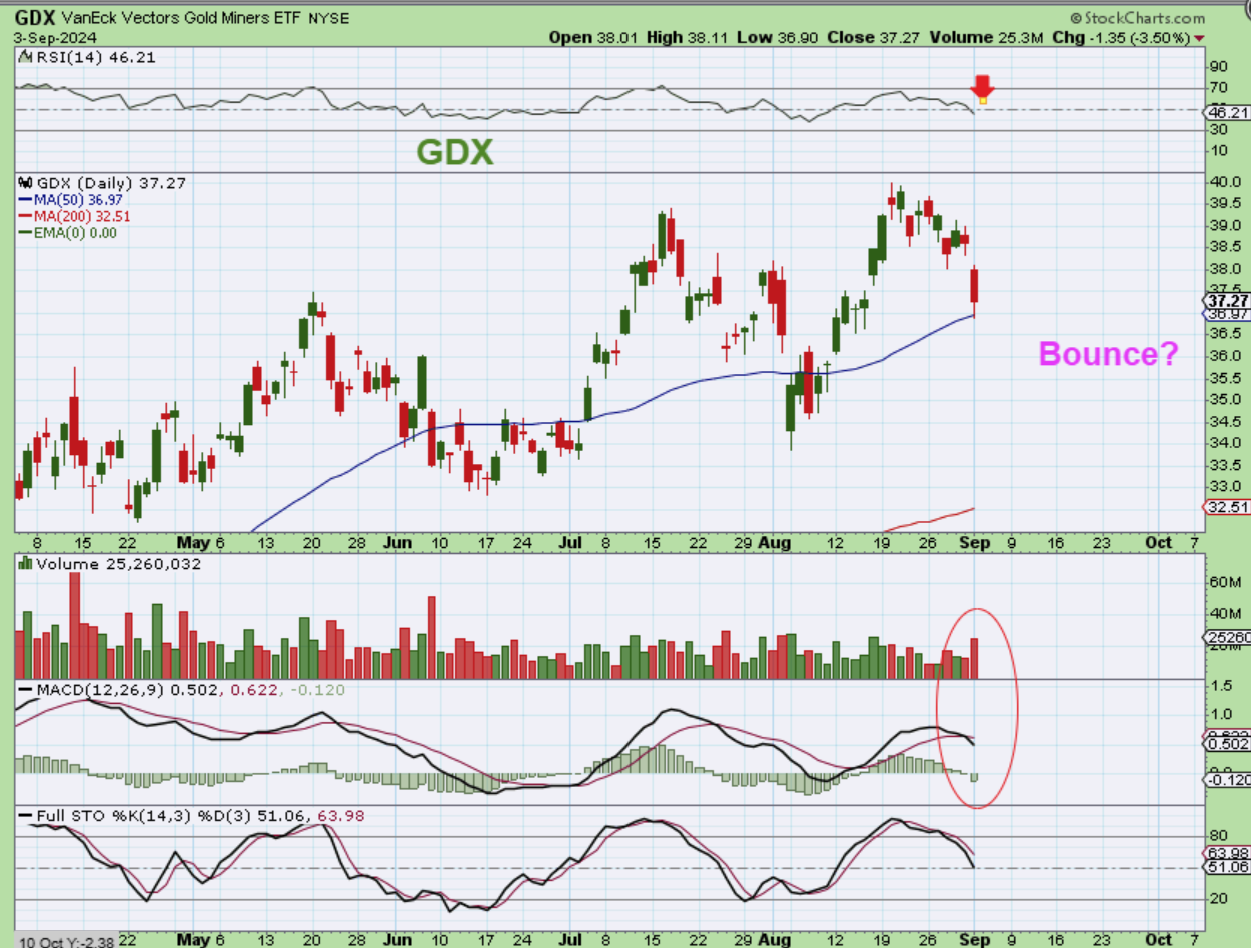
GDX dropped to the 50sma and bounced a little on Tuesday, so could it take off higher? Well, maybe with a bounce, but I have to be honest here. I see Divergence on the MACD at new highs, and now we see that MACD crossing down?
.
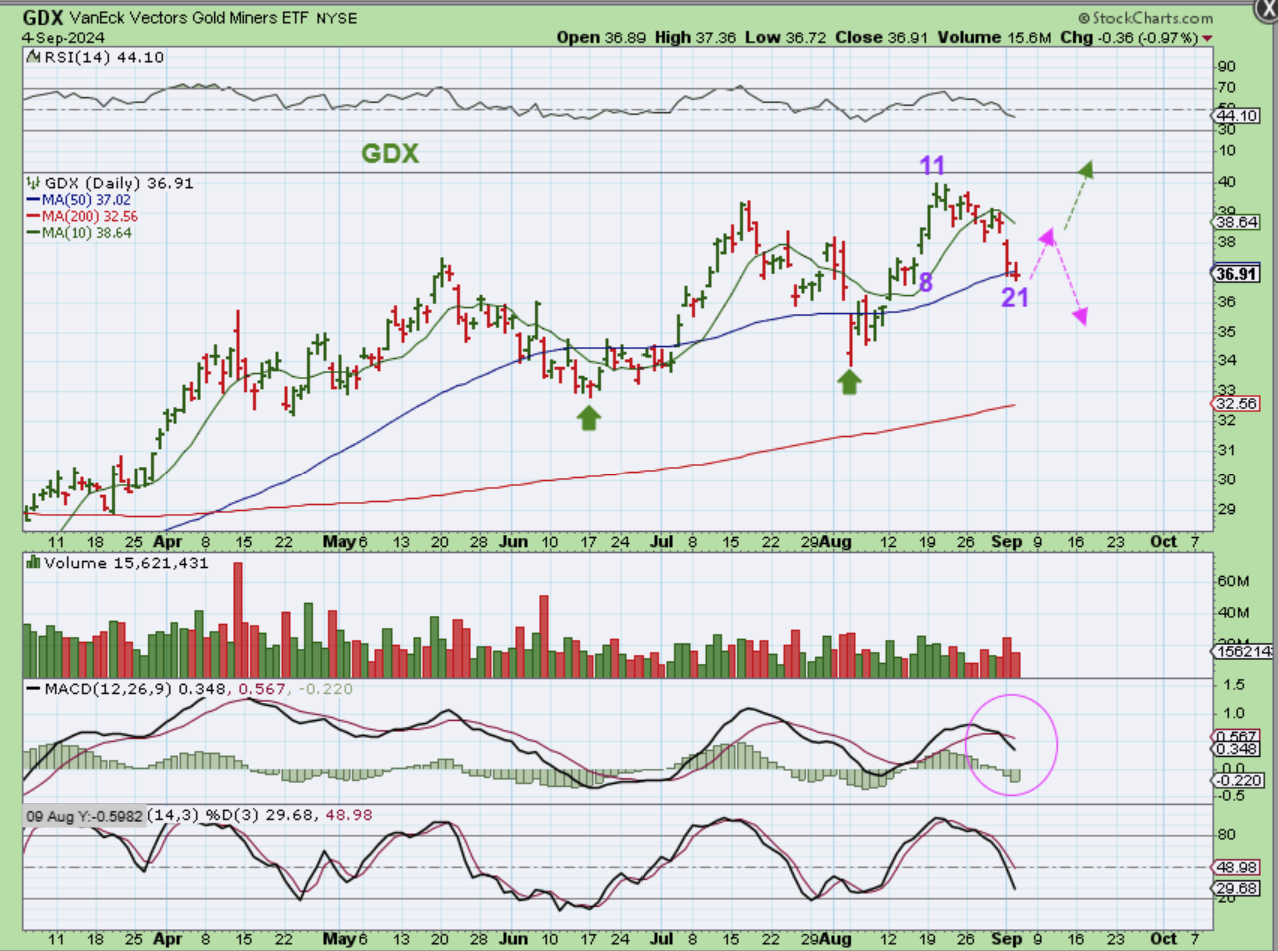
GDX did also see a pause in the selling and held at that 50sma again, so it may bounce and then dip into a dcl. It MIGHT put in an early dcl here, but I tend to doubt that, unless Gold were to rally from here. We could see an a-b-c style drop, as drawn here.
.
So we don’t have a lot of change here, but we did get a ‘pause’ in the selling that took place on Tuesday. As seen in the charts, that ‘pause’ lasted for a couple of days in July, but we do have data to be released at 8:30 a.m., so we’ll see how the futures look at that time. We could bounce from here if the selling isnt triggered by some bad data. Enjoy your Thursday trading, Bitcoin is below.
.
GOLD & SILVER 7 a.m. – Thist was a bit of a surprise pop overnight. We’ll see if it can hold up after the 8:30 data.
.
~ALEX
.
FROM WEDNESDAYS REPORT AS A REVIEW:
.
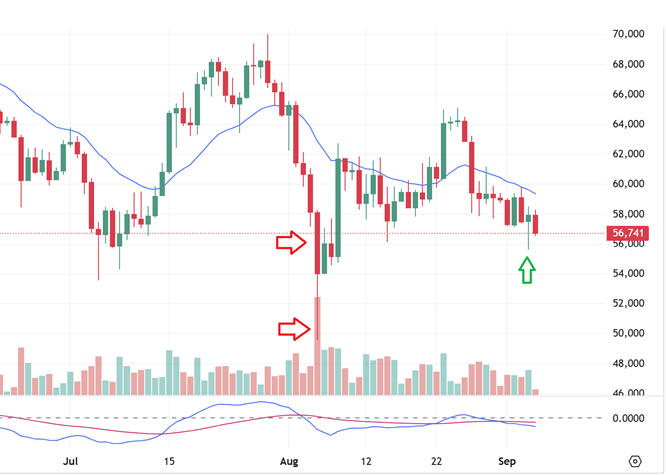
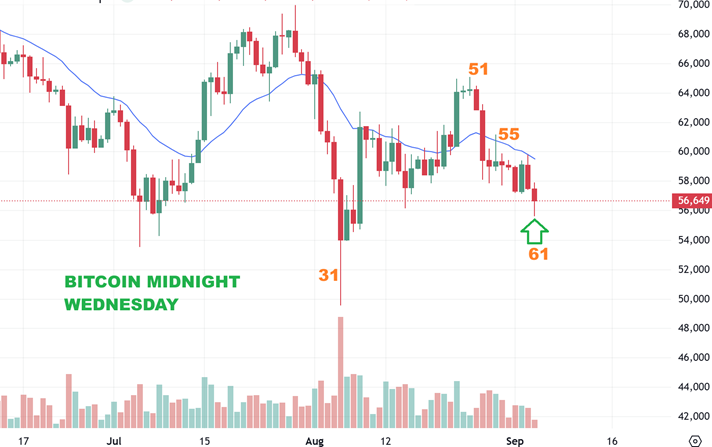
BITCOIN – Notice the rejection right at the 20 ema blue line. That is what I’m using as a guide but now look where we are cycle timing wise. We have arrived at Day 61. This is Bitcoin at midnight Tuesday into Wednesday, and we do have a reversal at the day 61 low. The ETFS are below…
.
.
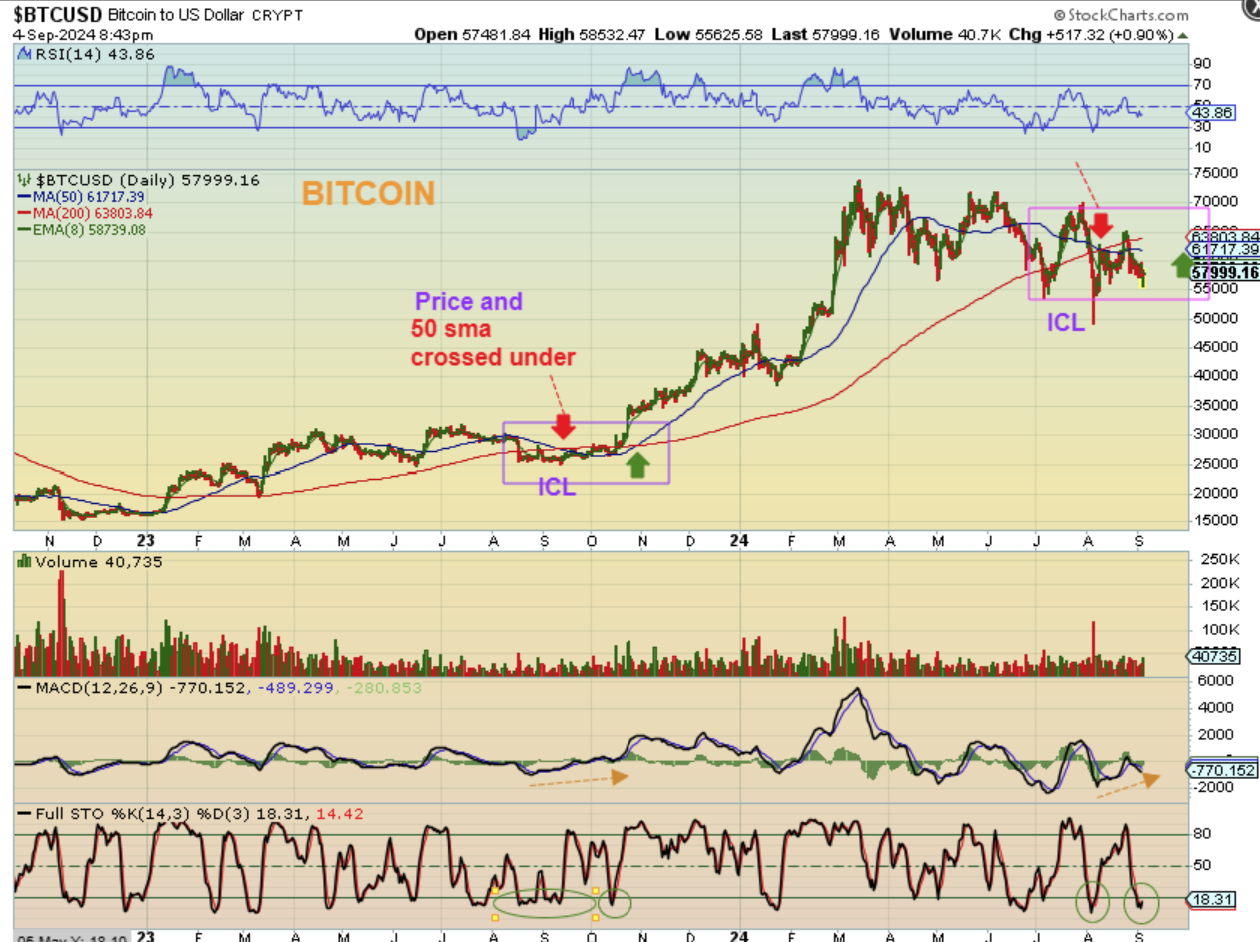
BITCOIN – I wanted to show how choppy it was in that purple box at the ICL lows. At that time an ICL was forming after a lot of sideways chop, and notice that
1. The blue 50sma had turned below the 200sma. We have that situation now too.
2. Then Price chopped at the lows and suddenly rallied strongly for months and turned that 50 back over the red 200sma and a major rally took place.
3. Interestingly, that strong rally occurred in October through March, but it bottomed out in August and September.
.
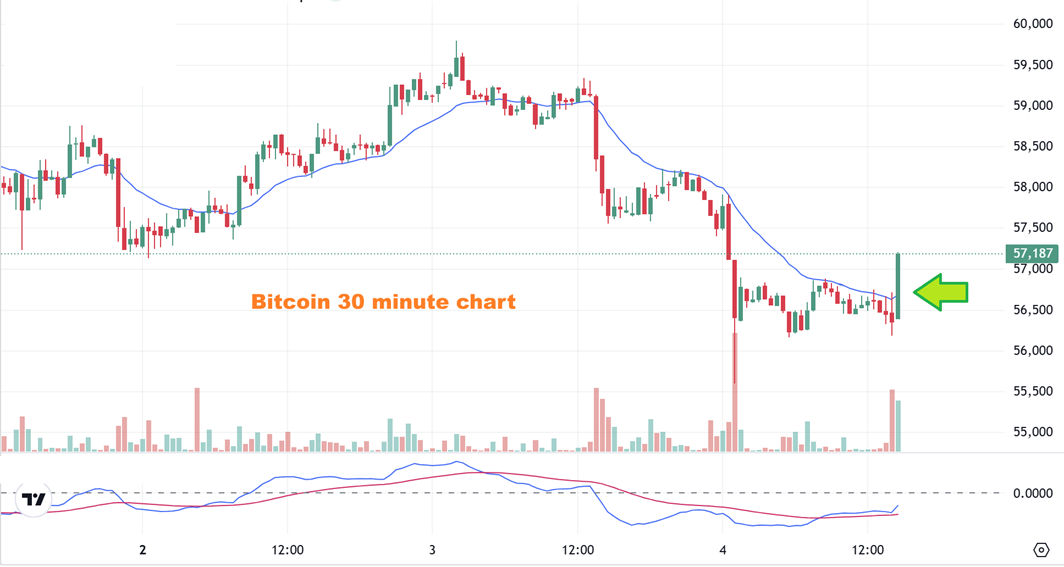
BITCOIN popped yesterday intraday, so I used that as a buy point only trading ETFs. I posted that in the commenting section.
.
BITCOIN found some follow through, and then put in a short-term toping candle, so we may see that choppy bottoming process that I pointed out above in the choppy lows at the bottom.
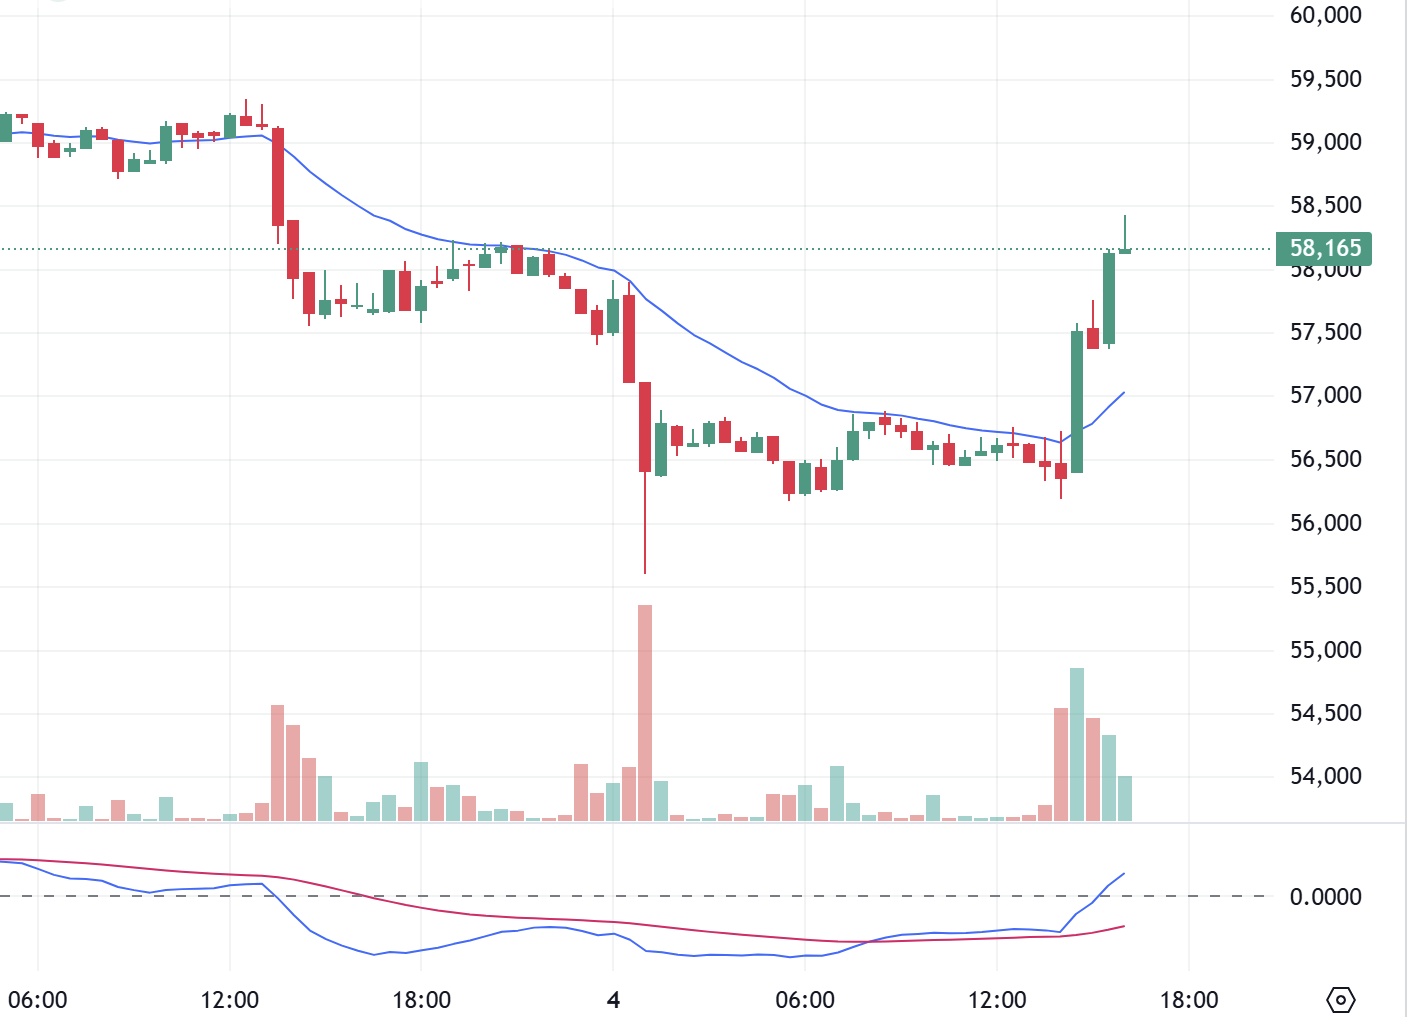
BITCOIN LIVE 7 a.m. – We’ll see if the reversal candle lows can hold up today, since price has dropped overnight, but that was perfect timing for a low to develop.