August 24th Weekend Report
Well, The Bullish Talk in The Fed Minutes and the Feds Speech at Jackson Hole does look like it received a warm welcome, and so far the set ups look like the slumbering Bull has returned to the General Markets. I am personally still being a little cautious and just using stops when it comes to the General Markets, and I’ll explain why. The Fed needs to cut because inflation is dropping and also because the economy could be slowing down too quickly. That idea could affect the General Markets. As for The Precious Metals, they have remained bullish as expected and Bitcoin is acting well too. We have a lot to cover, so let’s get to the charts!!…
.
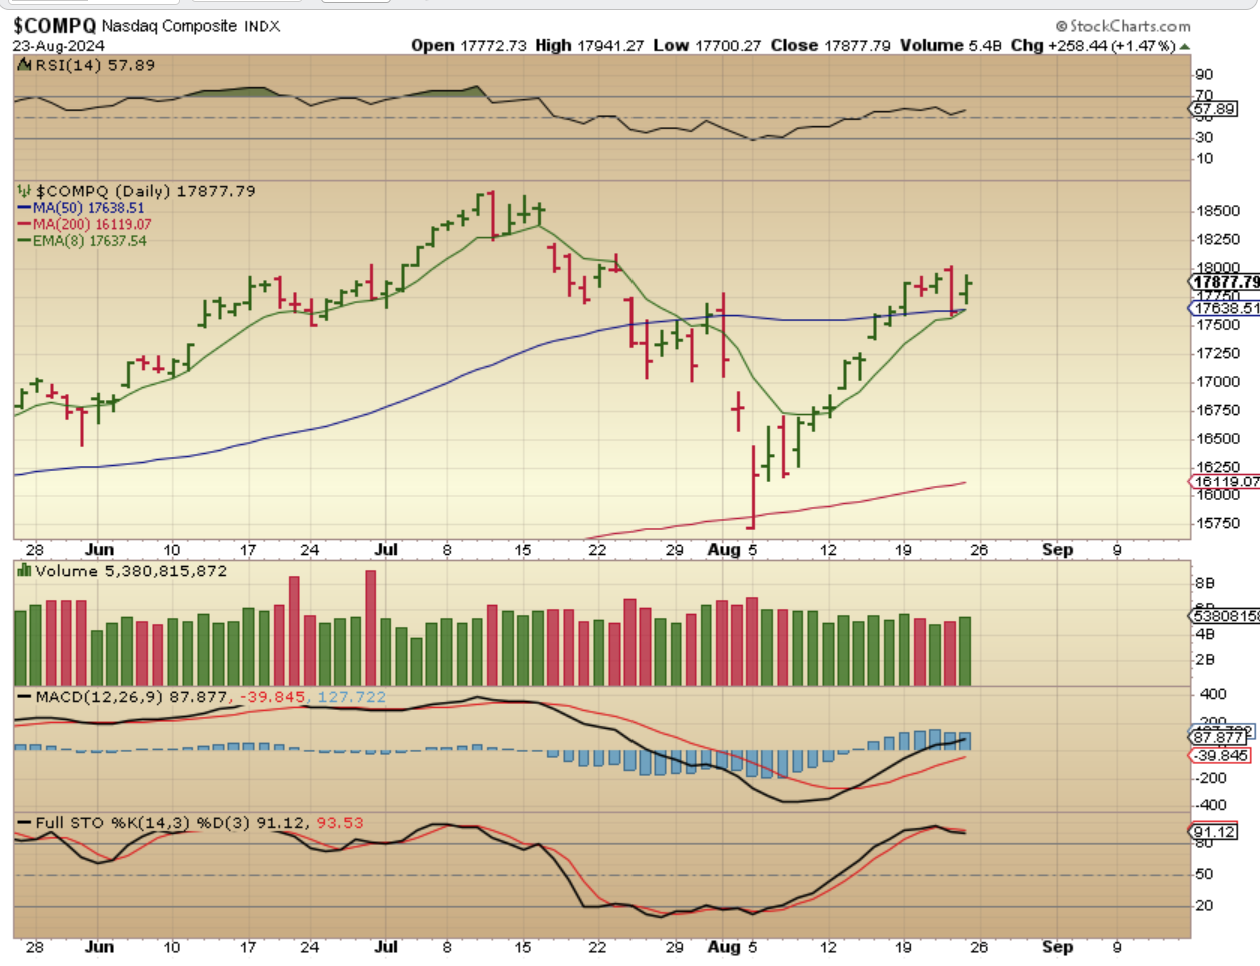
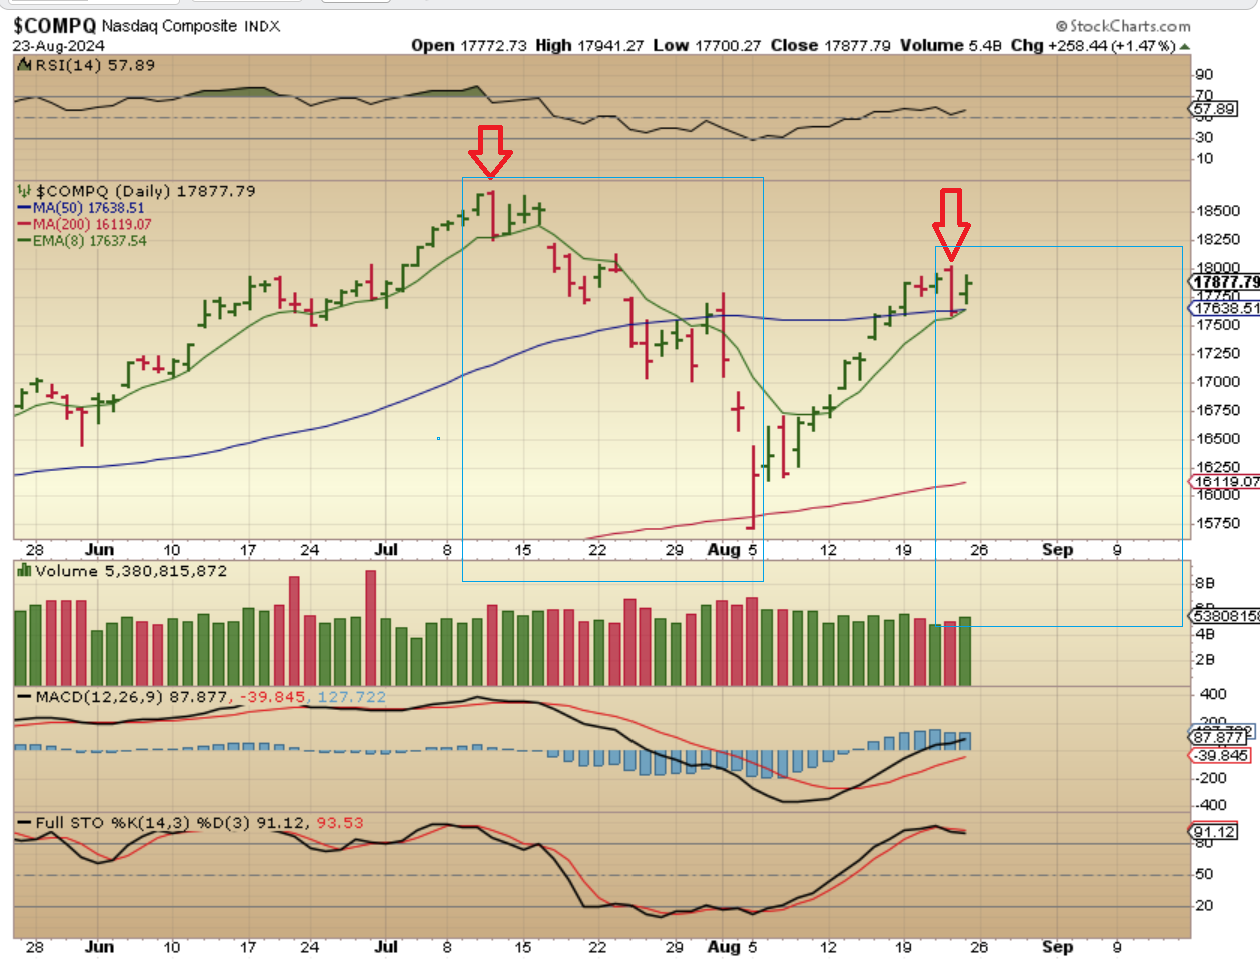
The NASDAQ slammed down on Thursday, and that was the day after the minutes and after the jobless claims report. What I DON’T like is that the markets gapped open HIGHER after both of those, but then it sold off all day. Now we have a Jackson hole reversal? So it looks bullish, but you can see why I would at least stay a little cautious, right?
.
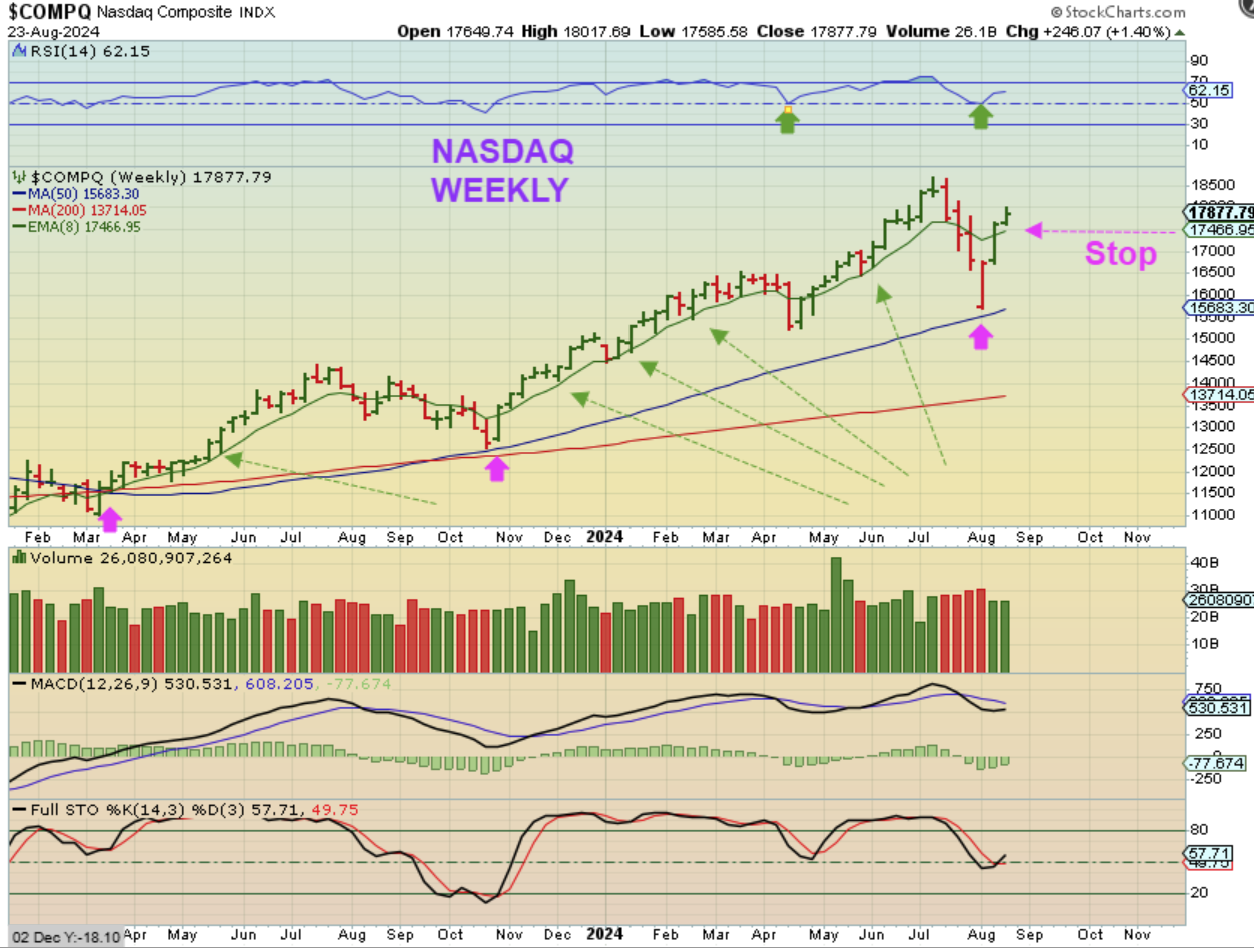
The Weekly NASDAQ chart ignores the Thursday selling and simply shows that week 3 from the reversal was green. You could now look at a weekly chart with the Green 8 ema and see that price often held above that in a bull run. You can put a stop there and we’ll see if this was just a rogue wave down/capitulation type low…or not.
.
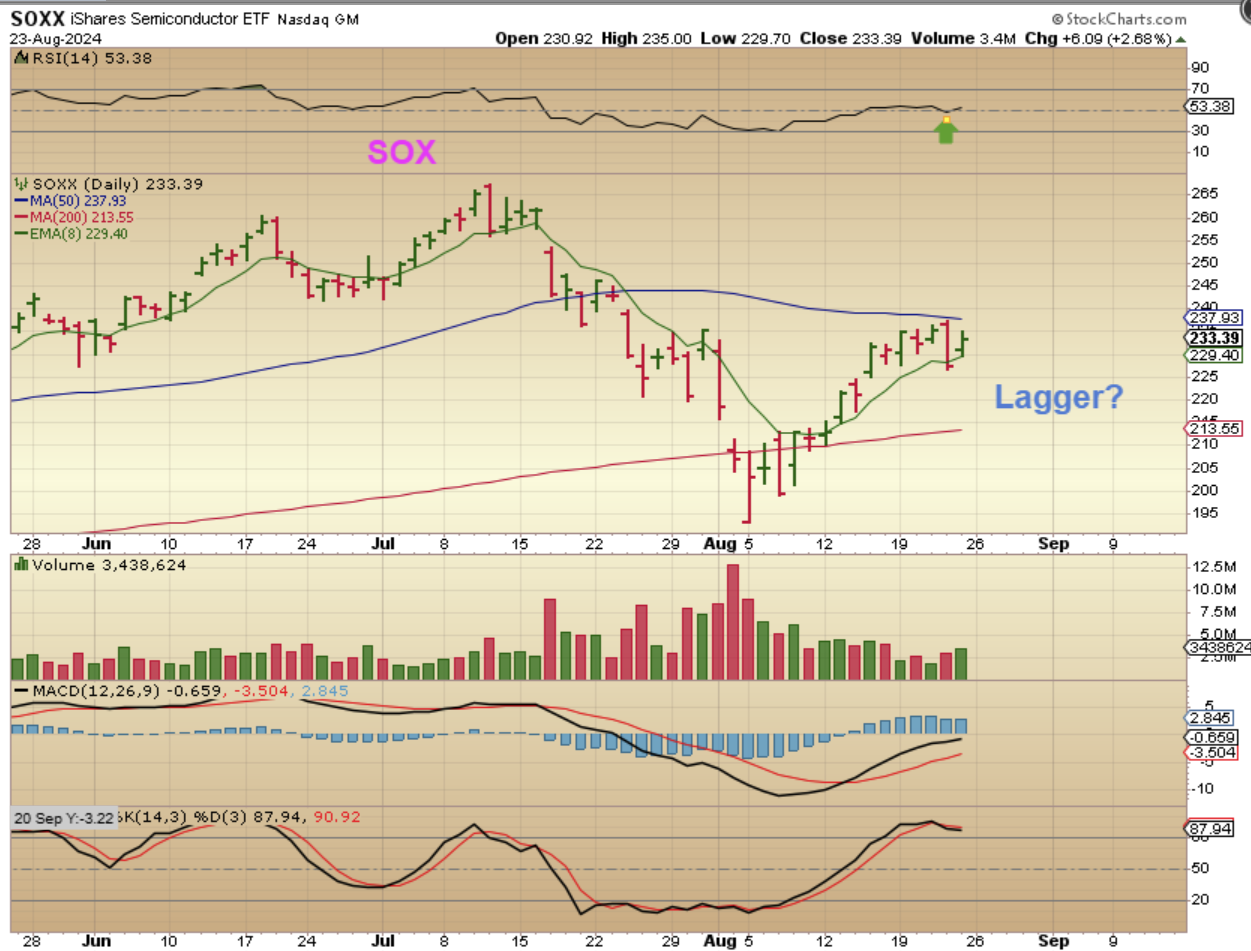
The SOXX Daily set up is the same, except that so far it couldn’t recover the 50sma. If this is just ‘lagging’, you could buy here and raise a stop when it does get above the 50sma, or have a stop under the 8 ema (or 10sma) in case it sells off.
.
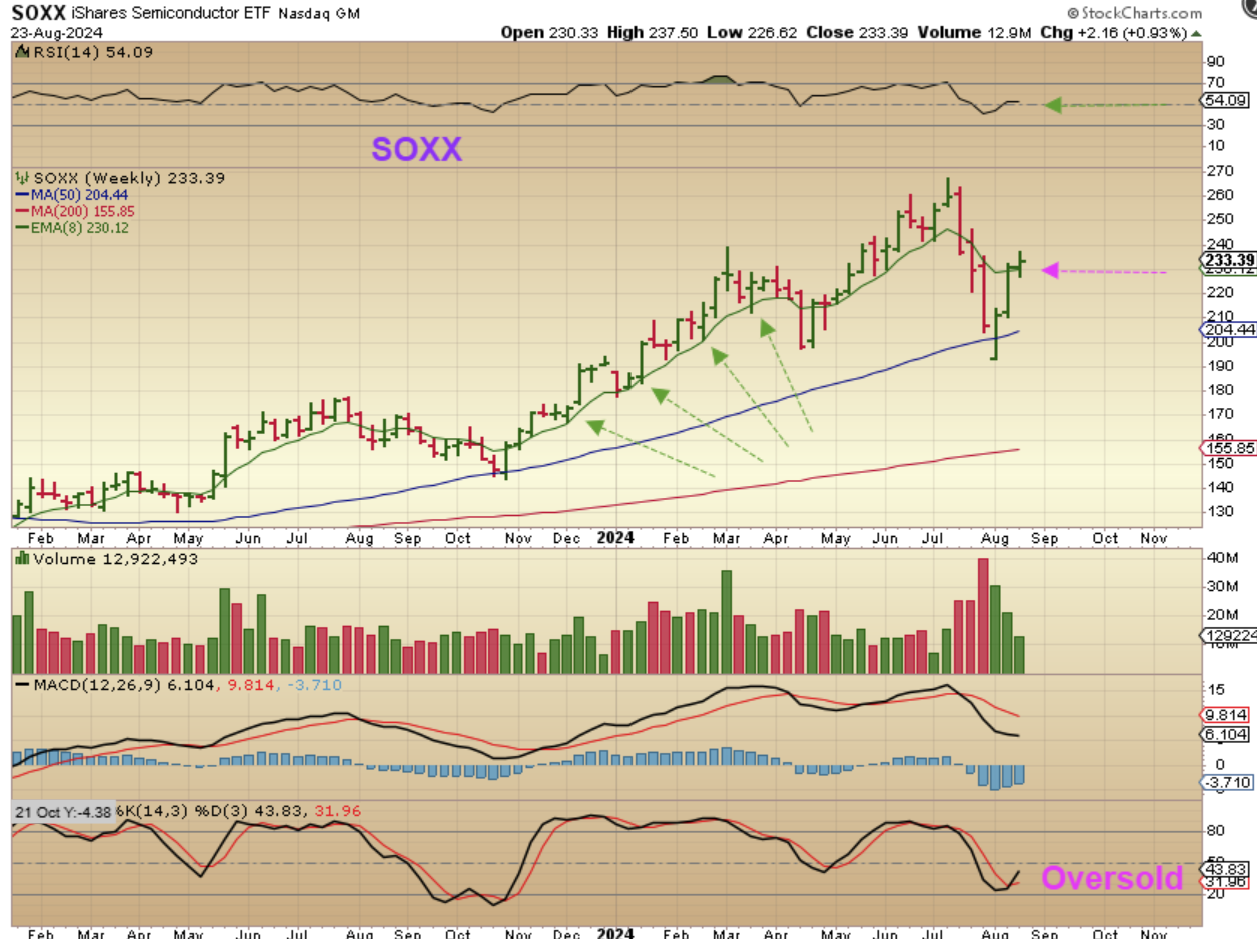
And this weekly set up for the SOXX is also similar to what we had with the Nasdaq. Price often climbed up along the 8ema or 10 sma, so a stop can be placed there.
.
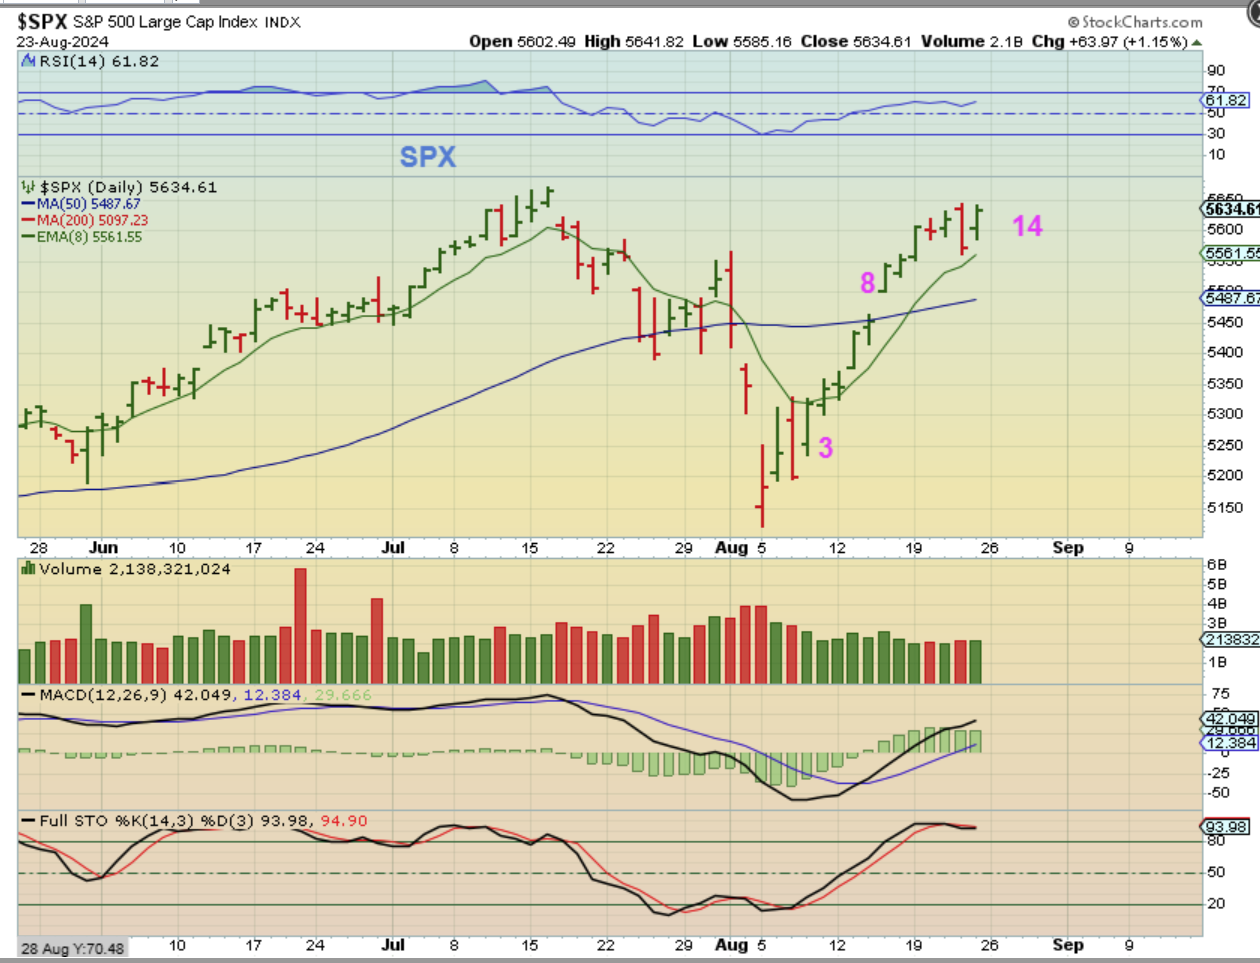
THE SPX has had a normal bullish run out of the lows, and this one almost made it to the former highs. So you might wonder, “The one day sell off has been reversed, “Why are you still cautious? Doesn’t that mean that the buyers are back in full force?”
.
“Why are you still cautious? Doesn’t that mean that the buyers are back in full force?” Well, do you see this? We’ve seen something very similar after a 1 day sharp sell off, but it still rolled over into a serious sell off, so stay cautious and Stay Frosty – and just use those stops.
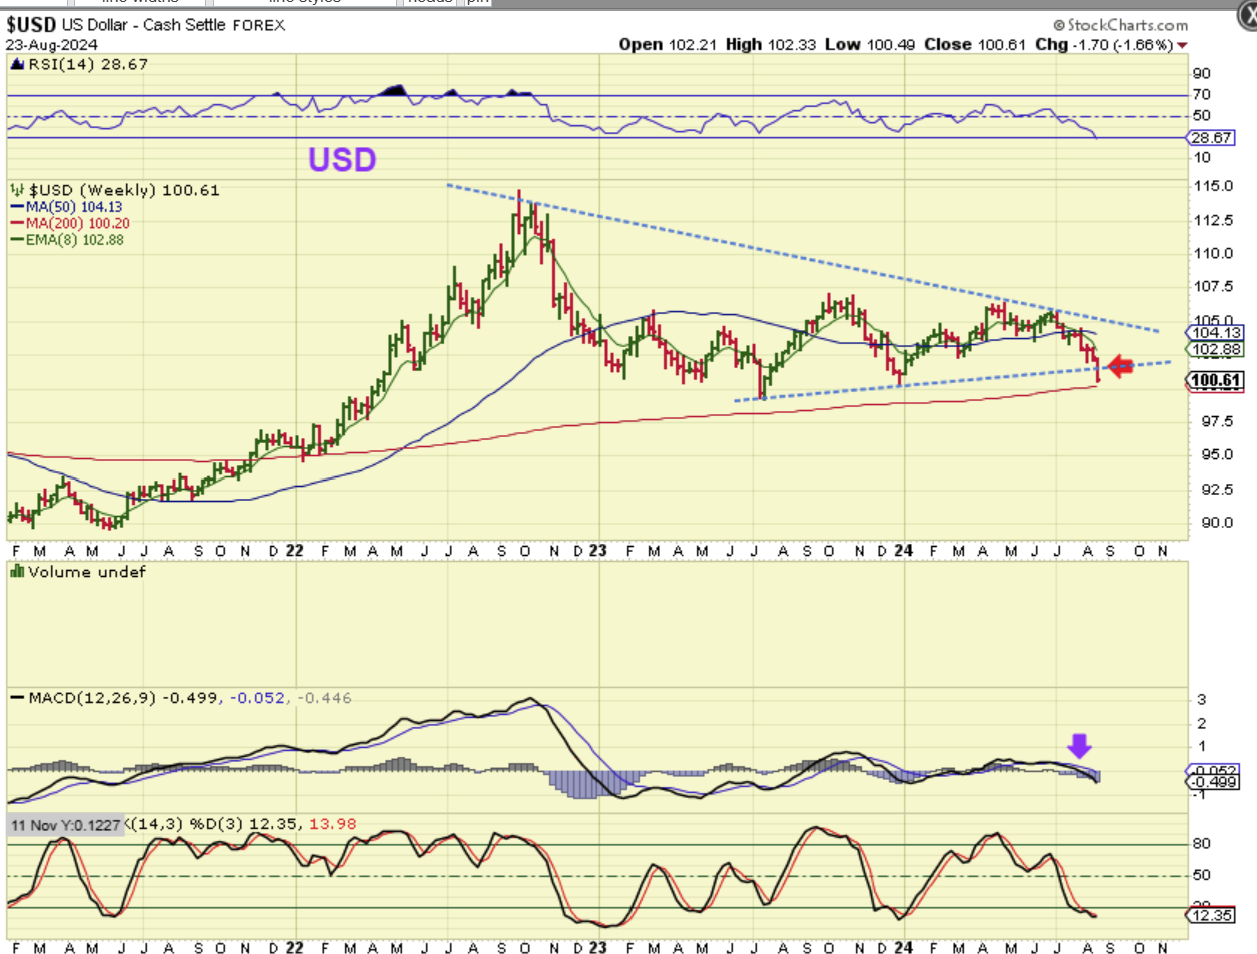
THE USD had a rough week as it sold off and broke down. It is due for a dcl, so we could get a false break down, but at this point it could just bounce higher and then roll over again, we’ll see.
.
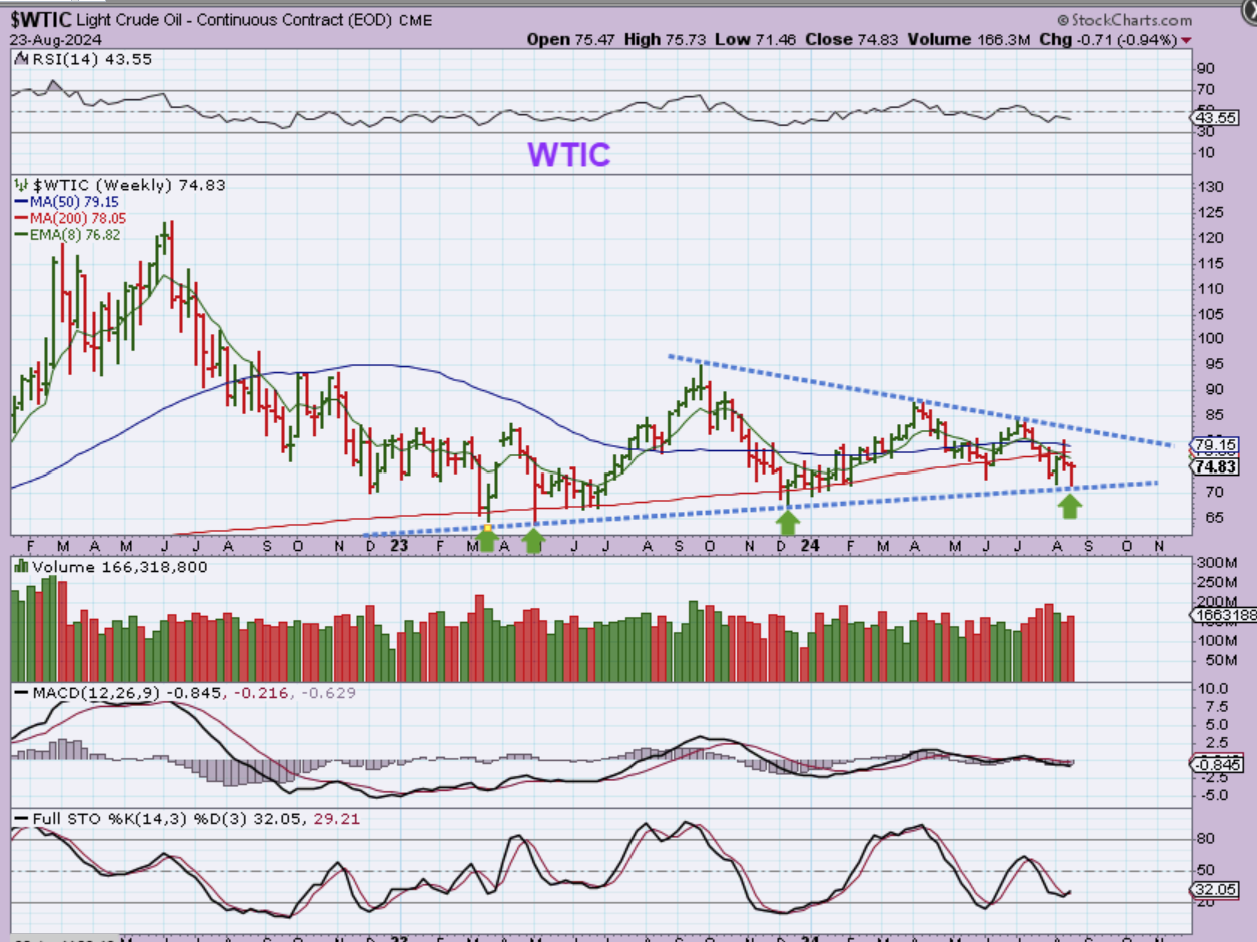
WTIC – Oil bounced right where it needed to, so we’ll watch this move higher to see if it can get through overhead resistance.
.
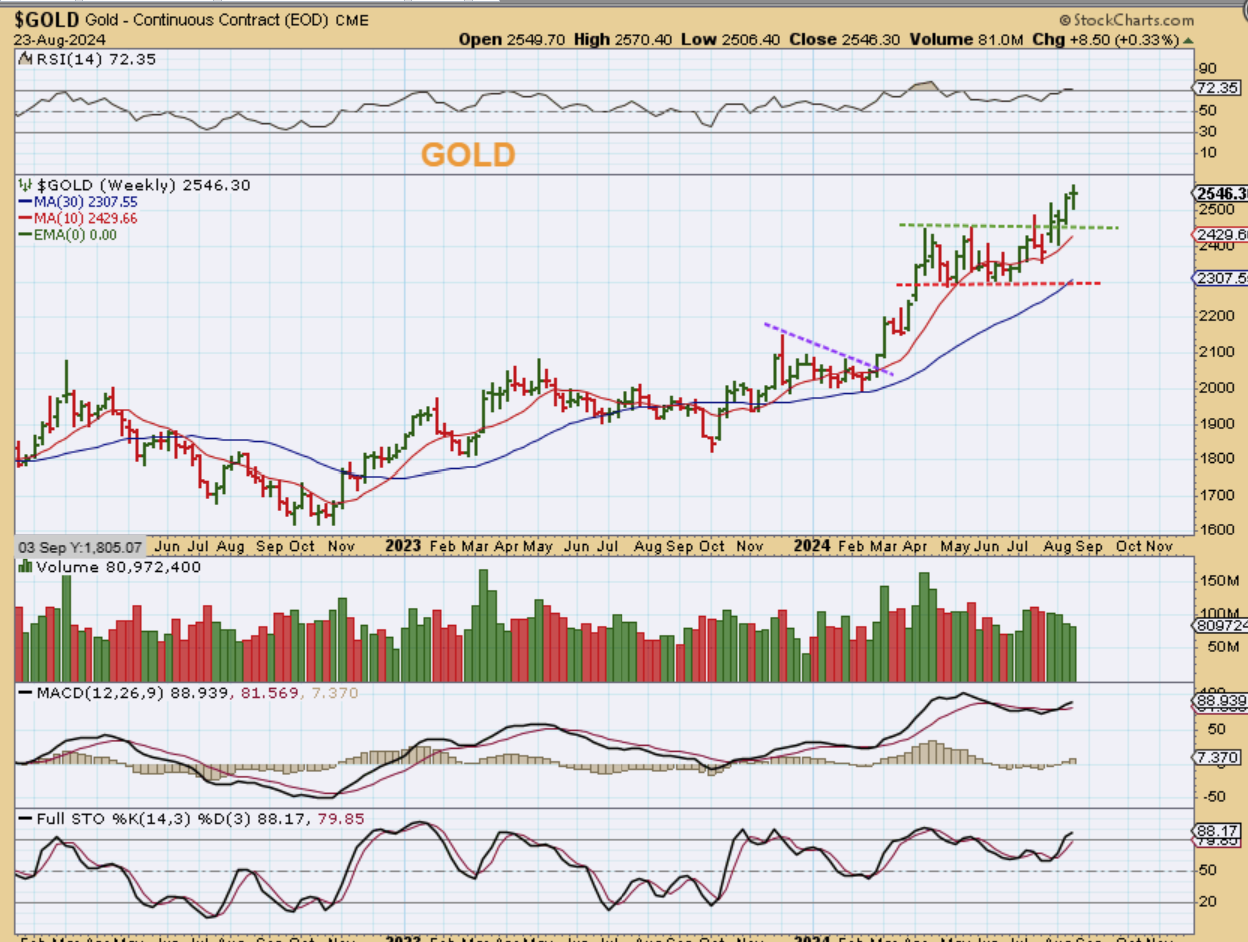
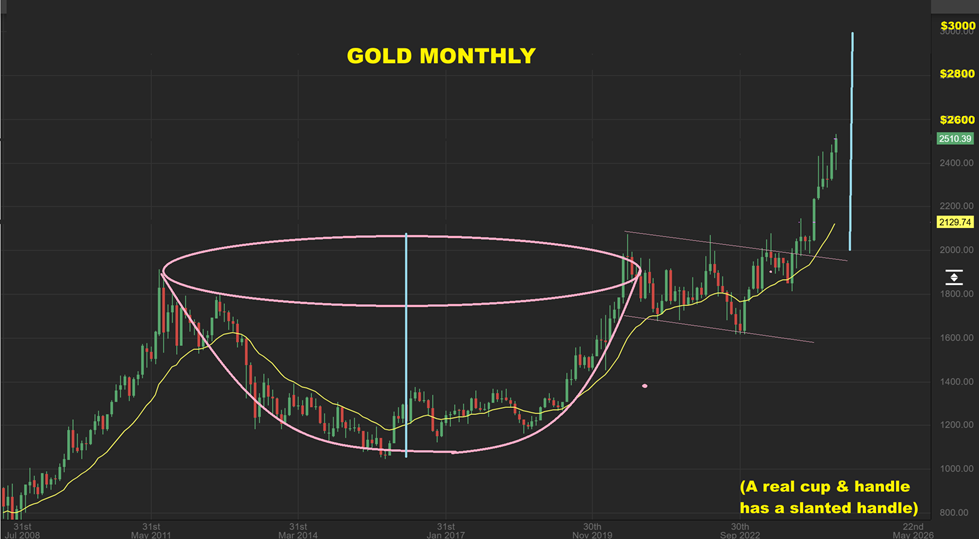
GOLD broke out 4 weeks ago and it has made some gains each week since then. That last red candle was the dcl, and this Geen section is the 2nd daily cycle. We have 4 green candles, but it has been choppy in real time, so as you can see, last week was only an $8 gain when all of the choppiness was done. This is also a doji candle and Gold is getting later in the daily cycle, so this may be the peak, or it could peak next week and then we drop into the next dcl. It may back test the breakout.
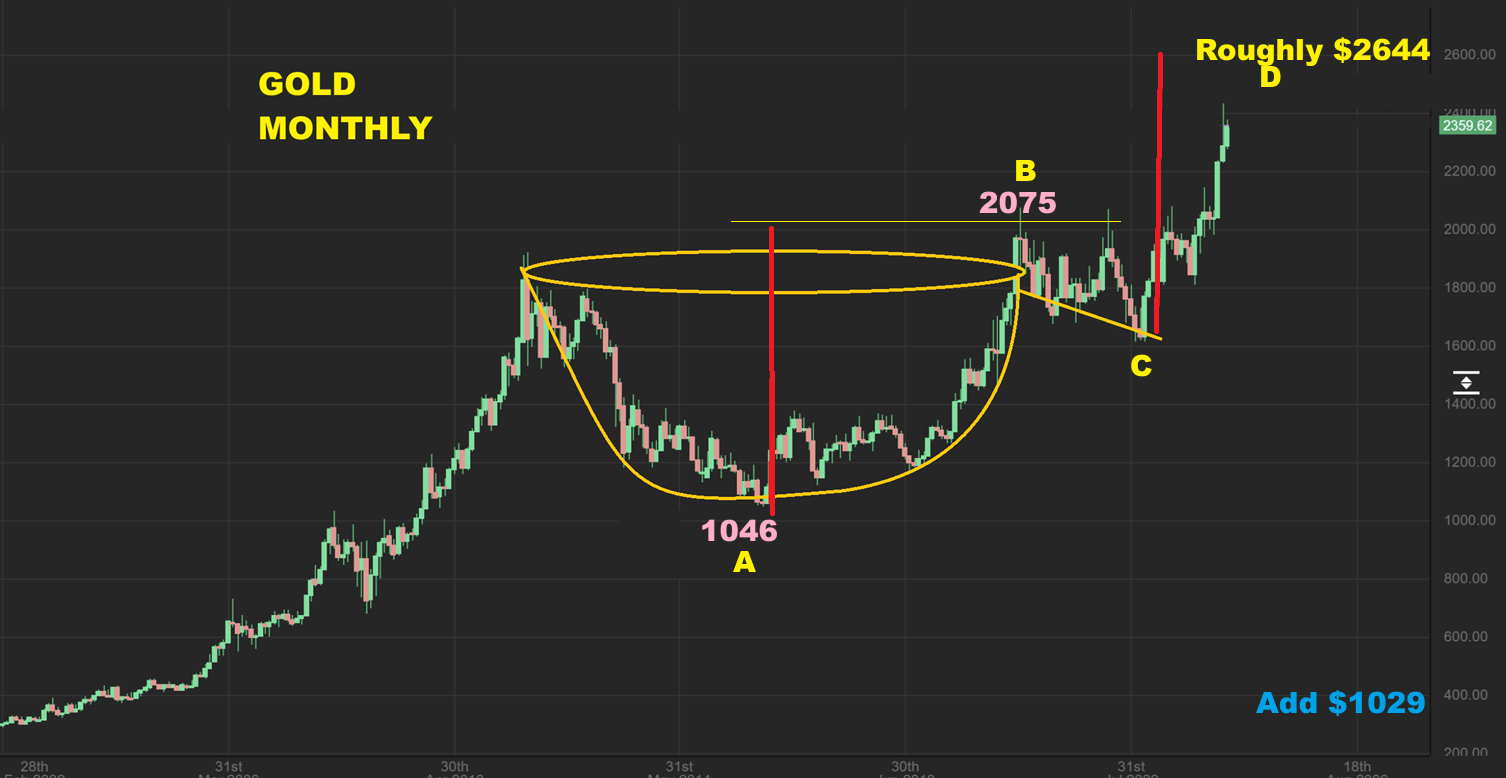
I DREW THIS IN MY MAY REPORT WHEN GOLD WAS AT $2359. I had a measured target of $2644 then, using the Cup & Handle measured move from the bottom of the handle. If Gold rallies next week and can reach this number and peak the 2nd daily cycle. We hit $2570 last week and that is less than $75 away.
.
In this Cup & Handle, I’m showing the measured move Starting from the top of the handle instead, and that could give us $3000.
.
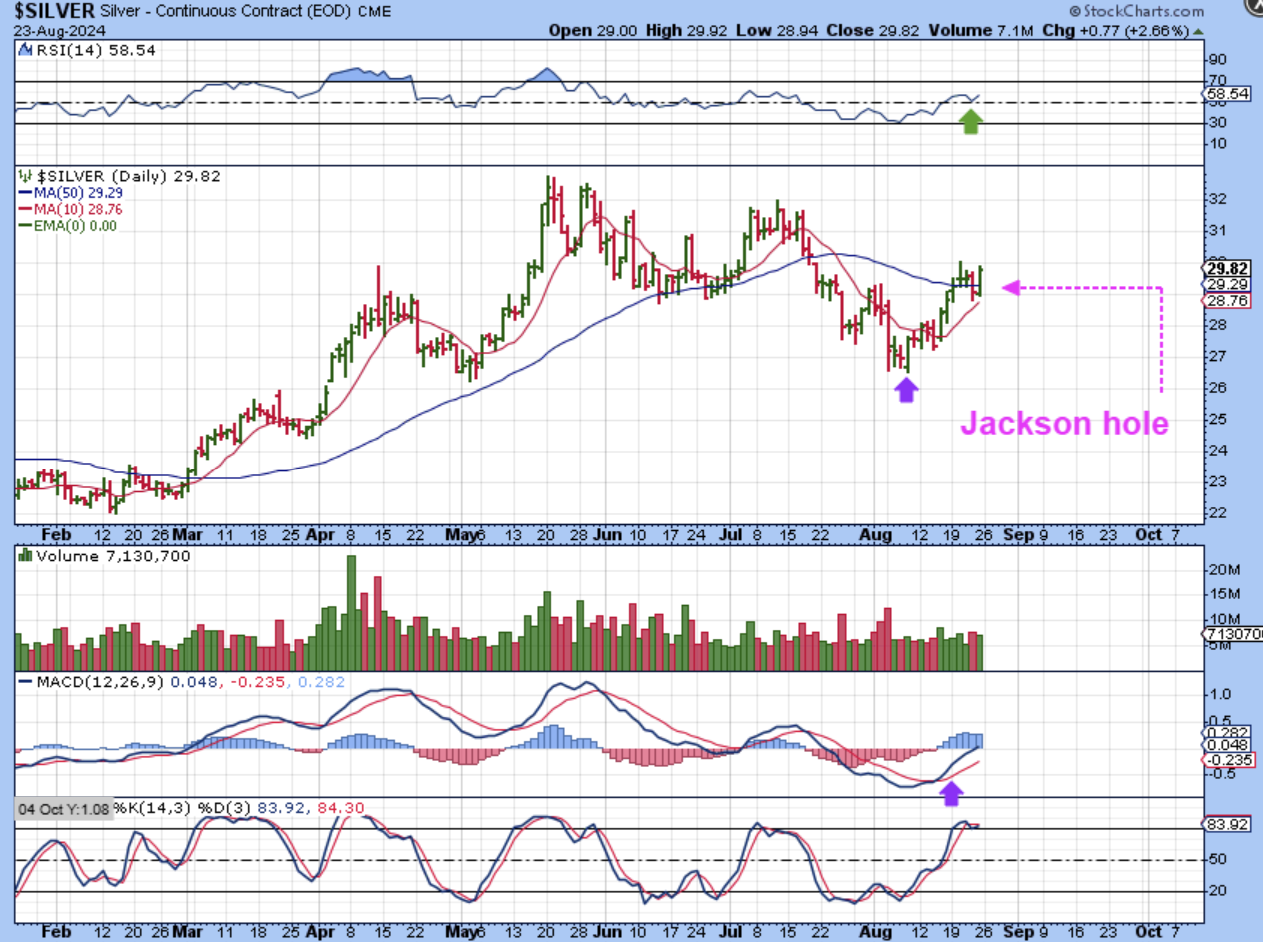
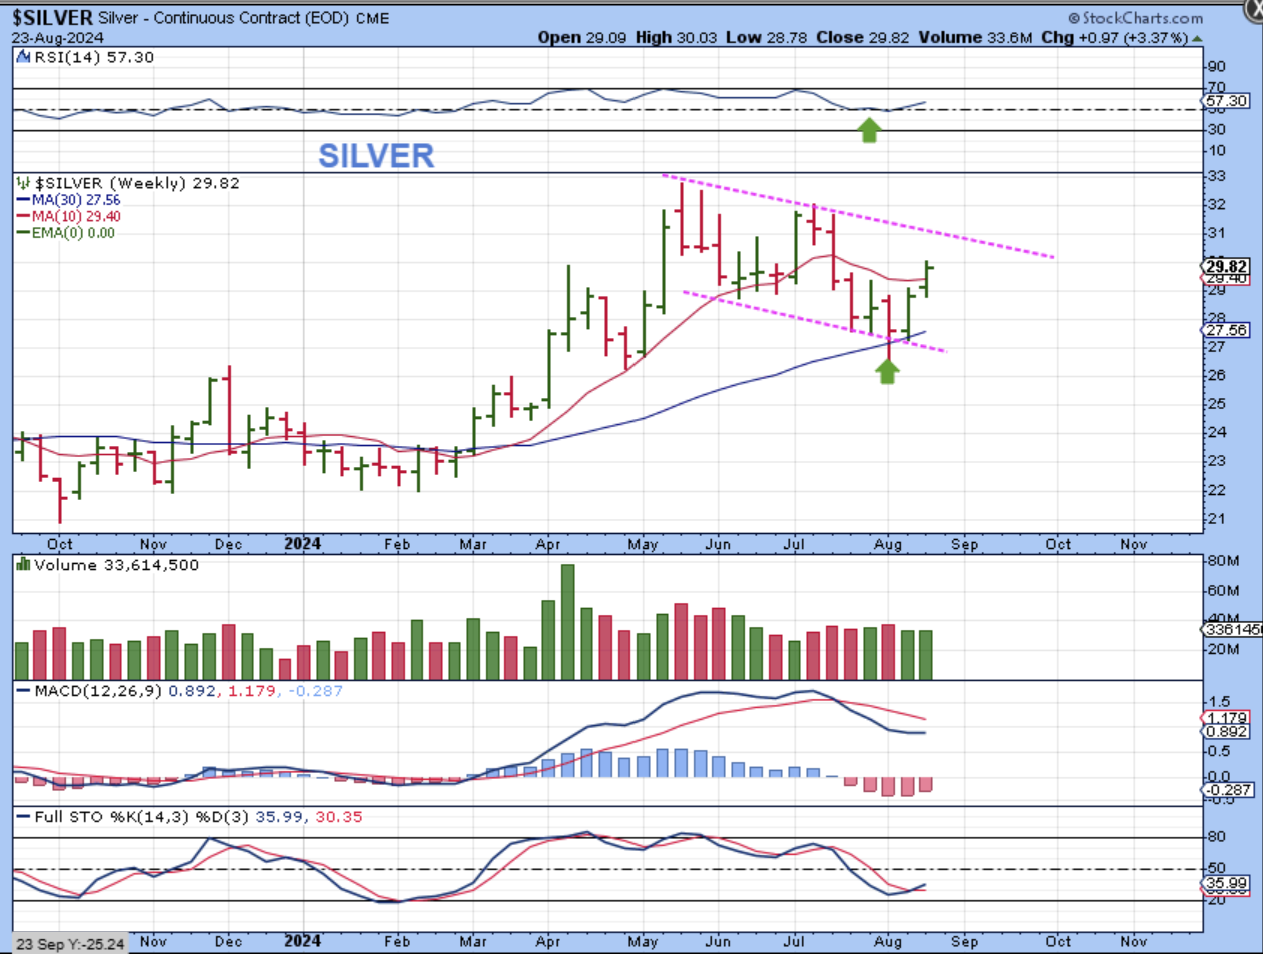
SILVER had a Jackson hole pop on Friday, so that put price back up near the highs of the week. Silver is moving out of a dcl, possible ICL.
.
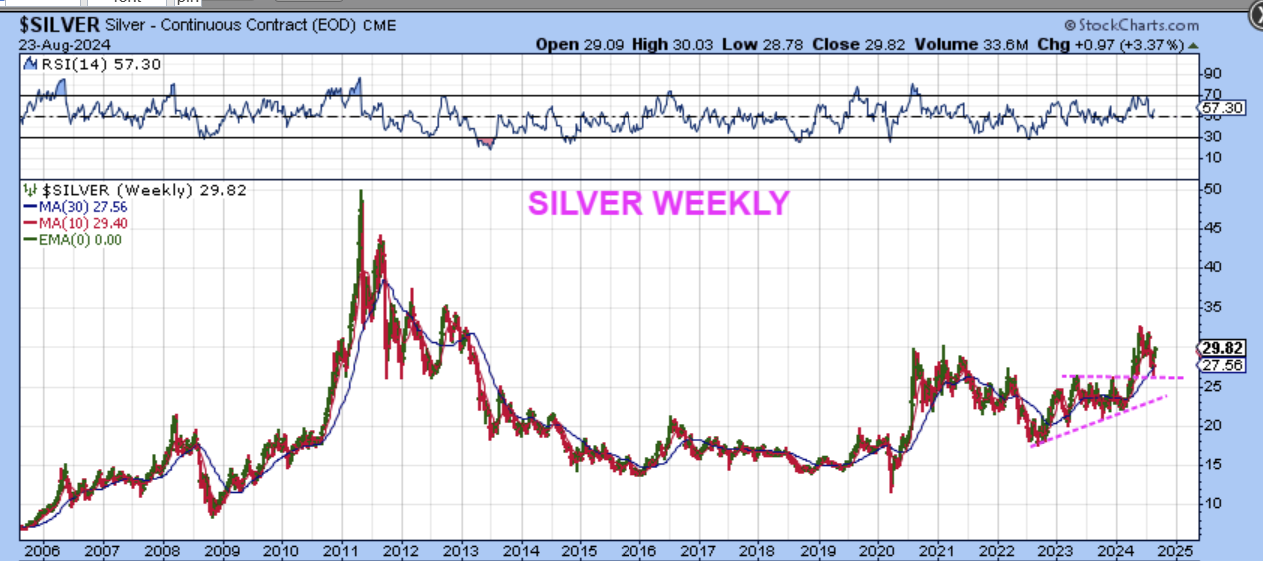
The bigger picture for the SILVER WEEKLY shows a breakout and back test for what could be the ICL. This should be a very bullish set up, really.
.
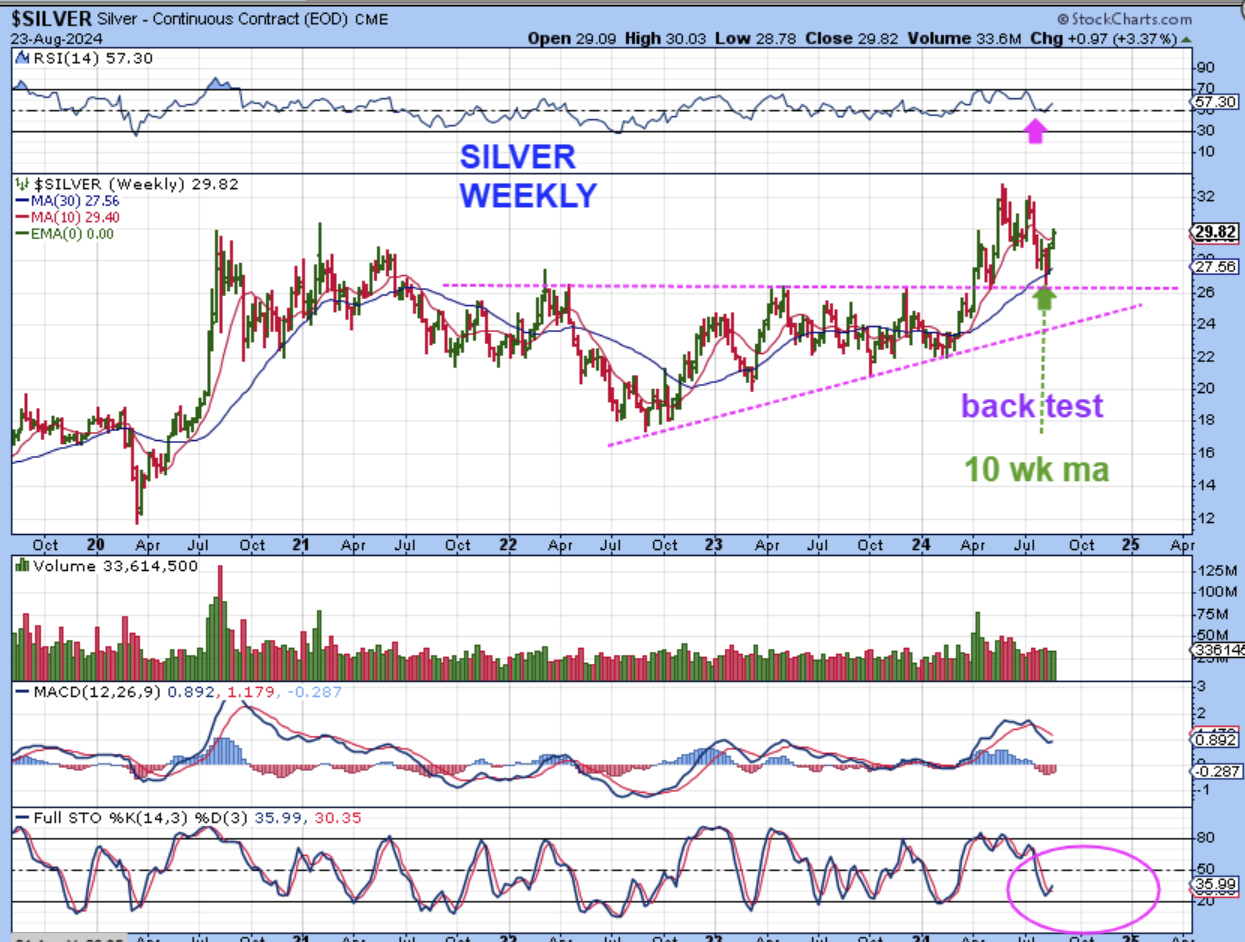
The zoomed in version for The SILVER WEEKLY back test. Silvers weekly chart is oversold, so this should have room to run.
.
SILVER Weekly close up.
.
GDX is on day 14 and each time it breaks to new high it sells off. That happened again last week, so we only have a day 10 peak. I’m pretty sure that this will peak higher than that. .

.
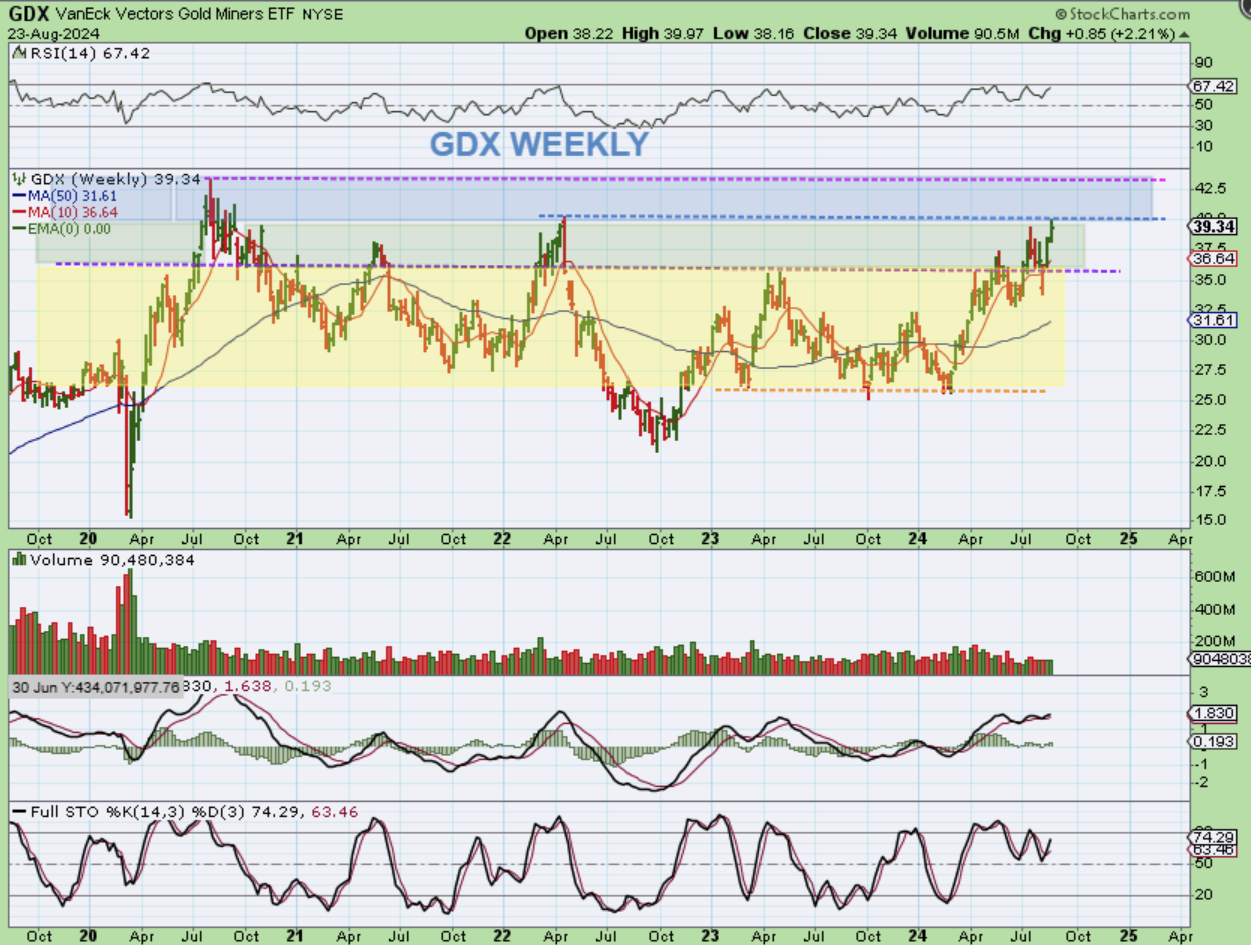
GDX WEEKLY The GDX has been reaching prior peaks, pausing, and then continuing higher. We are at the April 2022 peak and now we are actually almost at 2020 highs. I think that GDX should get there in this Intermediate Cycle.
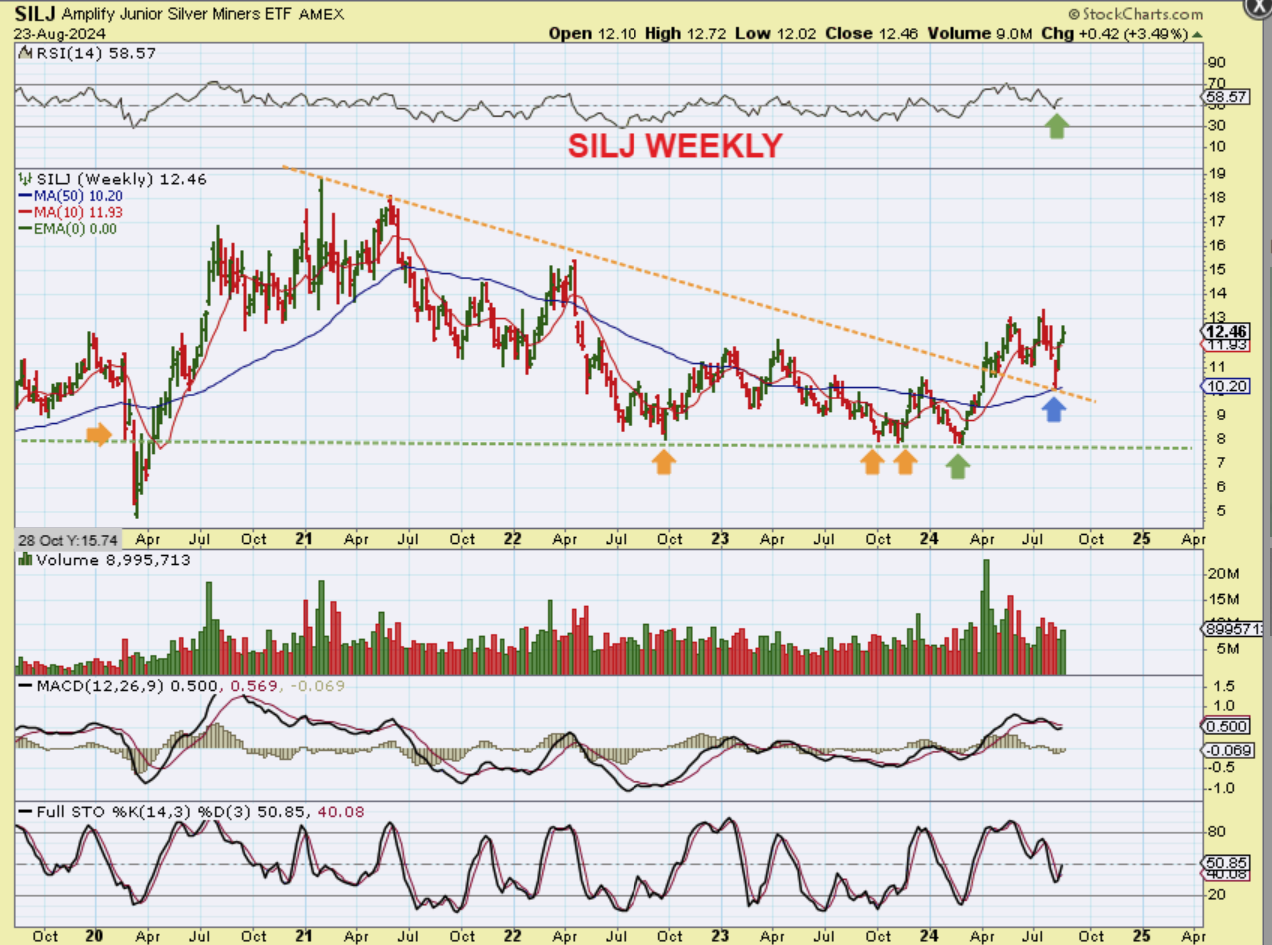
SILJ – Silver stocks lagged, so they are not even close to the prior highs in 2021. I have mentioned that with Silver oversold at the lows and likely putting in an ICL, and Silver stocks lagging some of the stronger Gold runners, these stocks could play catch up. I Like the action of the SILJ & Silver Stocks over the past 2 weeks, as seen on this chart.
.
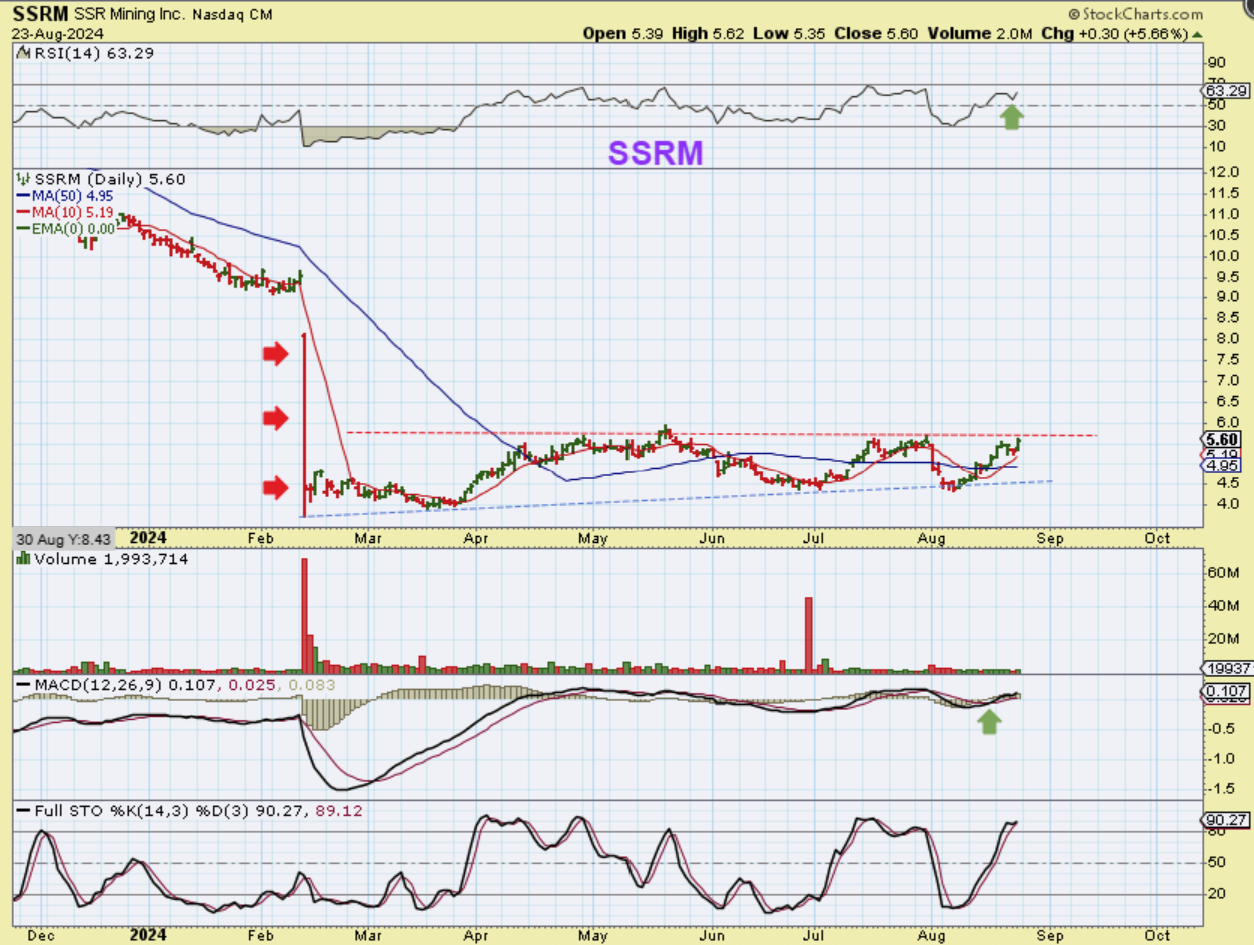
SSRM – I just wanted to show you this stock that got beaten down on Feb 13th. It has basing out and it could breakout and start to trend higher, so you could keep an eye on that too.
.
So you can see that we have been left with bullish set ups after the Fed minutes and Jackson Hole speech. I’ll cover Bitcoin below, and I do like what I see there too. Enjoy your weekend!
.
~ALEX
.
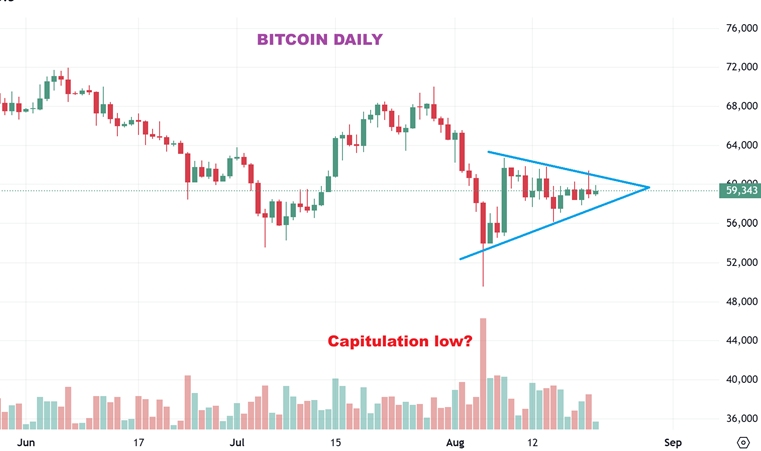
I SAID THIS ON WEDNESDAY ABOUT BITCOIN – This looks like a capitulation low on day 31, but those are often THE low, so even though this would be day 47, I want to keep an eye on it, because it could break higher and then put in a higher low simply due to the capitulation nature of the last drop.
FAST FORWARD TO TODAY :
.
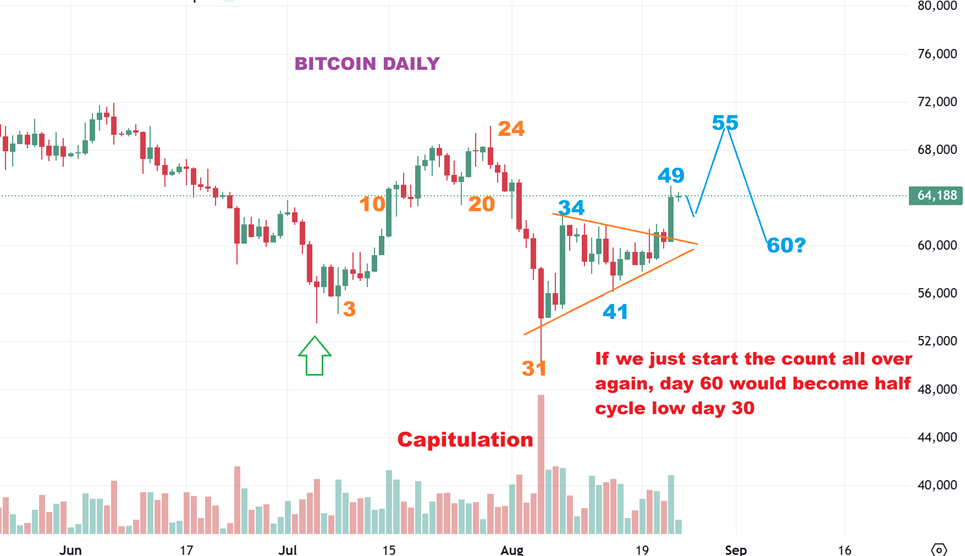
BITCOIN broke out on Friday and I have drawn it in a way that would mean that the capitulation low could restart the count. If so, we’d get a run to the highs and then a drop into the next dcl near day 60. SO, IN OTHER WORDS, you could just count day 31 as a dcl/ICL, and day 60 would then become day 30 instead, but we’ll see how this plays out. ANOTHER REASON WHY I SEE IT THIS WAY IS BECAUSE…
.
ANOTHER REASON WHY I SEE IT THIS WAY IS BECAUSE…
.
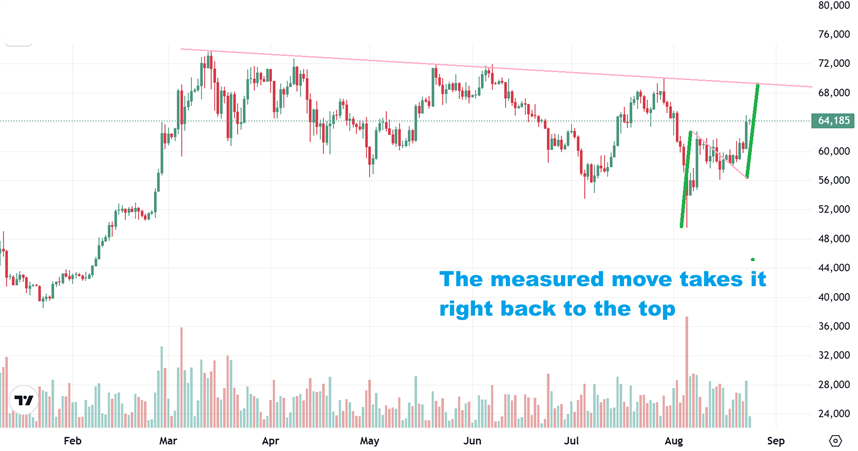
BITCOIN –I took a measured move from the capitulation low to the highs of that first leg and it brought me right to that $68,000 mark. That is also where that downtrend line is, so a pullback from there could take place and we’d be in the timing for a low shortly after.
.
By the end of last week, we saw several Crypto Miners start to join in with the Bitcoin move higher. Take a look at WULF, BTBT, BITF, SDIG, MARA, and a few others, and they look to be starting to move. We’ll look at a couple here.
.
WULF DAILY – WULF has steadily been marching higher, even though you can see that for the last 3 days it sold off each morning and then recovered. This is a bullish set up. Next I encourage you to start checking the weekly charts too…
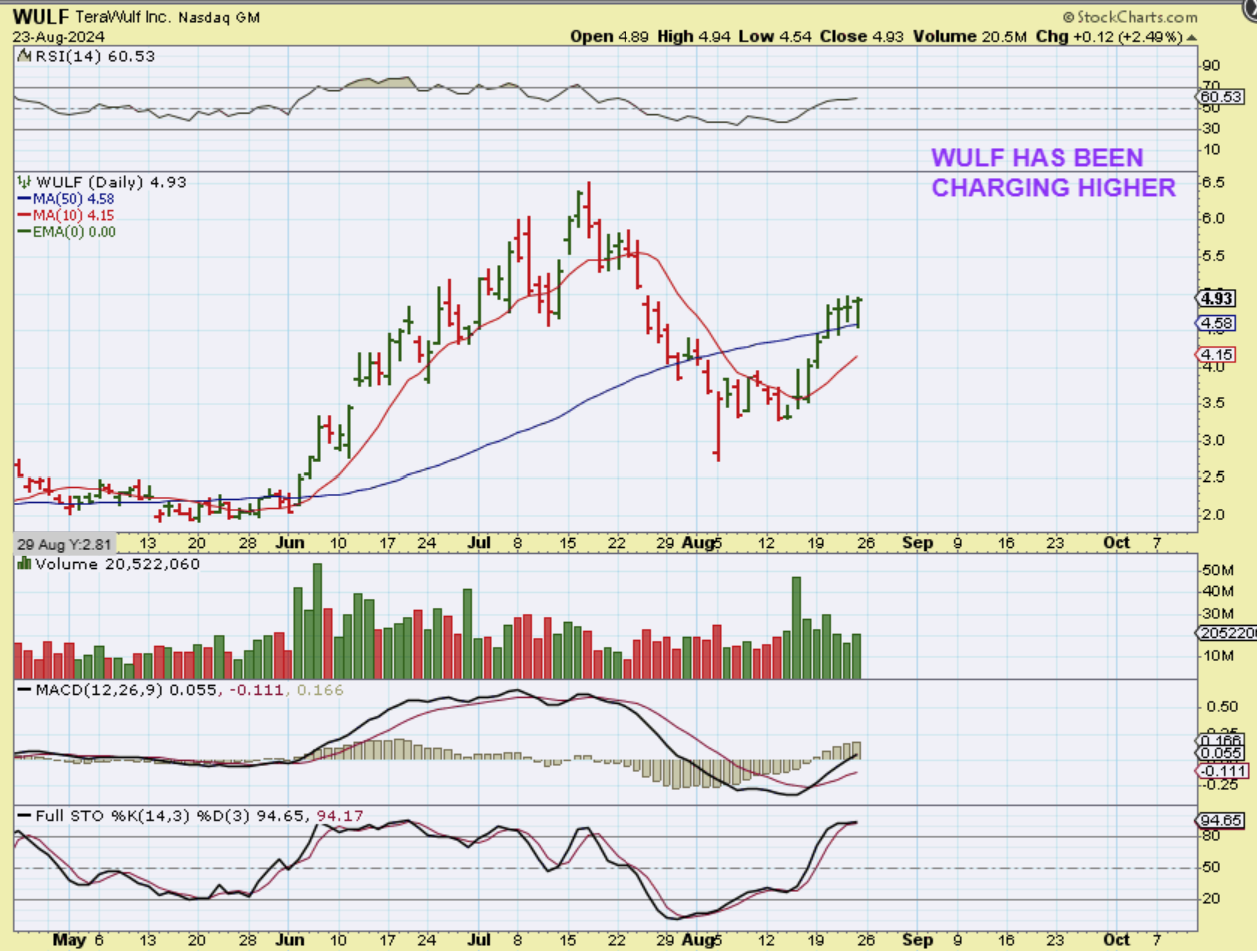
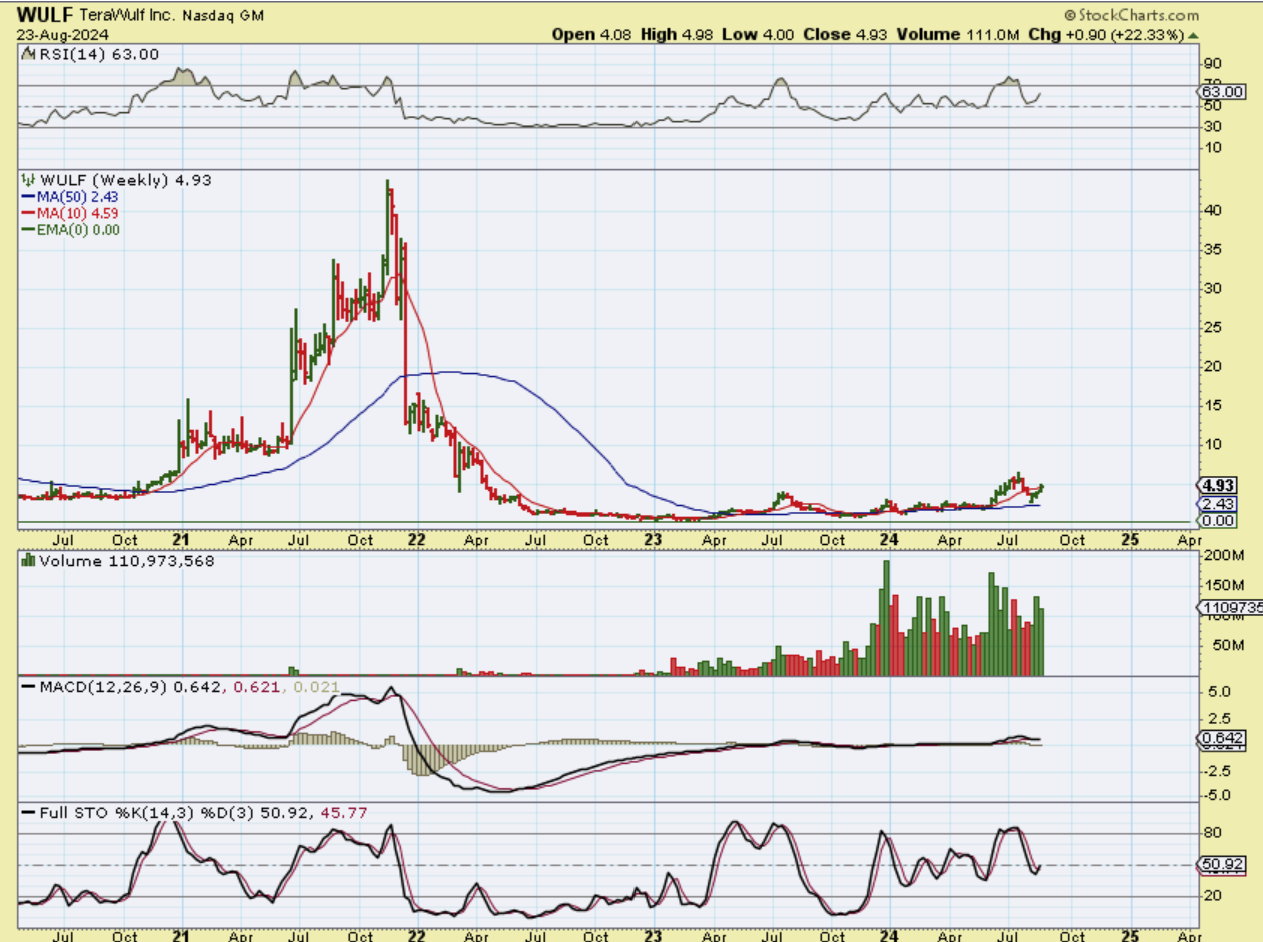
WULF WEEKLY – WULF was up 22% last week and has basically doubled off of the lows. Look at THAT volume! The weekly RSI tuned up at the 50% line.
Any upside potential if this gets running? 🙂
.
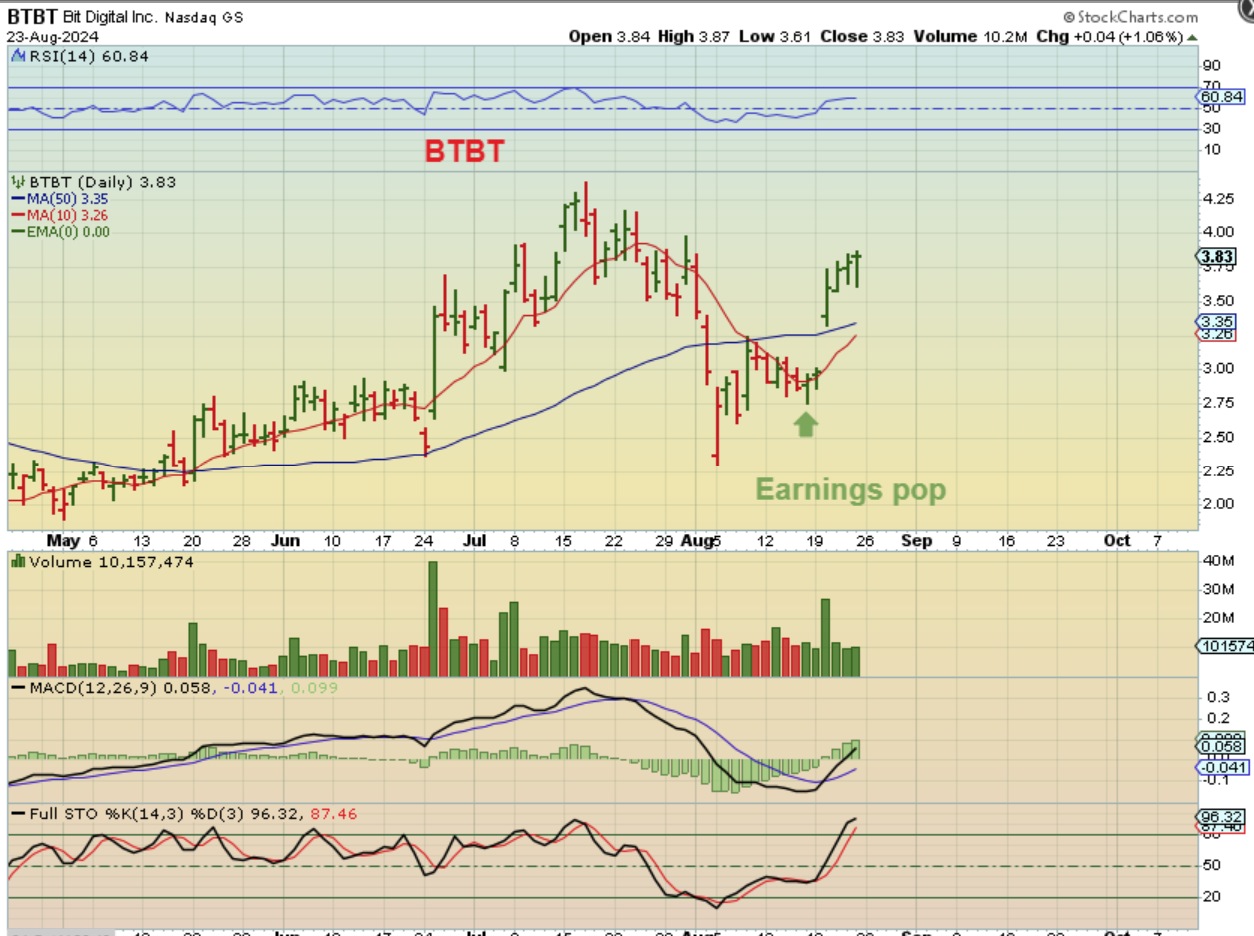
BTBT DAILY – BTBT did a big pop when they released their earnings. It also has sold off each morning and then closed near the highs. Next is the weekly…
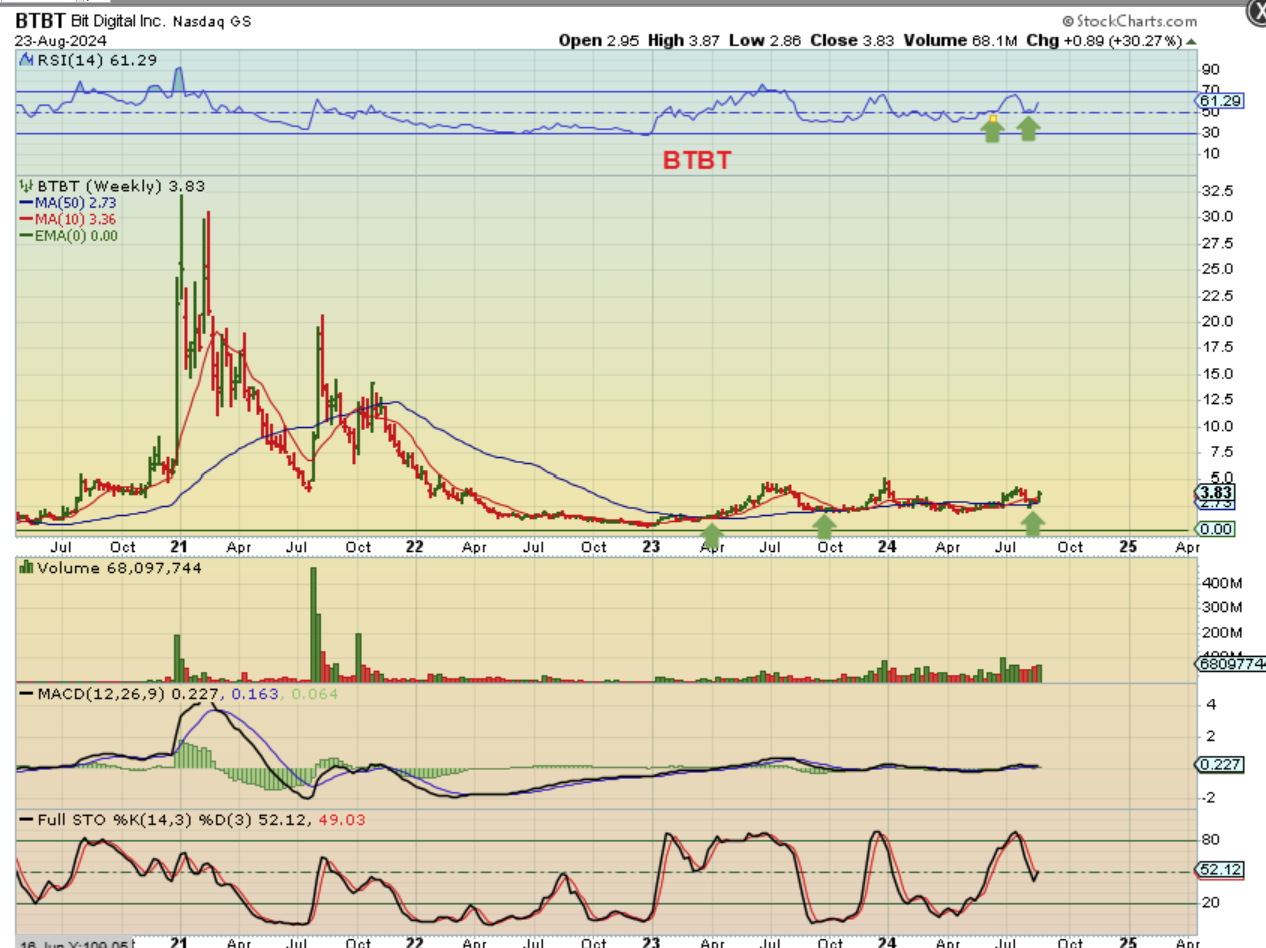
BTBT WEEKLY – BTBT was up 30% and has also formed a massive base. Weekly RSI turned up at the 50% line.
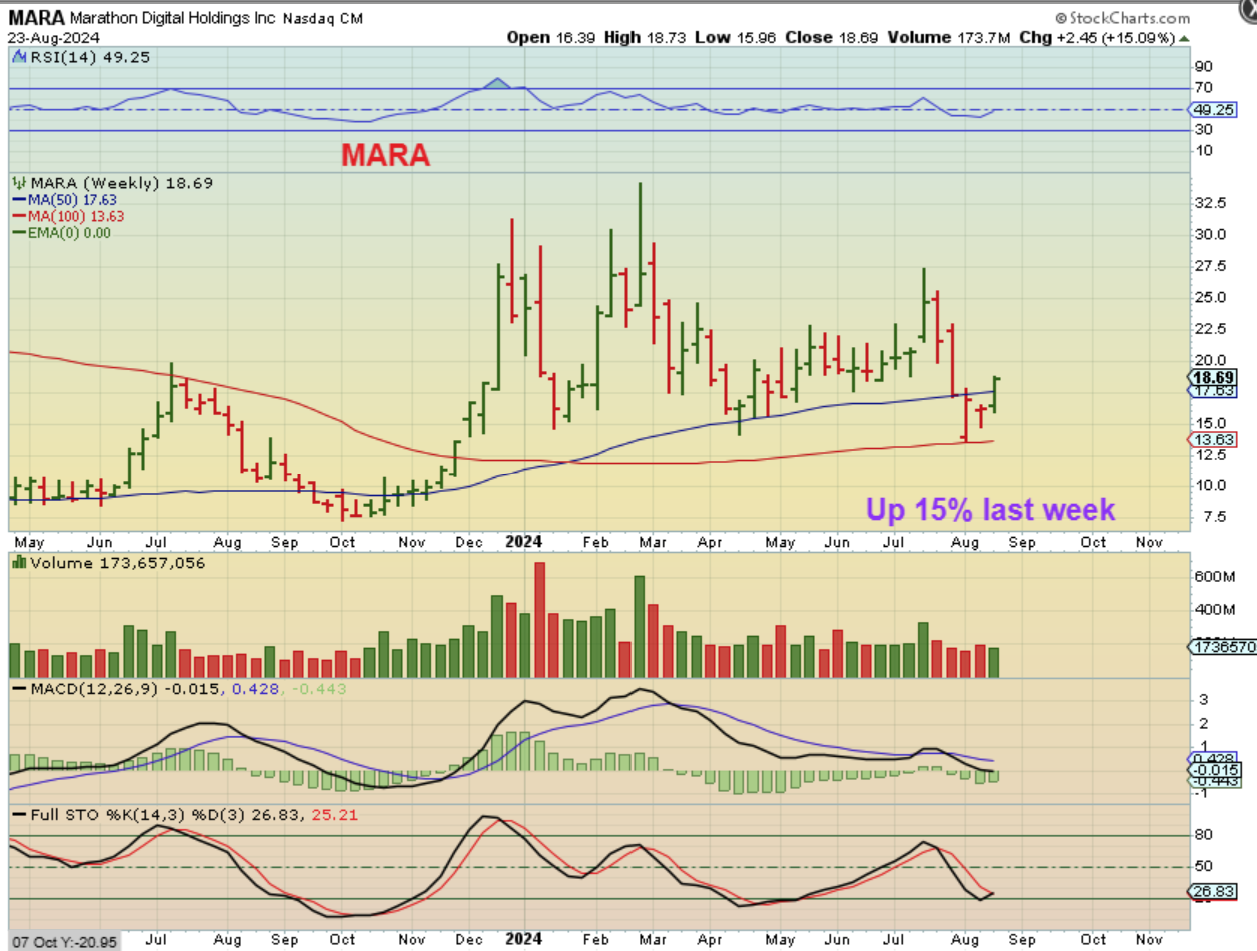
MARA WEEKLY – MARA started to run Friday and was up 15% for the week. These have been very choppy lately as Bitcoin remained choppy, but this MIGHT be an indication that Bitcoin will run to the highs, pull back to a higher low, and then breakout to all-time highs. We’ll see, but the Crypto stocks look like they are improving.