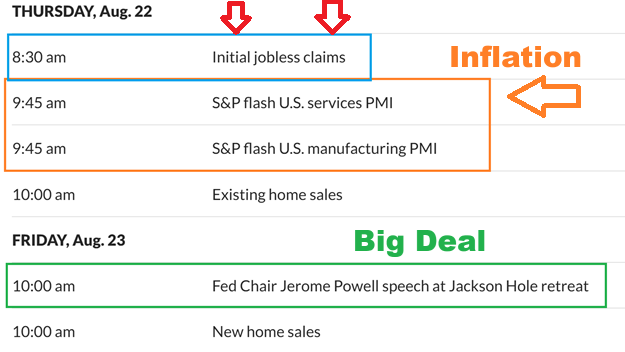
Thursday August 22 Jobless Claims
.
DATA – The Jobless Claims report is tricky, since it has caused both rallies and sell off. It reflects how the economy is doing. At times bad numbers are viewed as helping to bring a rate cut, but we did see a crash sell off starting on the Thursday after the Fed Day a few weeks ago. The inflation numbers help, because they indicated lower inflation & costs, and even the need for a rate cut, and that has boosted Precious Metals (& the markets at times too).
.
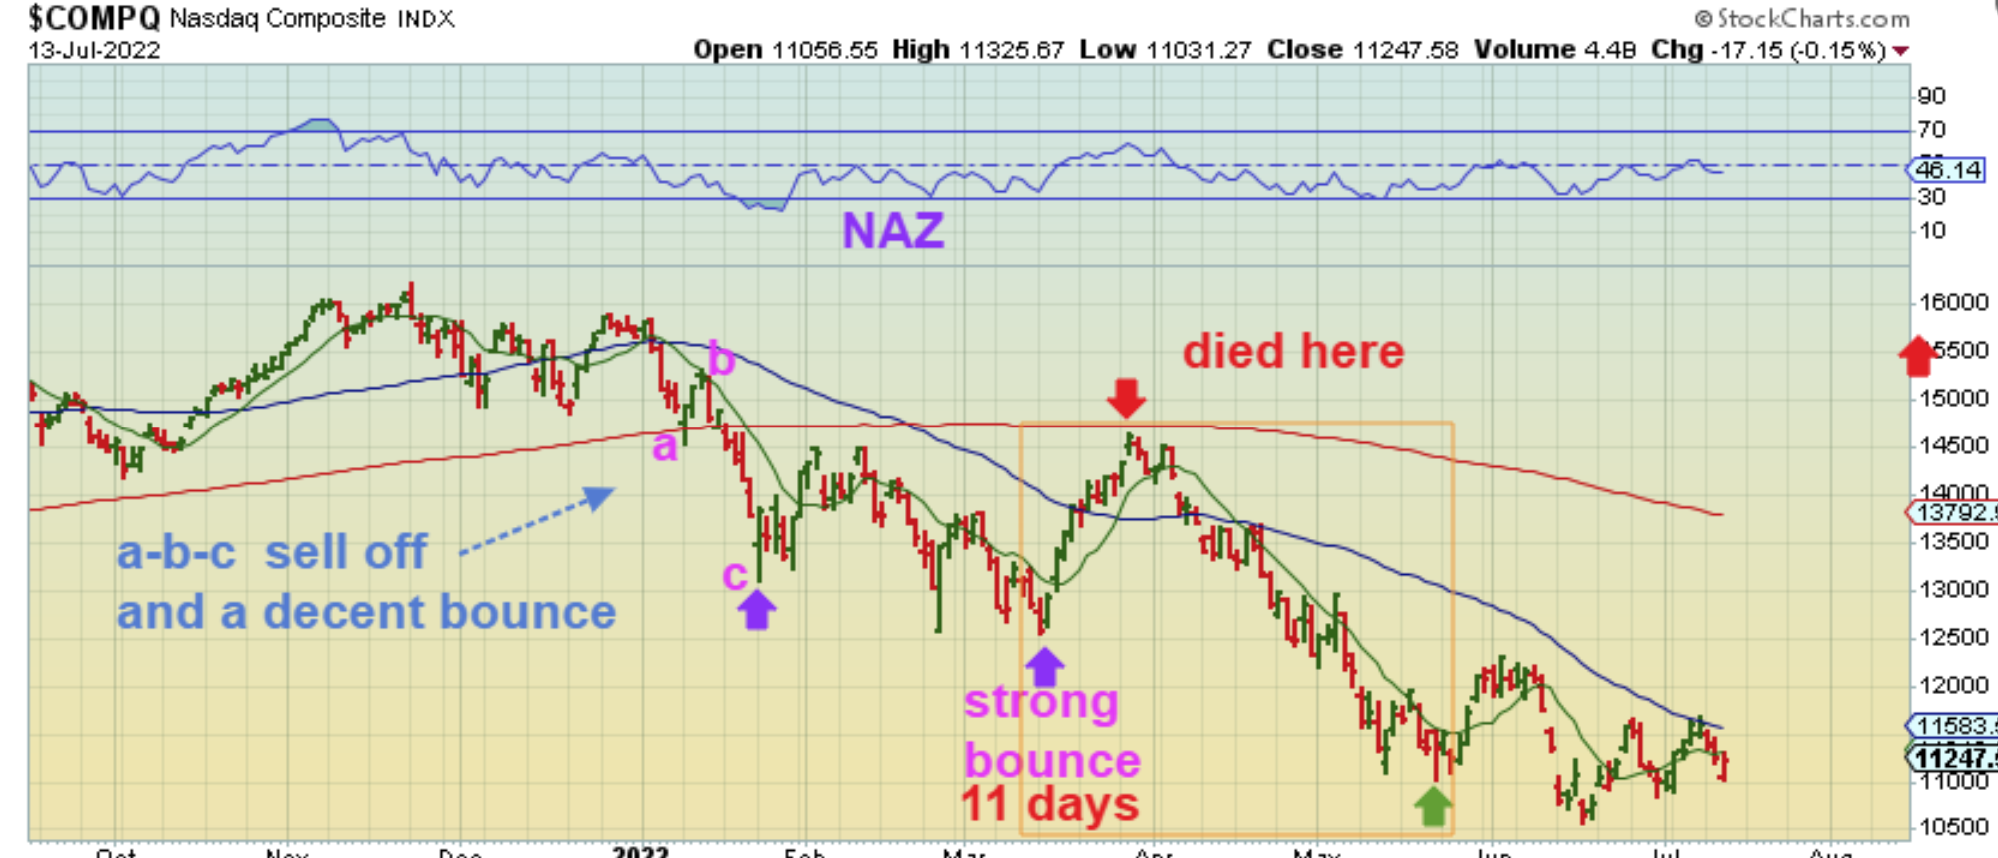
NASDAQ 2012 – I have pointed this 2022 rally out several times, so just a brief reminder: I just wanted to review this one more time, since today is the Jobless Claims day. This very real looking rally out of the 2022 lows was straight up and lasted about 11 days. Enough said…
.
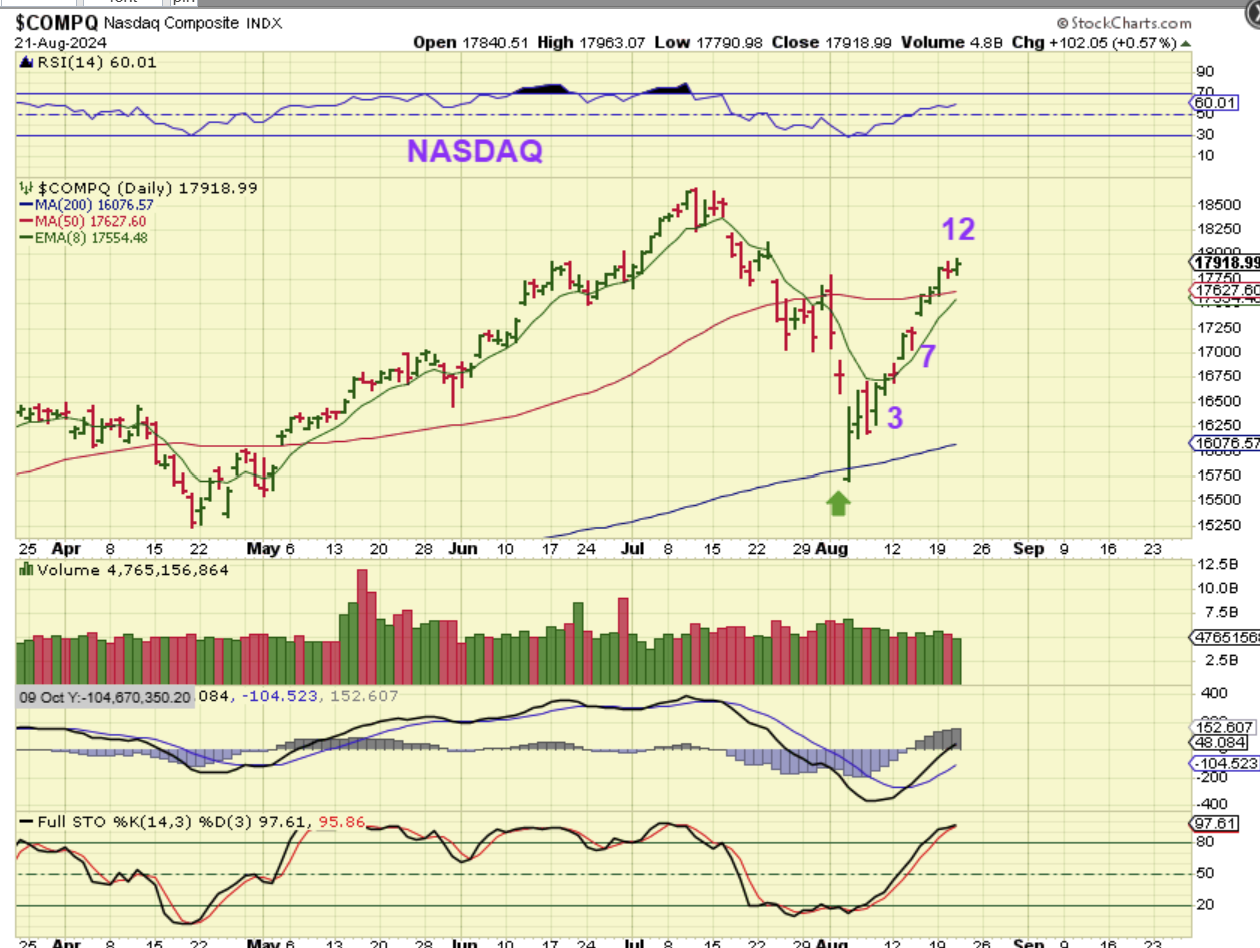
This straight up rally for The NASDAQ is also at day 12, so this is a good time for it to start getting a pass or fail grade. It will be L.T. if it ‘peaks’ around here, but so far the rally out of the lows has also caused some of the bullish stocks to already reach or make new highs. Let’s see what Jobless Claims does? The inflation numbers have recently helped with Hope of a rate cut.
.
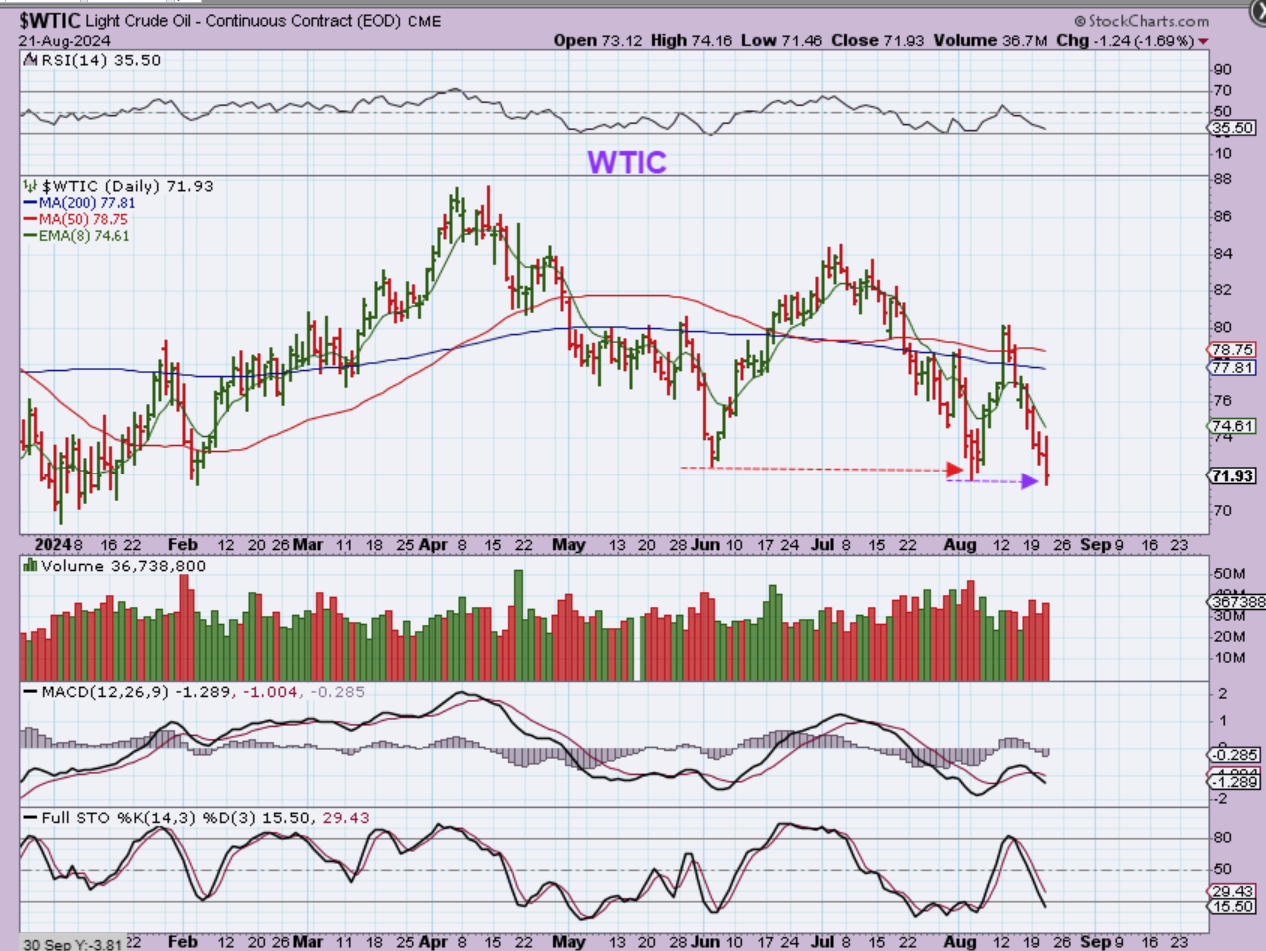
WTIC – Oil broke to a slightly new low again, and yesterday I discussed the possibility that instead of this breaking out HIGHER from a triangle formation that I have been pointing out, there is now a danger of breaking down. Each rally out of the lows showed very nice strength, but then it just rolls over and sells off just as quickly. We could do short term trades if we are day traders, but buy & hold traders need to be cautious until it breaks out. Let’s review yesterday’s thought…
.
To me, a breakdown and close below $70 would probably start a break down or give us a shakeout.
YESTERDAY I SAID:
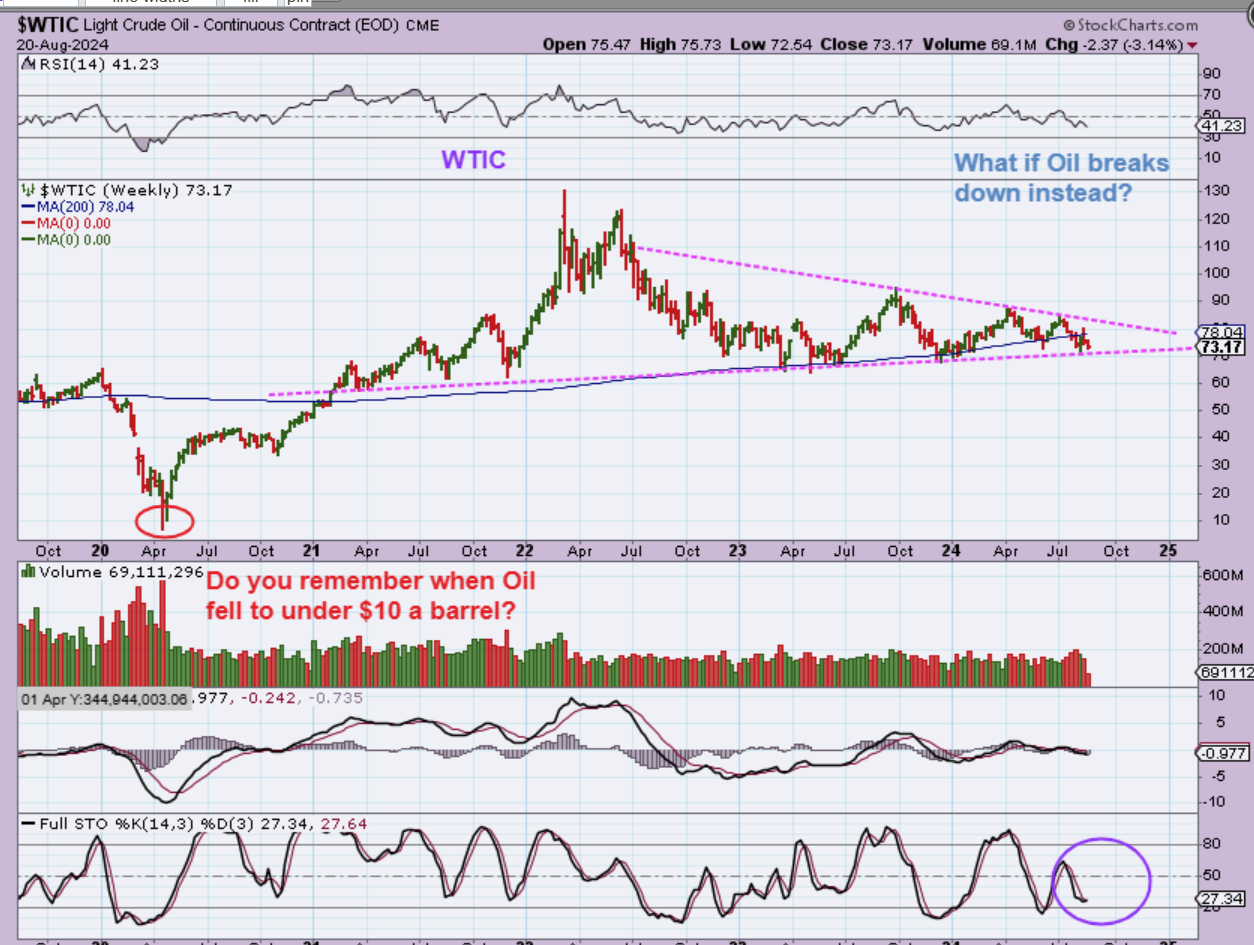
Oil has stalled at the middle of that triangles Apex and I got to thinking, “What if The WTIC broke DOWN instead of up? What if Rate cuts weakens Oils price?” Do you remember when Oil sold off to under $10 in 2020? Well, Oil selling down from here is a possibility. I didn’t consider this before, because as Oil sold off, Oil stocks resisted that sell off. Oil stocks are now breaking down too.
.
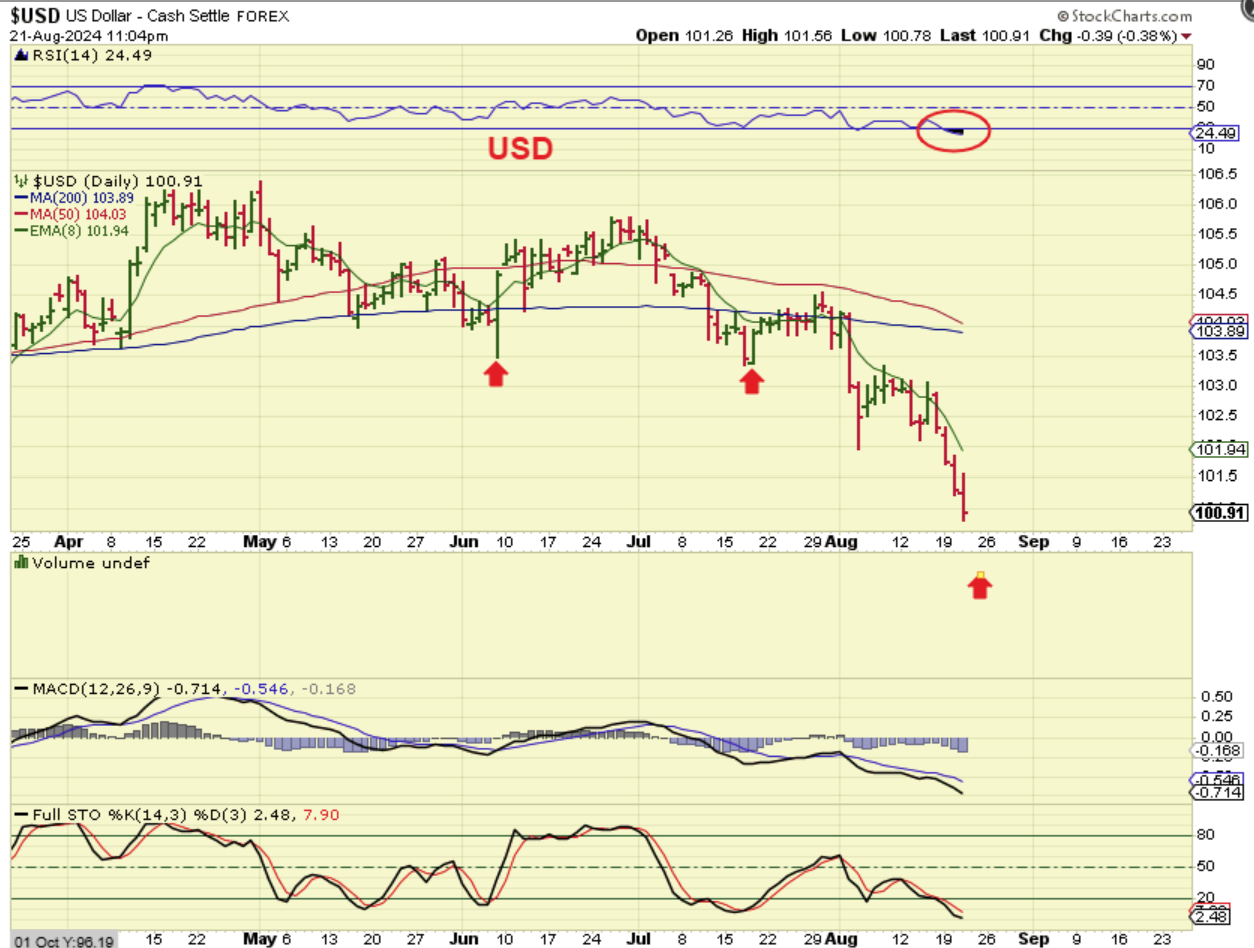
USD – Interest rate cuts in our future are not good for everything, is it? The USD broke down as expected. It is due for a dcl, and that dcl MIGHT stall Golds rally. We’ll see.
.
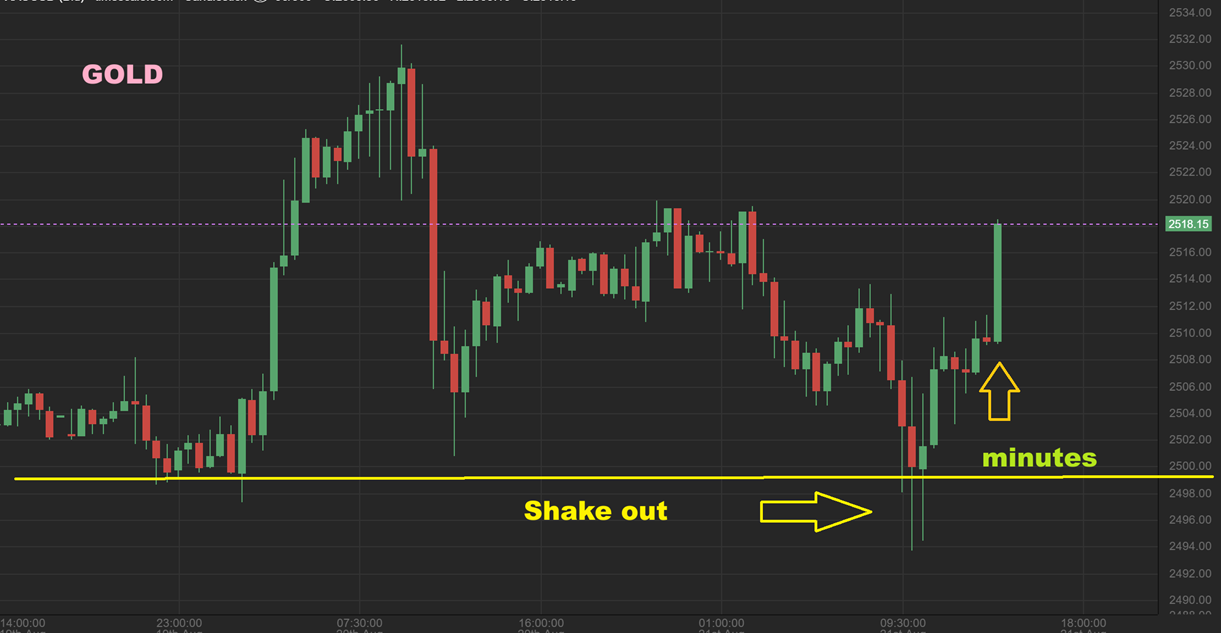
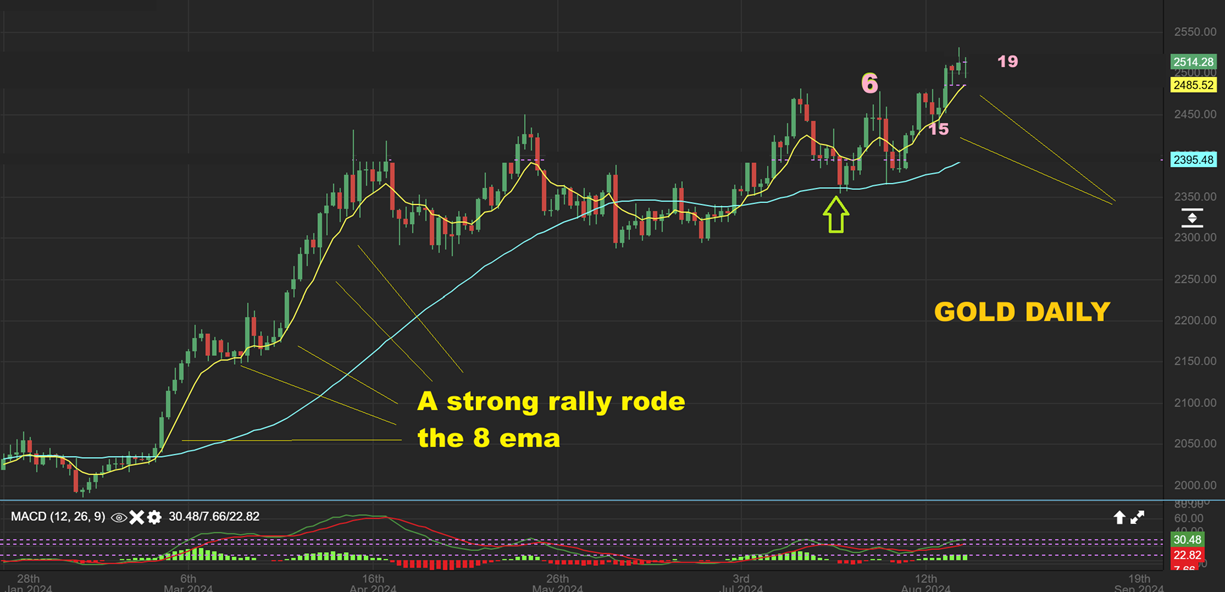
GOLD sold off in the morning and even did a ‘shakeout’ intraday, but it reacted to the Fed minutes as seen here at 2:15 p.m. and surged higher. Silver did that too.
.
So GOLD had dropped in the morning and rallied back up near the highs of the day, but it did NOT make a new high. We have Golds highs at day 18 so far and today will be day 20.
.
I wanted to point out the 8 ema on this chart, and you can see how Gold climbed that nicely in the past rally. That last run was showing the stronger moves out of a dcl though, so we can’t expect that kind of a run from day 20 onward, but we might see the 8 ema hold price until we start to chop & dip into a dcl. So far it is above the 8 ema.
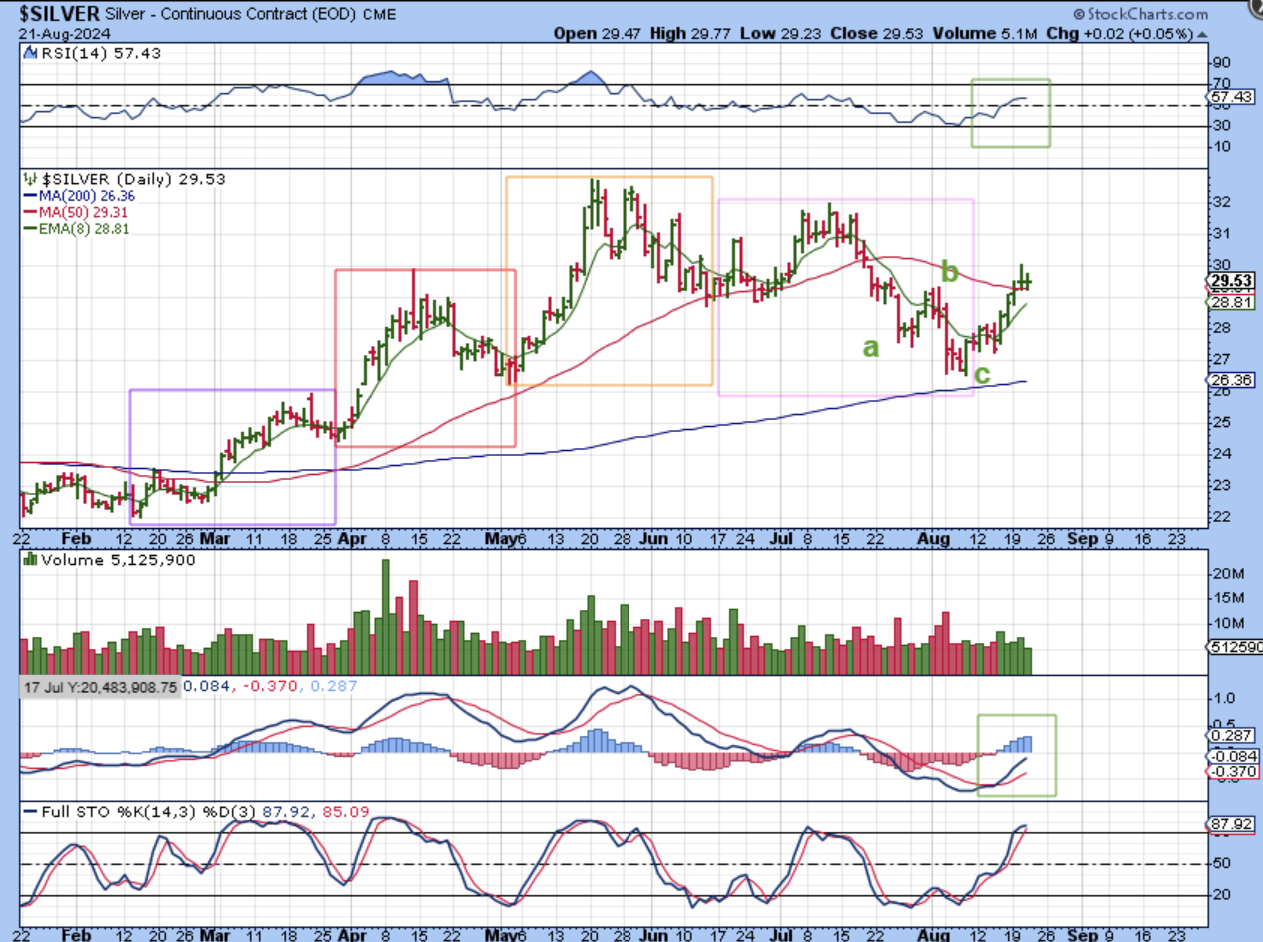
SILVER has definitely put in the dcl that we were watching for, but hopefully it also has put an ICL in place too. This is the hard part: Silver was only on day 9, and that makes things difficult, because with Gold on day 20 and Silver on day 10 today, it will be a little hard to watch them sync up. This happened when Silver and GDX Bottomed with the General Markets and Gold did not dip to a new low at that time.
.
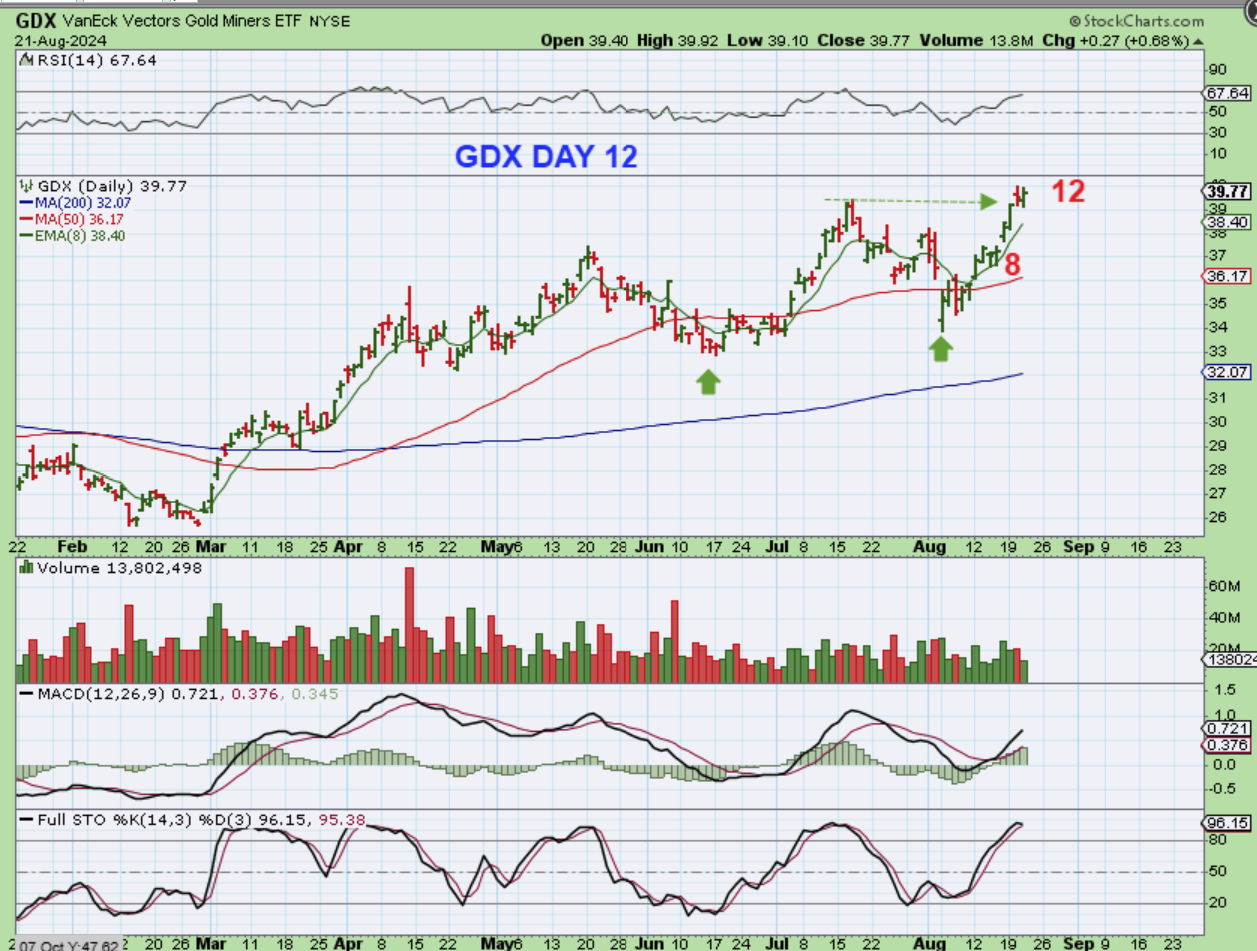
GDX had a slam down reversal during that Market sell off, and that is why we see GDX as being on day 12. It has been moving more vertically higher over the past 7 days, after a choppier bottom, and has made new highs.
.
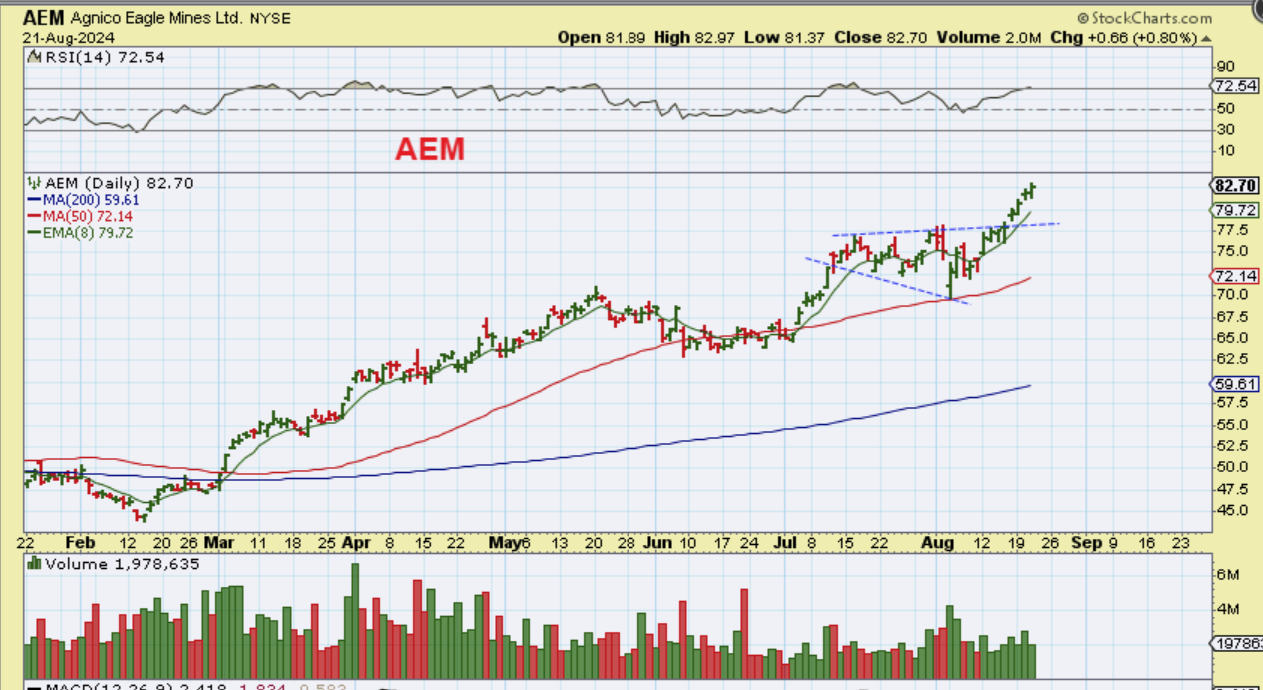
AEM: If you go back to my reports last week, you saw me pointing out leaders and laggers. I had mentioned that some like AEM, BARRICK, EGO, etc were at new highs and could just keep running, and I pointed out laggers that were set up like these were weeks earlier. Well, those laggers are catching up, so how are the ‘leaders’ doing?…
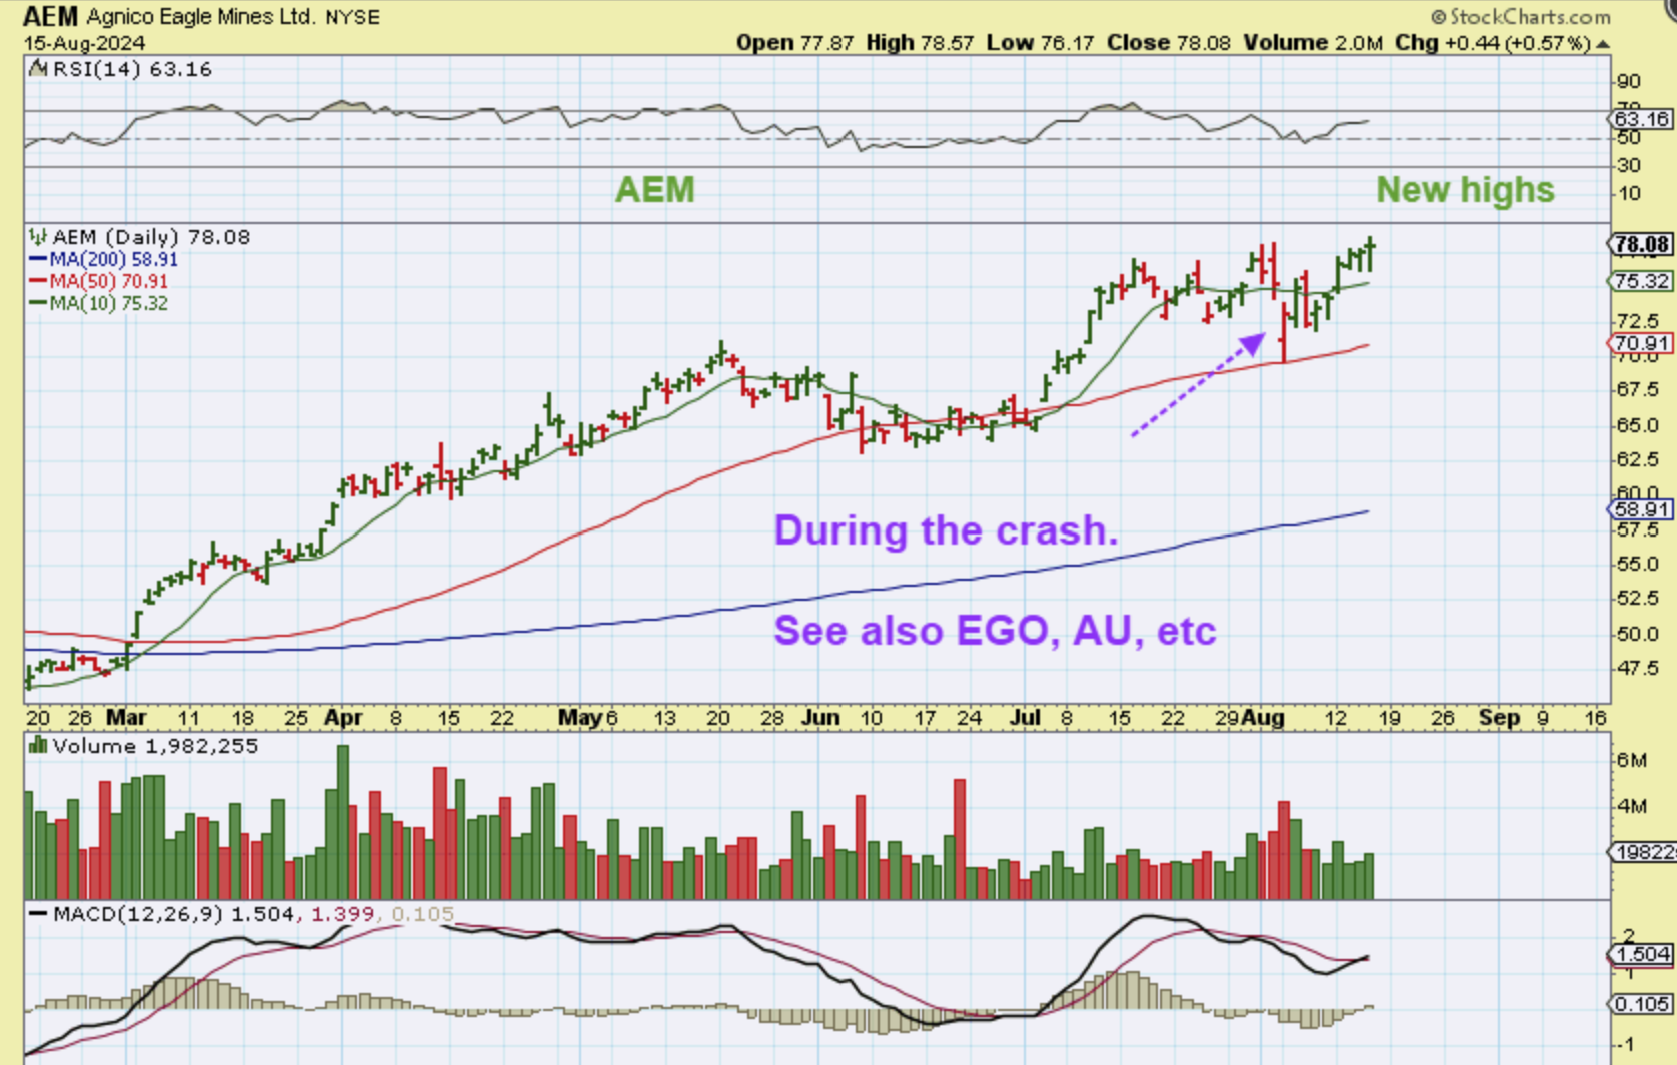
Leaders like AEM have continued running as expected, and those laggers are catching up. This was set up like a bullish megaphone and the bull run continues.
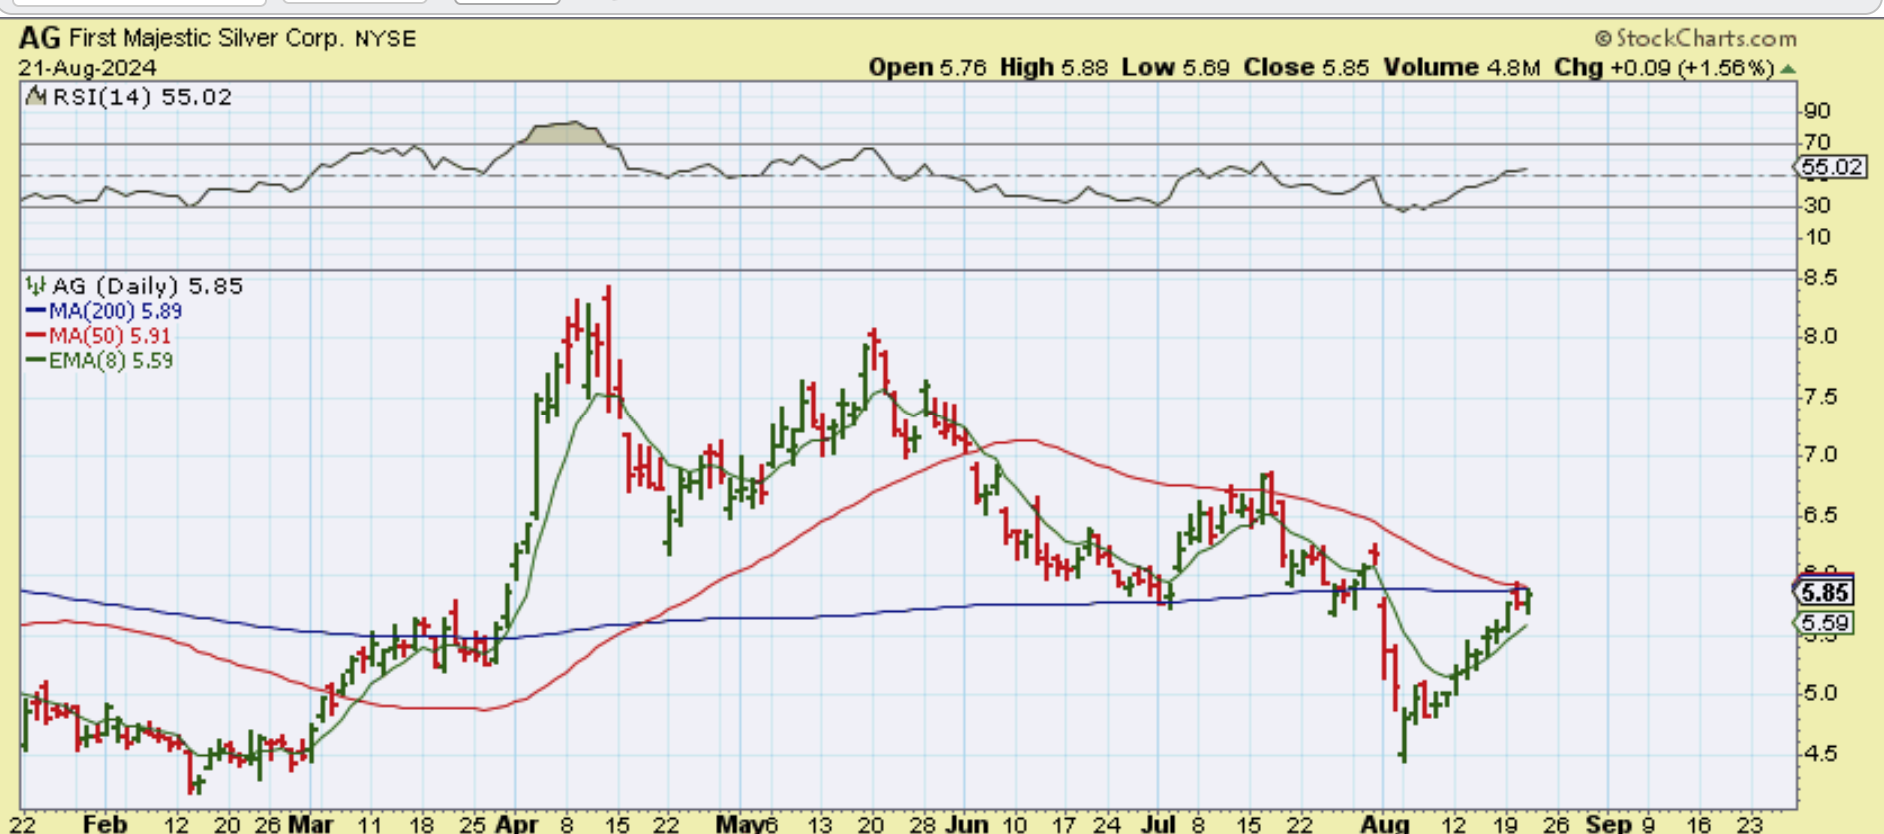
Now we see the Silver laggers like AG. Once it breaks through resistance, it will be viewed as a buy by many, so maybe you bought it closer to the lows or on day 4 or 5? You can add when it breaks out.
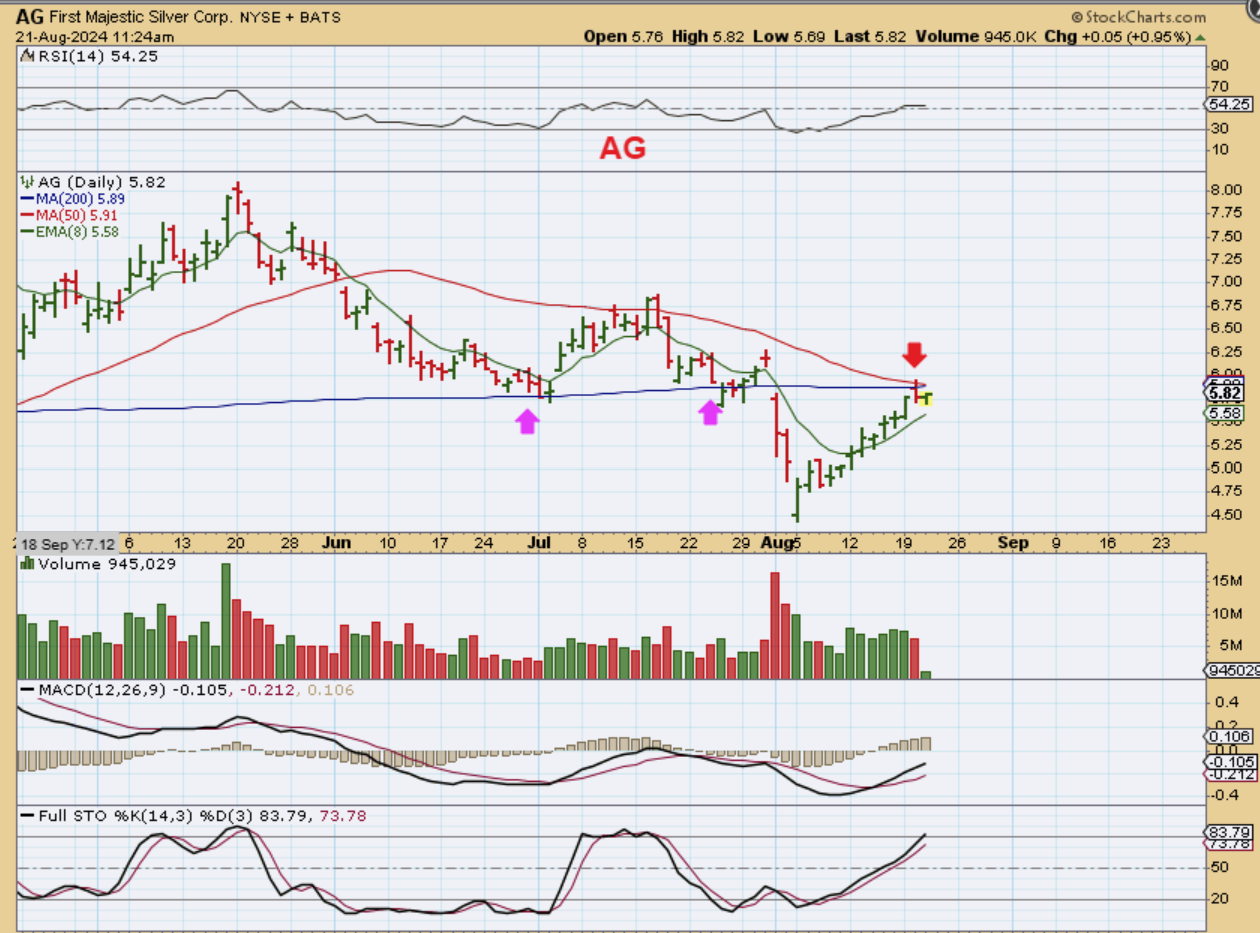
AG. That chart above was captured at 11:24 a.m., and it closed a bit higher too, so it is worth watching. A close above $5.90 or especially a close above $6 will look bullish.
.
We’ll see the Jobless Claims at 8:30 and again, it may be viewed as giving us the need for a rate cut and rally the markets, or, like we saw after the Fed Day Rally, Thursdays jobless report started that massive sell off. We then have data at 9:45 a.m. and THAT could help. In other words, we may have a volatile open to the markets today, but that might just be a little more ‘noise’ and then things could settle down (or at least give us a directional path) shortly after that first hour of trading. Enjoy your Thursday trading!
.
~ALEX
.
FROM YESTERDAY:
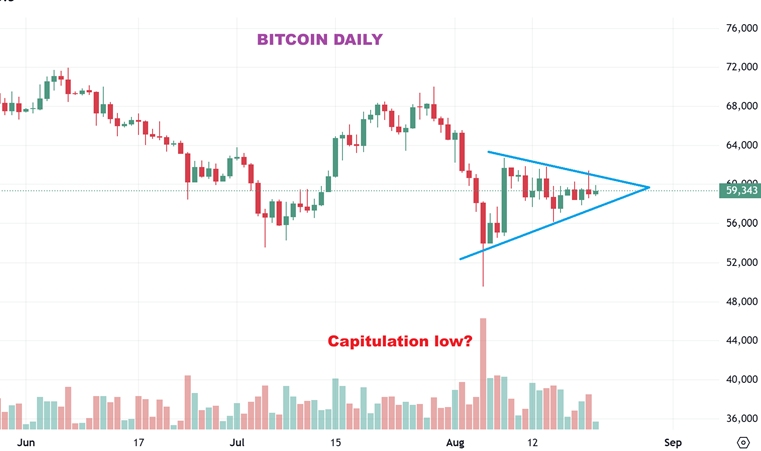
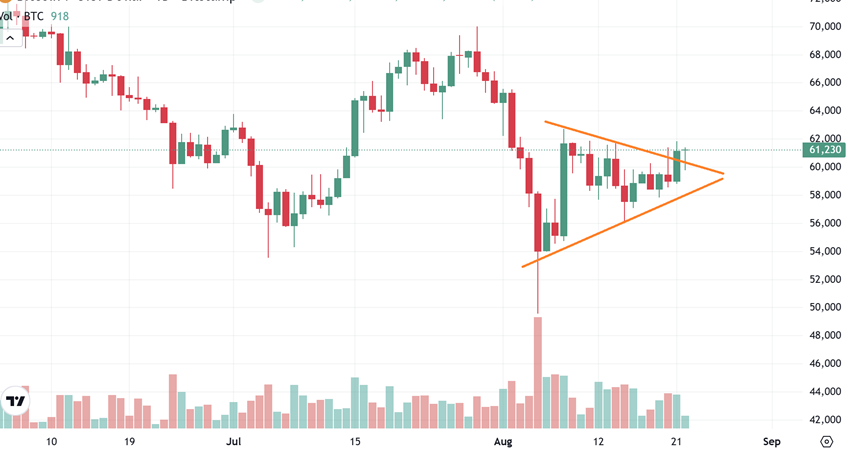
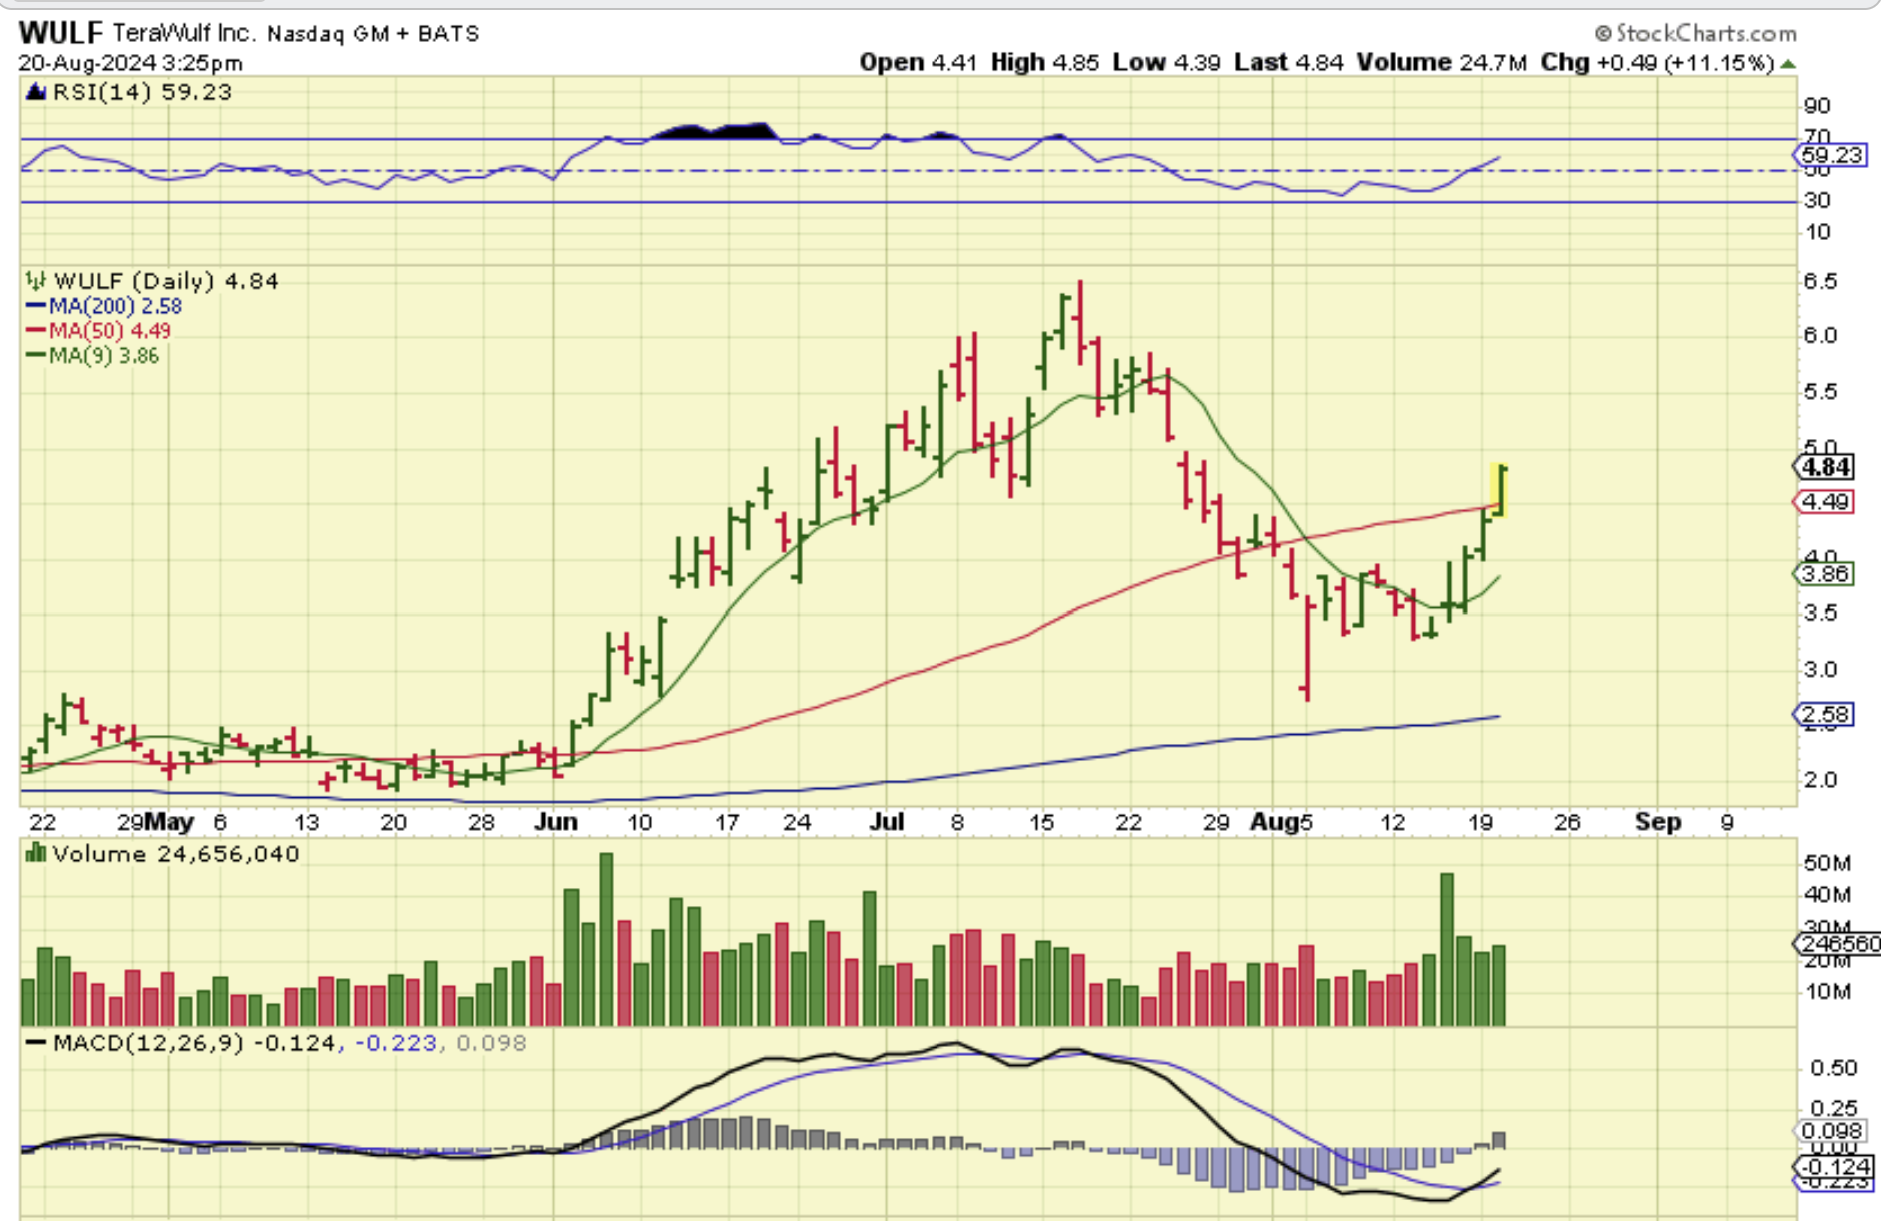
BITCOIN – This looks like a capitulation low on day 31, but those are often THE low, so even though this would be day 47, I want to keep an eye on it, because it could break higher and then put in a higher low simply due to the capitulation nature of the last drop. At the same time, some of the Crypto miners are starting to look as though they want to try to bottom out. WULF is actually in rally mode.
.
BITCOIN – The triangle is breaking out higher currently.
.
YESTERDAY I ALSO SAID:
WULF is actually in rally mode, so I am keeping an eye on a few others, but they are very choppy and do not seem ready to buy and hold yet (unless you don’t mind the chop).
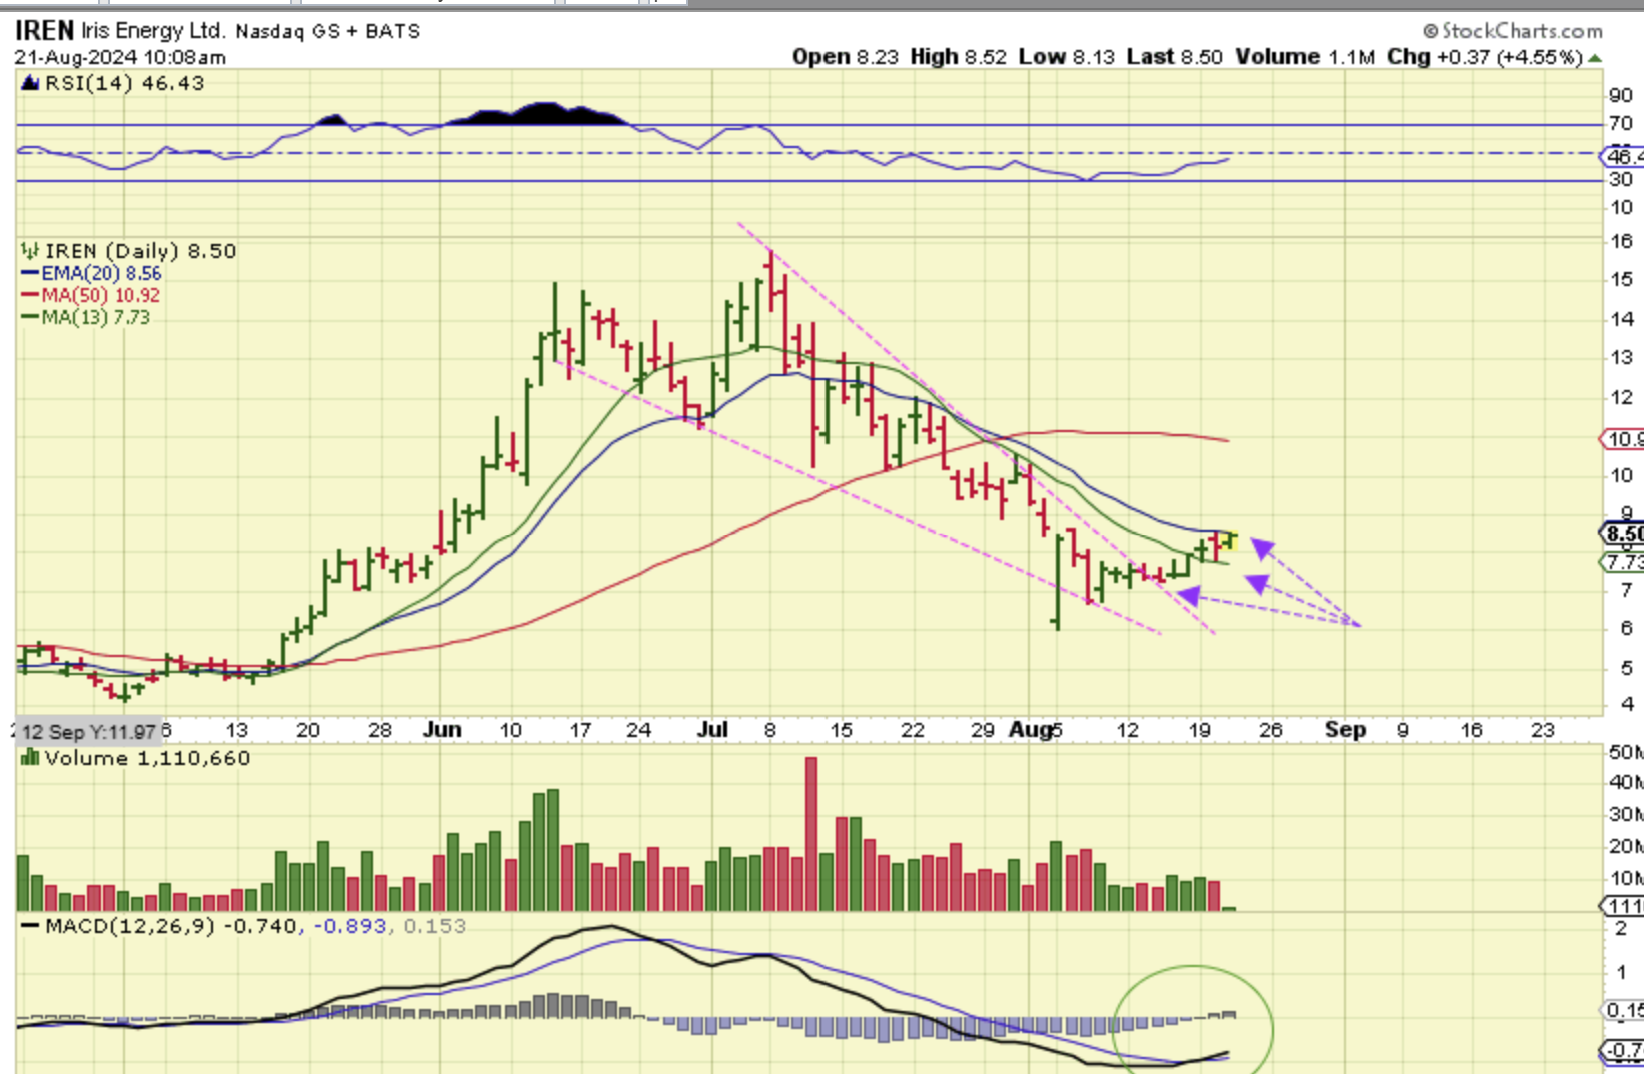
IREN was pushing on the 20ema yesterday, after breaking above the 13 sma and a downtrend line. I had mentioned that I bought some just to keep an eye on it a few days ago, and it is a rougher ride than it looks intraday actually. It seems to be down each morning and then chops up & down all day, eventually closing higher, so it is slow progress and not out of the woods yet, but these do seem to be improving after Bitcoins capitulation lows.
.
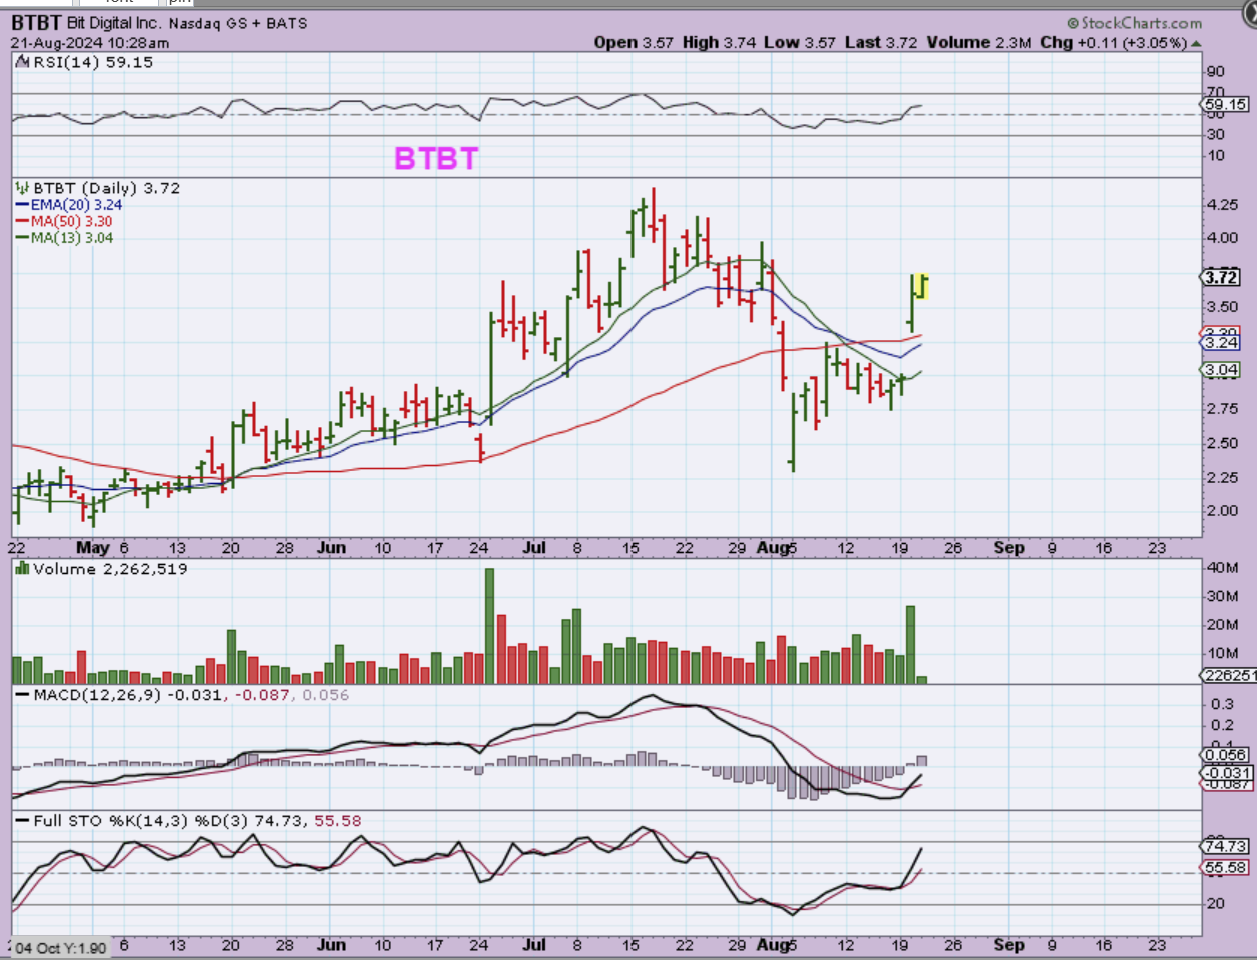
BTBT released earnings and had a very large 20% pop above resistance on Tuesday and follow through on Wednesday.
.
I wrote this after the Fed minutes release too
.
.
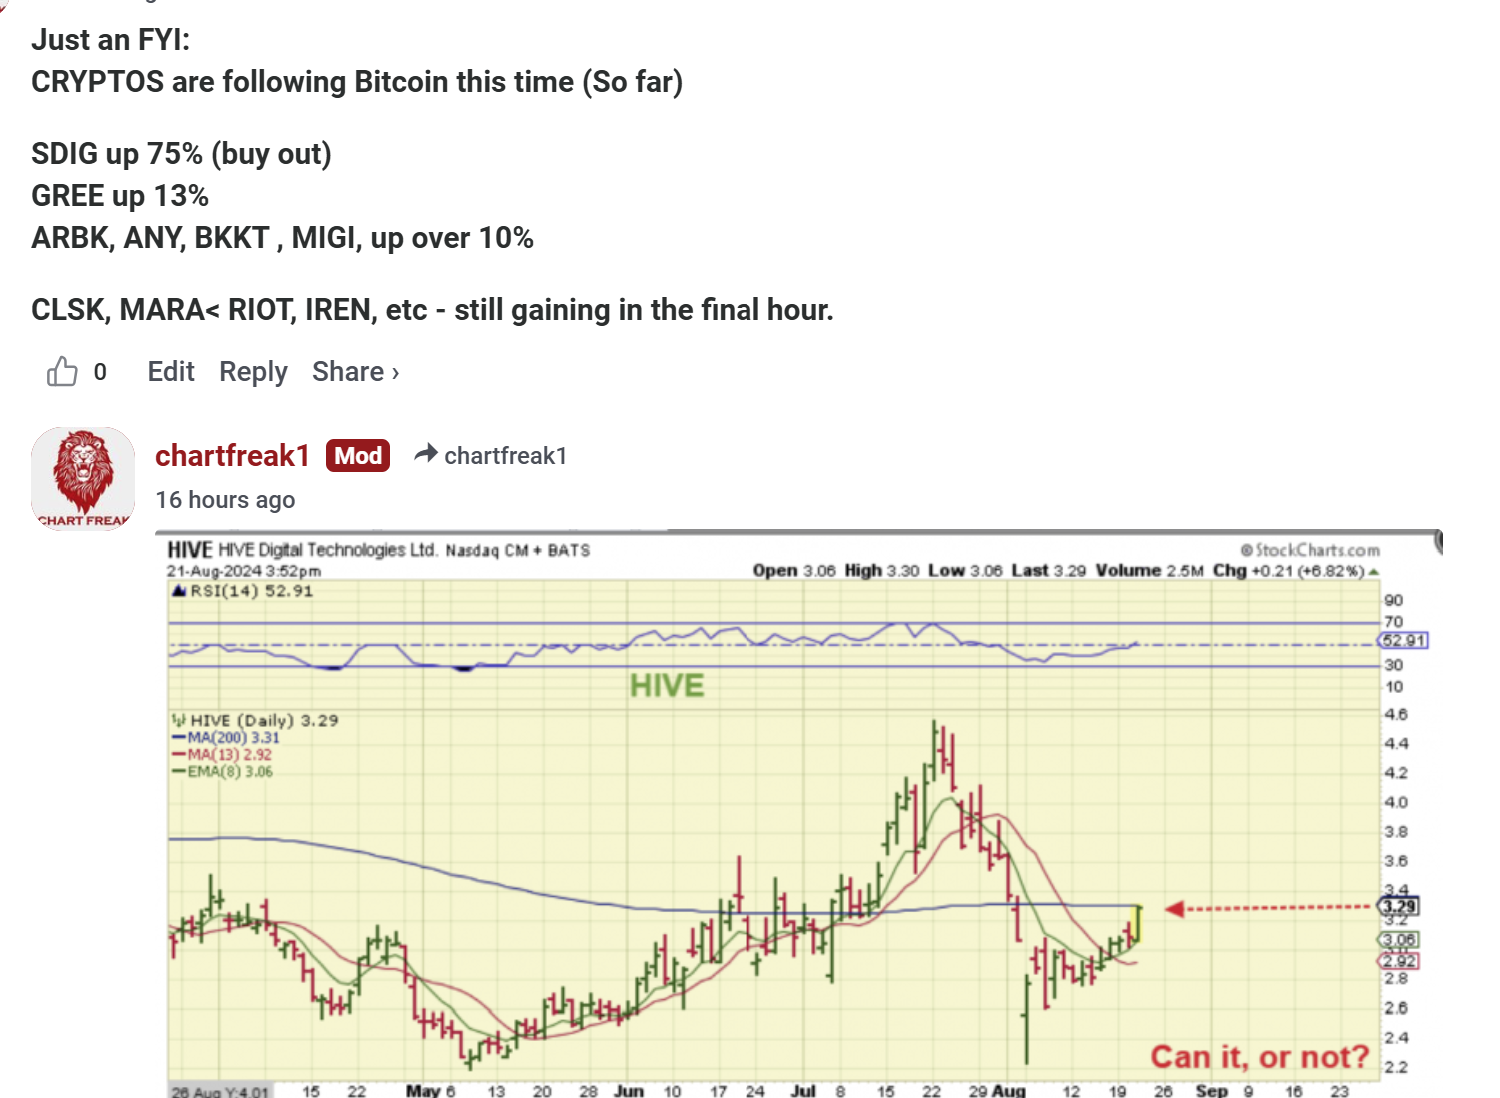
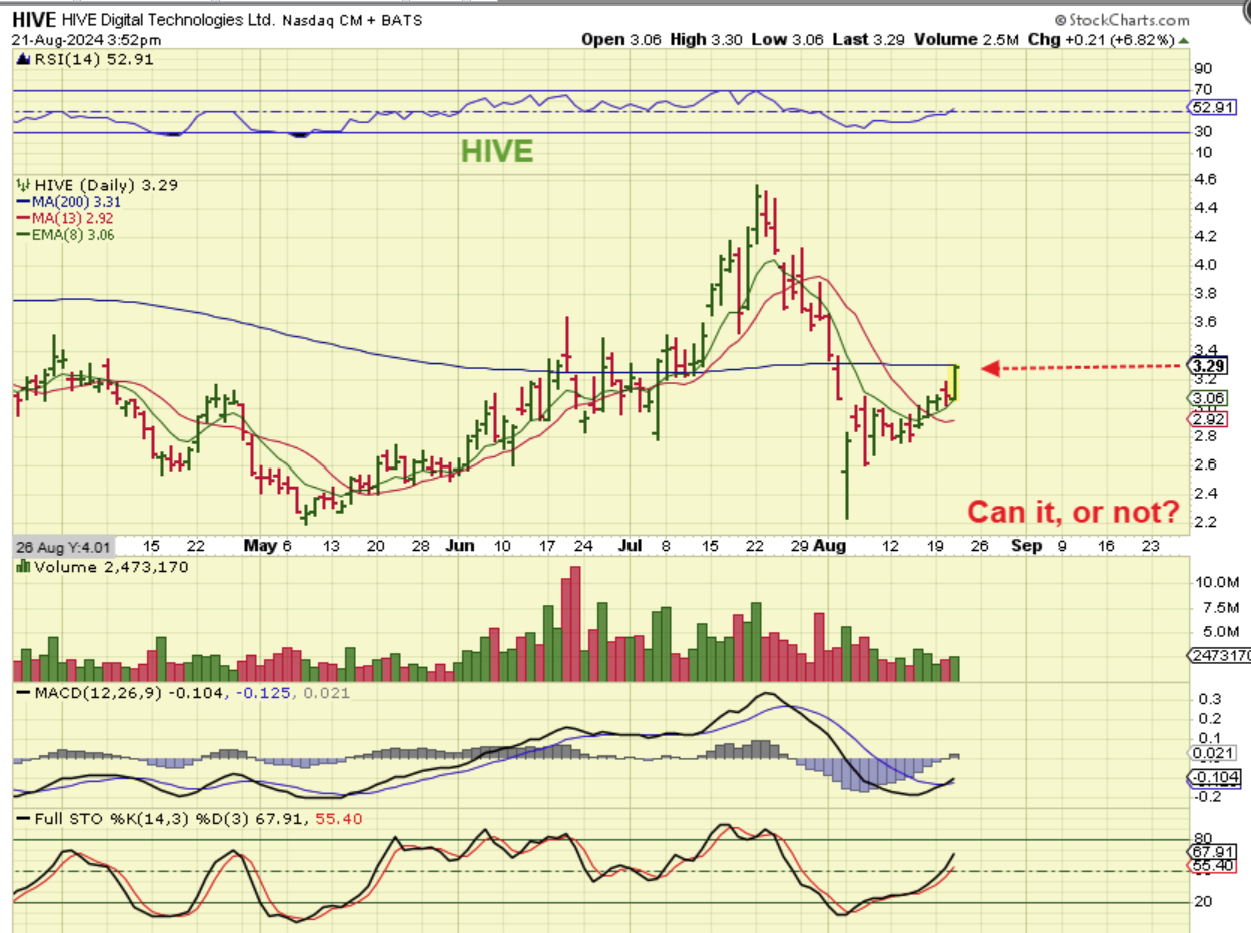
So with HIVE : It was also slowly climbing higher and then suddenly it took off yesterday to the resistance of the 200sma. Again, these are rough and choppy, but they do seem to be perking up after the capitulation type low in Bitcoin.
.
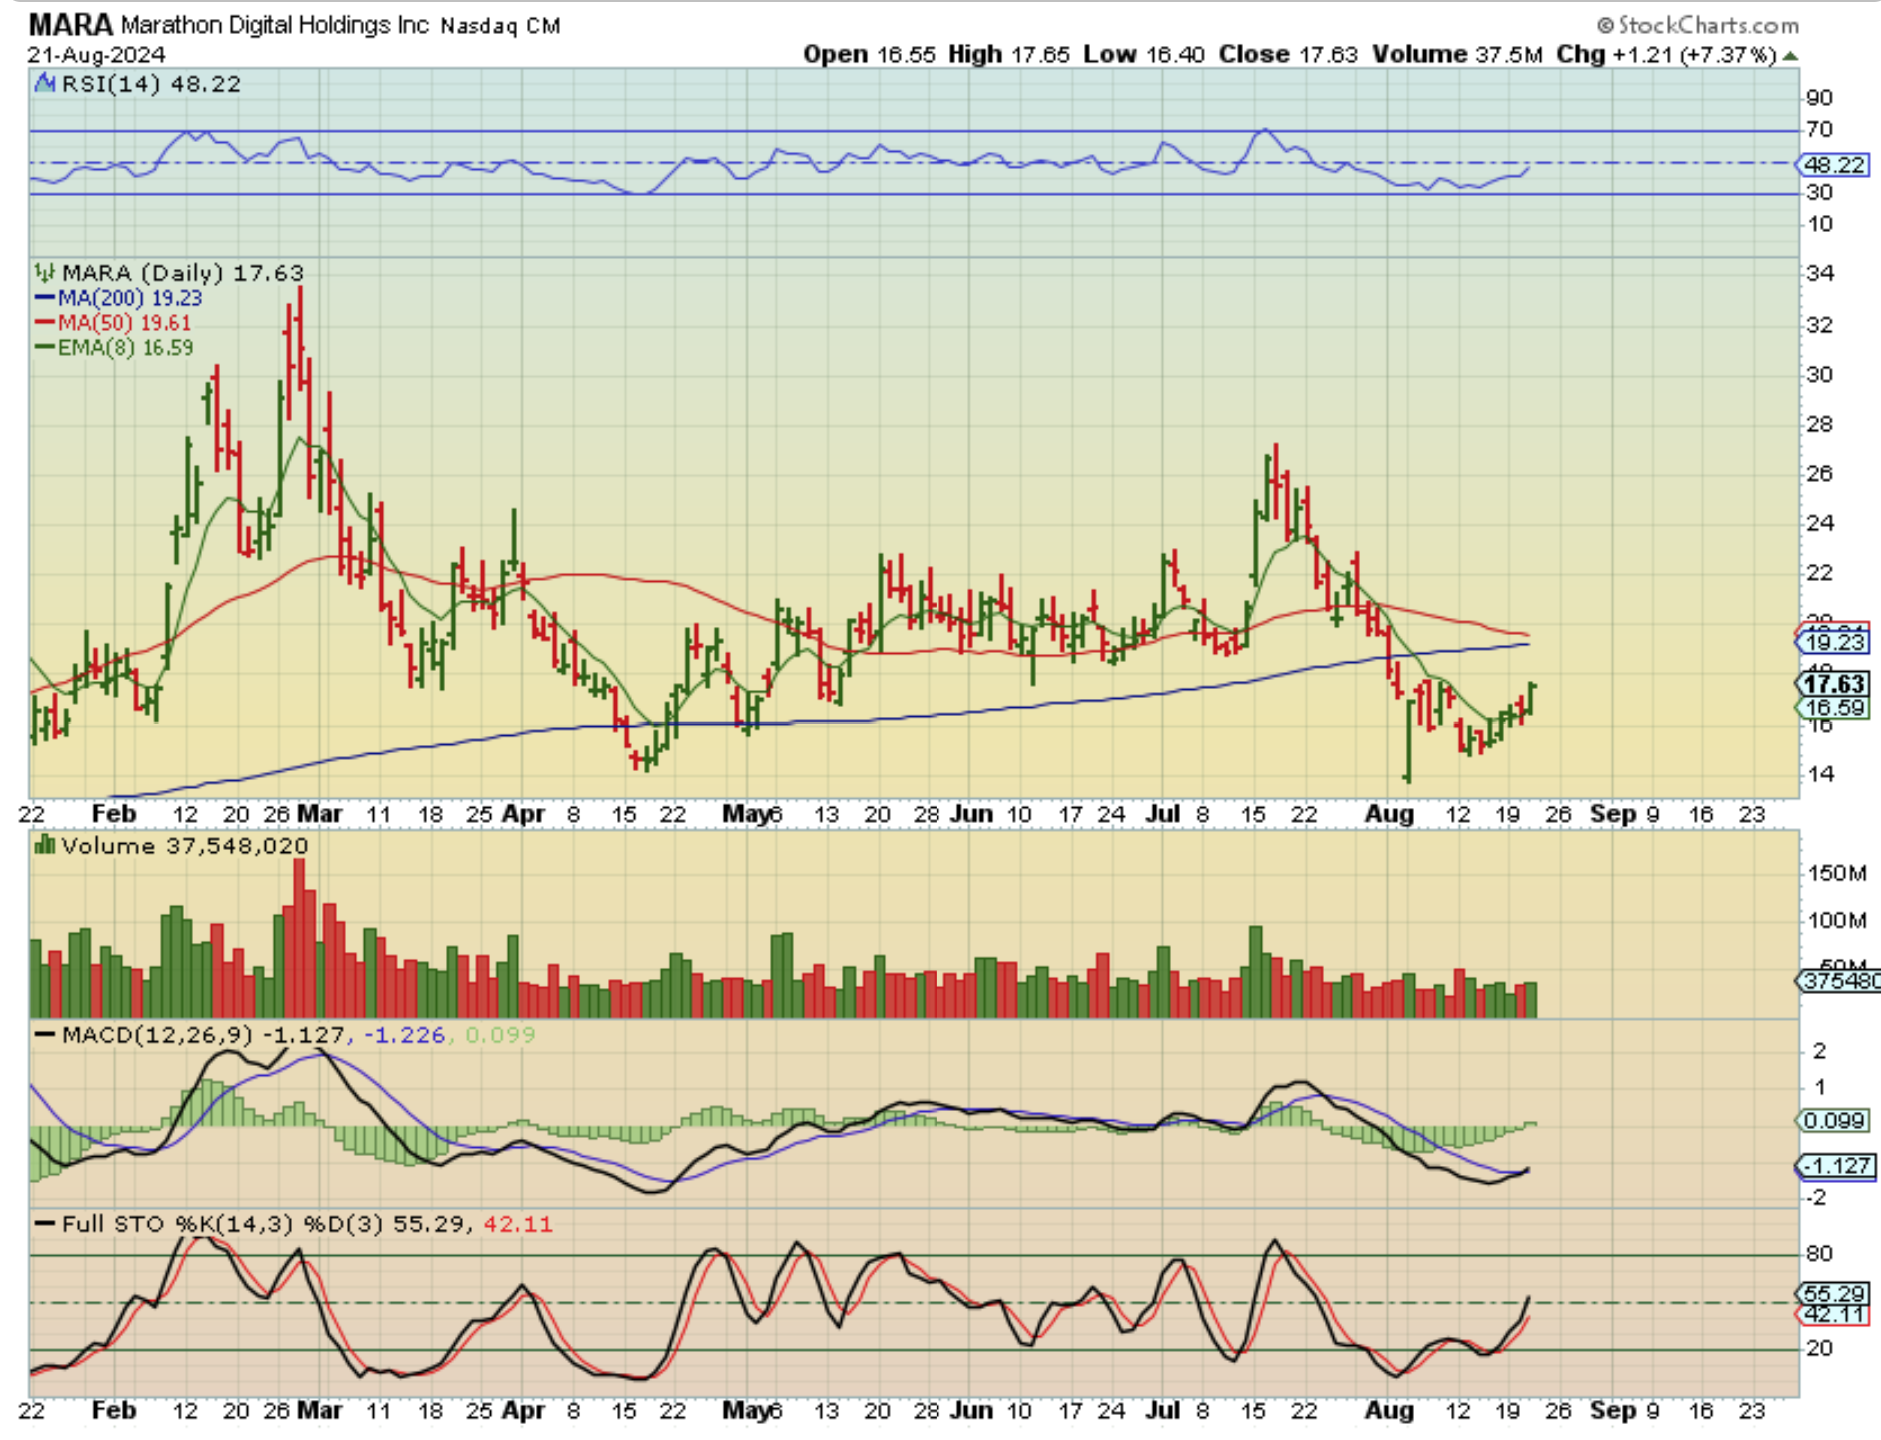
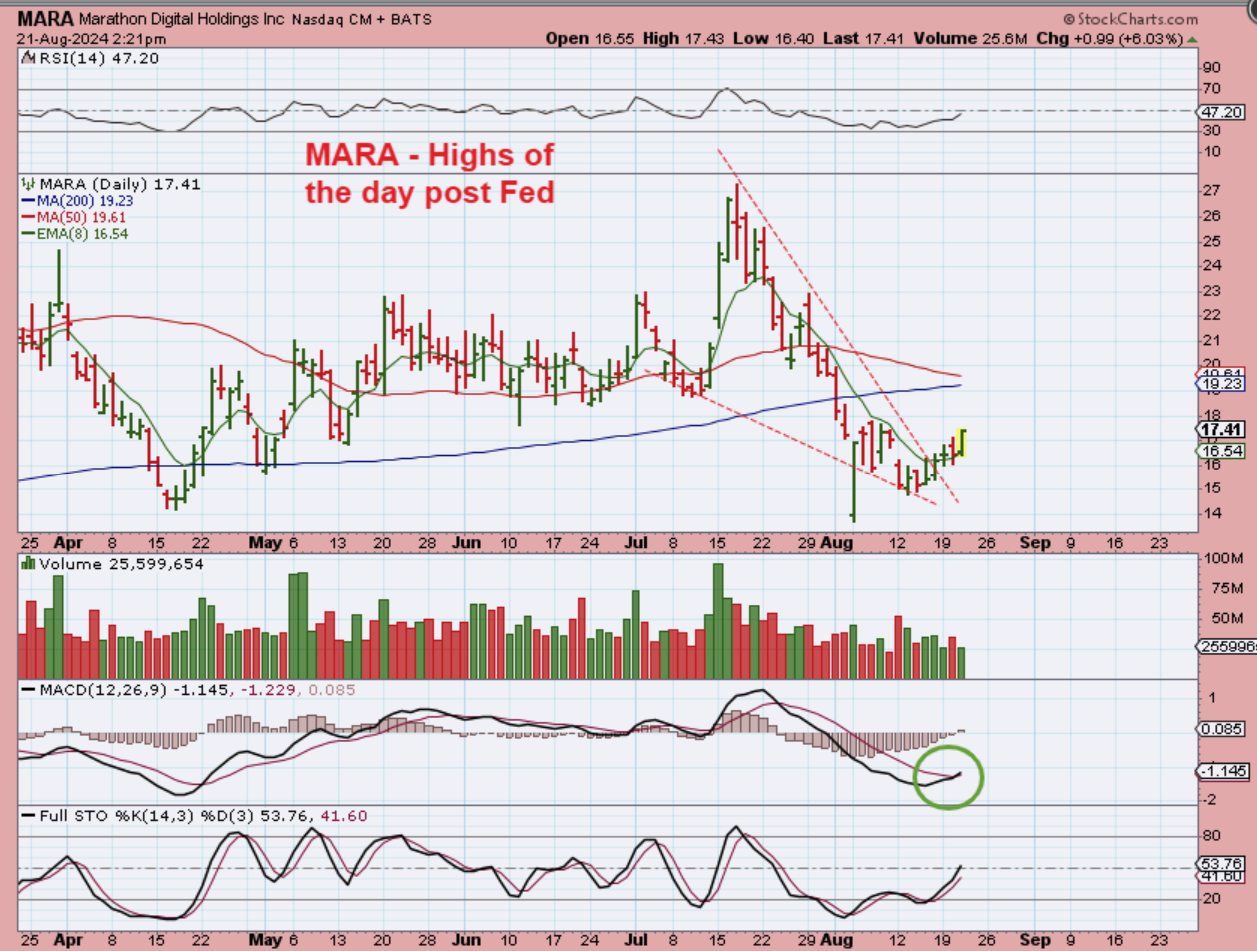
MARA, RIOT, CLSK, etc are still at the lows, but may be perking up too. I know that I have skilled traders here that trade these, so this is the heads up that they are improving (at least for now–always use caution with these).
.
MARA and those others actually jumped after the Fed Minutes were released, because Bitcoin was breaking higher, so I captured this and posted it. How did it close?
.
MARA closed up over 7% and near the highs of the days. These are a VERY hard buy & hold, so I do have a hard time recommending them without a little warning–these are NOT for everyone, but they do often double & triple if you catch them near the lows and Bitcoin rallies. I start small to see how they are acting, and then I add later if they keep acting correctly.