Wednesday August 7th – A Weak Bounce?
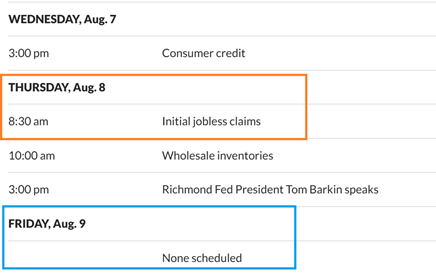
The DATA is light this week, and Wednesdays’ report doesn’t even come out until 3 p.m., but Thursdays Data is more important, and it could turn the markets lower again.
,
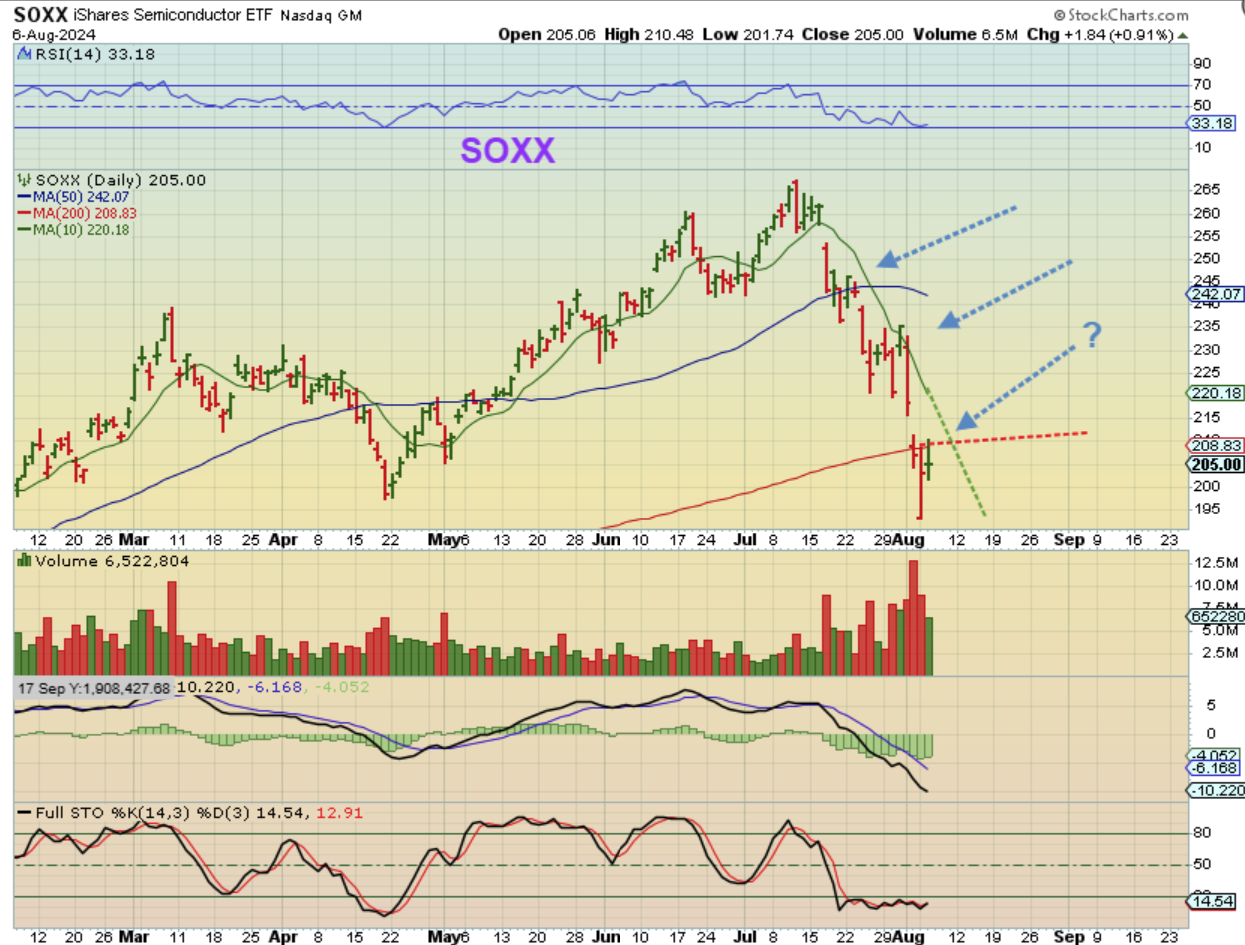
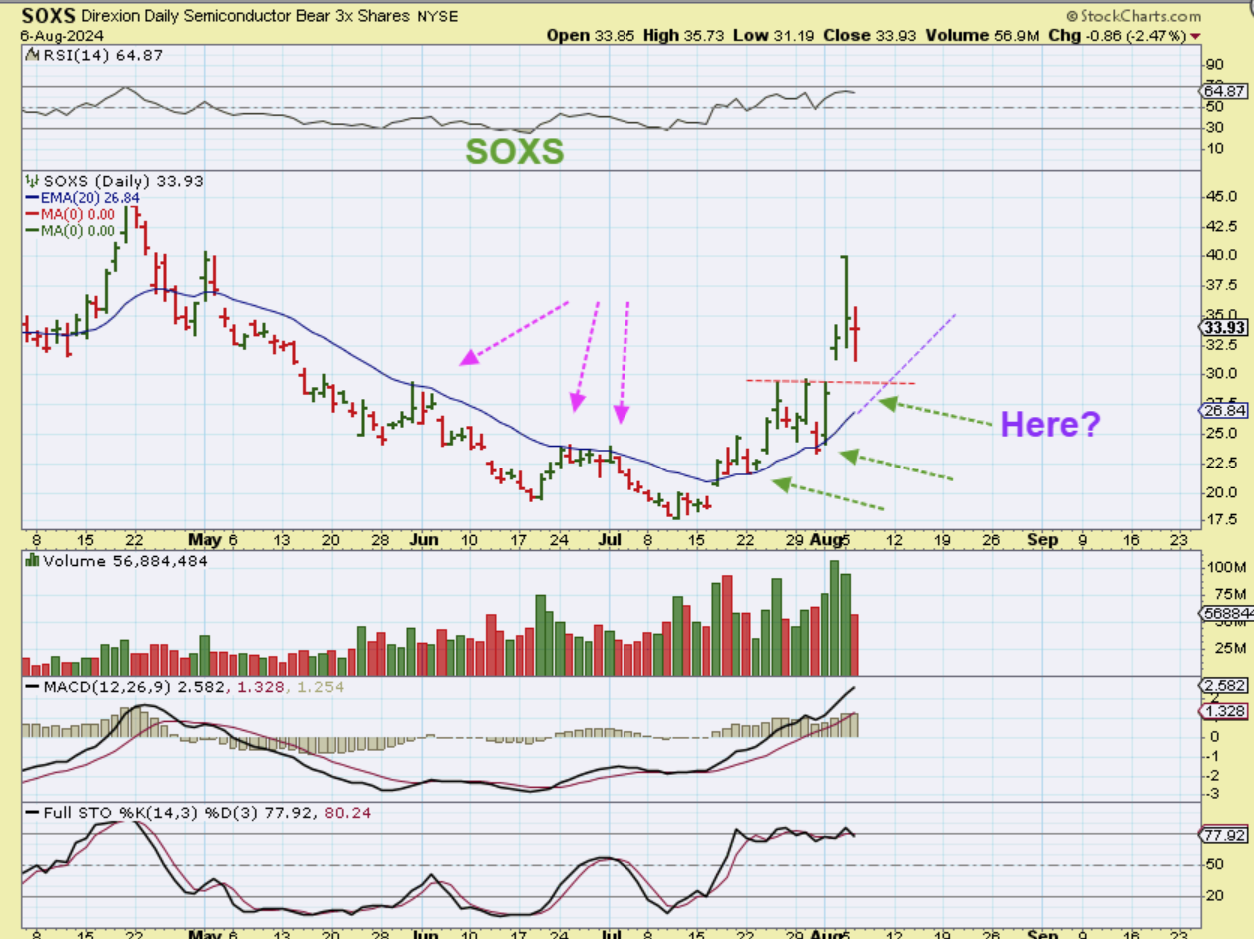
The SOXX moved higher Tuesday, but it sold off in the final hour of trading, so we have a rejection at the 200 sma at this point. If we do something similar on Wednesday, we could crawl over to resistance and POSSIBLY set up for a place to try to go ‘short’.
,
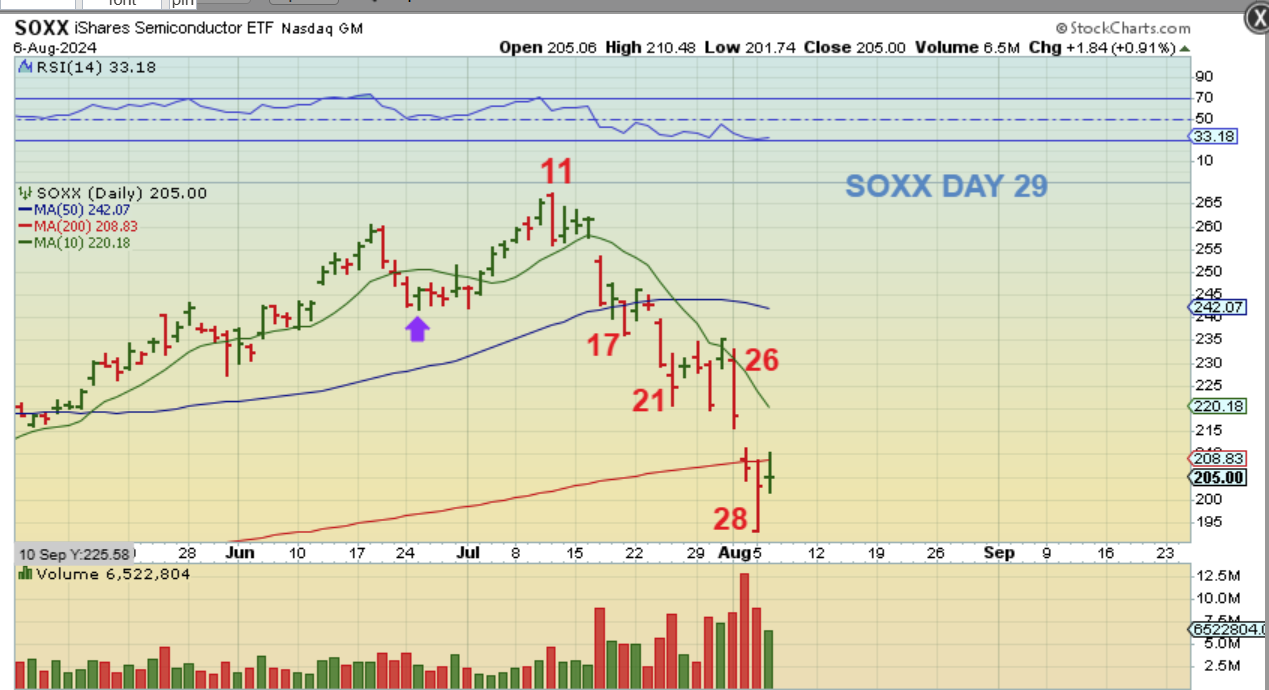
With The SOXX I have mentioned that it looks like the 10sma bent lower at June 25th, so I marked the dcl there and it ‘failed’ on day 16. Now we would only be on day 29 and the General Markets can put in daily cycles of 35-50 days at times, but that is usually a bull run higher. I would say that we could see a dcl around day 36 or so. That means we could sell off again soon.
,
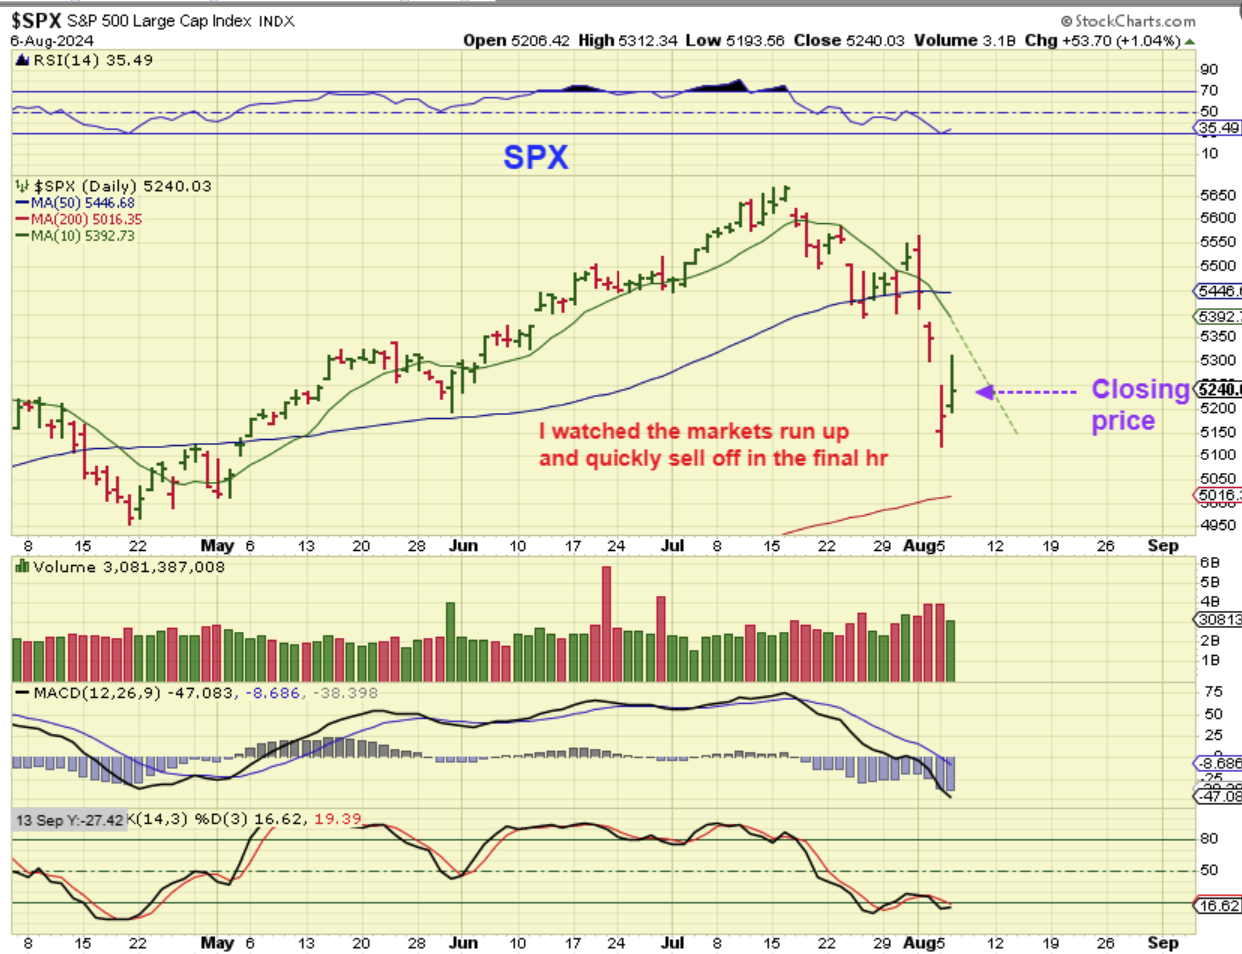
I watched The SPX & QQQ rally slowly higher all day long, but in the final hour I saw (intraday) a sell down, a bounce, and another sell down. You can see that this sell off took back half of Tuesdays gains or candle. This made the SOXS look kind of bullish, so I grabbed an intraday chart of the SOXS…
.
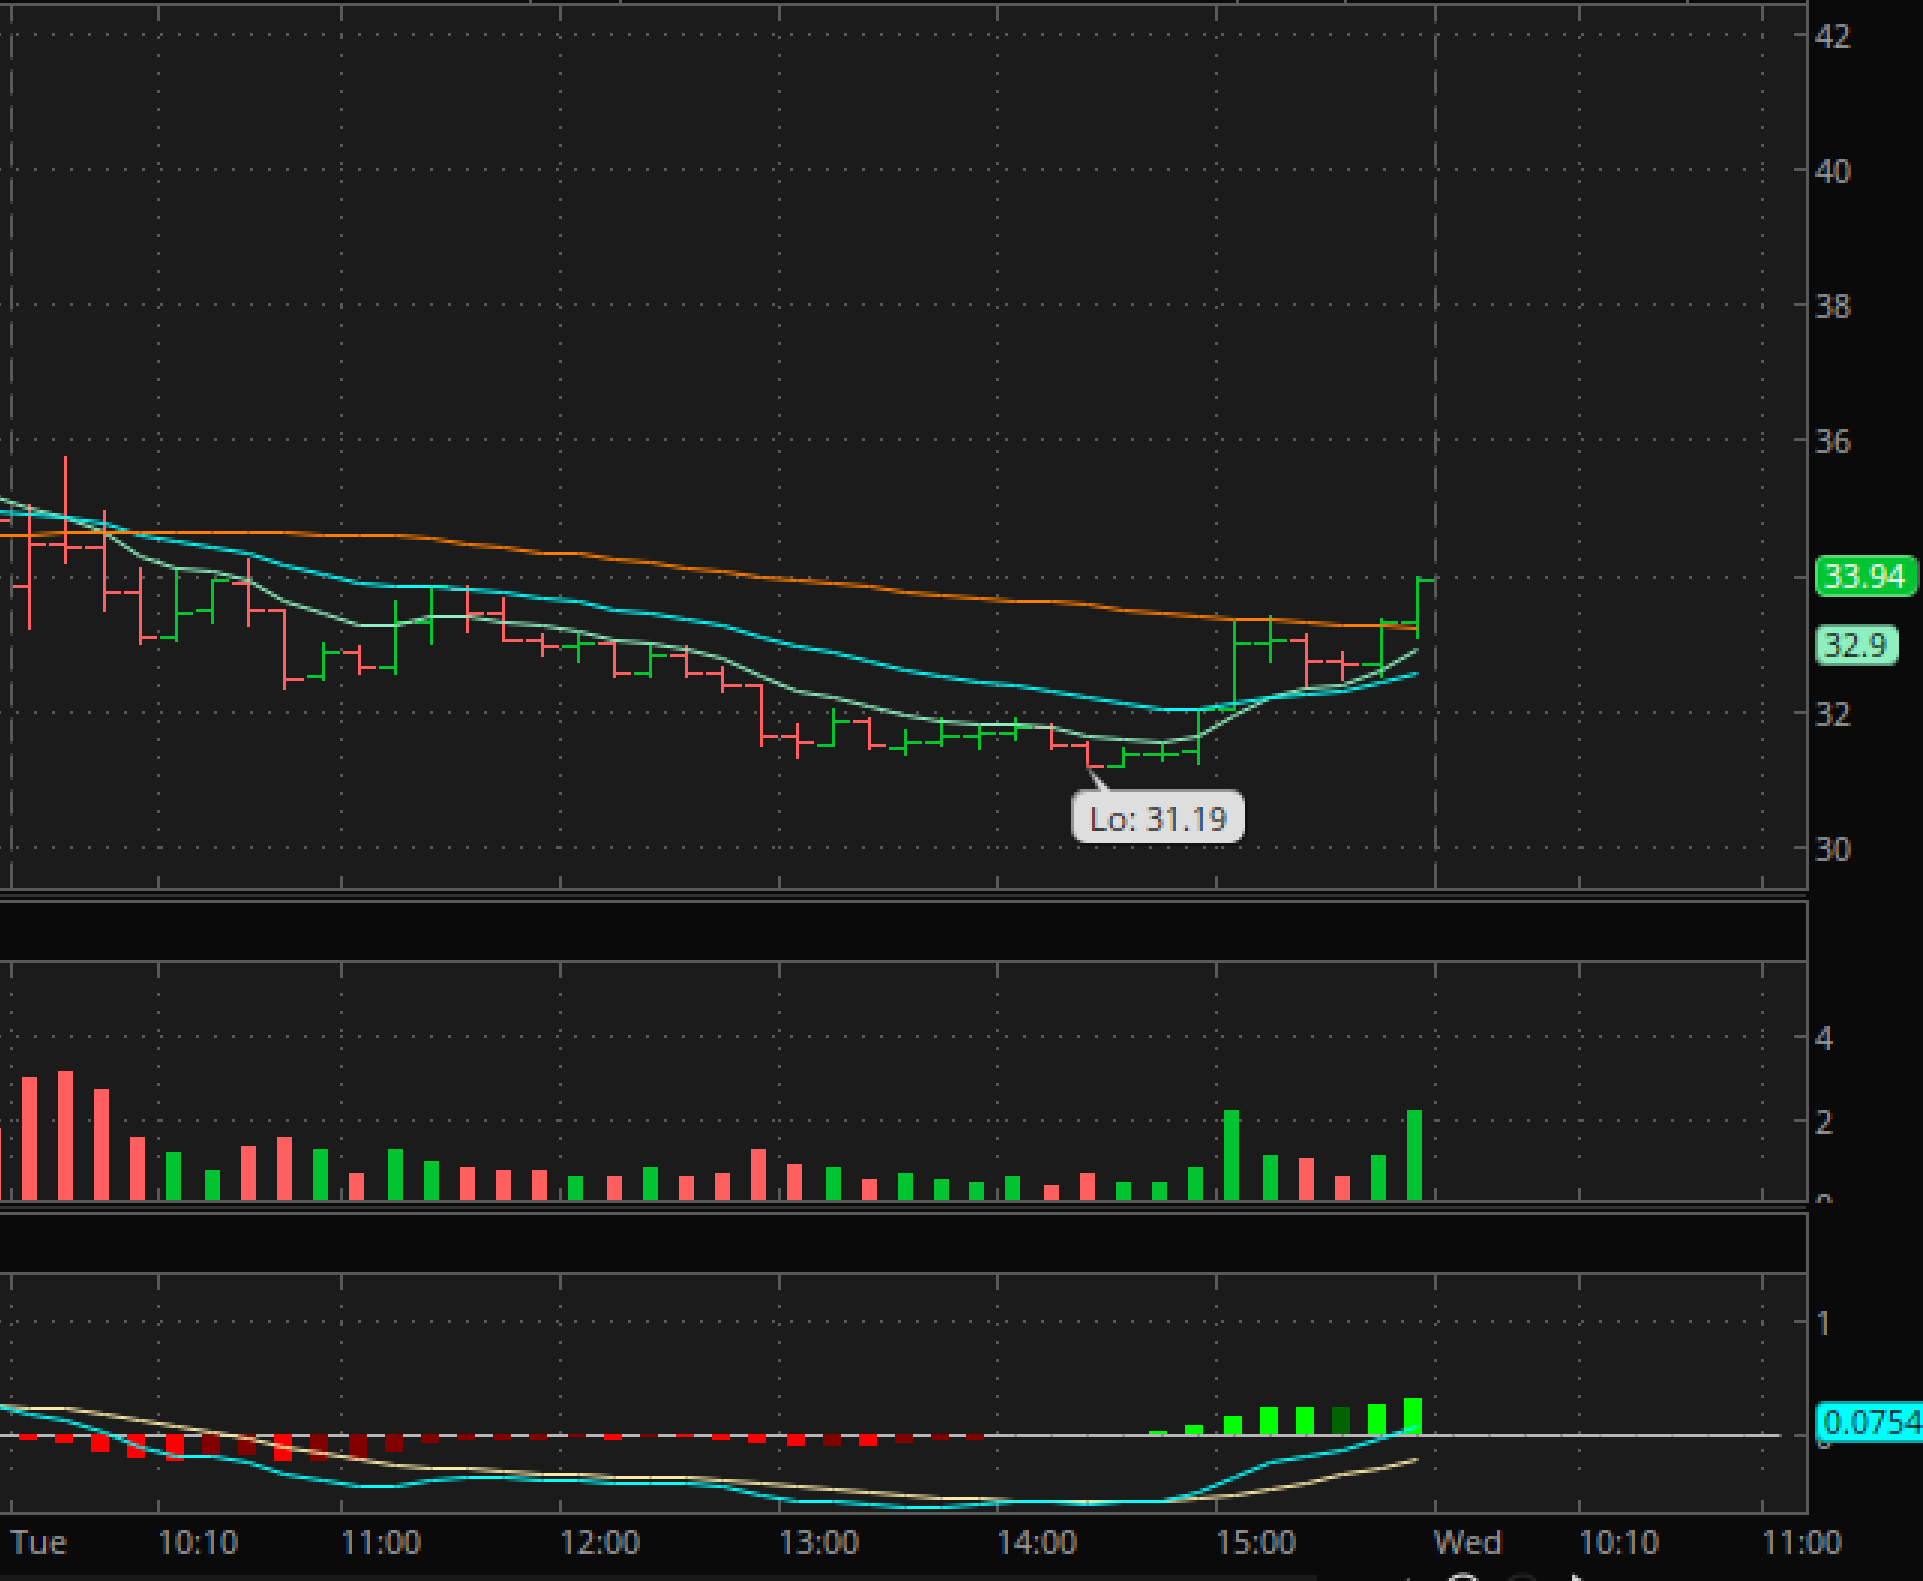
In the final hour I saw a market sell down, a bounce, and another sell down, so the SOXS and SQQQ made a run up, and then a dip to support, and then another bounce higher. That is seen on this chart. This made the SOXS look kind of bullish as it ‘bounced’ from $31 to $34. I almost bought this, but I didn’t. I hope that the market sell off does not continue tomorrow from here…
,
SOXS DAILY: What I am hoping for is a drop to the 20ema as a gap fill and then some kind of a reversal. This would require a move higher on Wednesday.
.
TUESDAY I POSTED THIS CHART AND SAID:
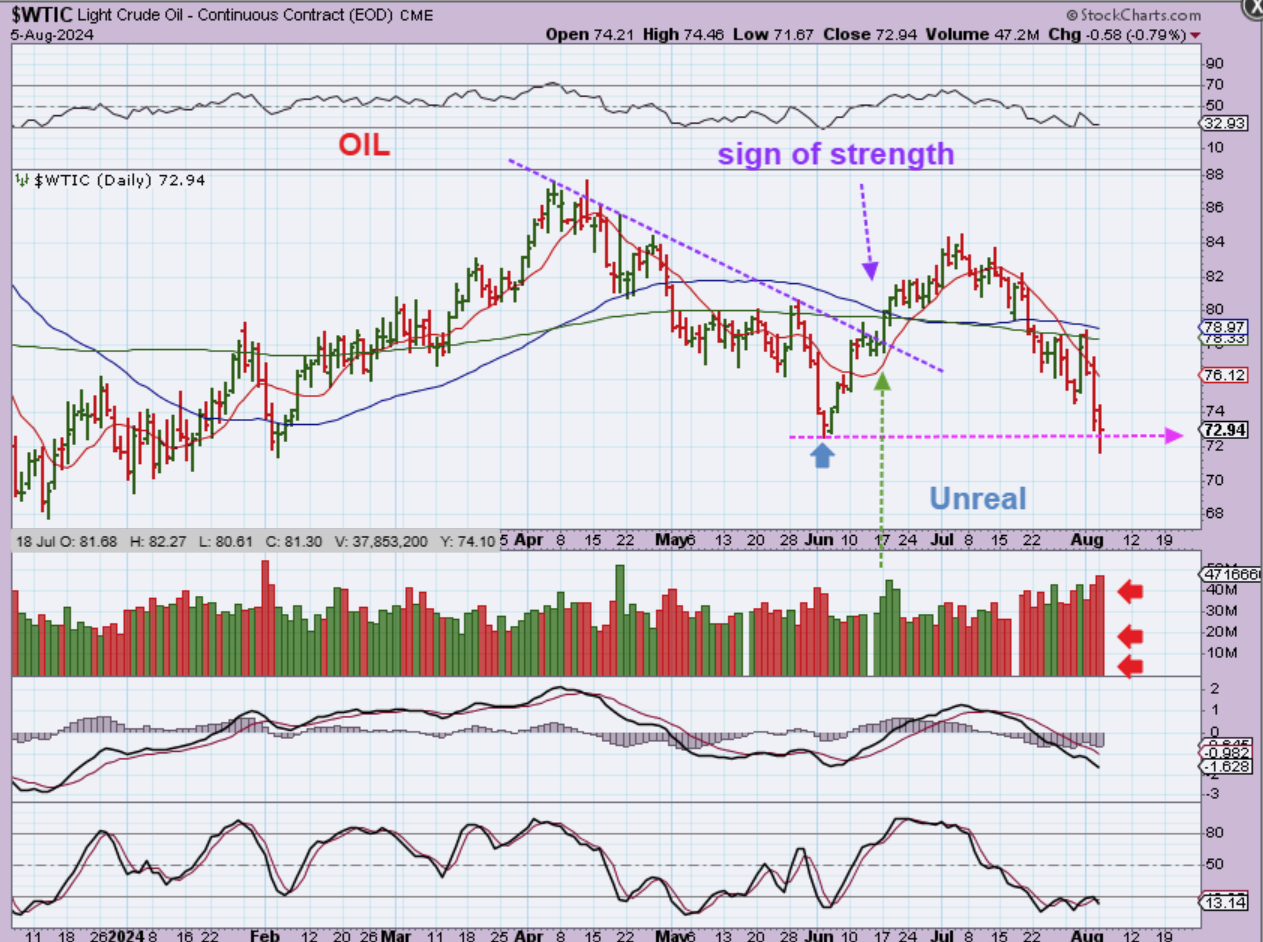
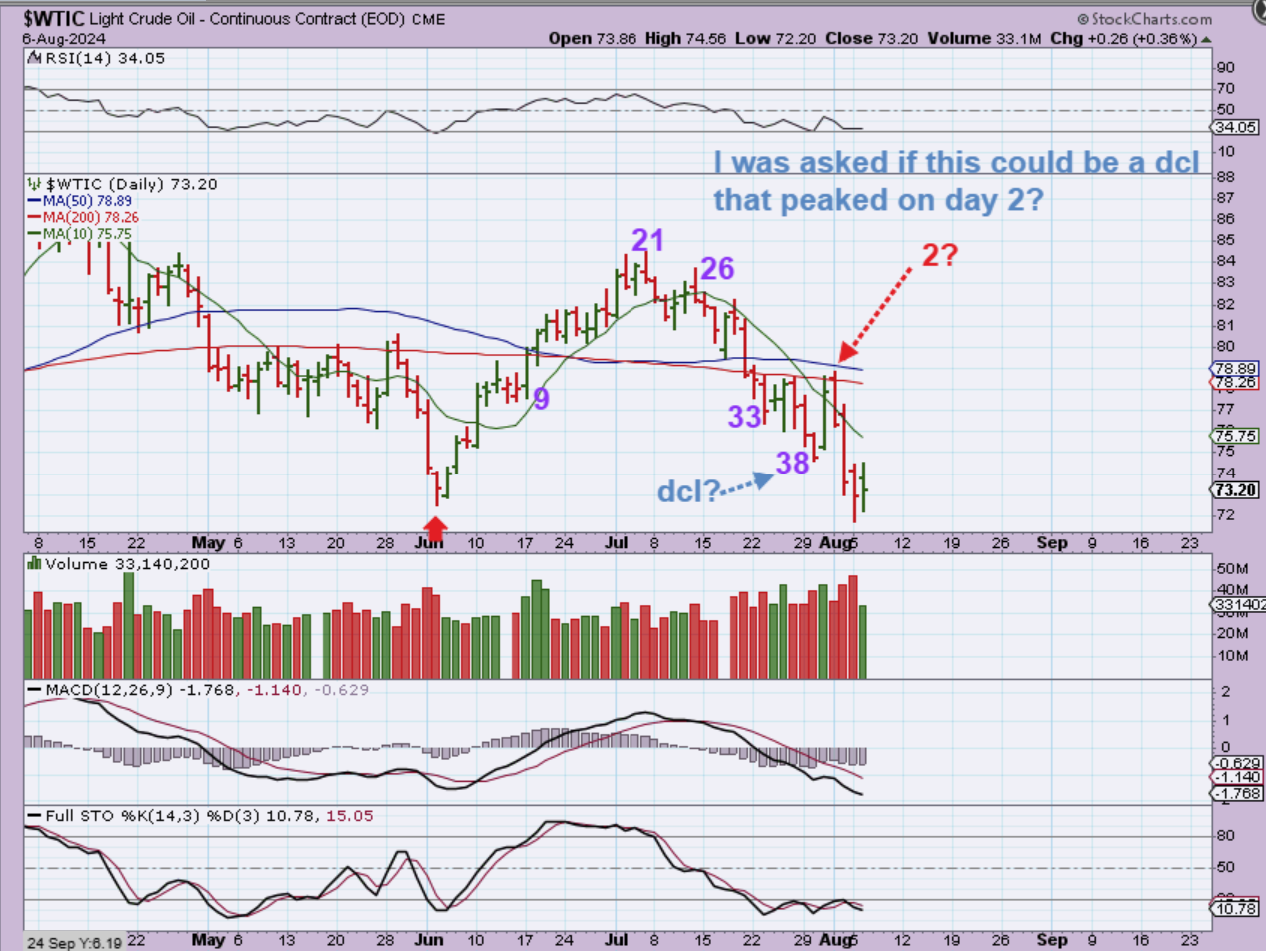
WTIC: This is also deeper than it should have been, so it seems like EVERYTHING that we usually cover in the reports is getting caught up in the selling. Normal cycle patterns are being broken. The ICL was taken out, BUT…
.
WTIC – I was asked if that might now be all one daily cycle, could we be in the 2nd daily cycle as drawn here.
1. I just really don’t think that we had a day 38 dcl (they do come in at day 50 at times), but
2. I CANNOT rule it out. Day 38 is NOT too early, but a day 2 peak and break of the ICL would give us over 30 more days of possible downside? THAT seems unlikely. So…
3. It seems that we are on day 43 and close to a low.
,
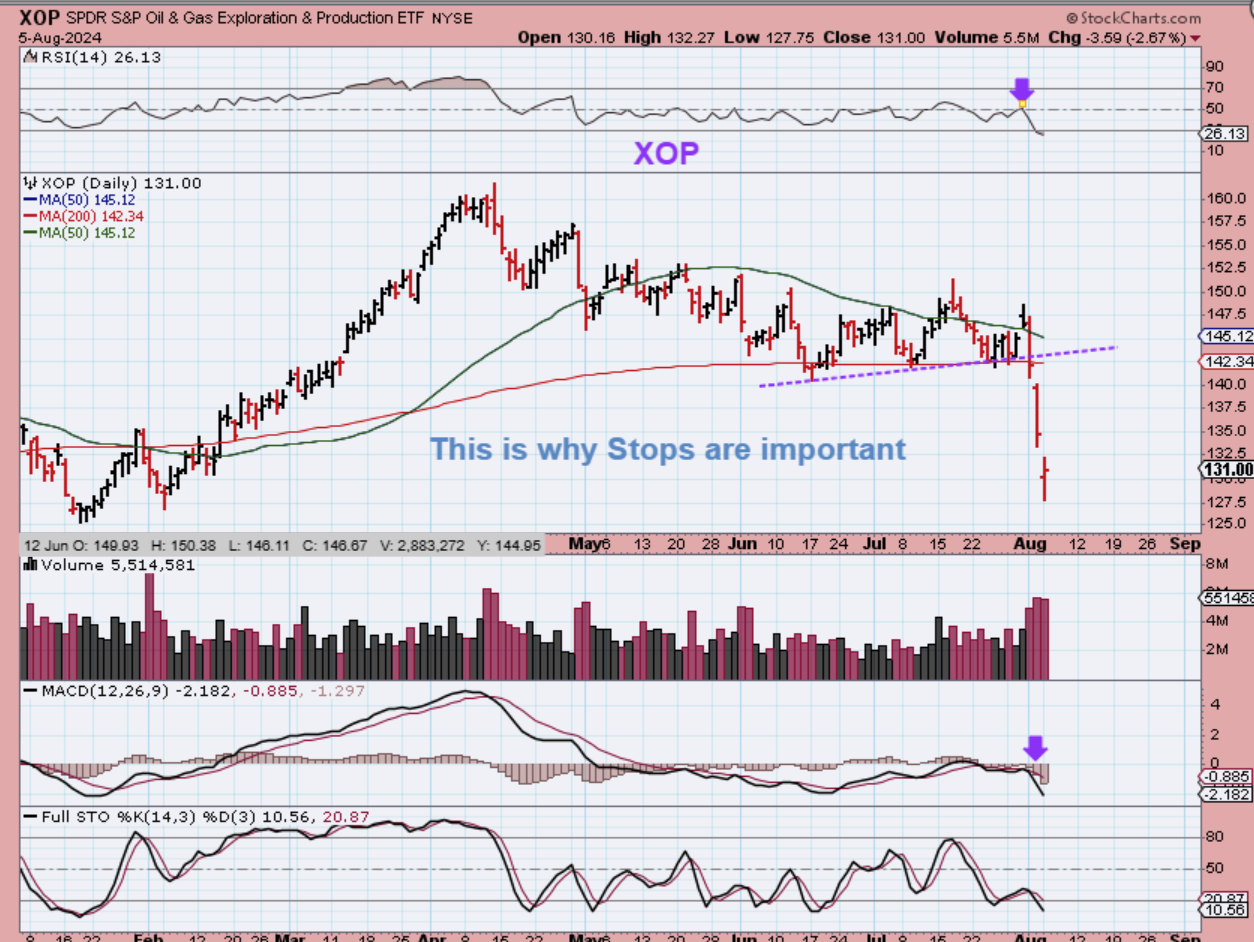
YESTERDAY I POSTED THIS TO SHOW THAT OIL STOCKS GOT CAUGHT UP IN THAT 3 DAY SELL OFF TOO: Nothing has changed here.
The Oil Stocks, represented here by THE XOP got caught up in the CRASH MODE too. Each chart that we look at had a bad Thursday, a crash Friday, and some Follow through selling Monday. 3 days of deep selling.
.
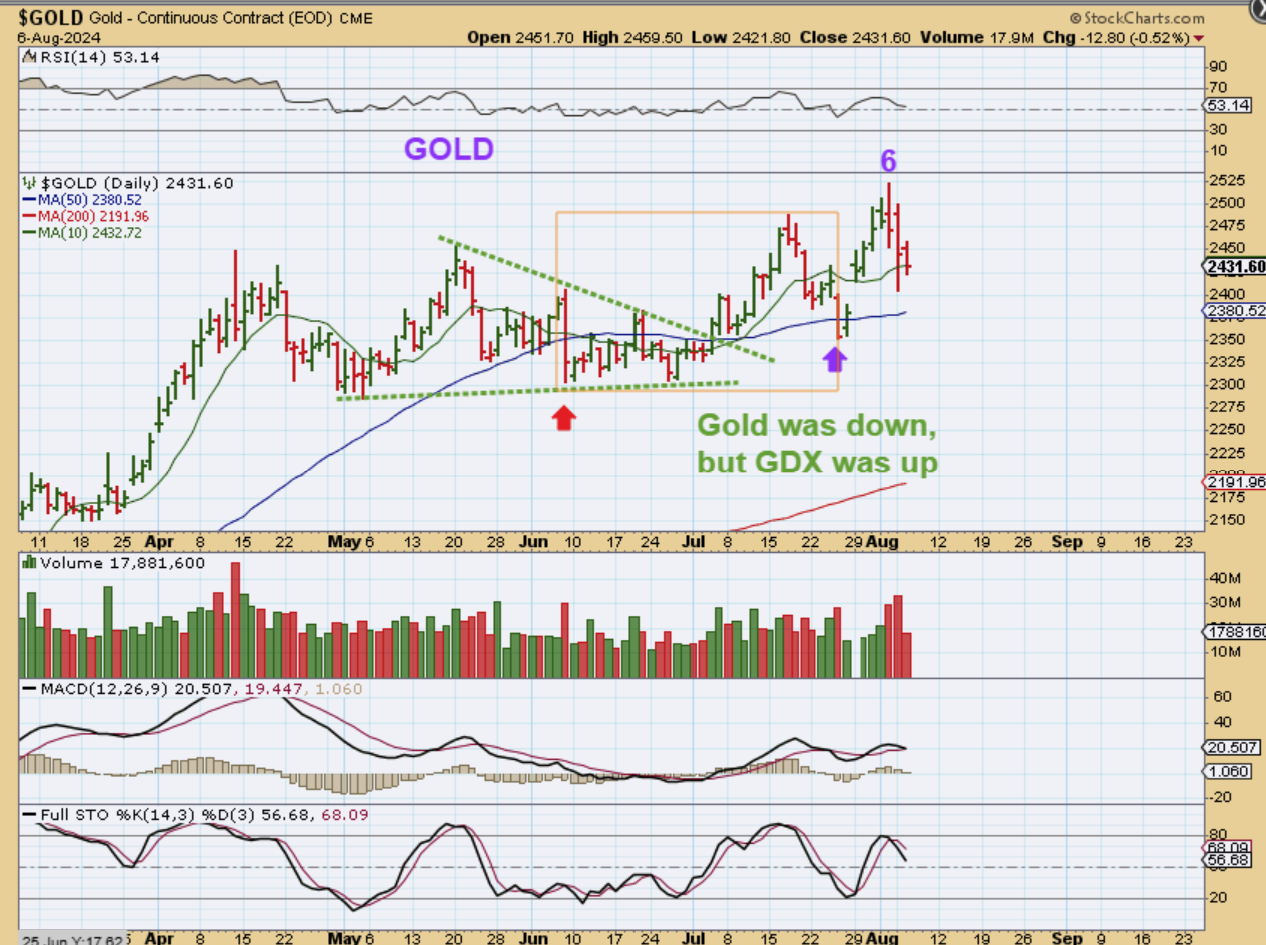
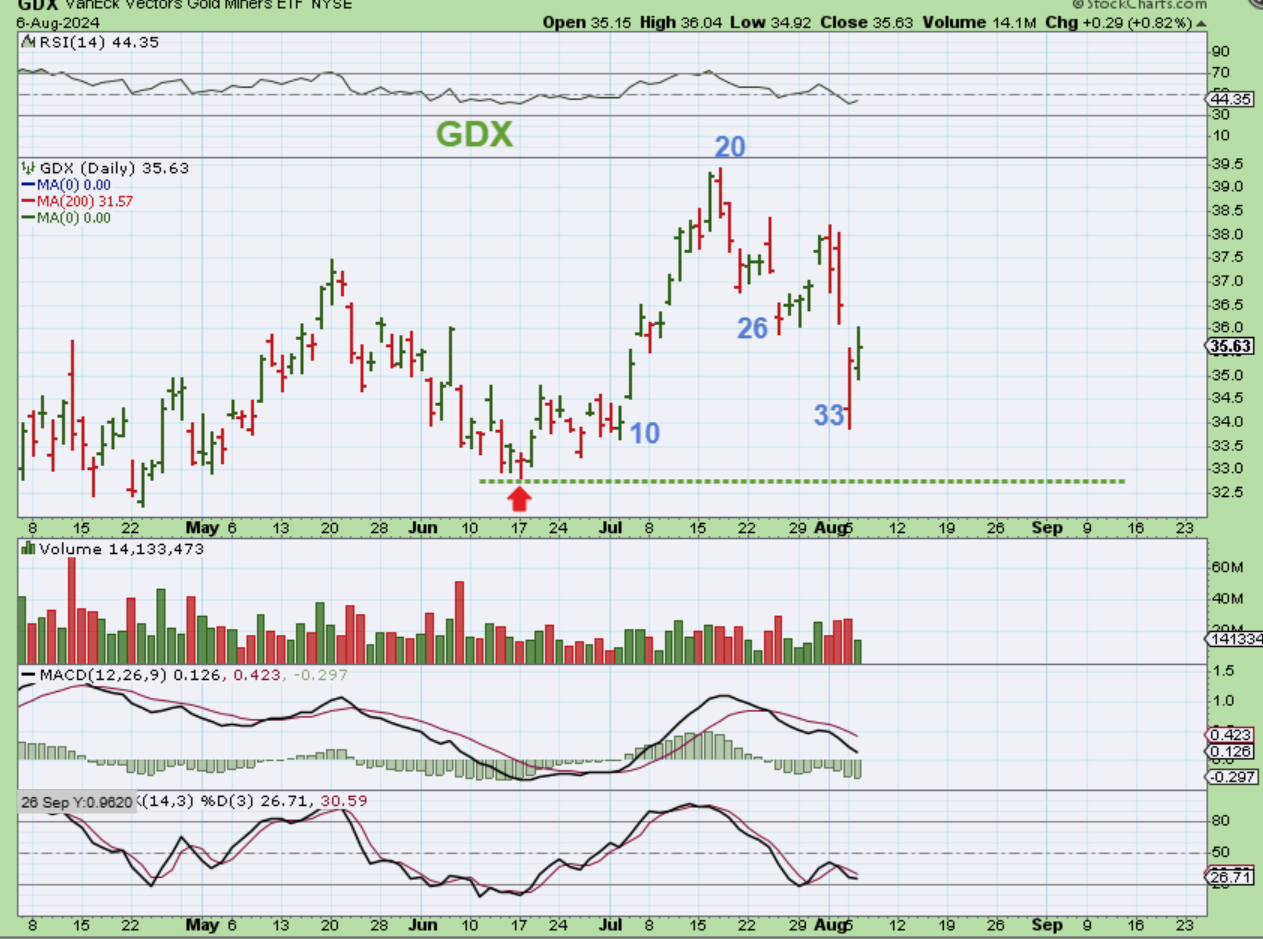
Yesterday I also said that we might have some possible ‘Good News’. That news is that Gold didn’t breakdown, Silver was due for a dip into an ICL, and the sector as a whole is not damaged at this point. Let’s take another look.
.
GOLD looks to be on day 8 and it dropped $13 on Tuesday, but interestingly – Many Miners were green.
,
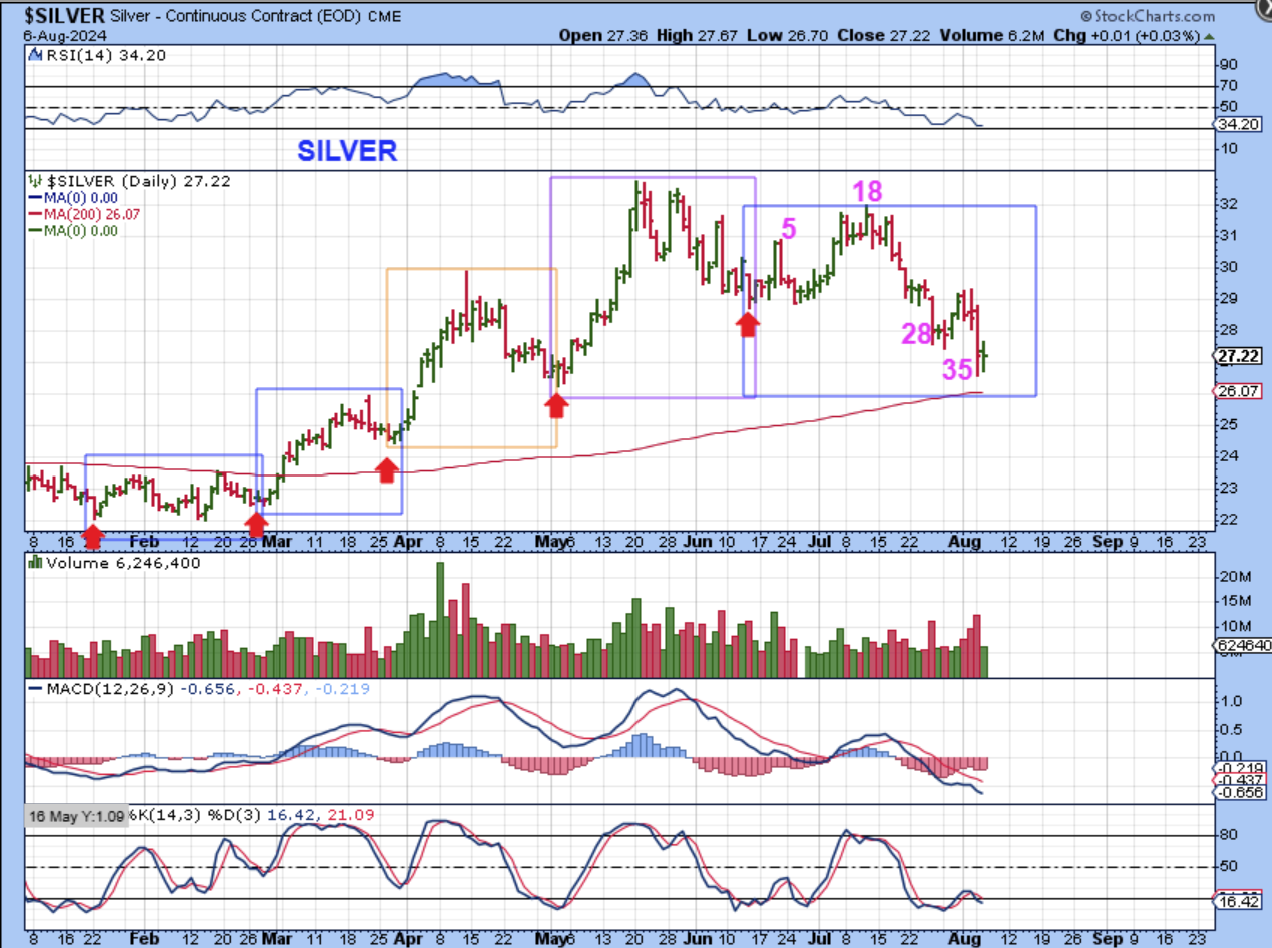
SILVER now has a low on day 35 and it really should be putting in a dcl or ICL very soon.
,
GDX has a day 33 low and was moving higher yesterday, while Gold was red and Silver was only up 1 penny. This is the timing that a dcl would come due, so Silver and GDX are due to find their next set of lows here.
,
The set ups remain almost the same as they were with my last report, except that Tuesday saw some buying (or short covering). We could see more of that today, but with Jobless Claims Data due out on Thursday, it does make me wonder if the markets will start to sell down again on Thursday. The General Markets are in a ‘failed’ condition cycle-wise. I expected to see a bounce, but how much of a bounce remains to be seen, before a resumption of the selling returns and the General Markets find a final low (the next ICL).
.
I do see the set ups as different in the Precious Metals Markets. Since Gold seems to have an ICL and a higher low dcl, it remains undamaged. Silver should be due for an ICL right now, and it is possible that this sector is holding up and continues to hold up when the next Market drop kicks in. THAT remains to be seen, but at this point, Gold, Silver, and The Miners do seem to be acting somewhat normally. I do still worry about how the Miners will act if we get another General Market plunge. We’ll see what this week brings our way. Enjoy your Wednesday trading.
,
~ALEX
,
I have been looking for a day 30ish low and then a move higher. LET ME REPEAT WHAT I SAID ABOUT BITCOIN IN TUESDAYS REPORT:
.
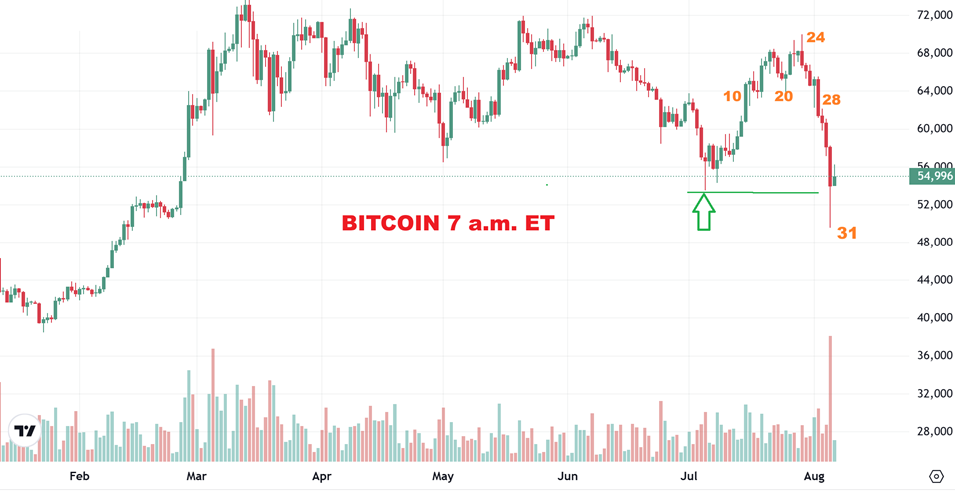
BITCOIN: I don’t like to bend the rules, so I have to point out that Bitcoin DID take out what should have been an ICL. THAT should mean that we could see another lower low by the time we reach the 60 day dcl (& THAT could be the Final low). That said, I will just mention this…
.
Bitcoin broke the lows and at this point it should indicate that day 60 will make even a new lower low later.
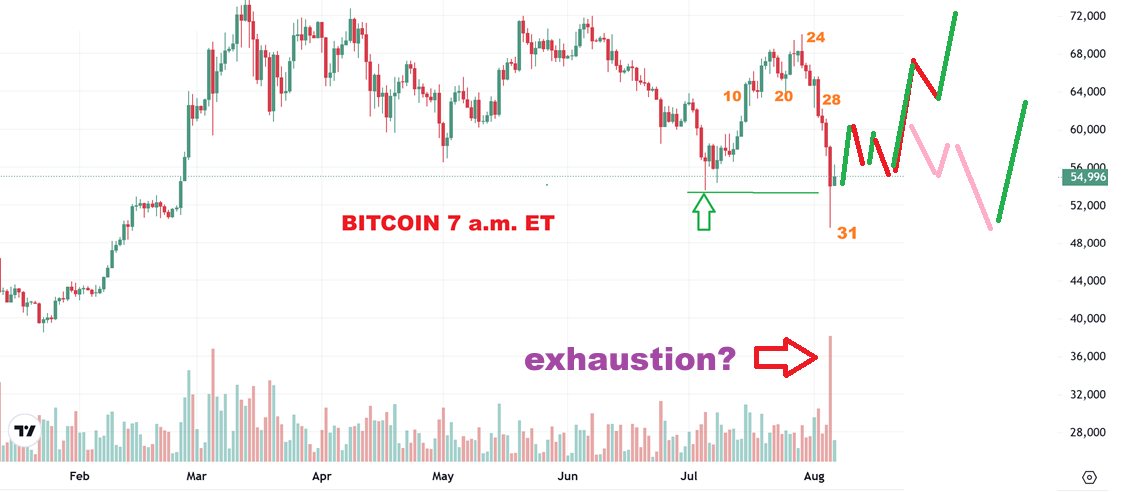
That said, I will just mention that if we just saw a ‘shakeout’, with capitulation / exhaustion volume, there is always a chance that we get an Anomaly or an extremely rare overshoot crash that recovers. I DON’T LIKE TO SPREAD FALSE HOPE, AND I DON’T LIKE TO BREAK THE RULES, but that volume and reversal candle does look like a shakeout.
.
So I am watching Crypto stocks for clues too. I still have to expect another low like the pink path, but I just wanted to point out a very small possibility that we get an anomaly recovery.
.
BITCOIN DAILY 6 a.m. Wednesday: We are seeing the move out of the lows now.
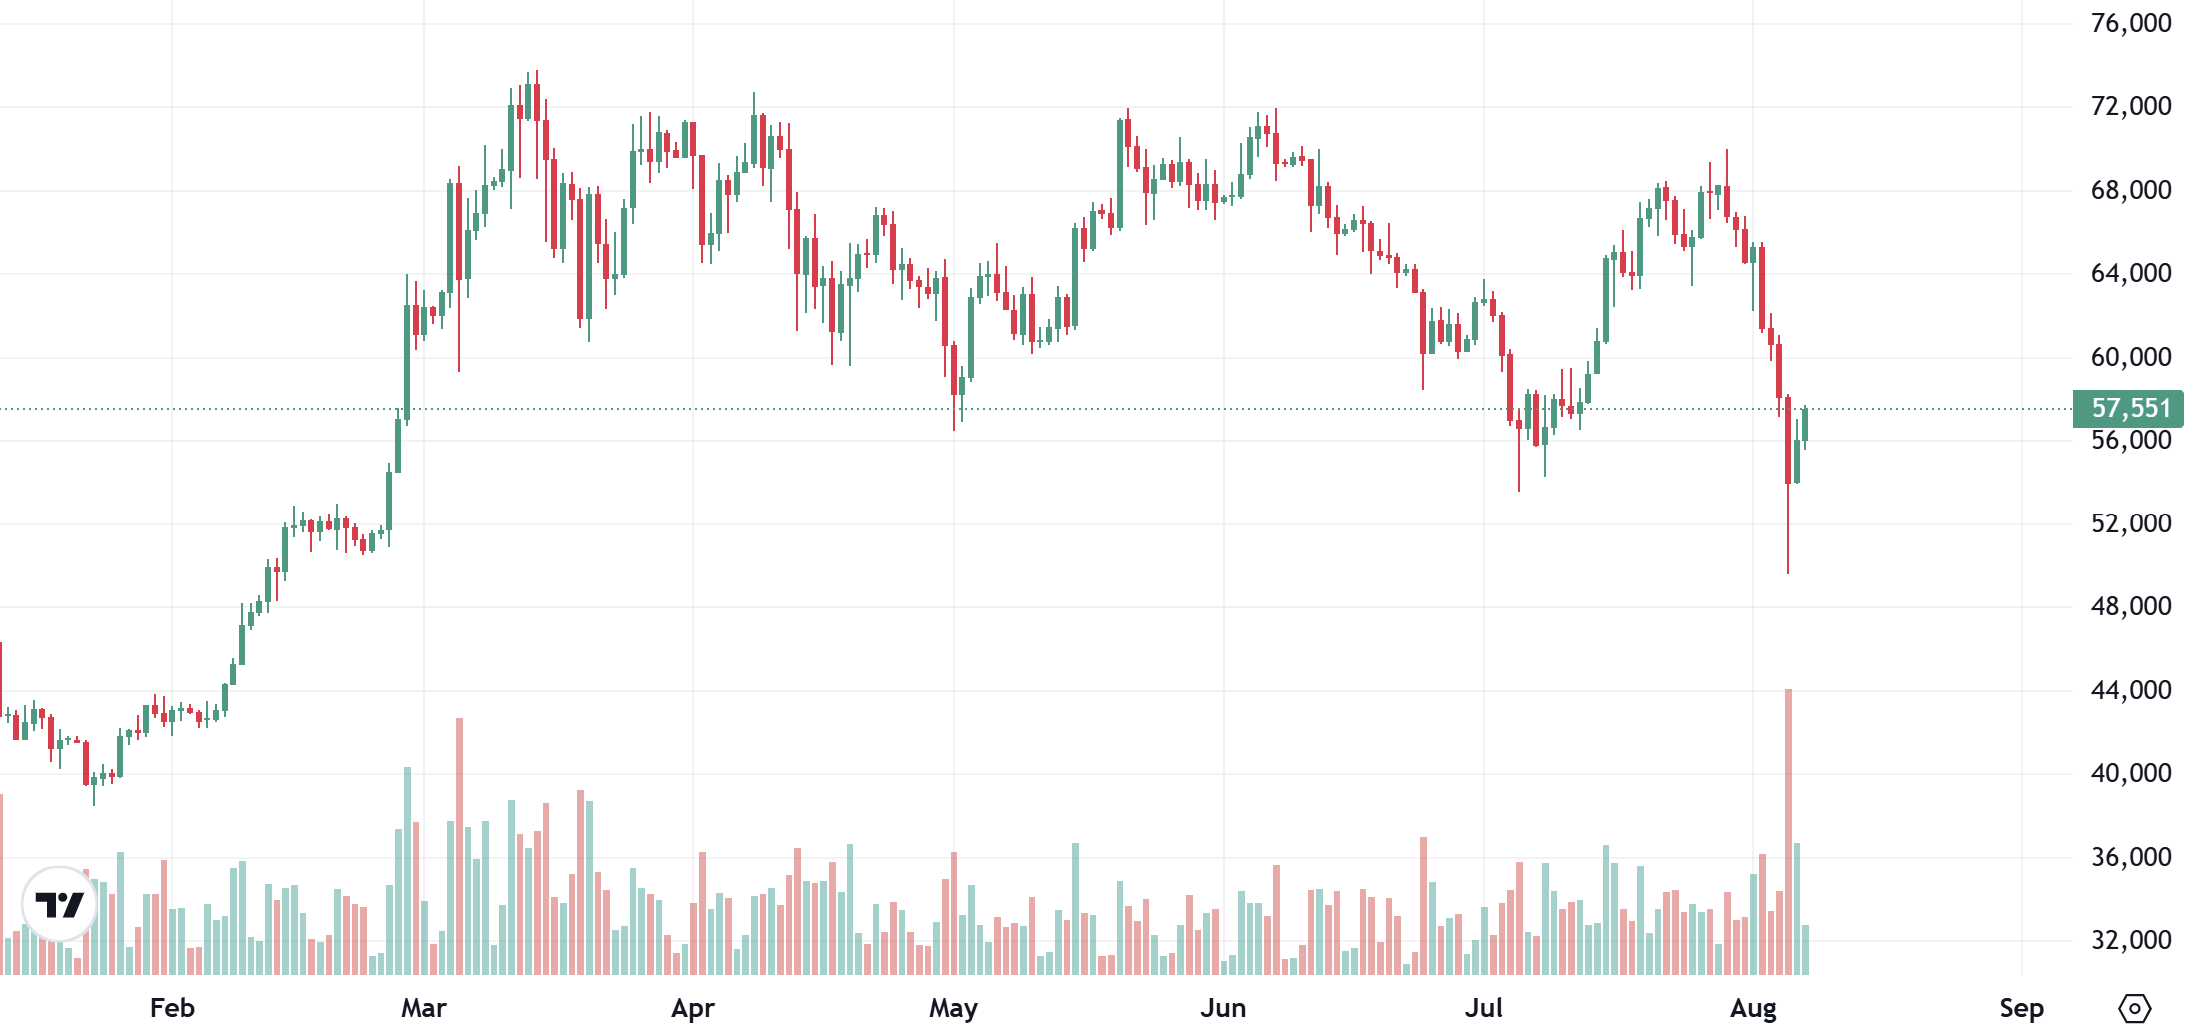
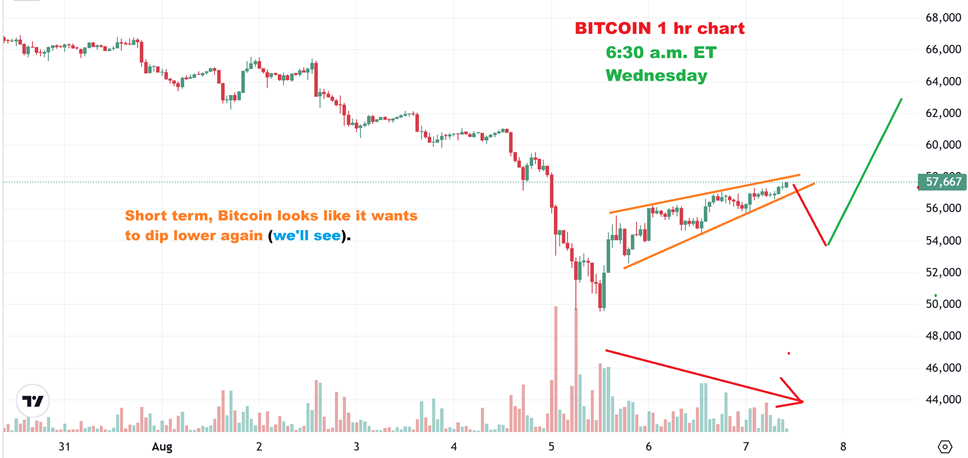
BITCOIN 1 hr chart – As Bitcoin bounces out of the lows here, it needs a burst of volume to push it above the upper trend line of a bearish rising wedge. If that doesn’t happen, we usually see a dip as drawn here, and then a run higher later.
So Bitcoin is at $57,667 as I write, and if it can’t break above roughly $58,500 soon —it could dip lower.