Friday August 2nd – More Volatility
Let’s talk about the Stock Markets’ ugly price action yesterday. The Jobless Claims and PMI report came out and futures moved higher, but after the markets opened and the initial first half hour of buying slowed down, the selling was relentless ALL- DAY- LONG. The General Markets are ugly, but that was expected by me when I saw the SOXX acting bearishly. That said, now some of the Miners, especially the Silver Miners, took a dive too and that needs monitoring. That took place with Gold and Silver not looking all that bad, so we do need to take a look at the set ups and try to see if the Miners can recover or is there a problem in that sector too? By the way, Fridays Data is the Unemployment Report, but the damage is done in the General Markets. Let’s take a look…
.
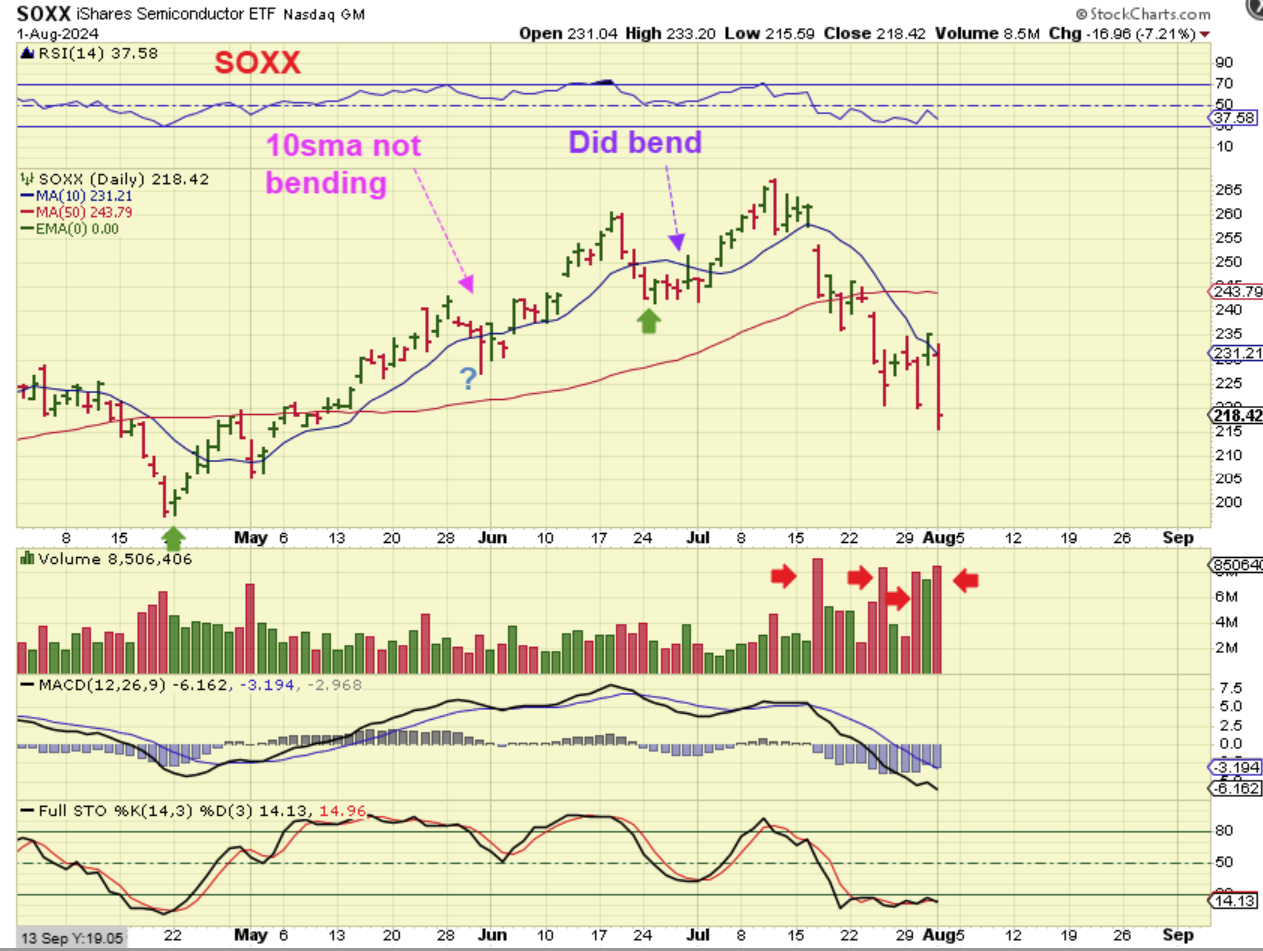
I have repeatedly pointed out that The SOXX looked to have a dcl in late June when the 10sma did dip lower. Recently I said that it no longer matters, because both the Late May dip & the late June dip have been violated as a ‘failure’. The SOXX was a failing daily cycle with ‘bounces’ that lack follow through.
.
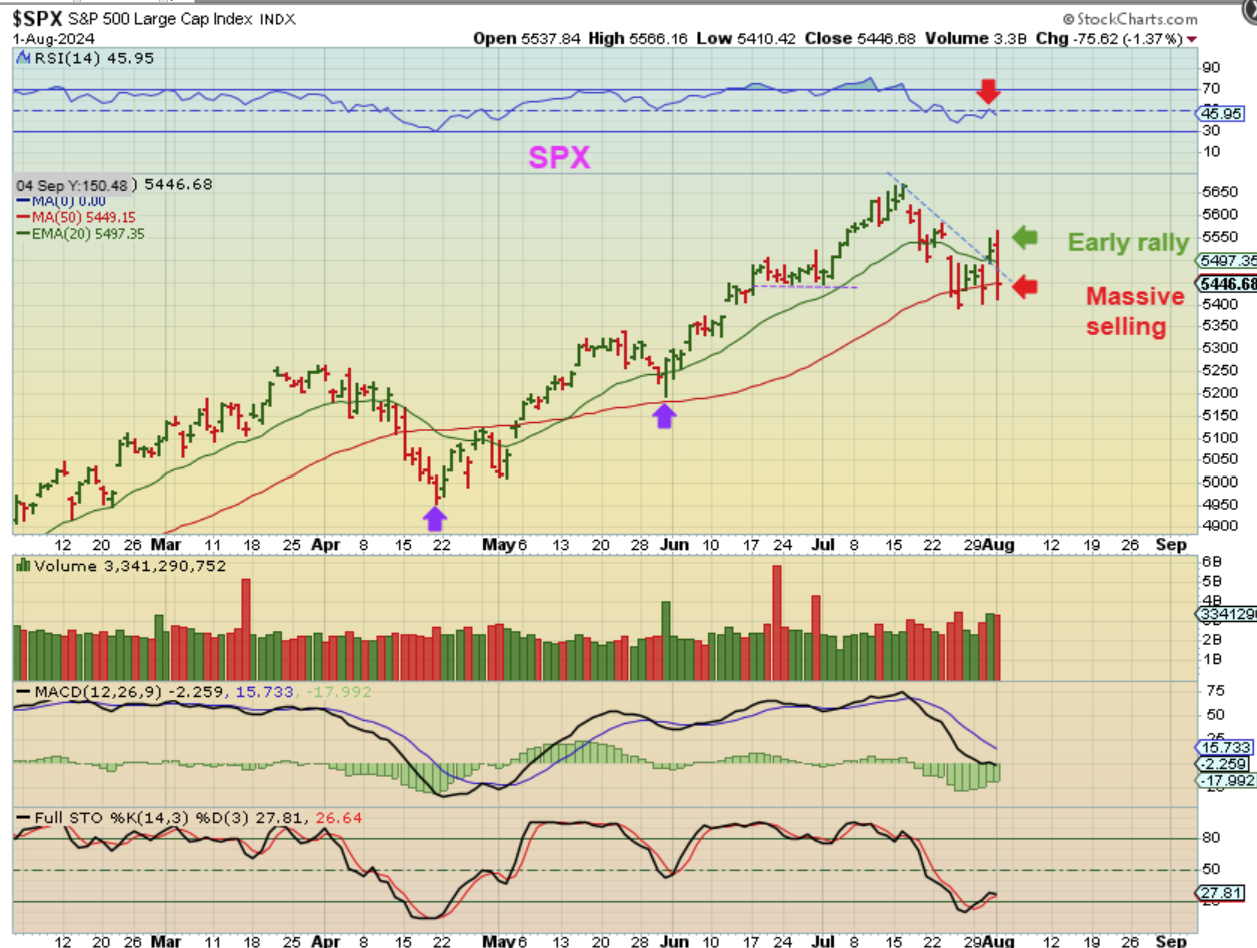
So I pointed out that if that late June was the dcl, then The SPX also failed, but even if the dcl was the late May dip, I still think that it is just a matter of time. The SOXX often leads the market direction and that failed in a big way.
.
This morning the markets were moving higher for the first half hour, after a strong up day on Fed Wednesday. Well, they suddenly rolled over and then sold off relentlessly. I have noticed that Many tech earnings reports are starting to forecast weakness too.
.
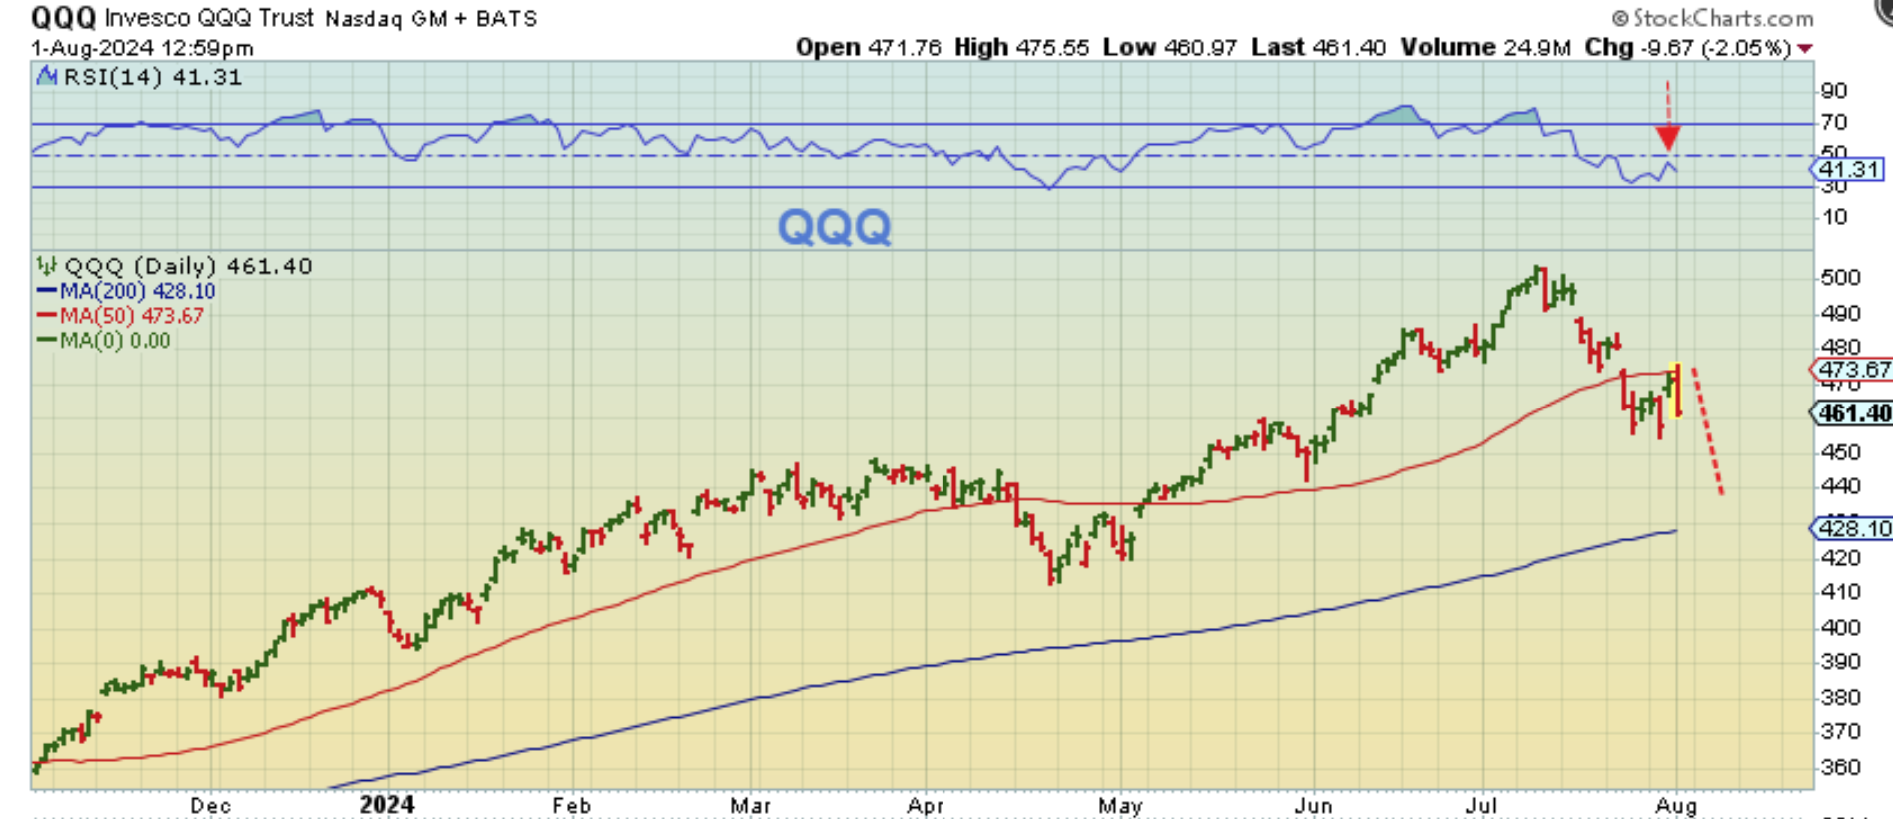
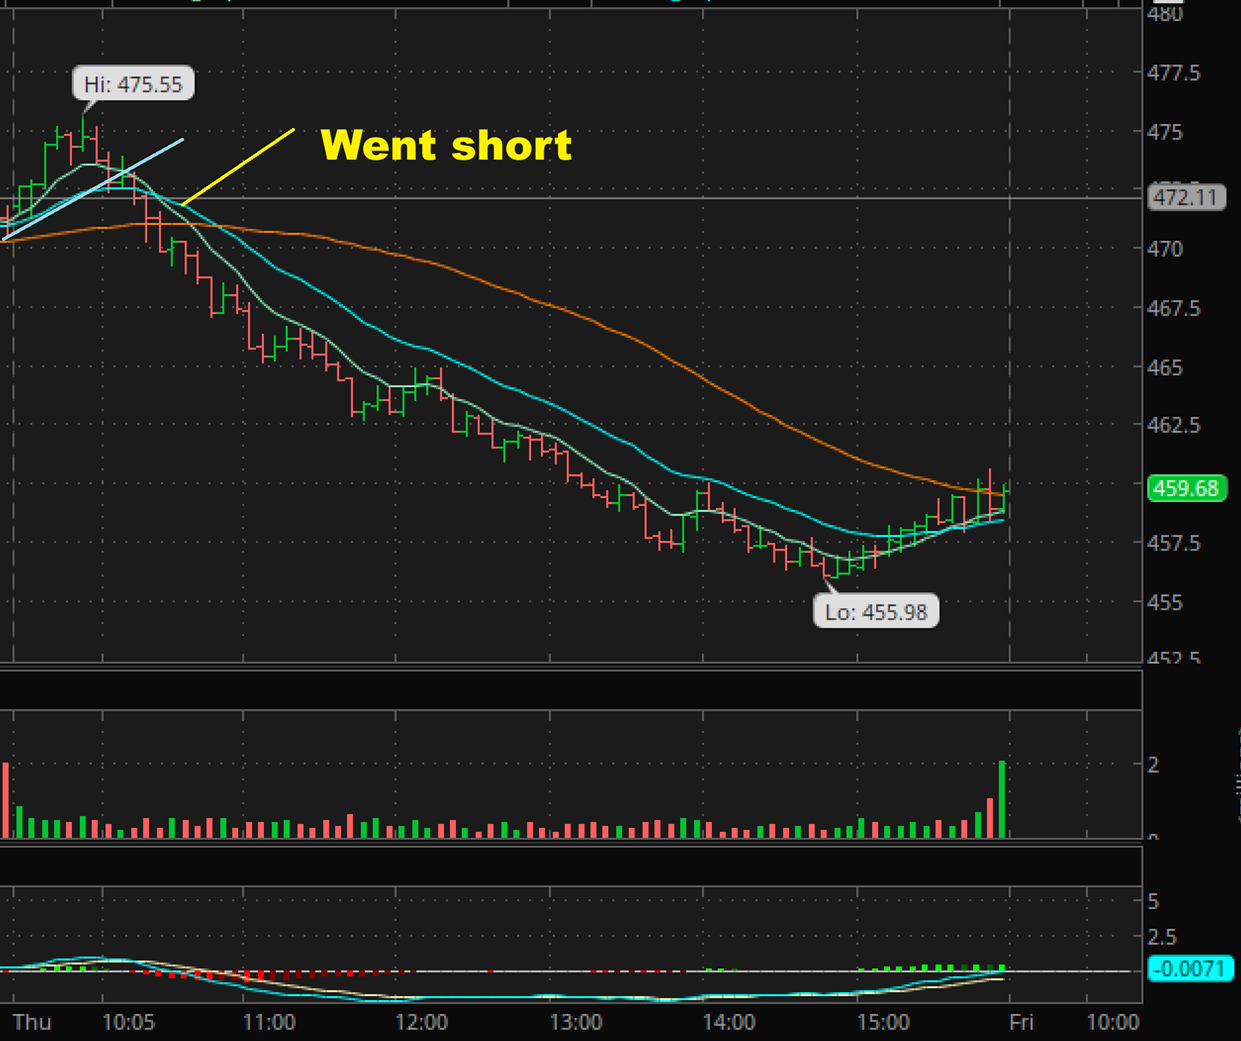
The NASDAQ (QQQ) tagged the 50sma and started to sell off, so I grabbed SQQQ & SOXL as it started to rise up in the first hour. This was Midday and it continued to sell off after this…
.
The QQQ sell off was simply relentless ($475 to $455). I bought short on the break of the red 50sma, and I used the 8 & 20 ema on an intraday chart to stay in the SQQQ trade and it lasted all the way to the final hour, where I exited that trade for now. you can see the bounce coming in during the final hour. The General Markets are…
.
Think about it: The General Markets are still rather early in this intermediate cycle, since it is only the 2nd daily cycle out of the ICL. We could and will have bounces along the way, especially out of the next dcl, but then shorting may be the best way to play this area ( SOXS, SQQQ, SPXS for example). We could have an additional 2 daily cycles selling off, with bounces in between.
.
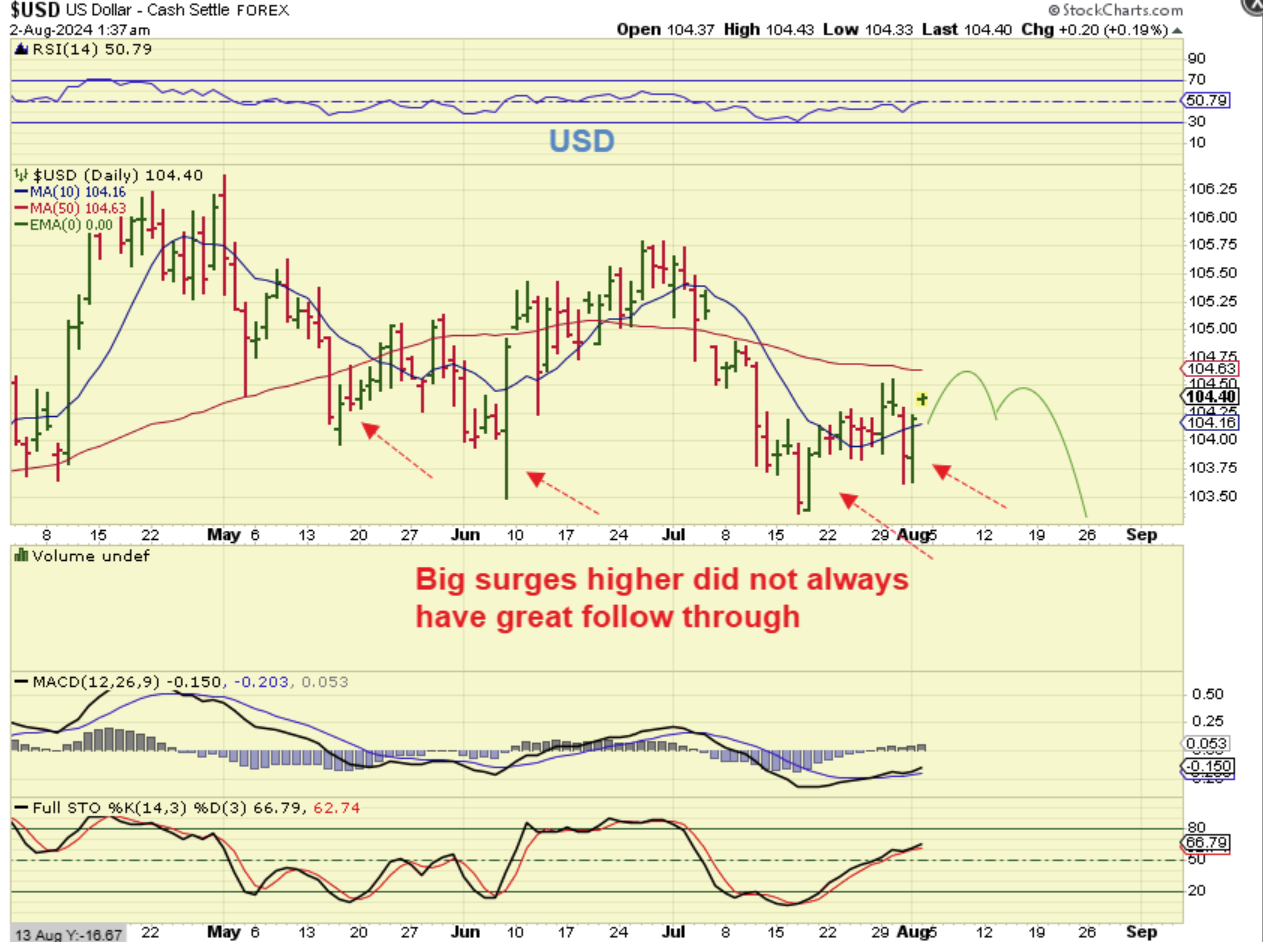
THE USD surged on Thursday, after a sharp Fed-Day drop. We have seen these surges before, and they can gradually become meaningless, as seen on this chart.
.
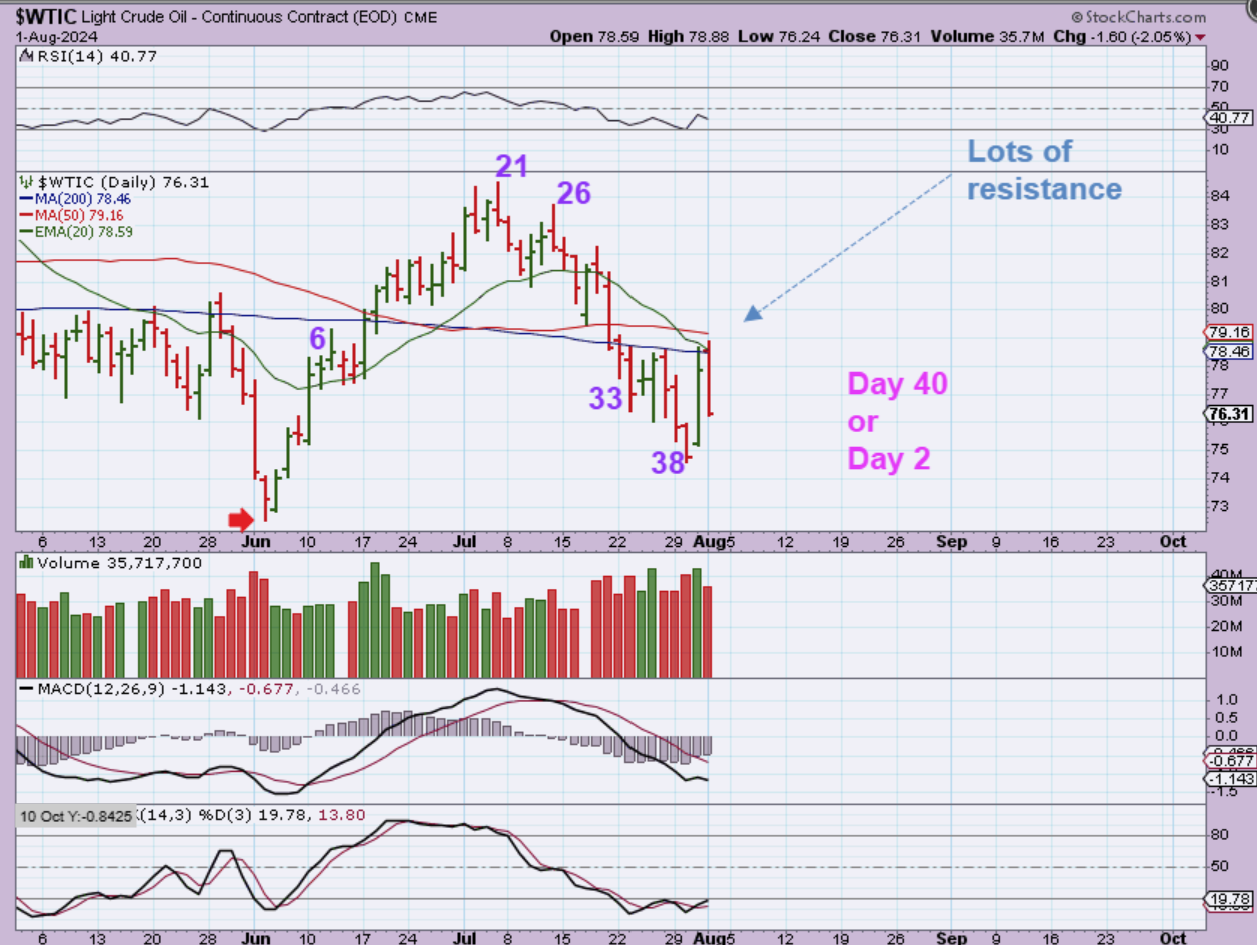
WTIC – Oil can have daily cycles that last 45-50 days long. So far we have a low on day 38 and that was followed by a strong rally day Wednesday. So the day 38 low MIGHT be a dcl, however Oil was then stopped at resistance and dropped on Thursday, so we need more time to see if that low holds up or not.
.
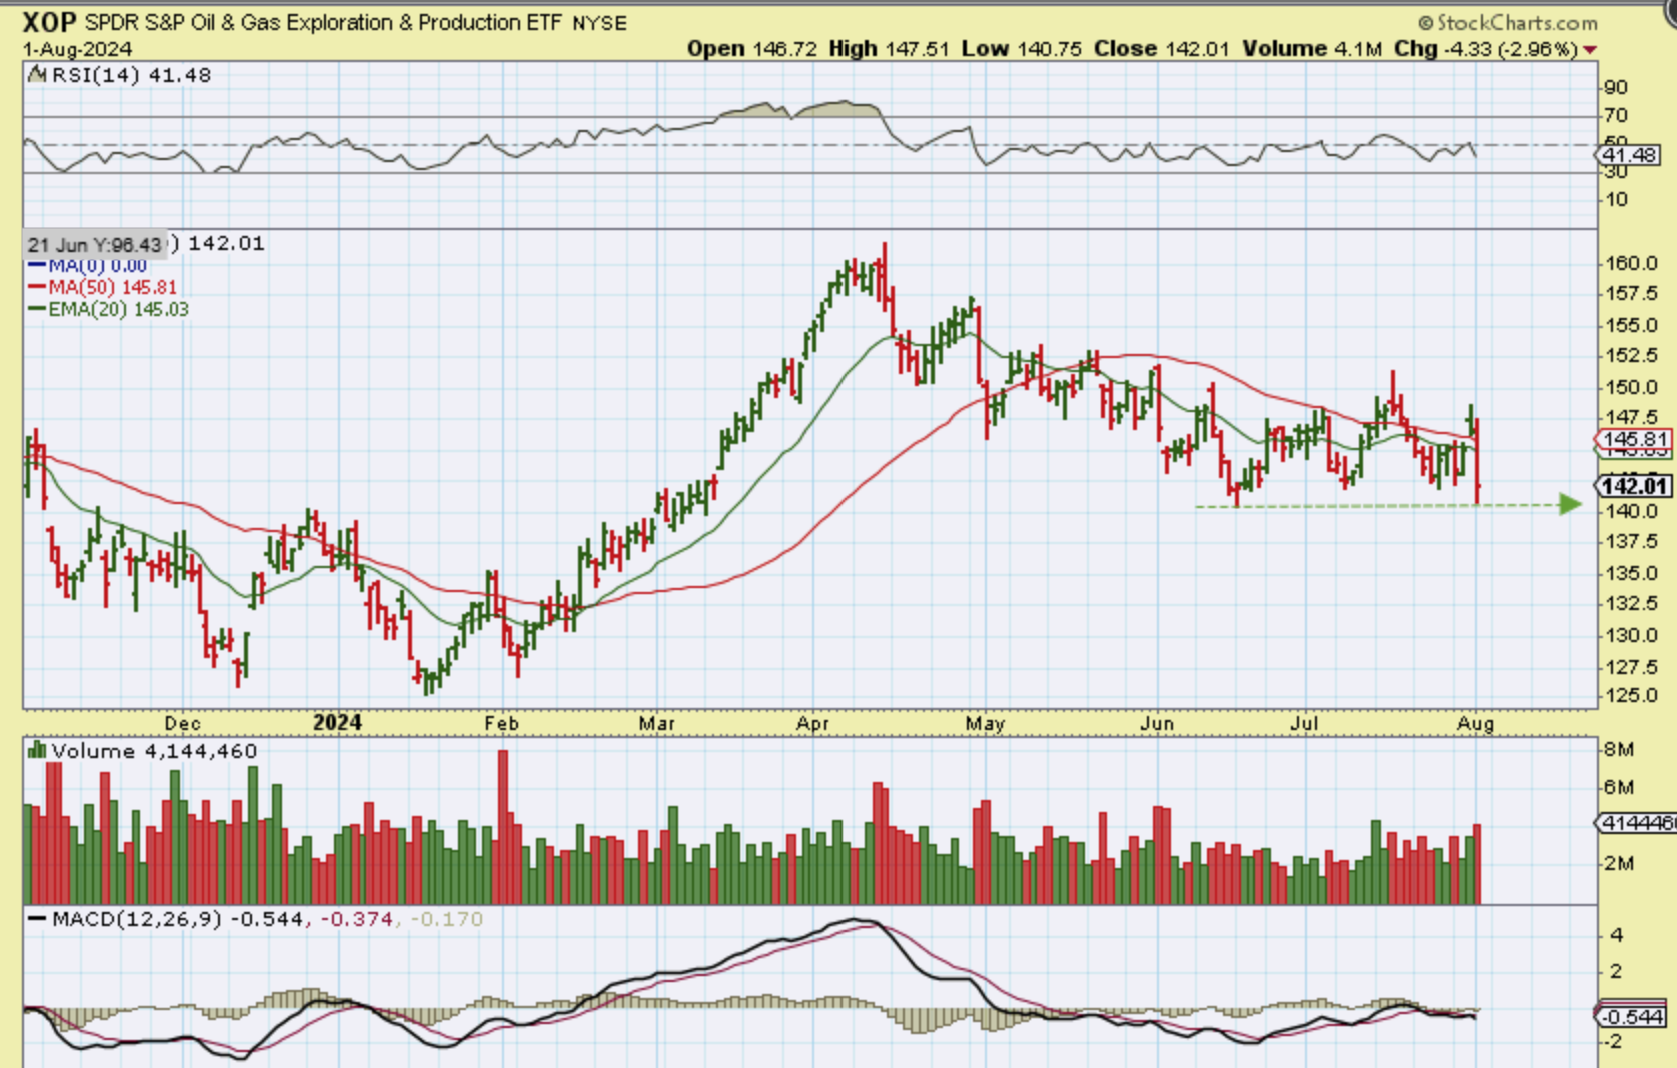
The XLE dropped to the 50sma, but look at The XOP. This lost th 50sma and then slammed right back down to the lows. It was holding up nicely with Oil selling off, but this is a bit concerning. It could indicate that Oil stocks are following the market sell off until Oil truly bottoms with a confirmed dcl.
.
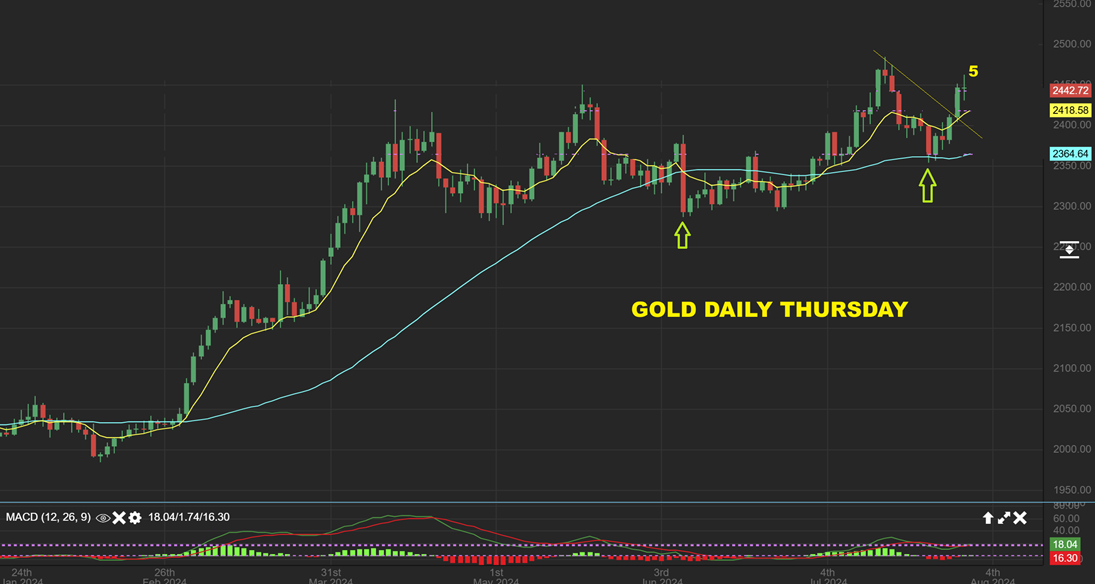
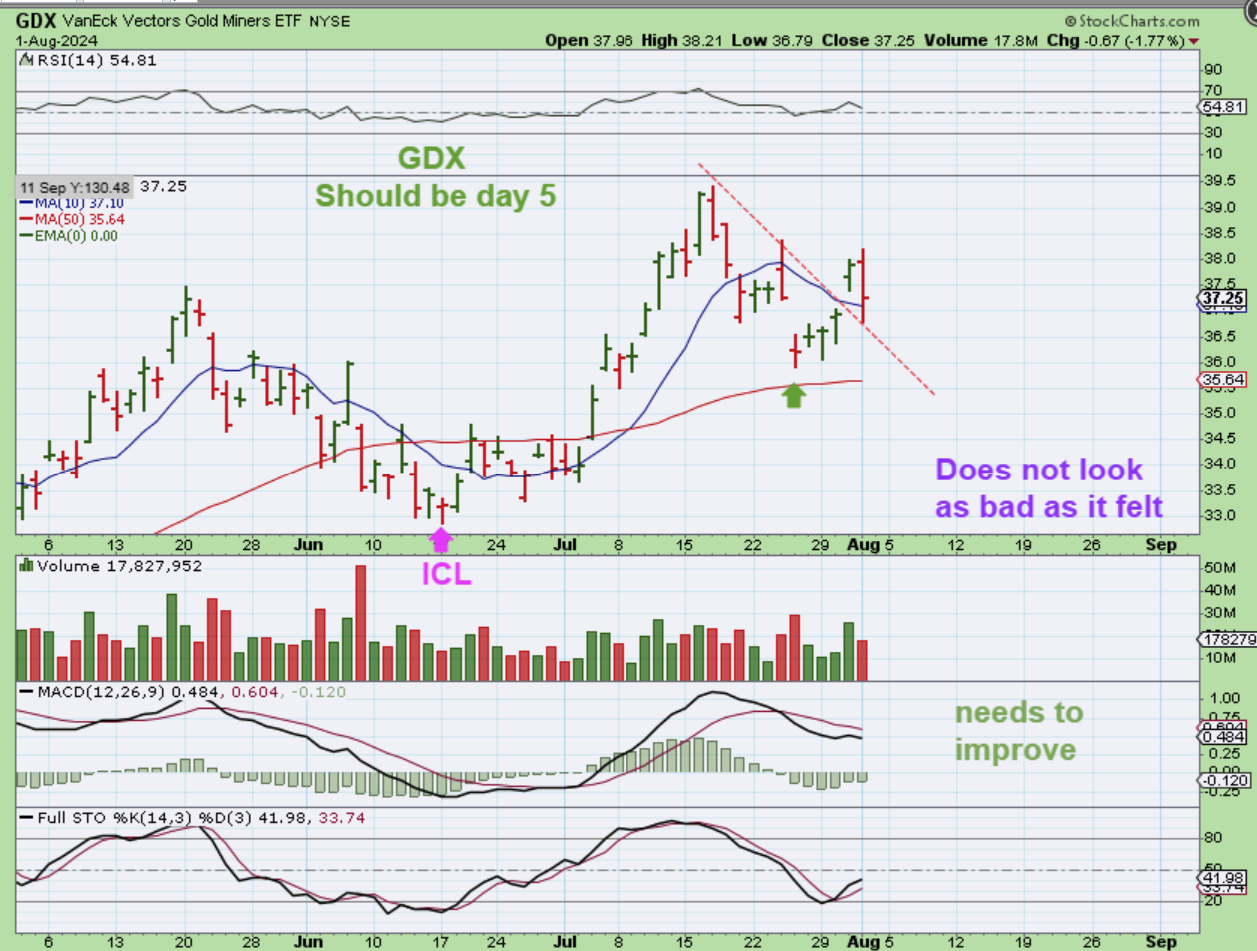
Please notice that GOLD does not look bad at all, it is back at all-time-highs.
We have an ICL, a rally to new highs, and then a drop into a higher low dcl. This was day 5 and it looked fine, but some of the Miners are slightly questionable, mainly the Silver Miners. We’ll discuss that soon.
.
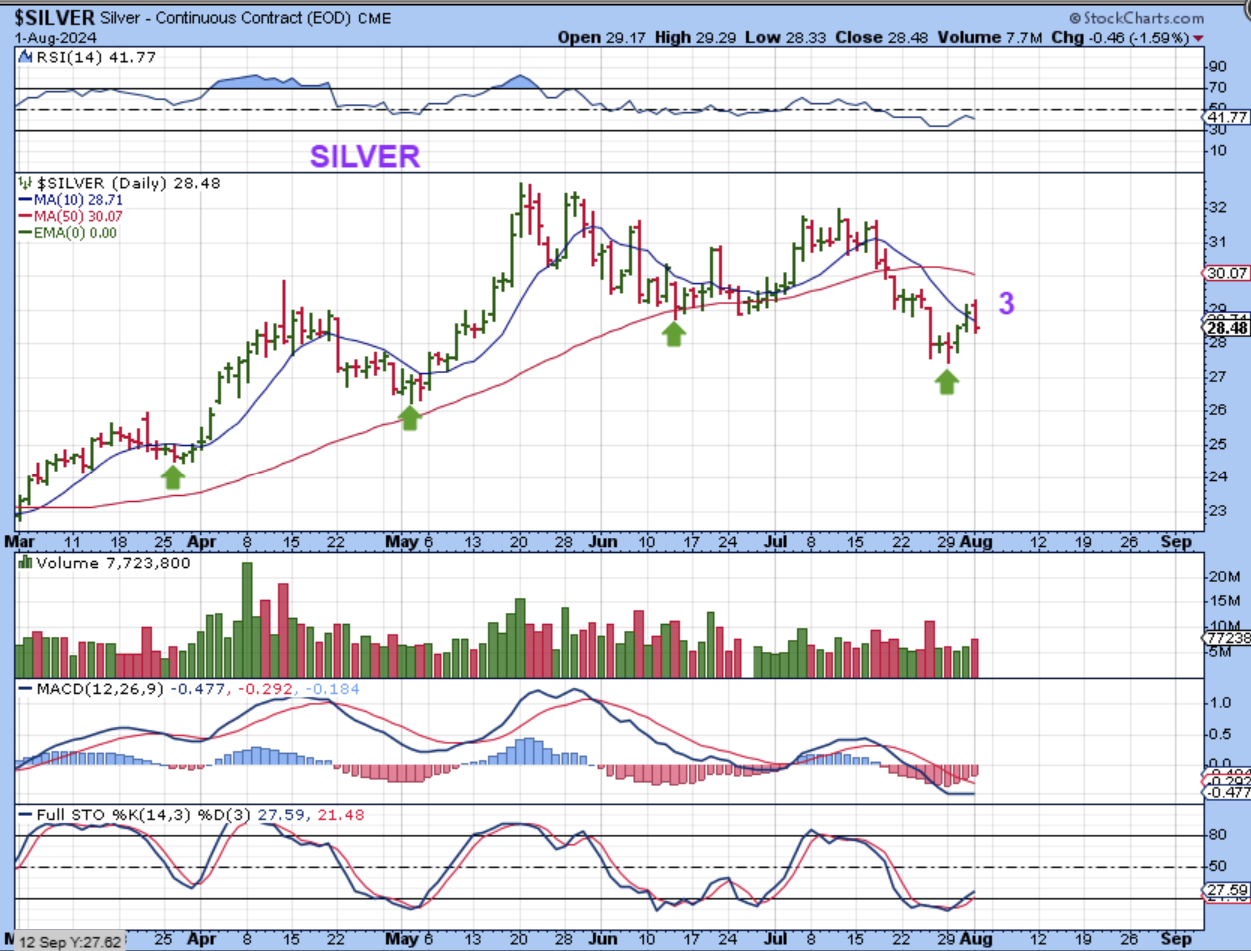
SILVER should have its low or dcl in place and it seemed to be confirmed on the Fed Wednesday, with a close above the 10sma. This should be day 3, and all should be fine, but I am a bit concerned ( & puzzled) at what I saw with some of the Silver stocks yesterday. I’ll discuss that too after the GDX chart.
.
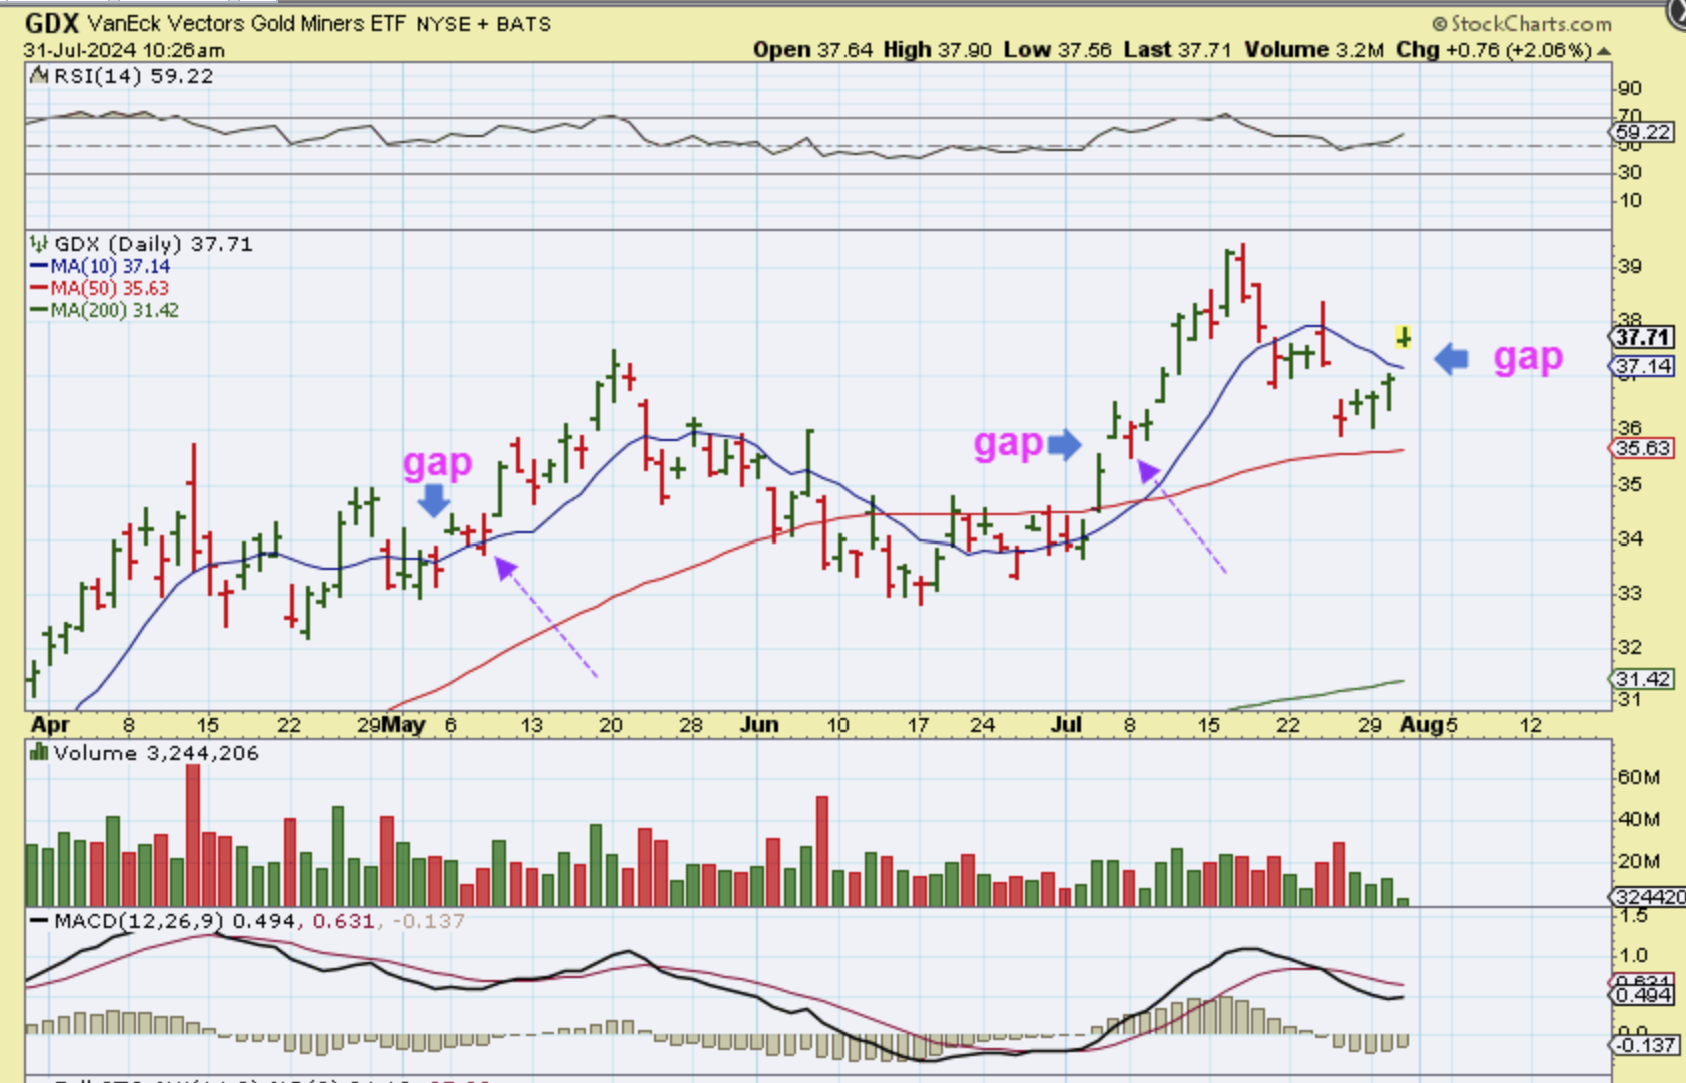
GDX rallied for 15 minutes after the open, and I added some GDXU. Ouch. The Miners then started to roll over and sell off and I stopped out of GDXU with a loss. The problem is that Gold & Silver did not look bad at all, as seen above, but the Miners just kept selling off lower. I posted this chart after 10 a.m. pointing to that possible gap fill, but I thought that we might see that gap fill with selling from both Thursday AND Friday. I thought that maybe we’d see a 2 day pullback…
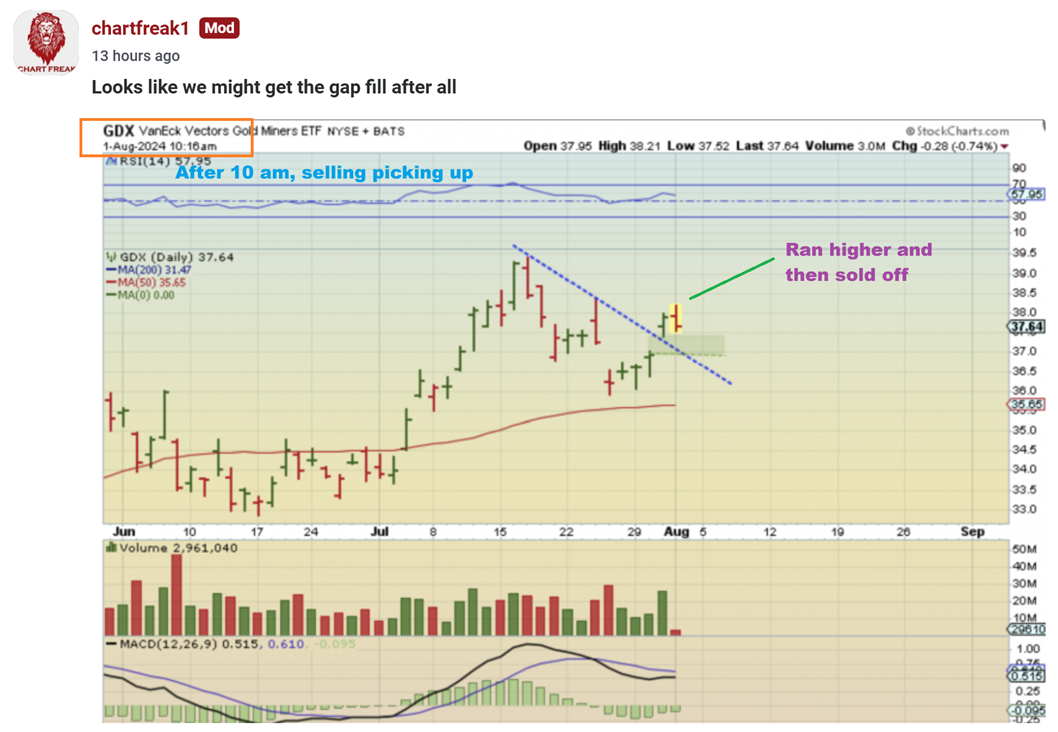
.
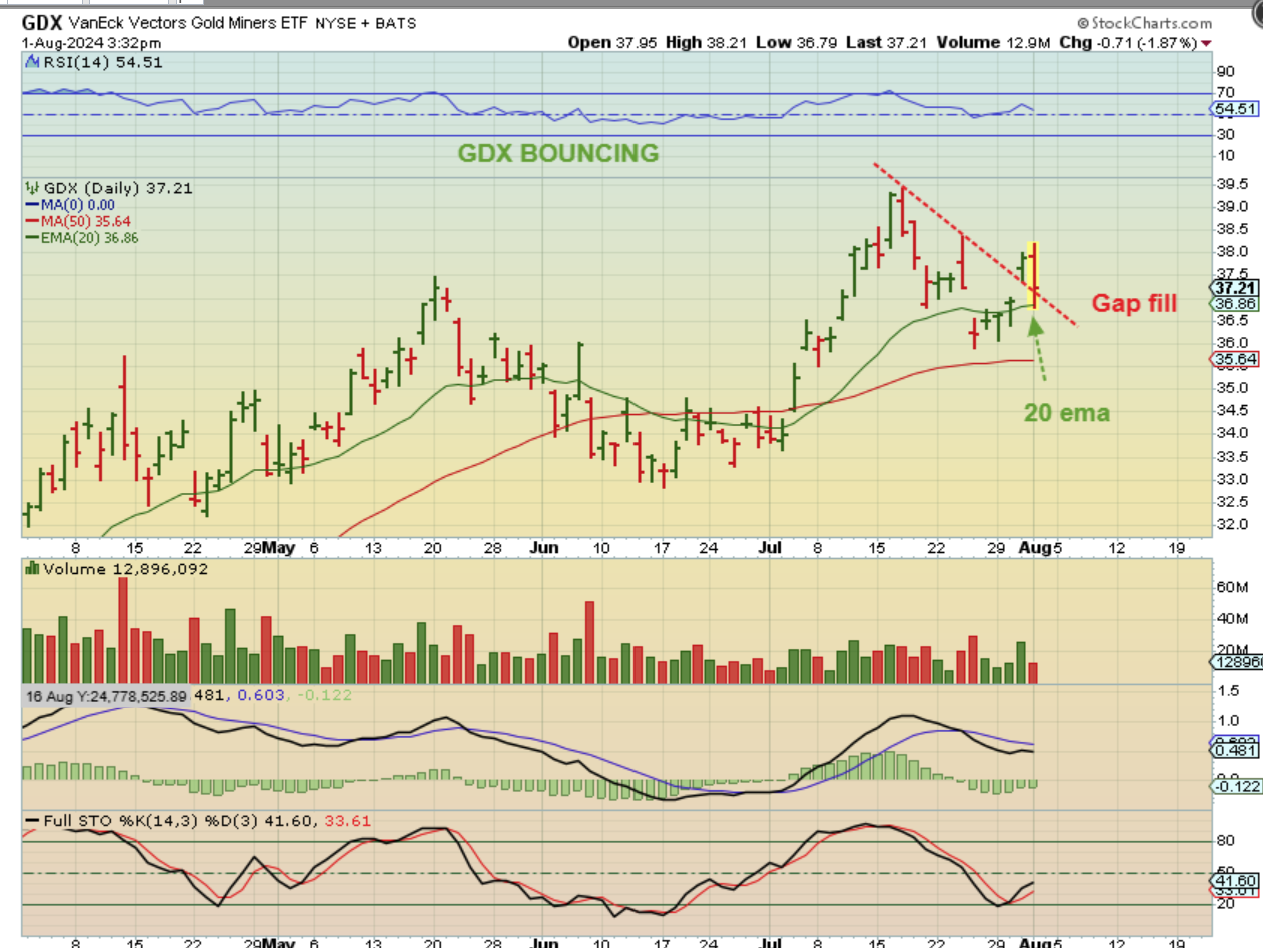
Instead, The GDX sold off all day long too, and only bounced at the final hour of trading. I posted this chart at 3:30 to show that the gap did fill and then bounced at the 20sma. By the close…
.
By the close The GDX ETF bounced back and looks like a gap fill and trend line test, but was that it??
.
Next we have to see what happens on Friday. Remember, we only have a day 26 low, so this COULD POSSIBLY be day 31 and a drop to the 50 sma on day 32 or 33 is ‘acceptable’. That should not happen, however, because we have the swing low where price closed above the 10sma, and broke the downtrend. We SHOULD have the dcl in place. We really should move higher from above this trendline soon. And…
.
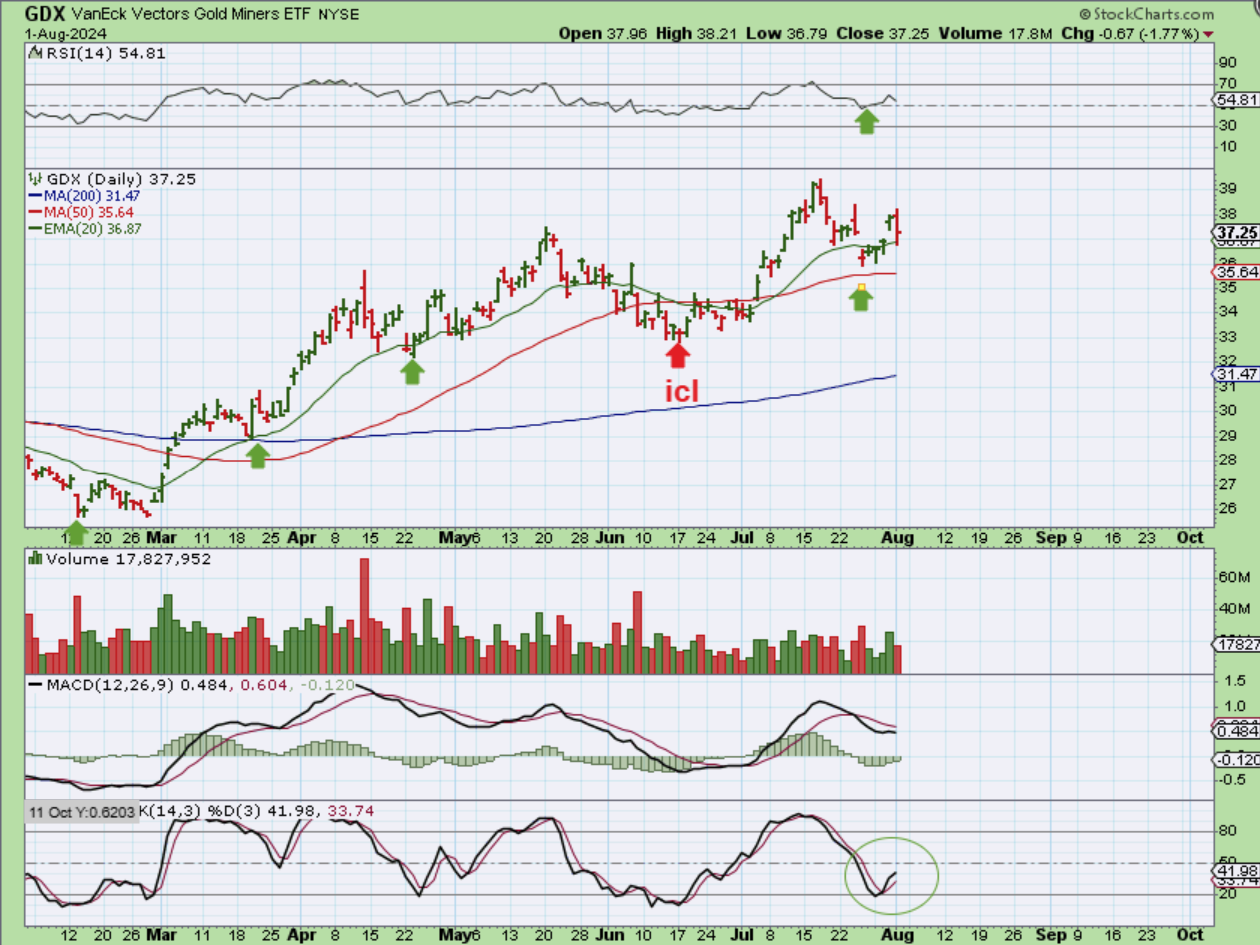
And if I showed you this chart and asked if it is a buy or a sell? Is it Bullish or bearish? What would you think? I still see an ICL in June that ran us to new 2024 highs, and this is a dip to the 50sma.
.
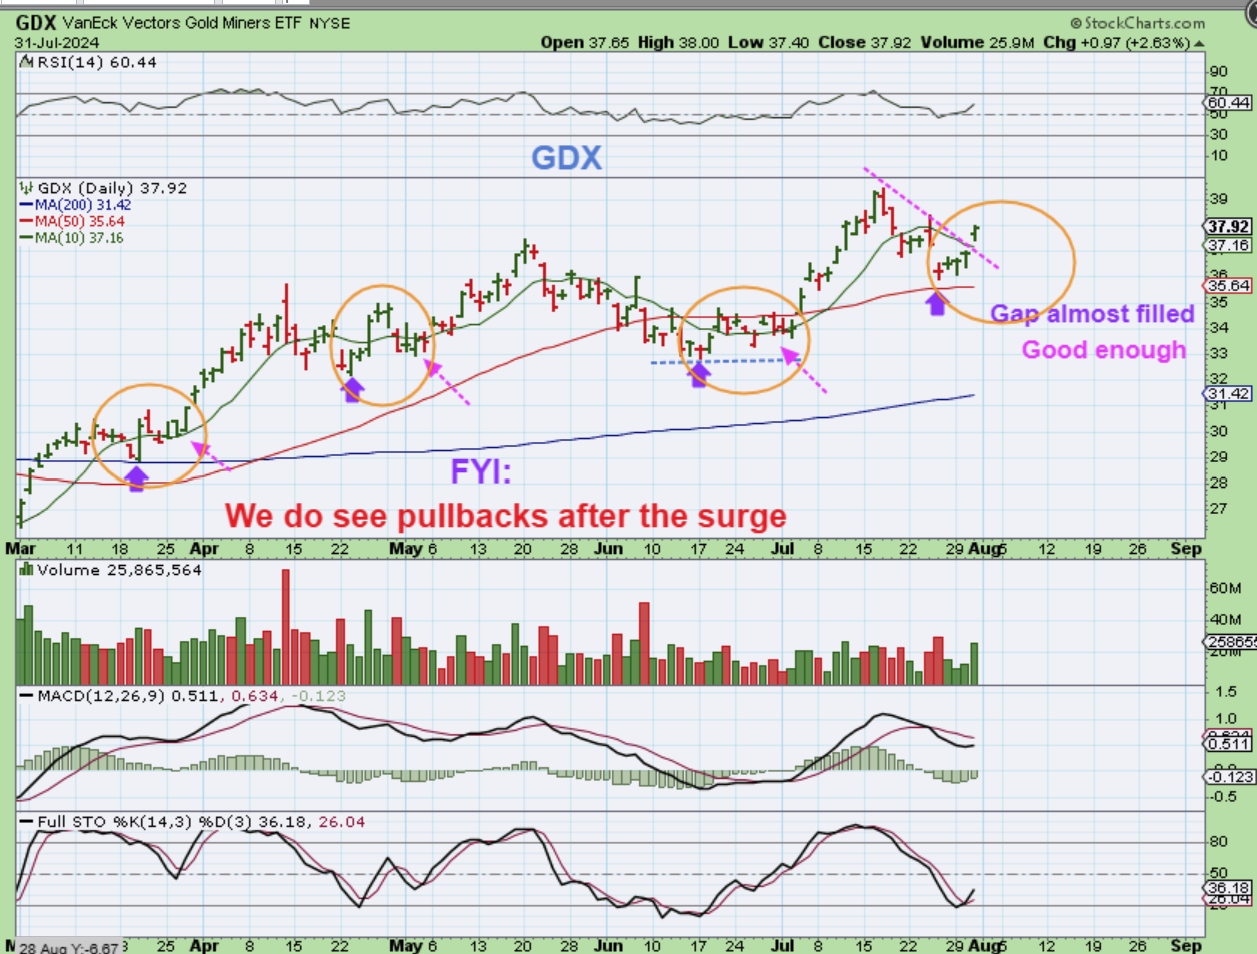
THIS WAS IN YESTERDAYS REPORT: We do see pull backs after the surge, and gap fills.
.
THIS WAS ALSO IN YESTERDAYS REPORT: See the Blue & Majenta markings. Gaps often filled on the GDX, so…
.
Gaps often filled on the GDX, so is this bullish or bearish? It remains bullish for now.
.
Now for the Puzzling display of weakness!!
.
I was fairly heavy in EXK, because past earnings reports saw a 15-20% surge. I was invested in this idea…
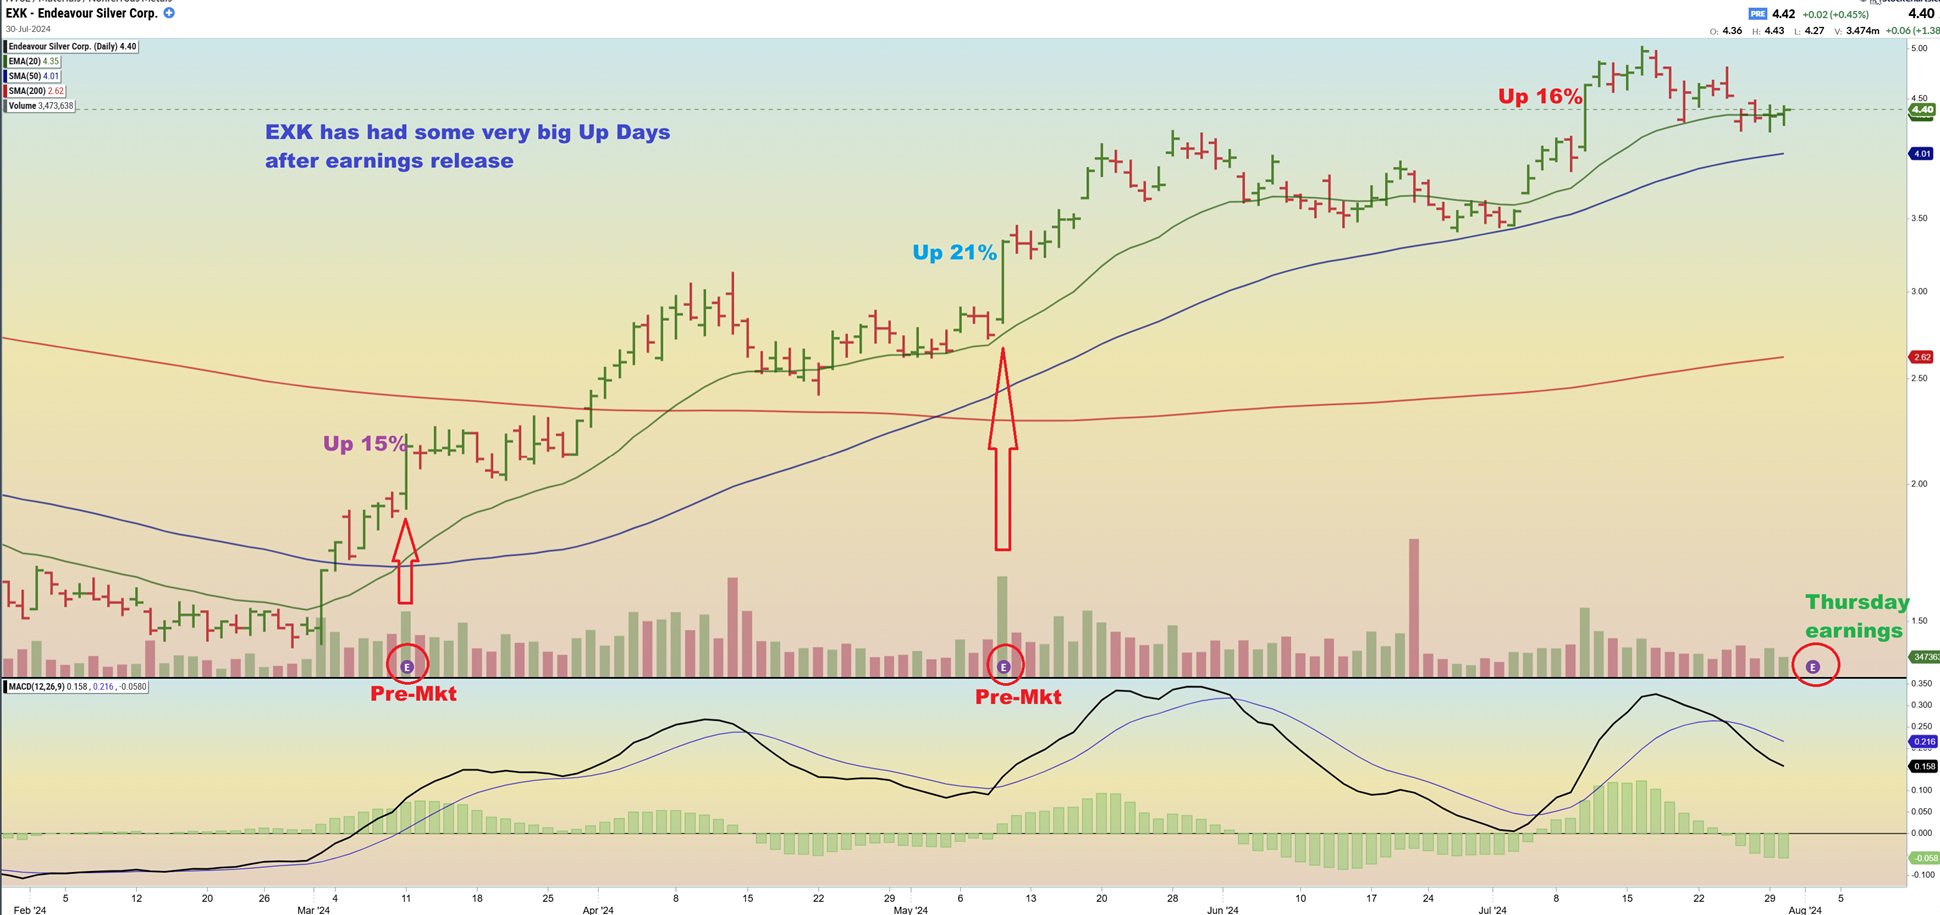
What happened with Thursdays Report? I saw this at 6 a.m.

.
And then I read this :
.
And then we got this?
.
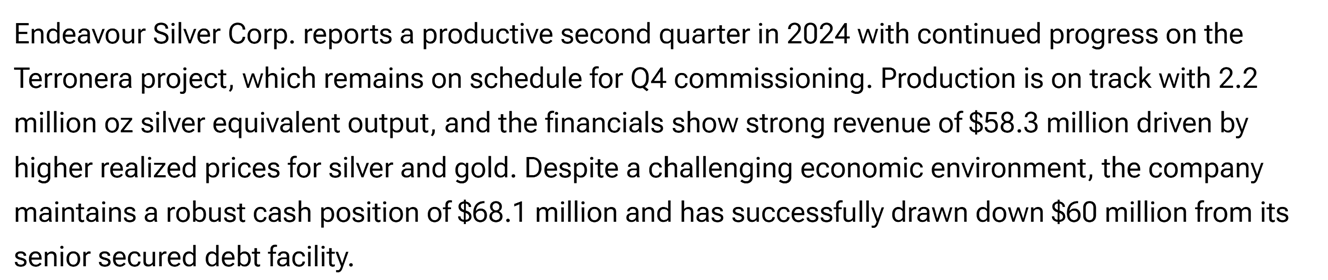
EXK stopped me out at the 50sma, and I was bummed out about that, still thinking that this would bounce back, but it basically looked like it was selling off with the markets. Do you remember the charts above? GOLD & SILVER were ok, but EX, AG, PAAS, and a few others were displaying extraordinary weakness in a bullish sector, and the earnings were NOT as ugly as the charts at all. This is concerning to me. And confusing.
.
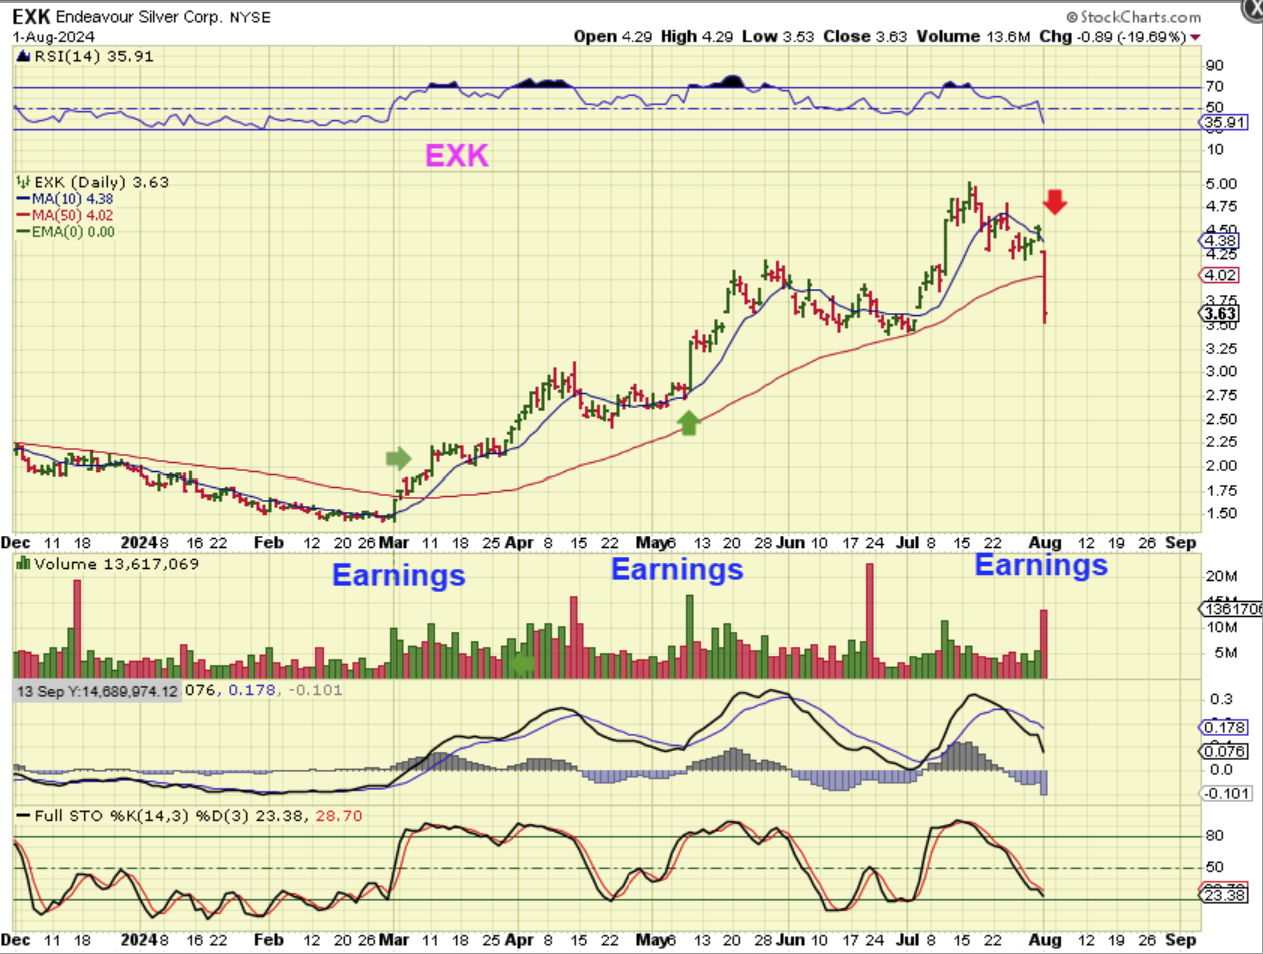
CDE doesn’t have earnings for another week, but it ‘sympathy’ dropped to the 50sma. Should I be concerned? The MACD is weak and the RSI is rolling over…red flags are rising. Let’s see what Friday gives us.
.
NOW LET’s TAKE A LOOK AT ANOTHER VIEW:
.
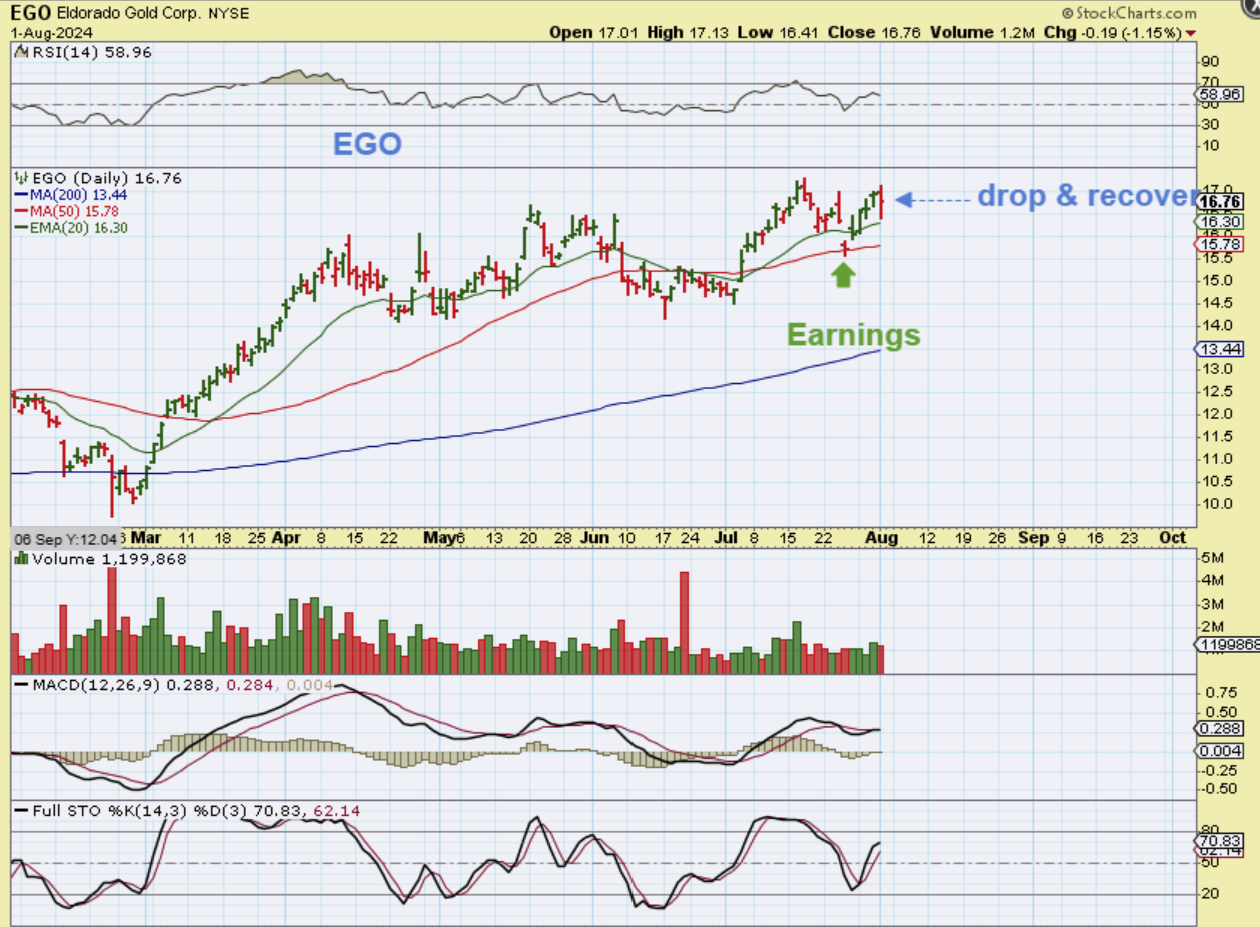
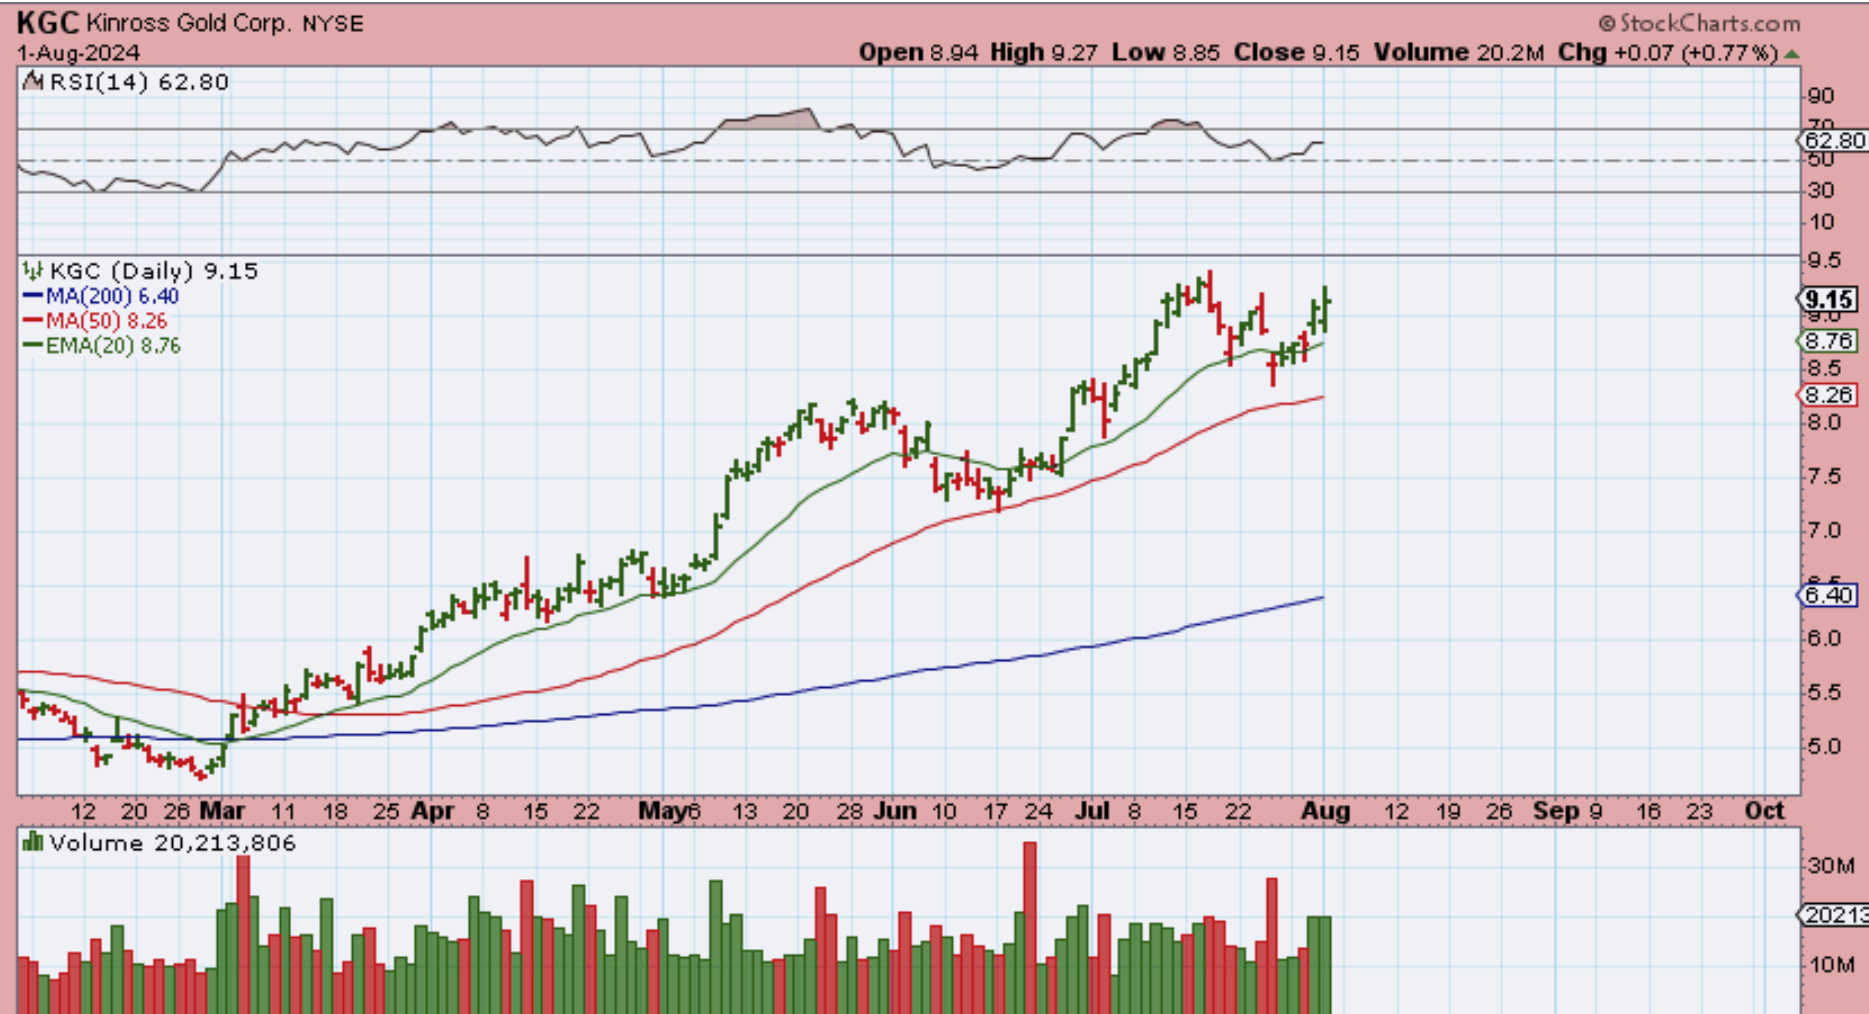
EGO delivered earnings and it gapped down to the 50sma, but it did recover. It also sold off yesterday and then bounced back to recover ( down 1%). So I see signs of weakness in some silver miners, and good signs in some Gold stocks. KGC WAS GREEN…
.
KGC WAS GREEN, NEM WAS GREEN, IAG, NG, NGD, SA, and others bounced back and closed down minimally.
.
So let’s see what Friday brings our way. Enjoy your Friday and Weekend!
.
~ALEX
.
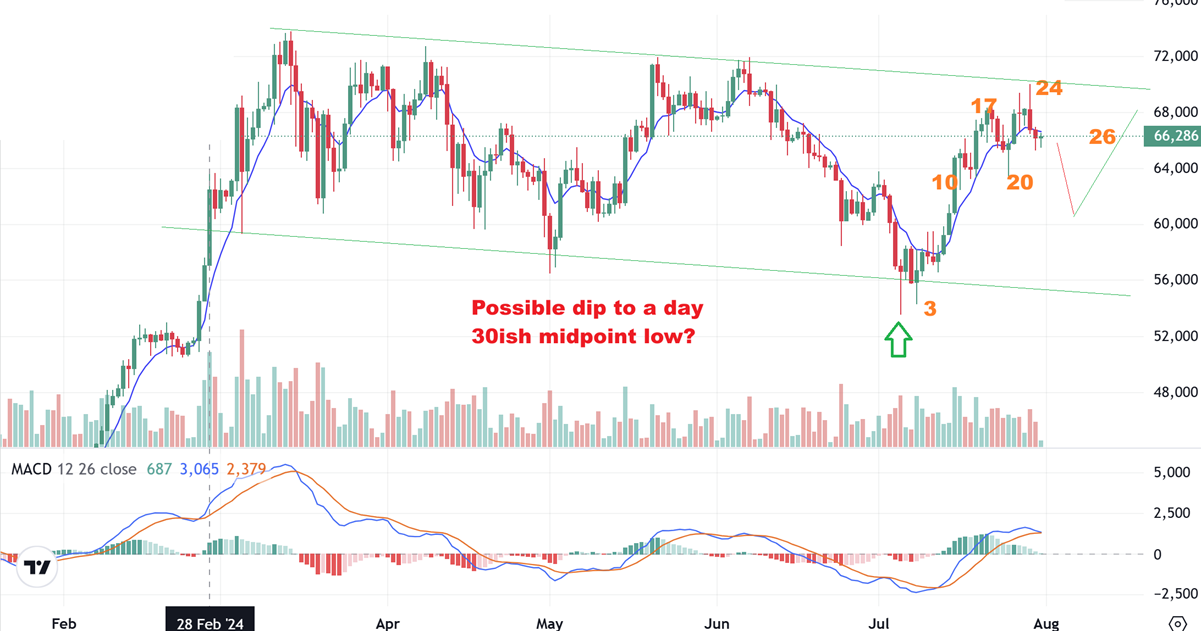
BITCOIN FROM THE WEDNESDAY REPORT:
I have drawn a possible dip into day 30ish and then another move higher …
.
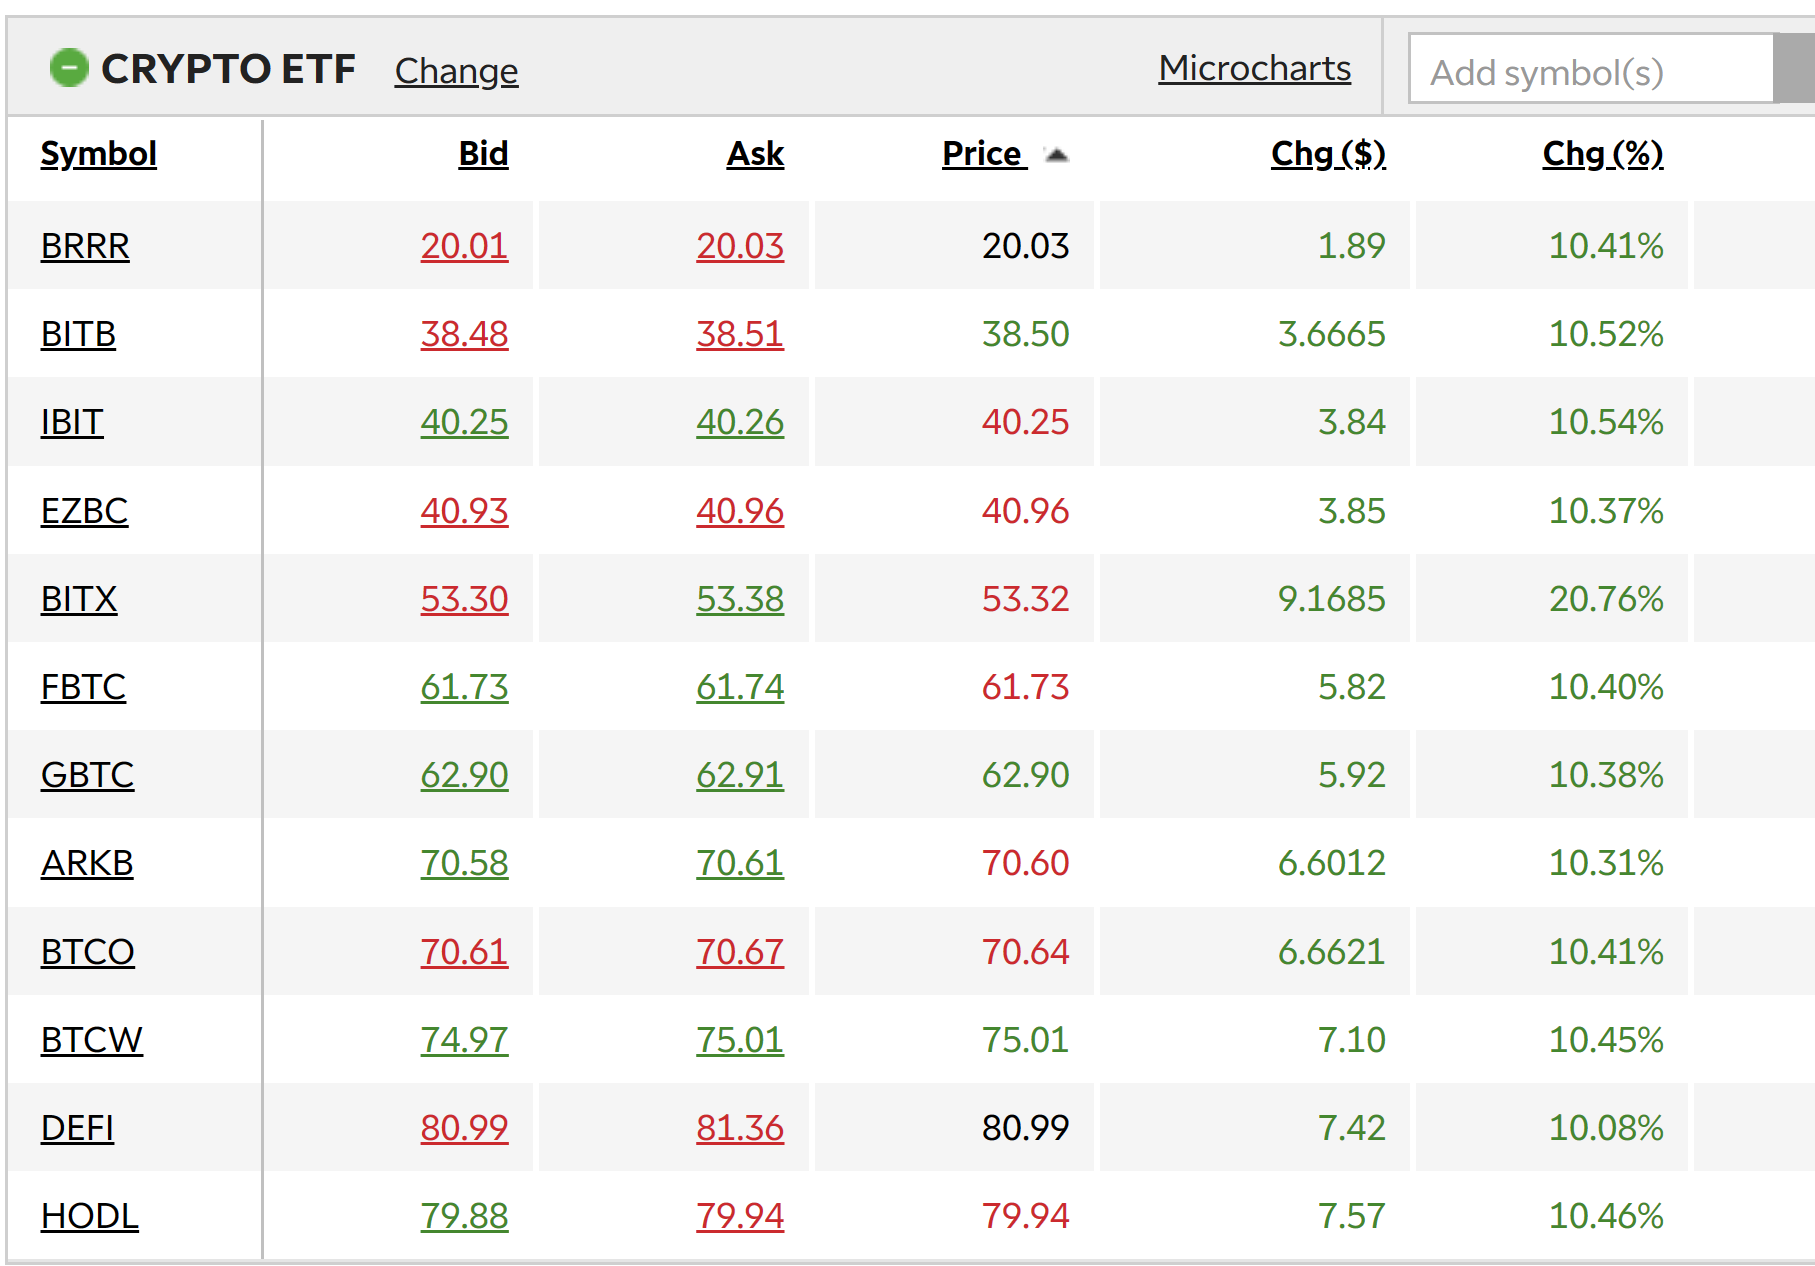
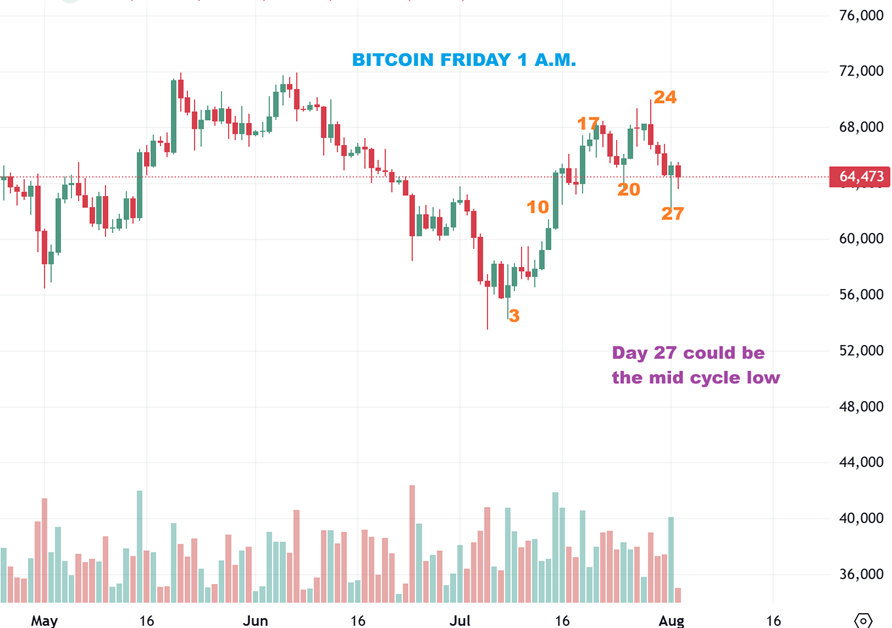
BITCOIN is dropping into that mid cycle low and the reversal here MIGHT be that low. I saw some Crypto stocks ‘bounce’ into the close, but I still don’t trust them. They could sell off with the General Markets, but for now we’ll see what they do on Friday IF Bitcoin continues to bounce. Reminder: If Bitcoin rises alone, you can go long using the ETFs
.
Reminder: If Bitcoin rises alone, you can go long using the ETFs. They were all up 10% (BITX is leveraged) On the day that I captured this chart.