July 27th – The Weekend Report
.
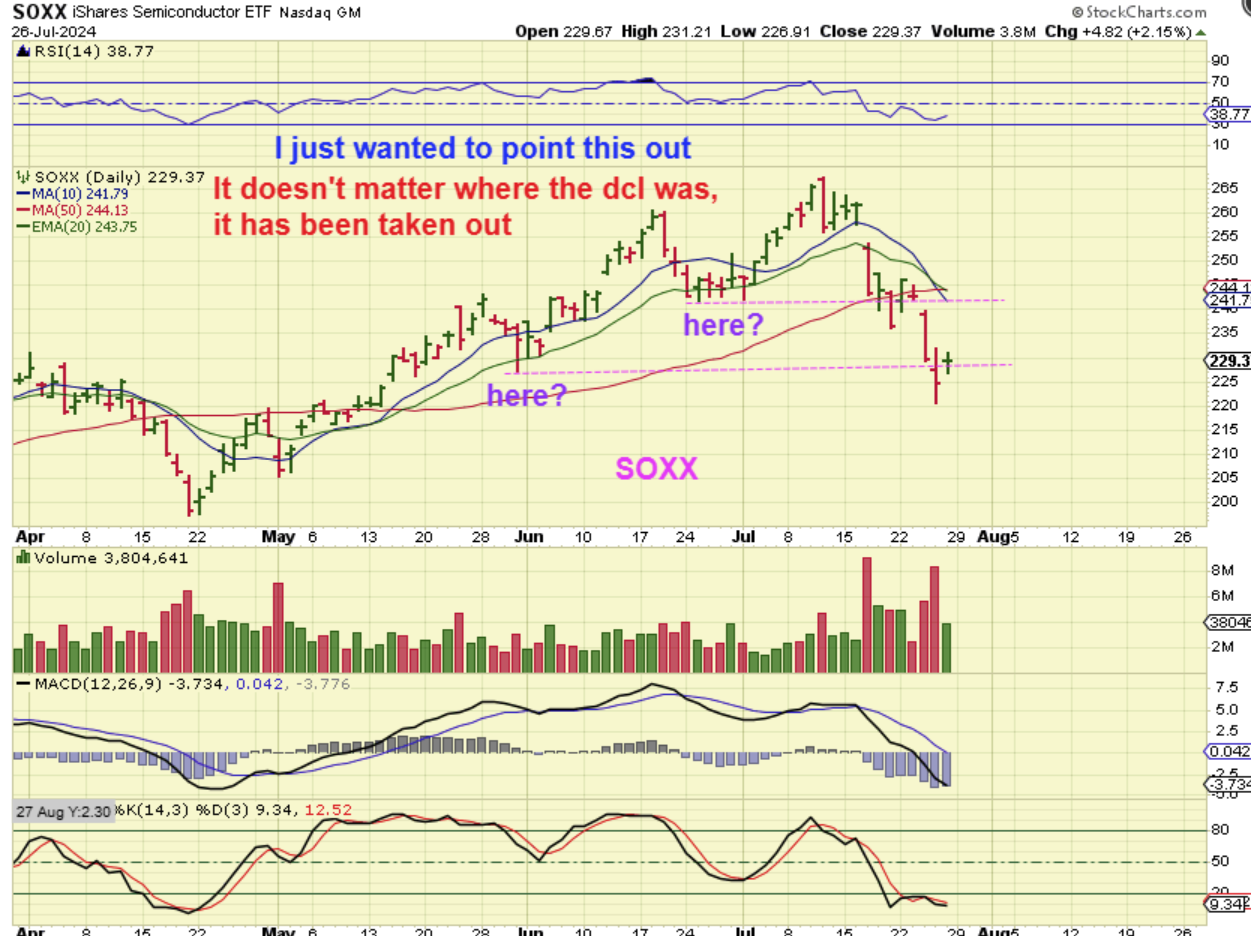
SOXX – There was question as to where the last dcl was, but I just wanted to point out that no matter where it was, it was broken already in this sell off. That is a failed 2nd daily cycle and usually indicates that the rest of the daily cycles will become lower lows.
.
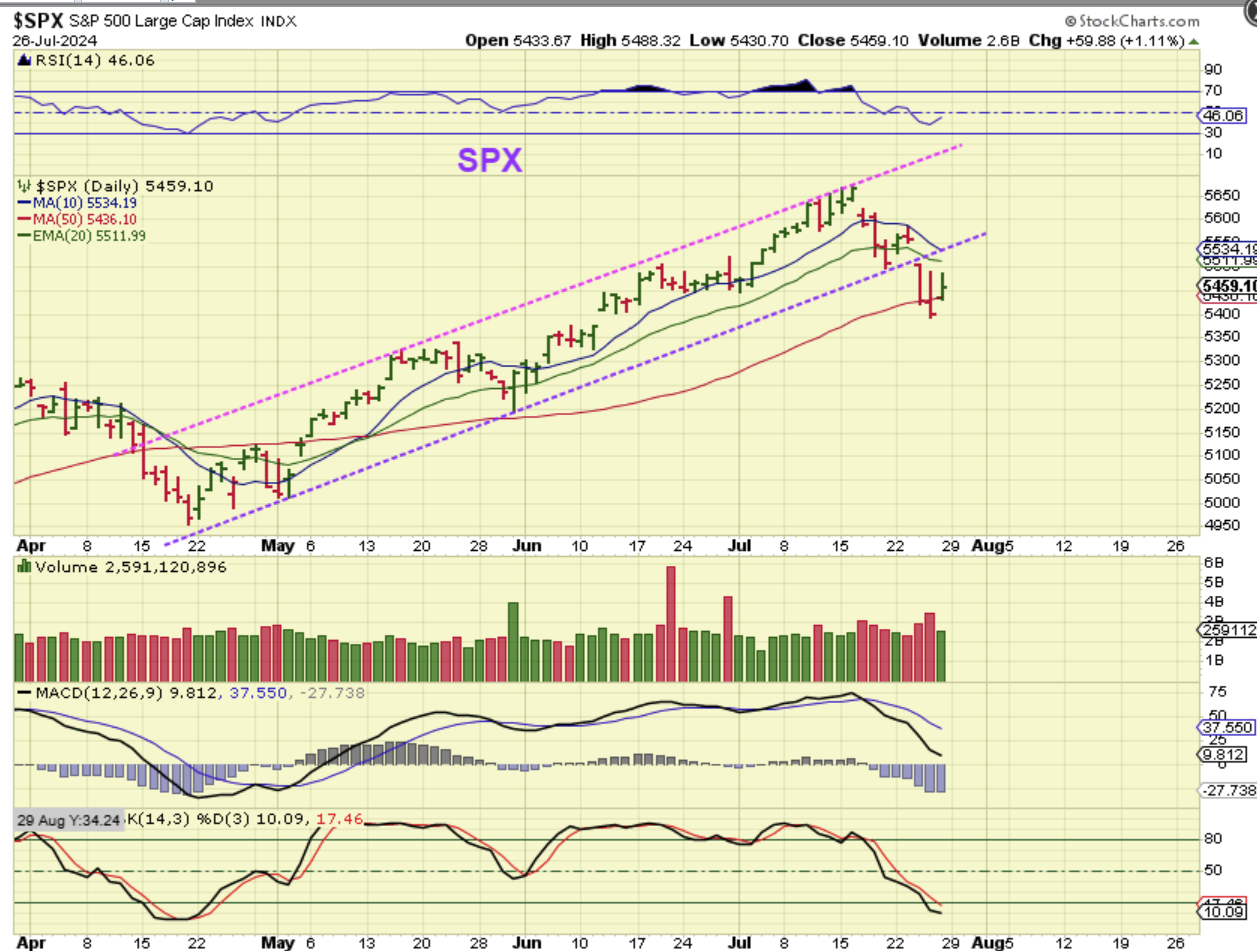
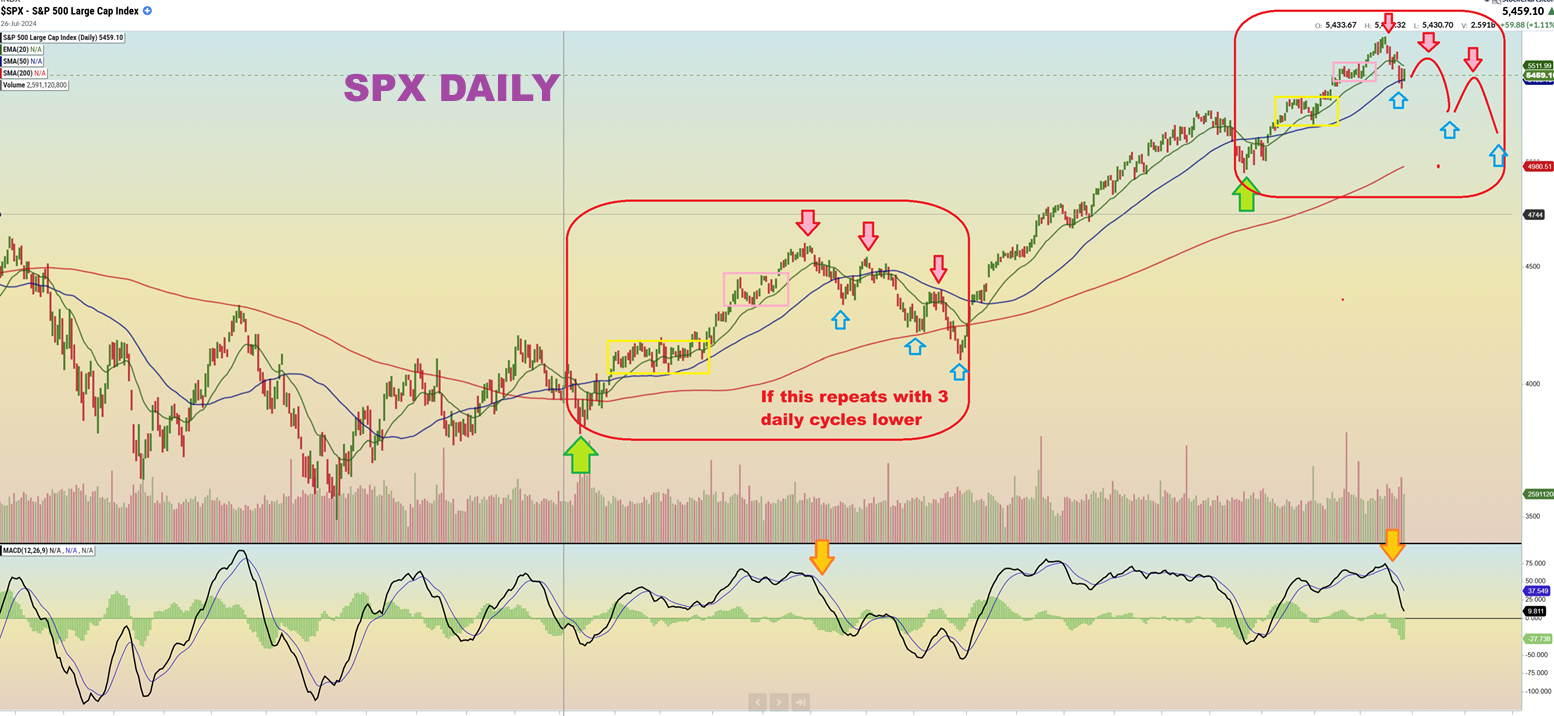
The SPX broke below the last area of sideways chop and dropped to the 50 sma. It can bounce from here, but we have to expect more selling after that.
..
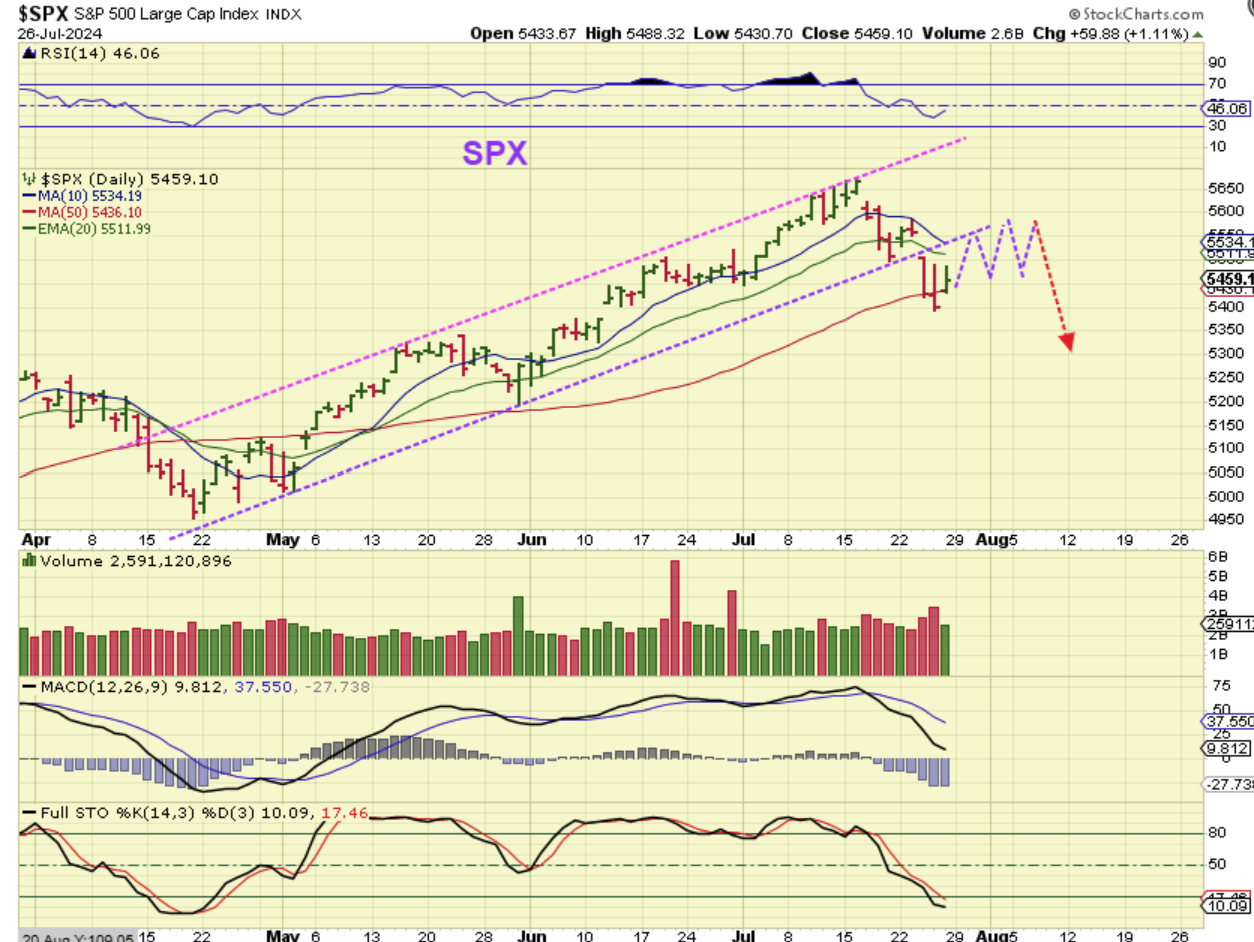
If The SPX puts in a dcl, we could just see something choppy, like this for example.
.
SPX DAILY – I also discussed the idea of the current weakness giving us a couple of daily cycles lower from here, and how that would be resembling the August to October sell off in 2023. This run higher was also similar to that run out of the ICL.
.
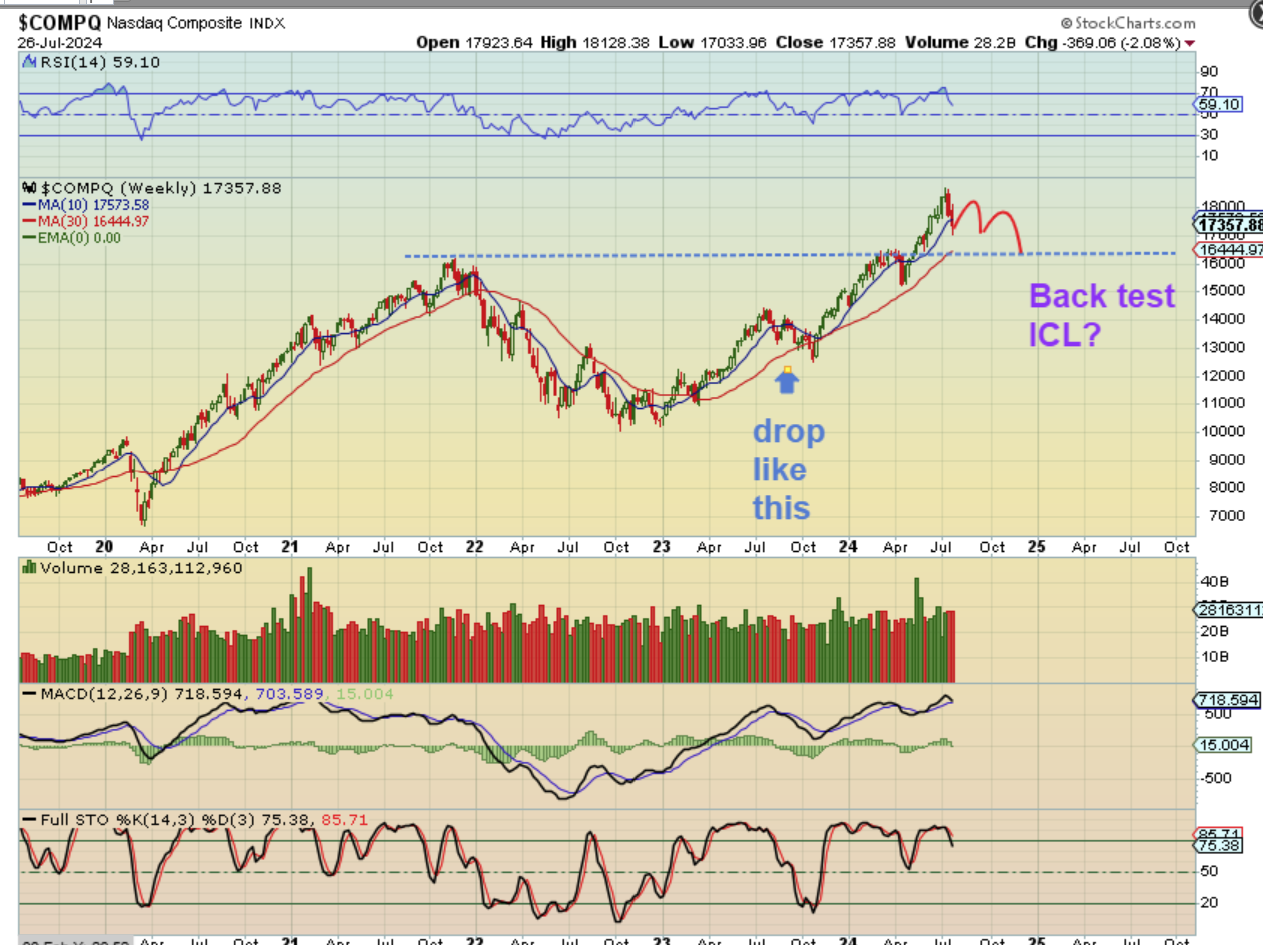
In the bigger picture view, The NASDAQ could actually be doing a back test of the giant cup breakout, if it dropped like that.
.
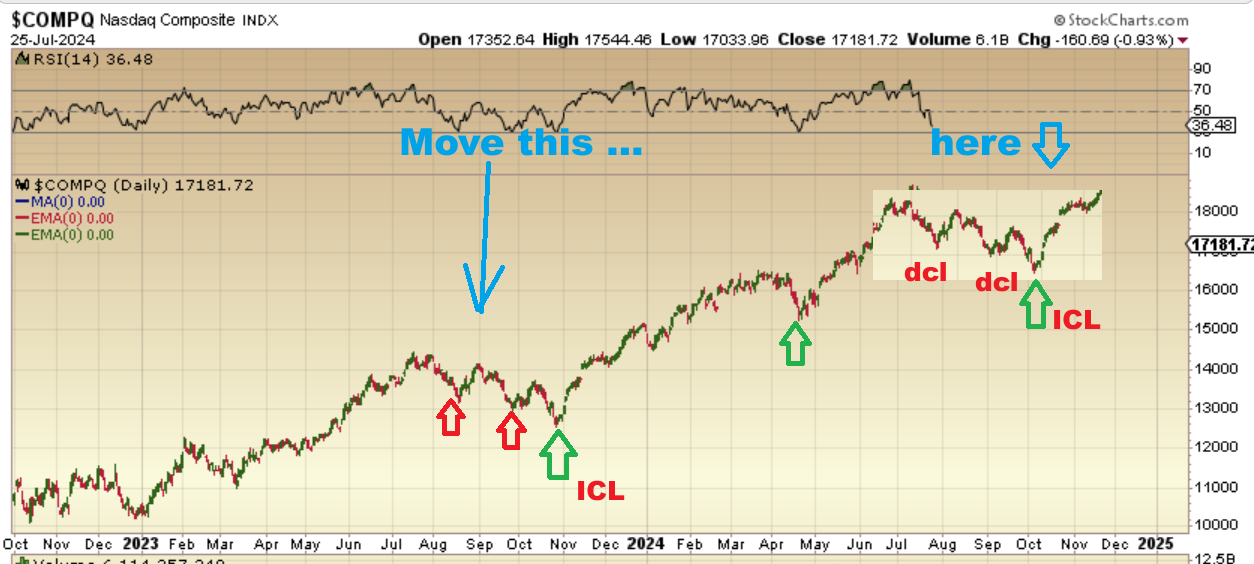
I drew this in Fridays report:
.
NASDAQ – If I copy/paste that drop into the area now, we would drop into the September Fed Mtg and then rally AFTER that meeting.
.
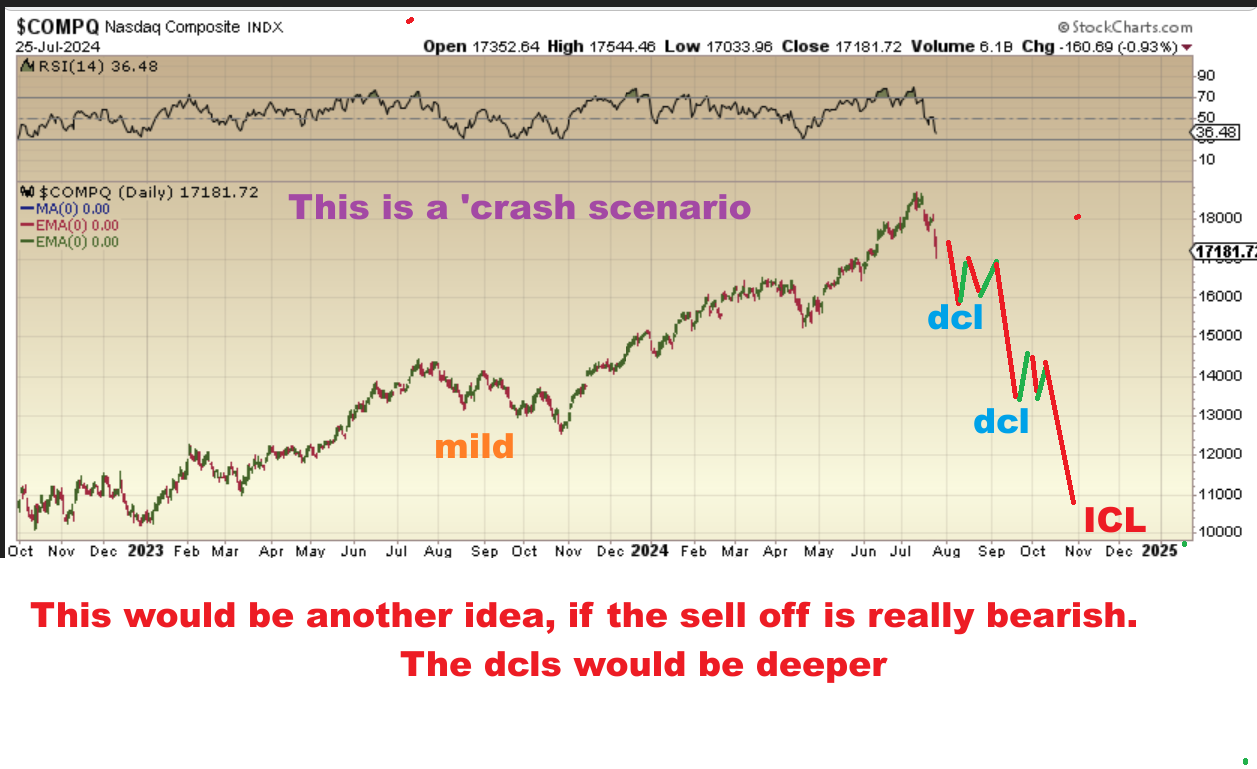
I also drew this, simply because the selling was sudden and swift:
.
This is my crash scenario, and it could be ugly (Unless you short those drops). We’d see a bounce after each DCL, but the selling would then return swiftly.
.
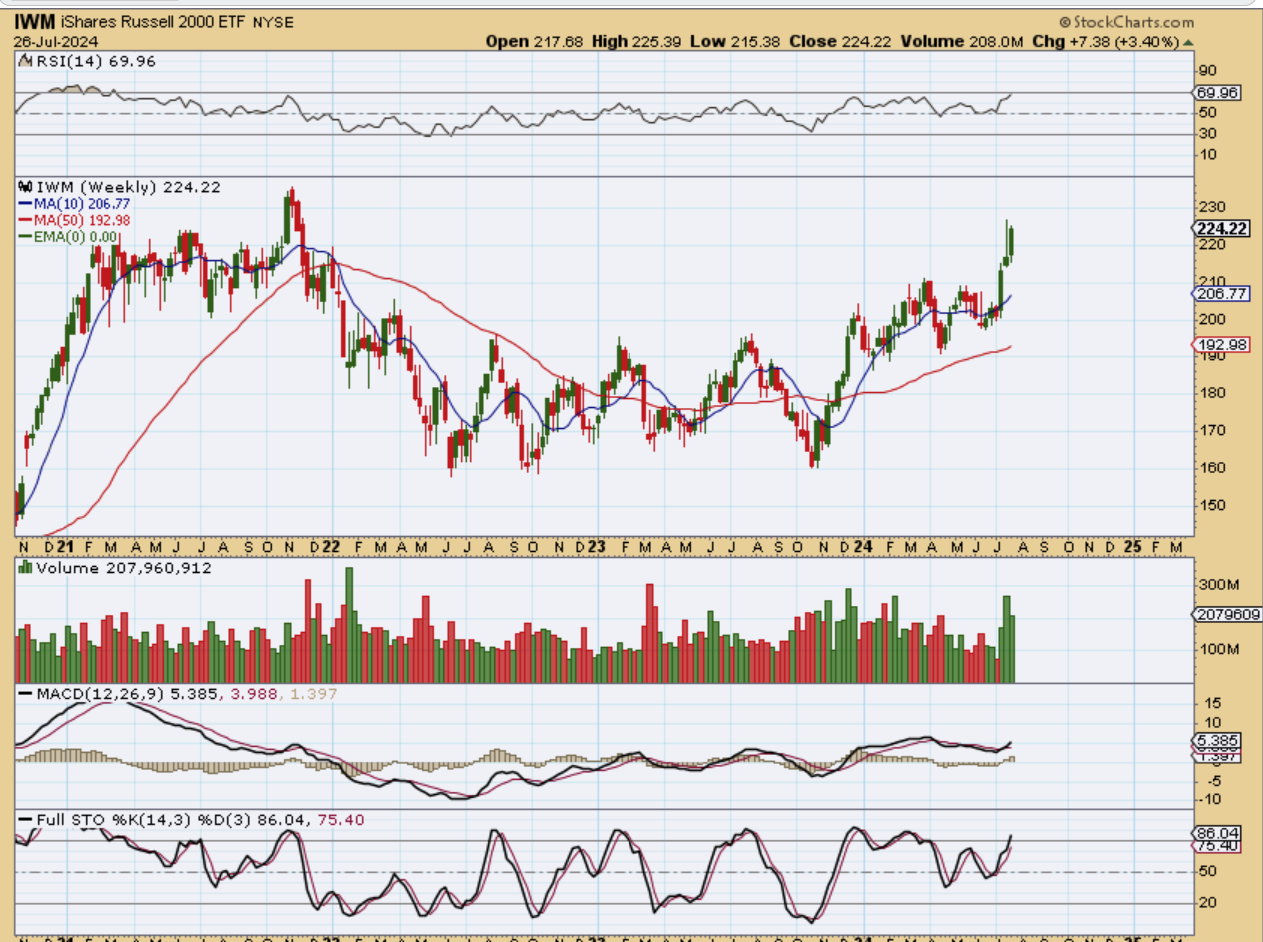
It still seems off that THE IWM ran higher by 3.40 % this week, but it did. It has formed a large cup over a good part of the past 3 years.
.
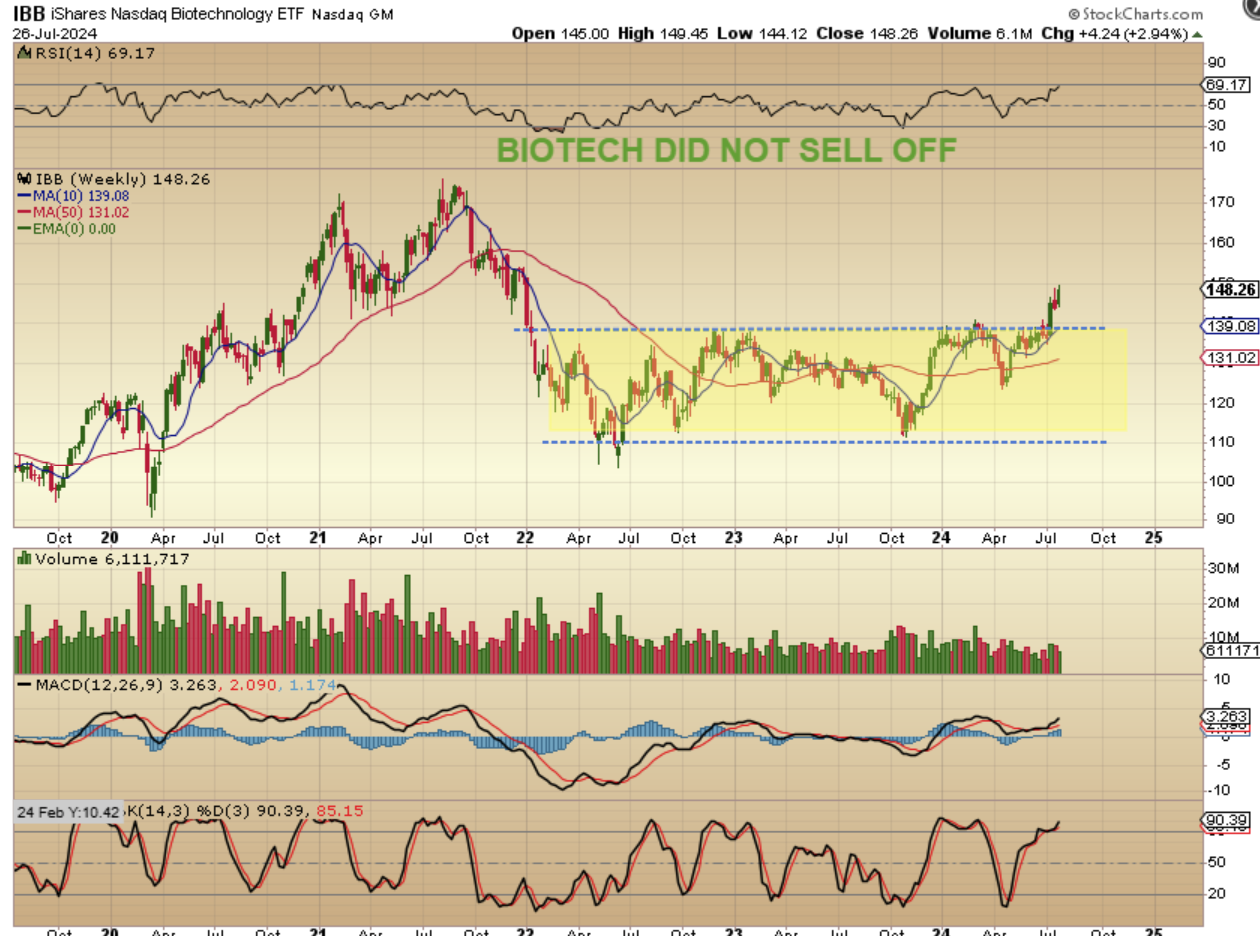
I also have pointed out that The Biotech Sector (IBB AND XBI) has remained bullish with the recent selling. Here you can see that the IBB Weekly closed up near the highs and also looks like it just recently broke from a LONG BASE.
.
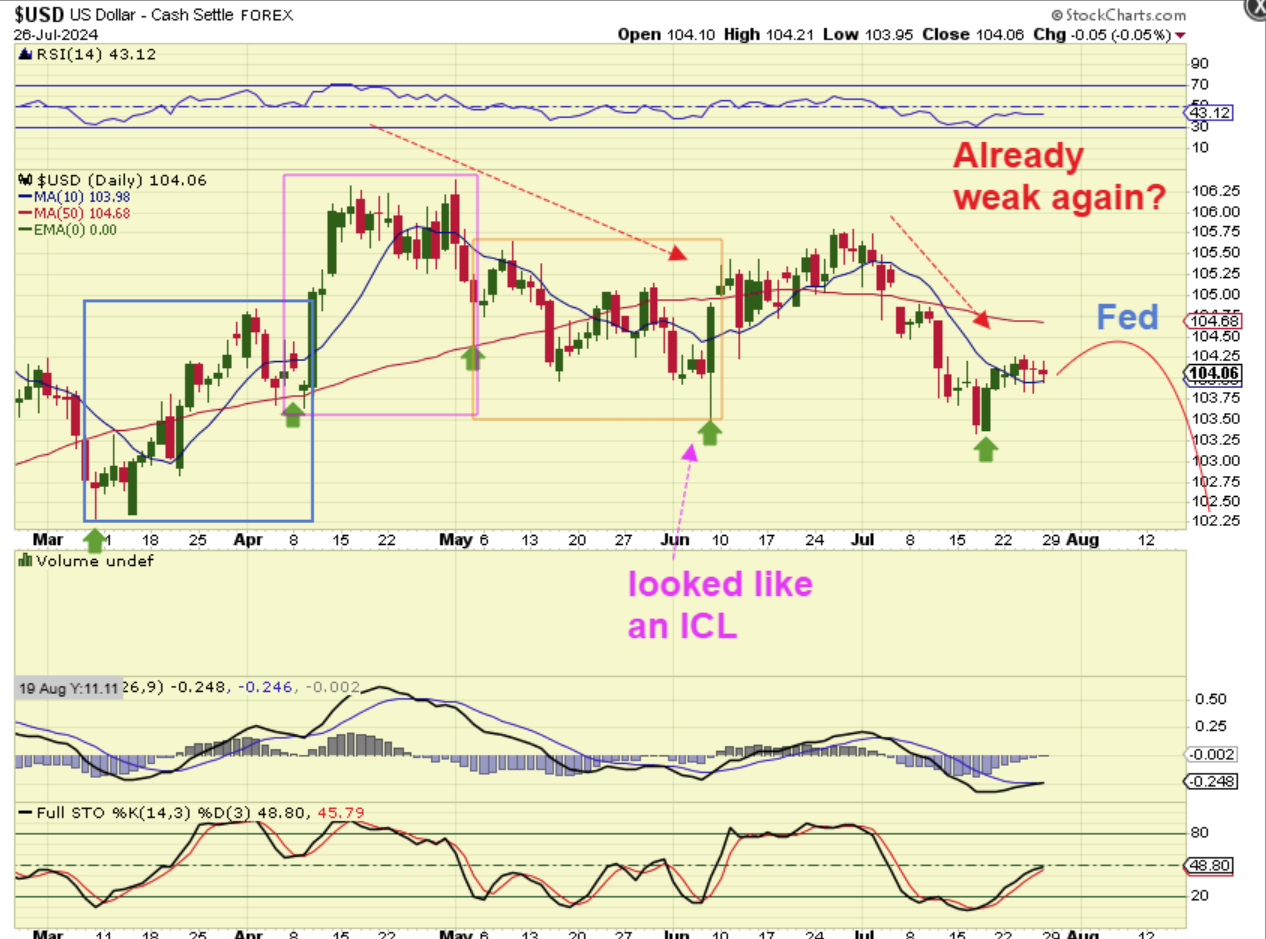
I have not been covering The USD in the day to day reports as much as I did in the past, but it seemed to become weak just as quickly as Gold became strong when Gold rallied and appeared to put in an early ICL.
.
Here you see the USD sell off into what looked like an ICL in April to June as Gold peaked. Then it should have rallied for 2 daily cycles, but it ran up and sold off in July instead. This happened when Gold should have continued lower into an ICL, but it recovered. These changes were the result of inflation Data and talks of a rate cut in September. Now, despite a bounce, the USD still just looks weak to me already.
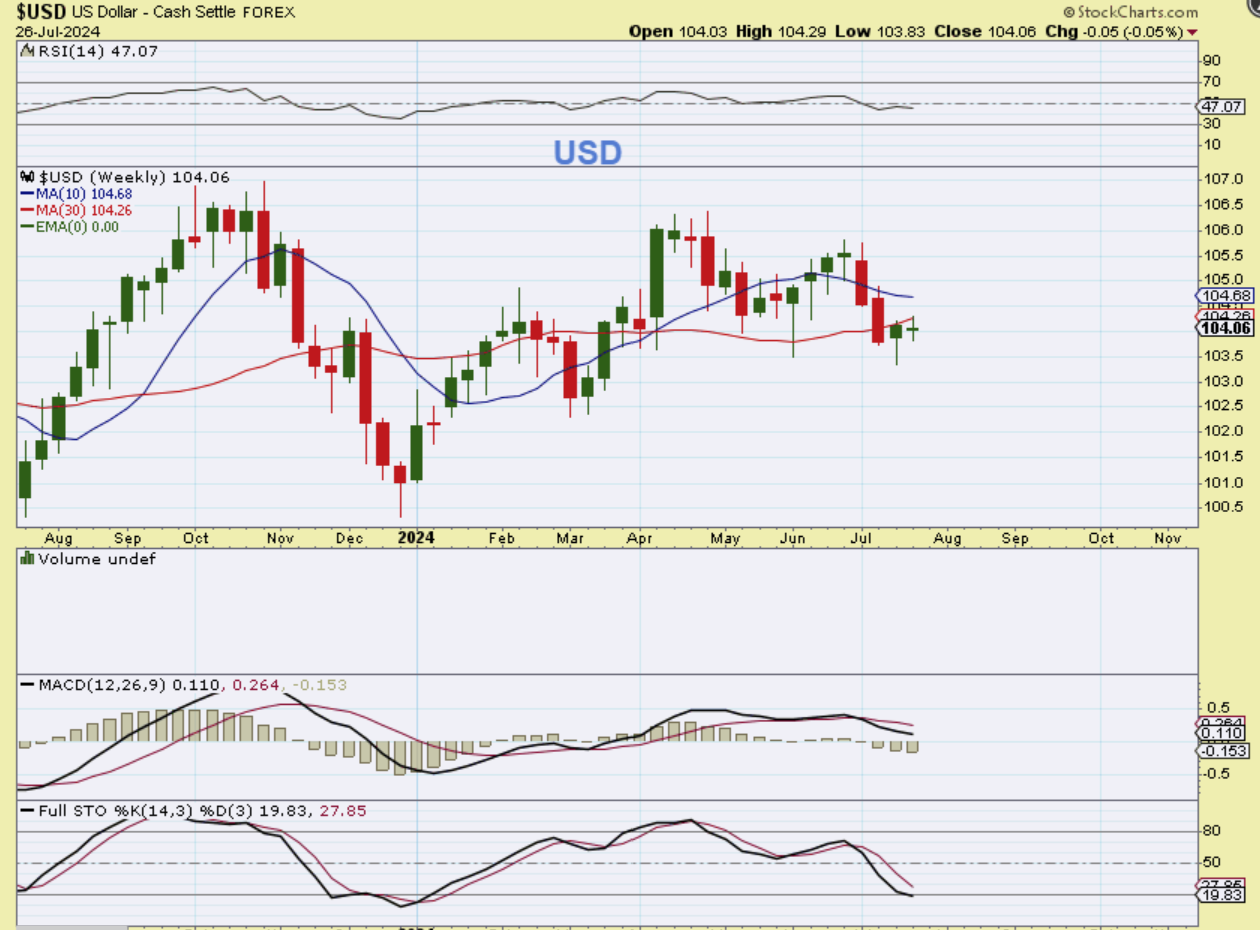
So The USD WEEKLY sold off for 2 weeks in June (& Gold rallied then out of the lows) and then it put in a reversal and a doji candle over the last 2 weeks. This could do one more sideways doji next week (Fed Week), and then sell off further.
.
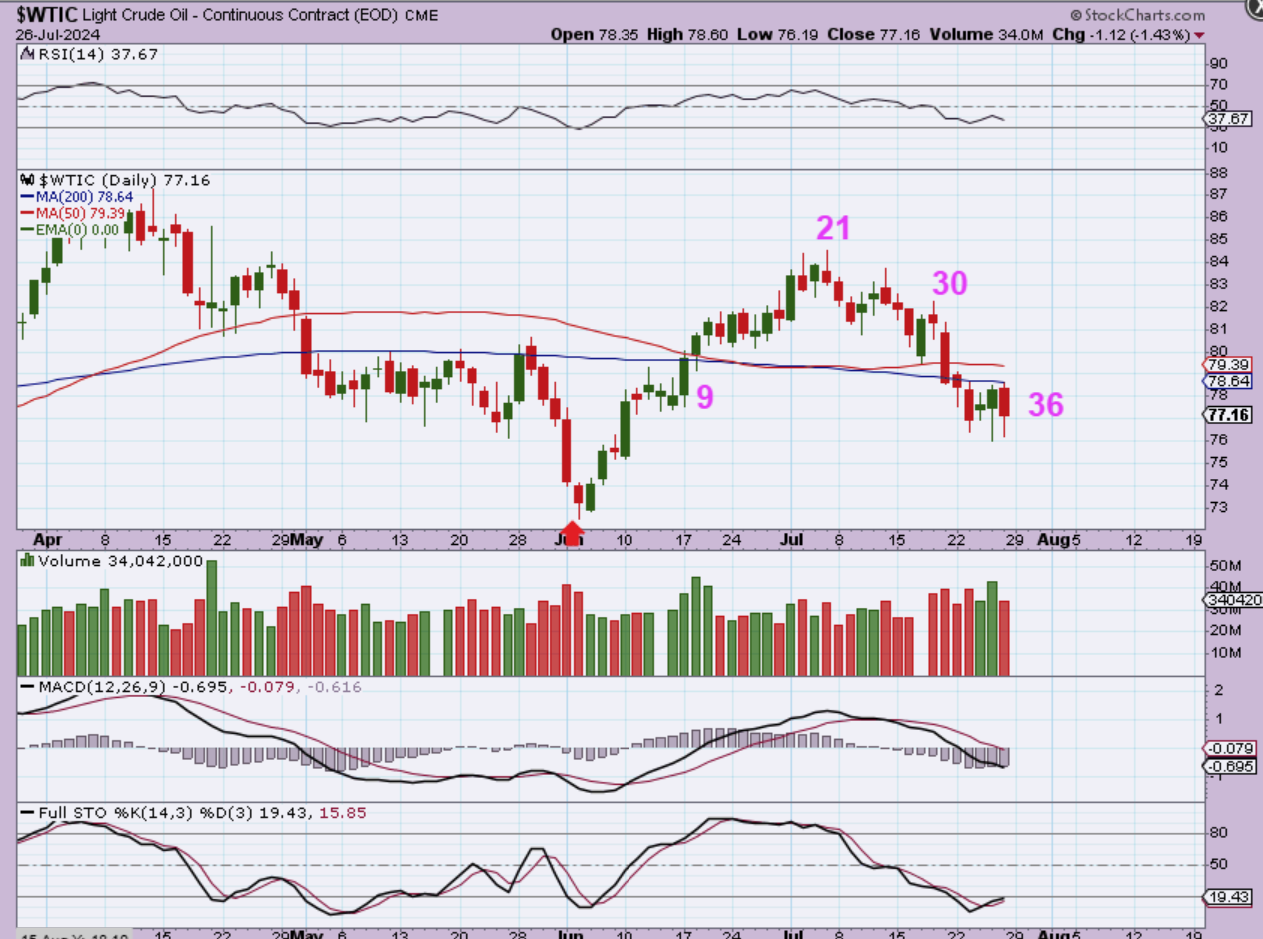
WTIC – Oil rallied strongly out of an ICL of its own, but it peaked on day 21 and started to sell off into what is now day 36. It lost both the 50 & 200sma. Oil can be tricky, because you can get a dcl anywhere around here, but the daily cycles have also lasted up to 50 days many times. Will this break higher through the 50 & 200sma and leave a dcl next week? It is hard to say, but the weekly chart may help us to predict the path here…
.
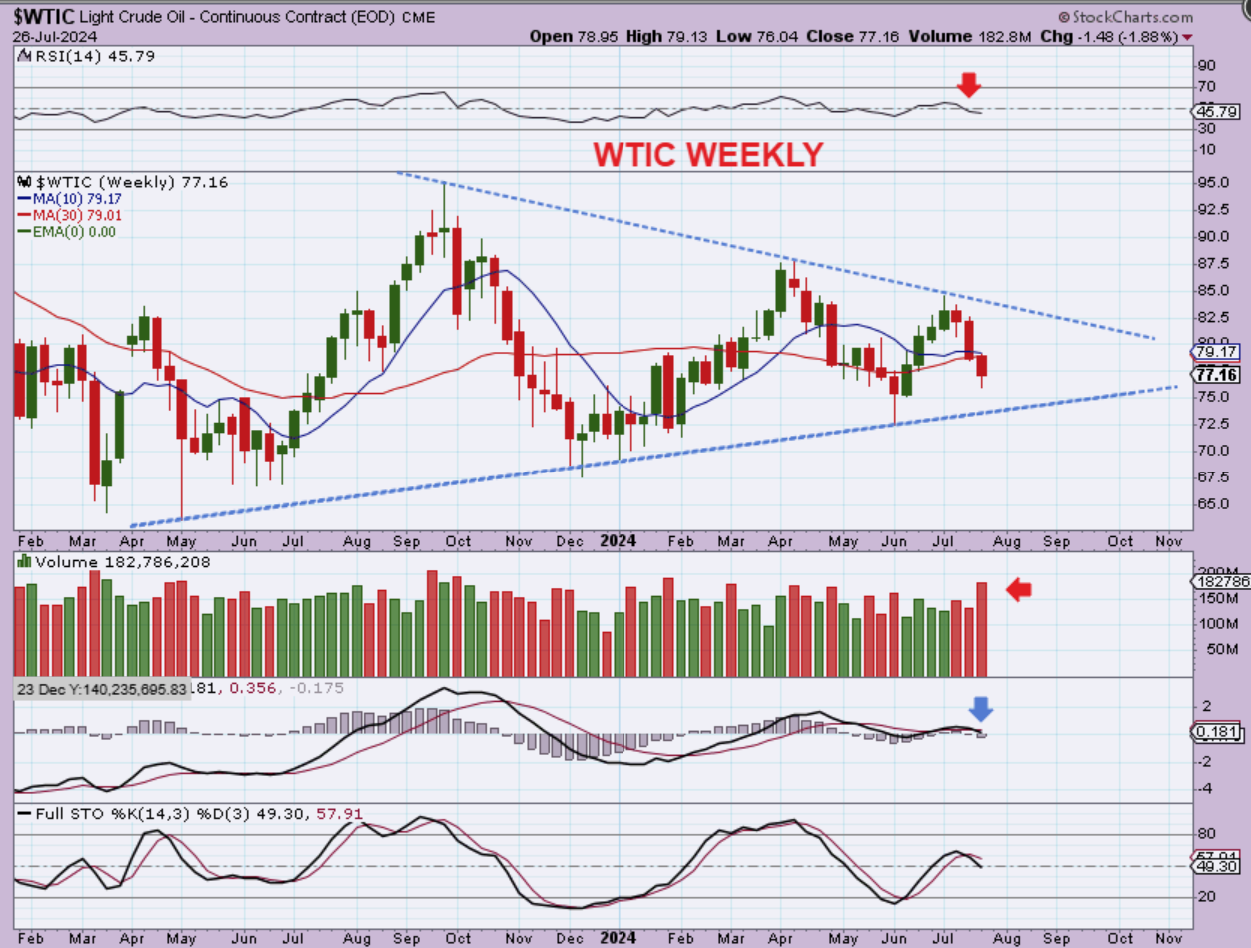
The WTIC WEEKLY is forming a large triangle, and this kind of makes it look like Oil may struggle to go higher at the 50 & 200sma on the chart above, and use up some time as it chops lower into a day 40 plus dcl. It will still put in a R.T. First Daily and a higher low. That said, The Oil stocks do look ready to move higher….
.
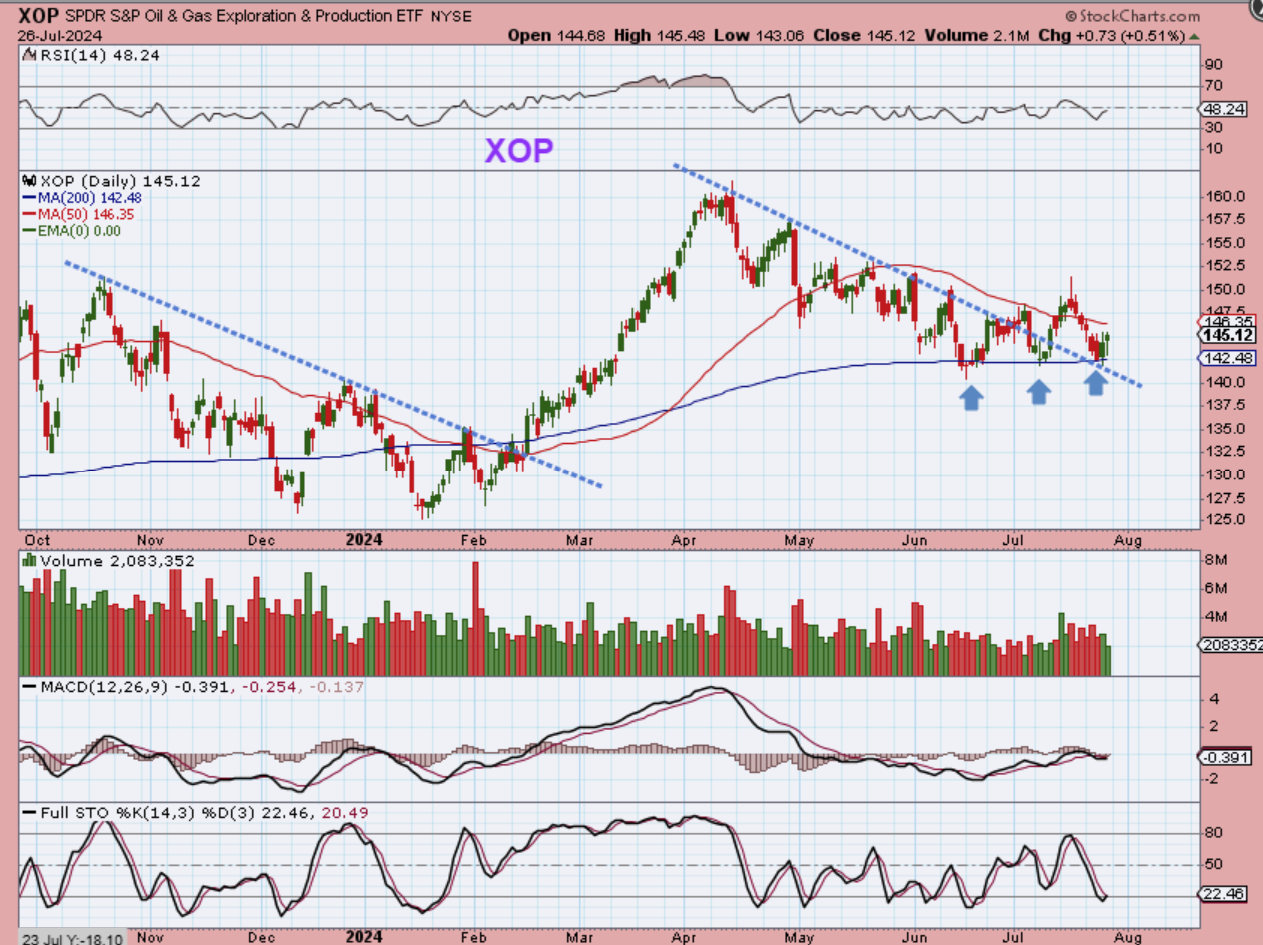
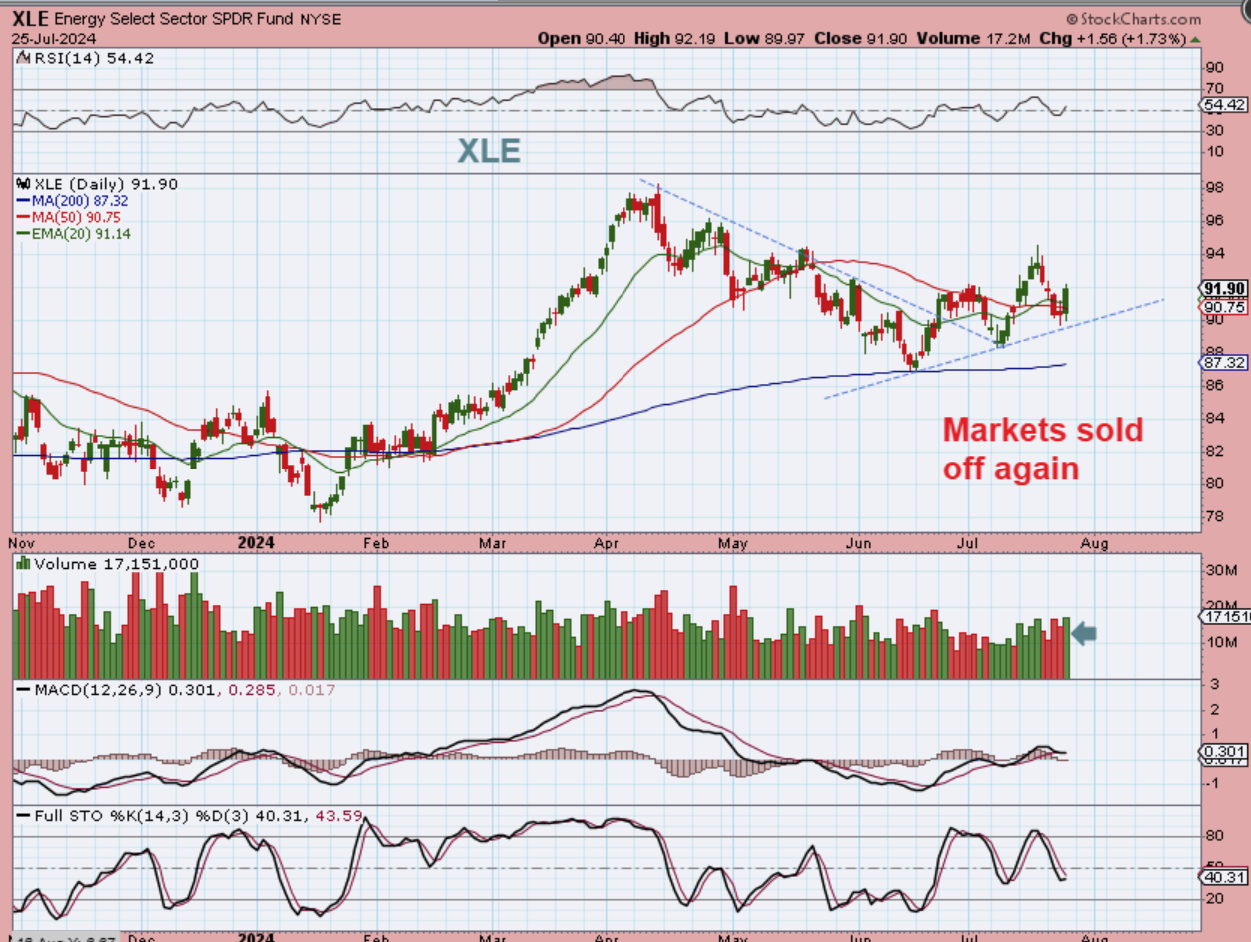
XOP ( & XLE) landed on support and have been slowly chopping higher. Here the slightly weaker XOP is chopping along ABOVE the 50sma, so that is bullish.
.
In Fridays report: Here The XLE is climbing higher along an uptrend. It has been choppy, but progressive and this week it was nicely green despite a market sell off, so Oil stocks are resisting the sell off. I then discussed VLO, WTI, APA, OKE, NOG, etc as trades in this area.
.
THIS SECTOR IS LOOKING TO BE SETTING UP BULLISHLY:
.
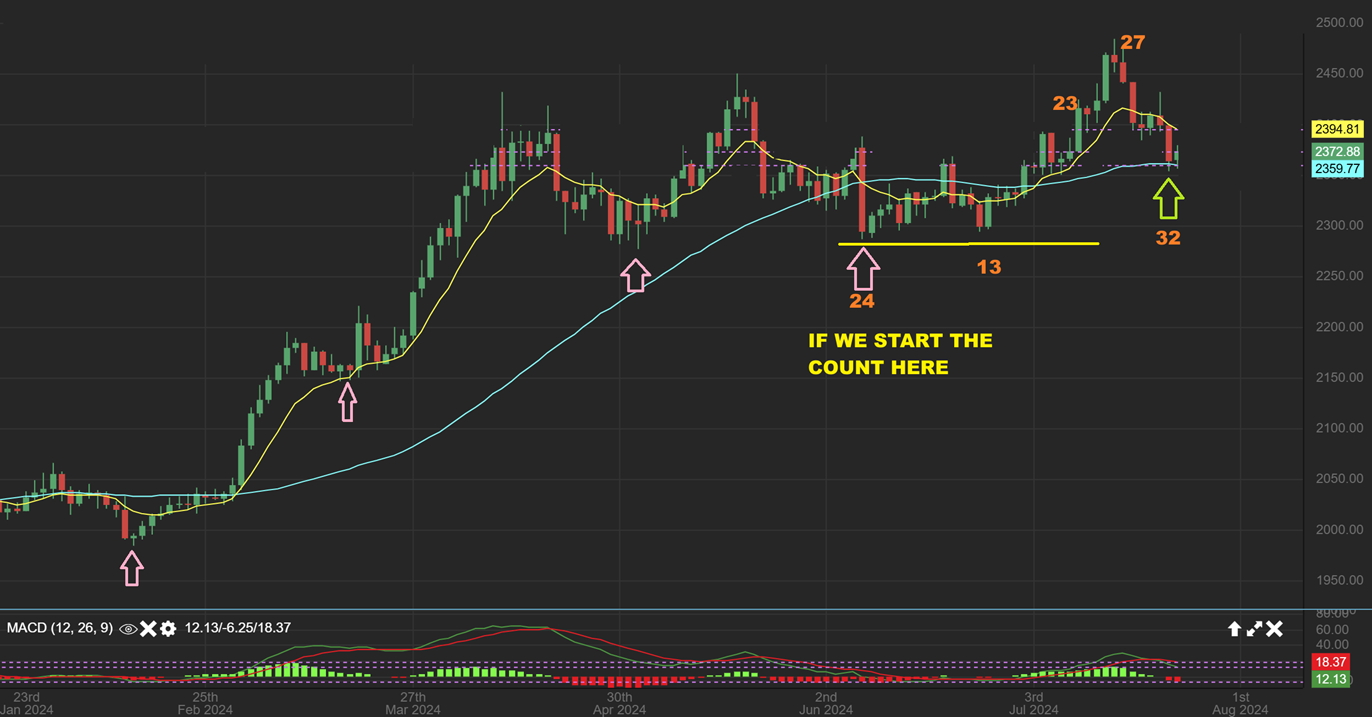
FROM FRIDAYS REPORT WITH THE GOLD DAILY CHART: Using the futures, Golds lowest point was that day 24 slam down, and if we count from there as the ICL, we would be at day 32 on the 50sma. If that was an ICL that ran to a higher high (in this case an all-time high), then we should make a higher low. Gold could be close to a dcl. It may do a ‘shake out’, since the FOMC is next Wednesday. That FOMC Wednesday would be day 36 for Gold.
.
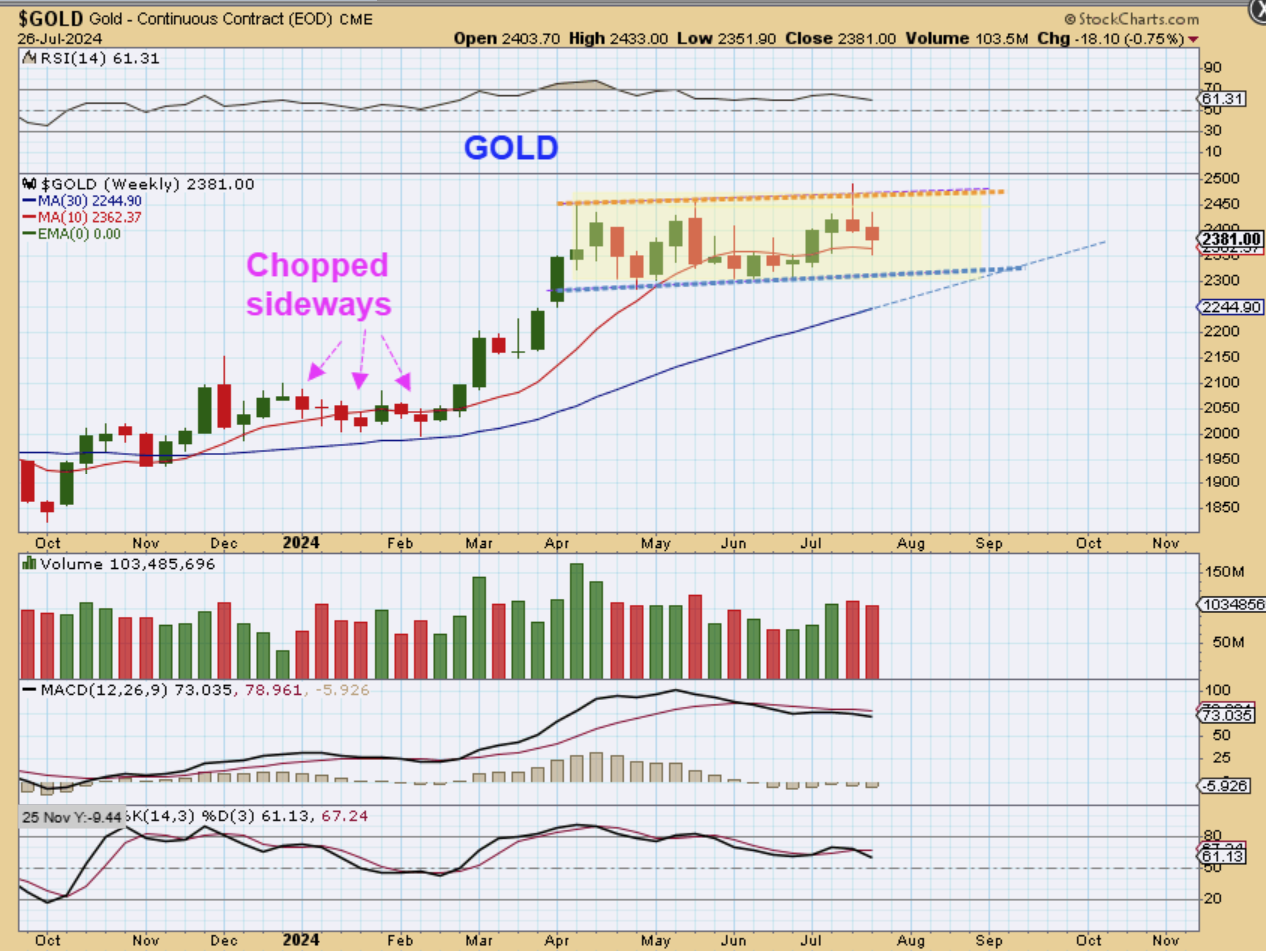
GOLD WEEKLY – As you know, Gold rallied early in a very strong manner and broke to new highs, but last week I said that the weekly chart looked like a ‘False breakout’ and could pull back. With this long box consolidation, Gold has chopped sideways more about 16 weeks and that could be very bullish when the Fed Pulls the trigger. Gold is also due for a dcl this week (Fed week) and with an ICL in place, Gold should not break the lows. I will admit that I don’t love that MACD set up right now, but a rally would change that.
.
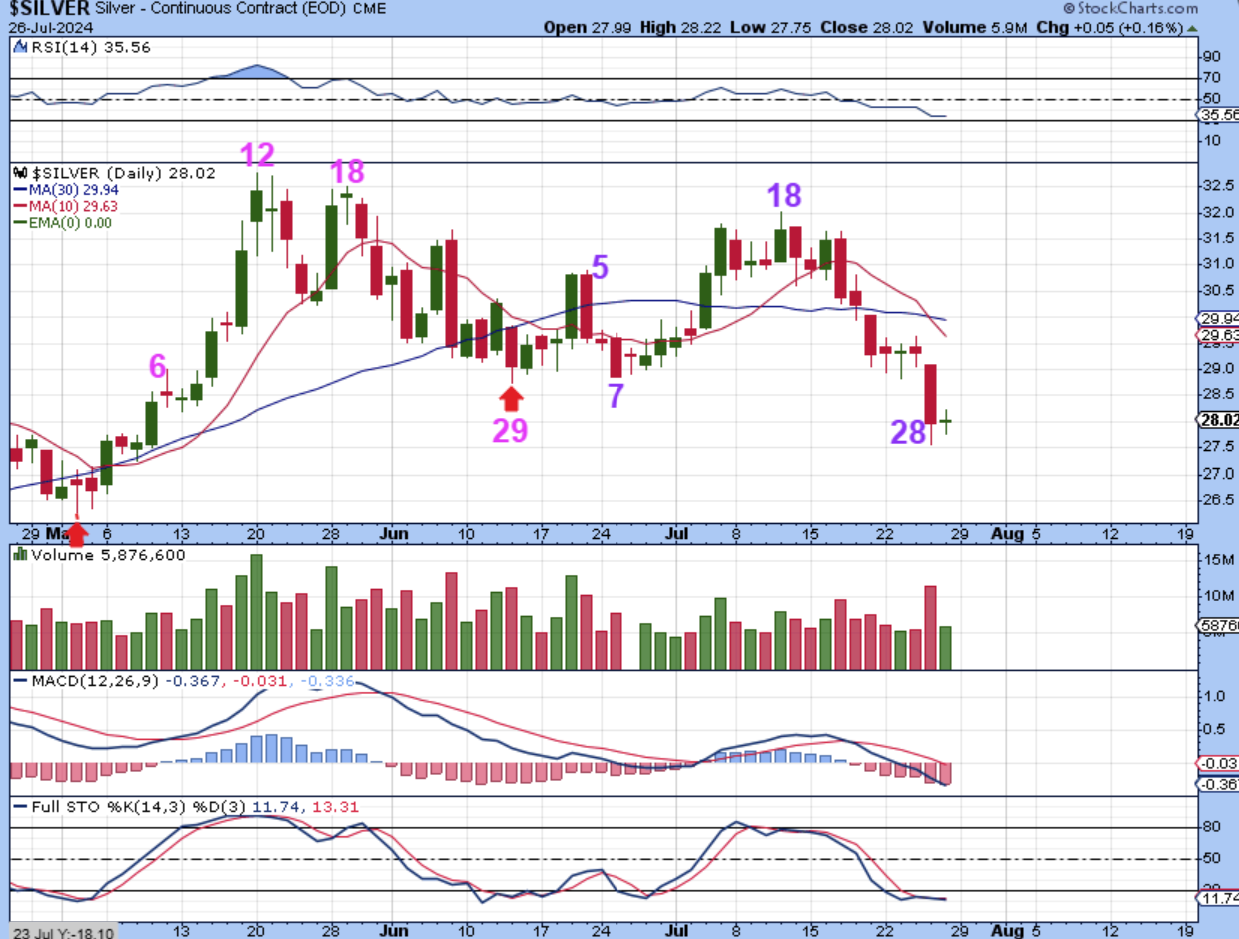
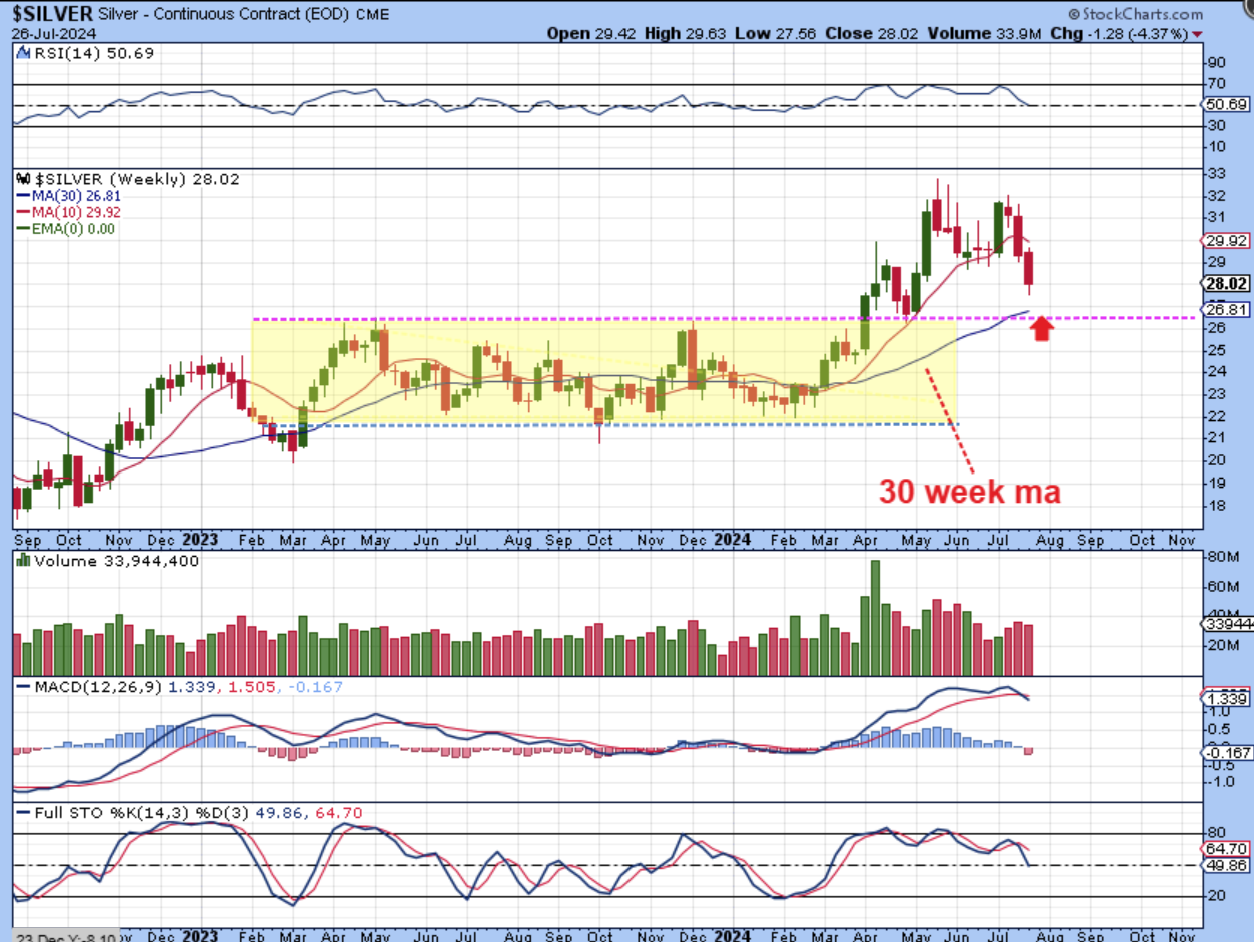
SILVER sold off and broke down last week. At day 29, we should be close to a dcl (Fed Wednesday?). Notice that
1. Silver did not make new highs, and it did not look like it put in an ICL.
2. Now Silver broke to new lows below the last dcl, as it should have in order to put in a proper ICL. Silver seems to be seeking an ICL.
3. Back on July 19th…
.
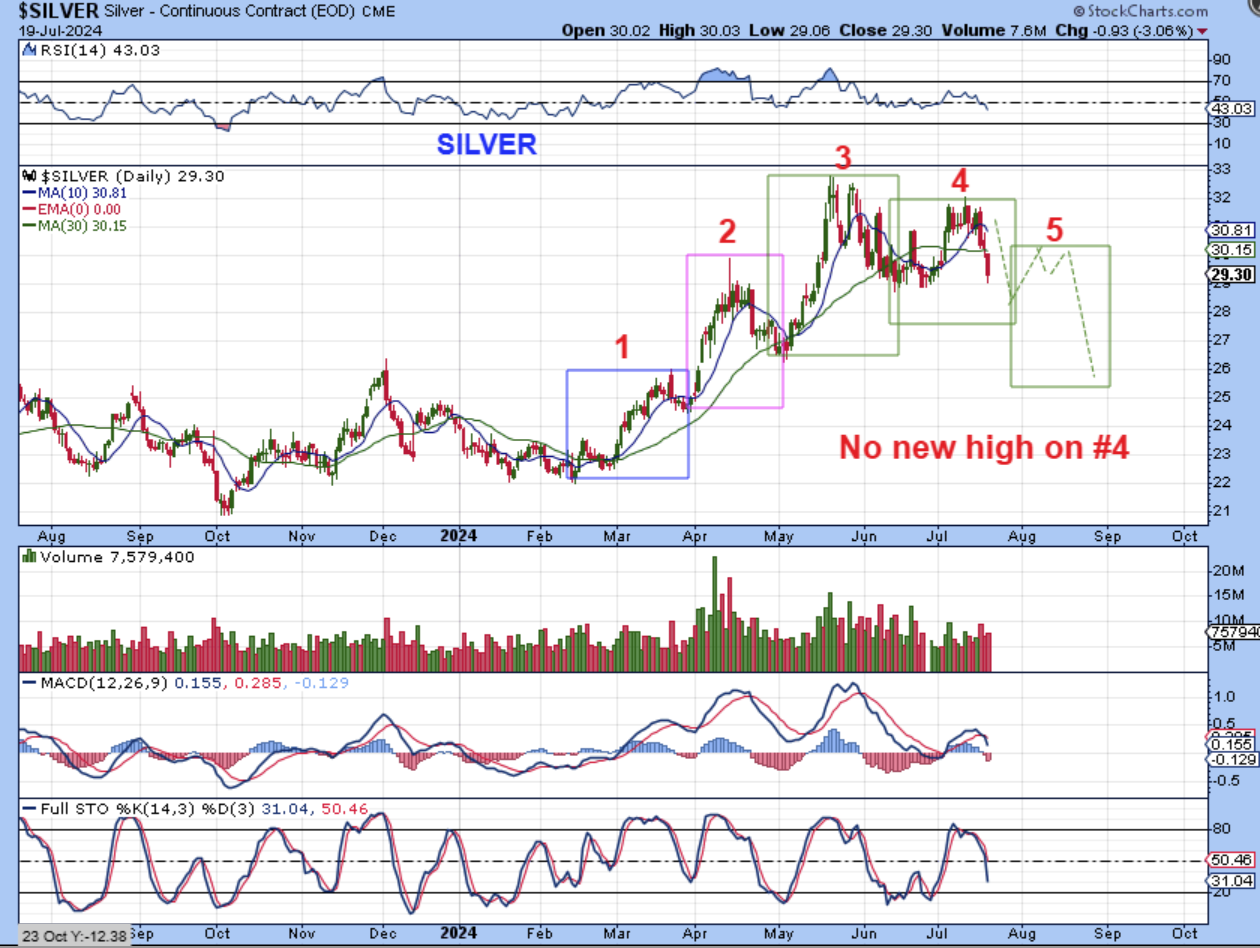
Back on July 19, using this chart, I had been pointing out that a 5 daily cycle drop would give us a proper looking ICL for Silver, and Gold and GDX seemed to already have an ICL. I am seeing this take place now and this SHOULD BECOME a great buying opportunity for Silver stocks. That time may come after the Fed Mtg next week. CAN SILVER GO ANY LOWER???
.
SILVER WEEKLY– Yes, I do think that Silver could drop one more Dollar to tag the 30 week ma heading into the Fed, but it doesn’t have to. That is normal behavior and would also be a second back-test of the breakout. Again, this drop does NOT have to happen, but since we are at day 29 on the daily chart? It could drop a bit more as we head into the Fed.
.
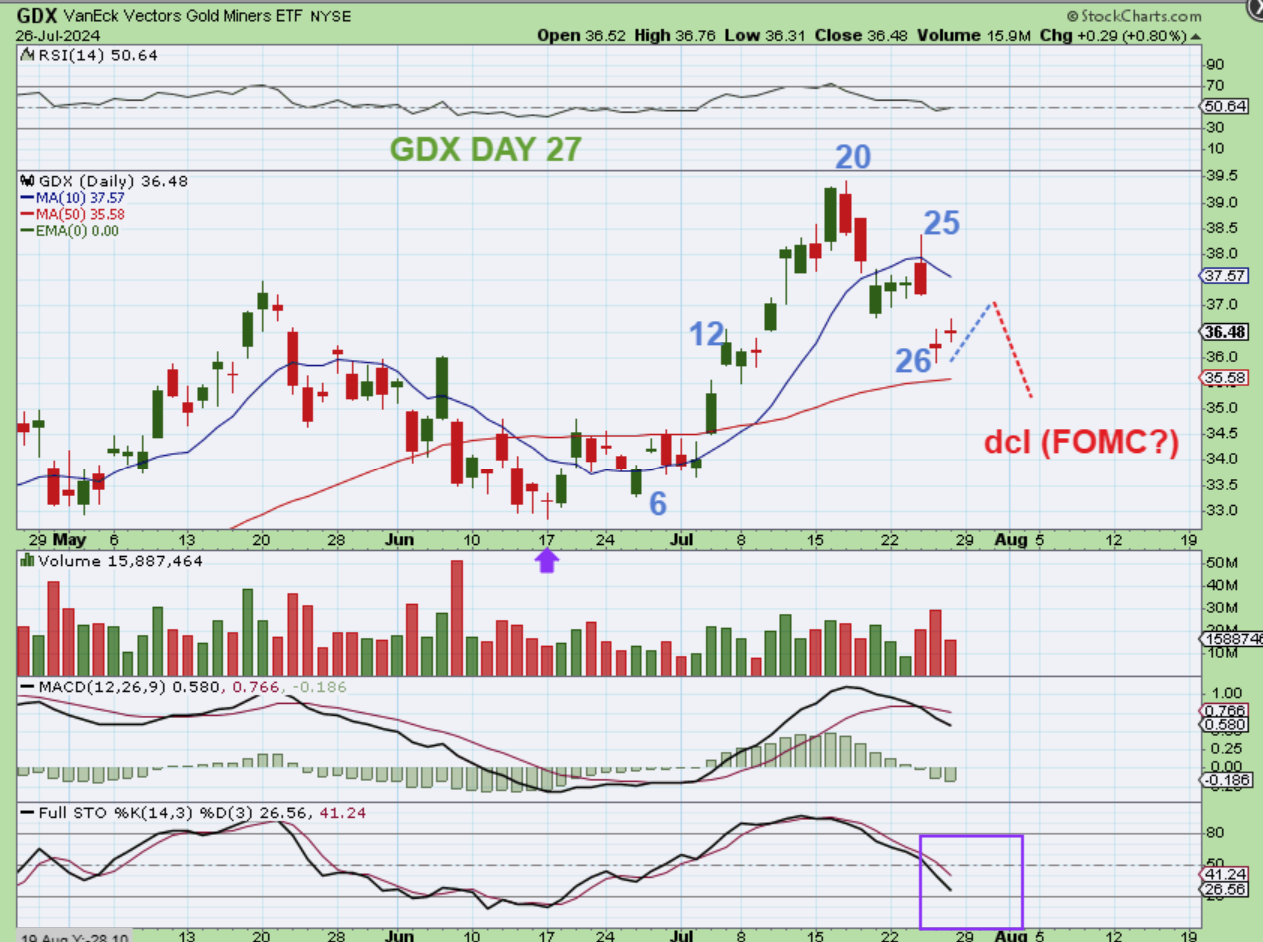
GDX bottomed at day 26 so far and is on day 27 as of Friday. This also could drop a bit more as we head into the Fed Mtg, which would come on day 30.
.
GDX WEEKLY: You can see that the 30 week ma is a just little lower from here, so this matches the daily chart where we saw that GDX could drop a bit lower next week heading into the Fed Mtg.
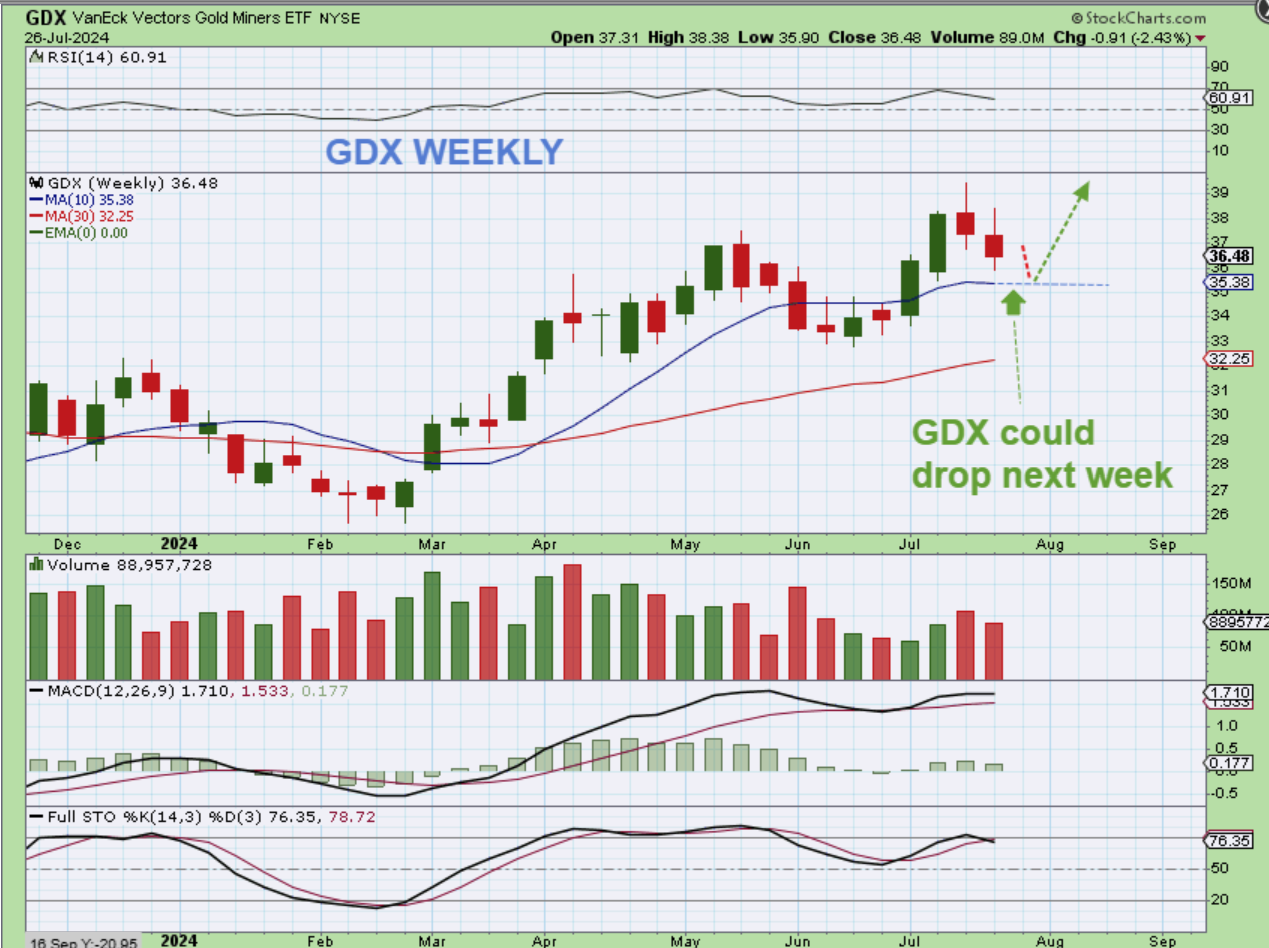
So basically Gold & Silver look to have an ICL, because they rallied strongly and put in New highs. Now they should make new higher lows. That also seems to set up a possible buying opportunity as soon as next week (maybe post-Fed) for the Miners. Some individual Miners may not dip back too far also. Oil and Biotech’s are also still looking good, but the General Markets need monitoring. Why? The SOXX specifically had a sharp selloff that caused damage a bit too early in this Intermediate Cycle. The SPX & NASDAQ also sold off sharply. This is only the 2nd daily cycle, so a bounce may become a short-able trade. I think that I am going to wait until AFTER the Fed Speech to see how these markets react to what he says. They were rallying at any hint of a rate cut, so this set up really isn’t in line with what we would expect to see after this Fed Mtg, but these things happen. We may have been rallying on the news and now we will sell down into the Sept Fed Mtg, and then see if we get that rate cut. It really bears watching.
.
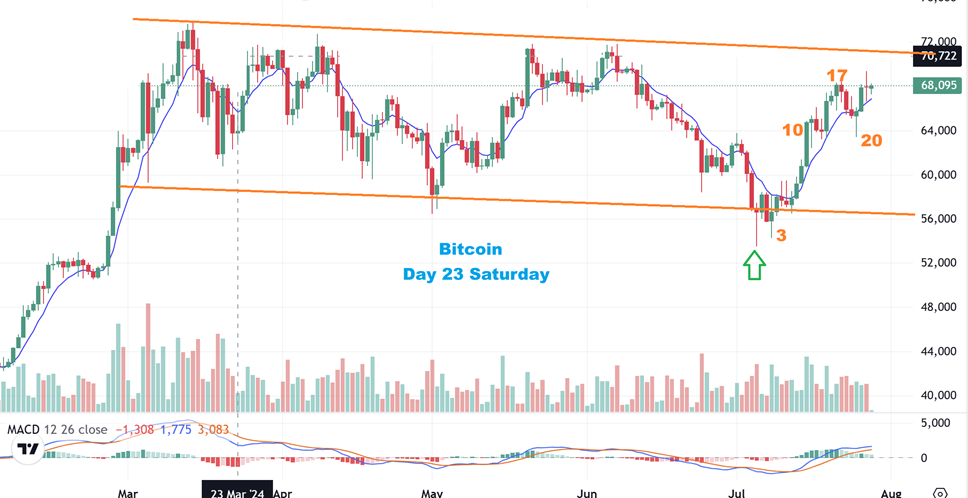
I hope that all are having a great weekend, especially since last week was a bit rough with the volatility and General Markets dropping. I made a little money in Biotech with LABU, NVAX, and a few others, but it didn’t make up for the losses that I had in my basket of Cry;to Miners (& I mentioned that I sold them for now). Bitcoin still looks very bullish, so it is odd that the crypto stocks still look unsure and lack luster. I’m still keeping an eye on them, but now I feel that they may not run until Bitcoin breaks to new highs? They aren’t ugly, but they aren’t running. I’ll cover Bitcoin below and again, it remains bullish. Enjoy your weekend!
.
~ALEX
.
FRIDAY MORNING I SAID:
BITCOIN dropped to the 20 ema an then recovered the 8 ema here, with a spike lower. Overnight Bitcoin took off higher so this is still a very bullish set up and buying the BITCOIN ETFs has been better than buying the crypto stocks on this leg up. Today we’ll see what the crypto sticks want to do.
.
BITCOIN is still quite a bullish looking set up , and it has moved higher out of the lows, as expected. I would GUESS that this tags the upper trendline or former price highs, and then pulls back into day 30 (ish). That could be followed by a breakout and run higher into day 60. Crypto stocks are popping and dropping and not having the follow through that I had hoped for (Yet?).
.
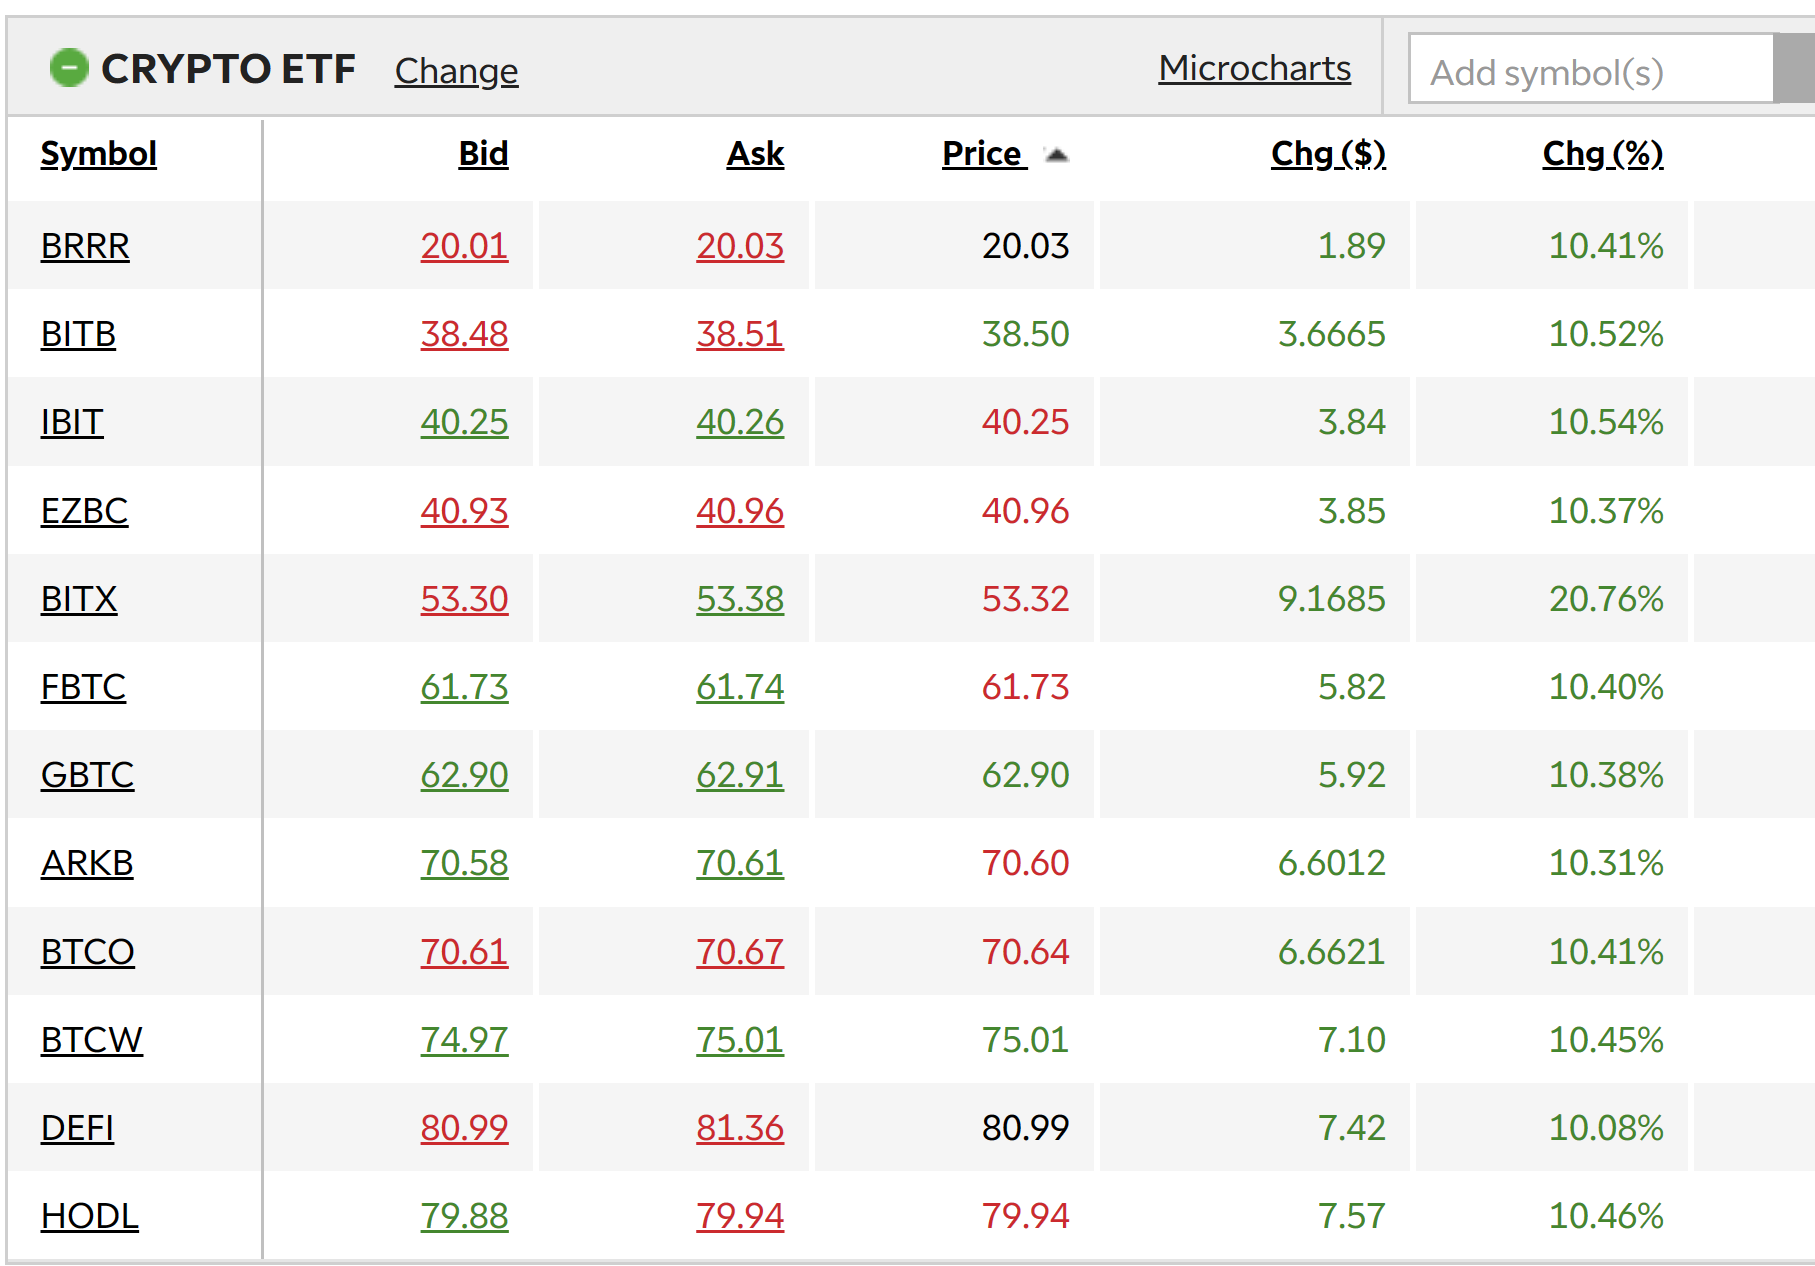
I had posted this list of ETFs that follow BITCOIN itself better, and they have been rising and falling with Bitcoin, so this may be where you want to enter a trade in the Bitcoin area. Maybe on the next pullback into the day 30 time(?), or maybe start now and add on dips later if this is your desired trade.