Thursday July 25th – Swift Changes
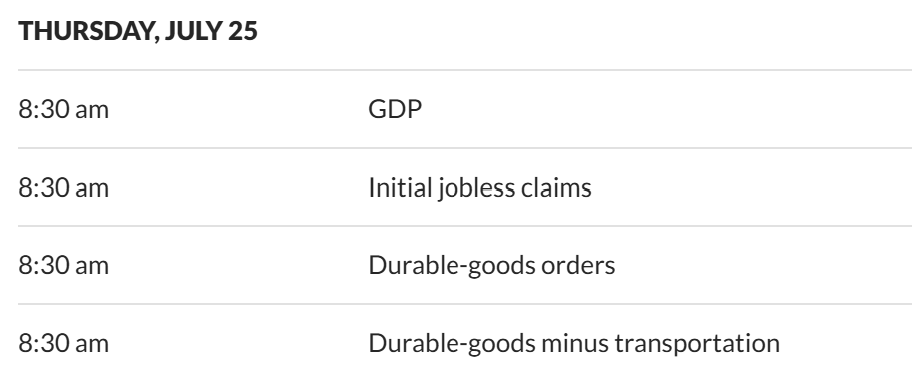
DATA: After yesterdays ‘crash’, I don’t know if the data matters or not, since the markets may just do as they wish. This is the data for Thursday and Jobless Claims used to make the markets rally, but I have my doubts that we will get that today. Let’s look at the charts…
.
IN TUESDAYS REPORT I SAID THIS:
.
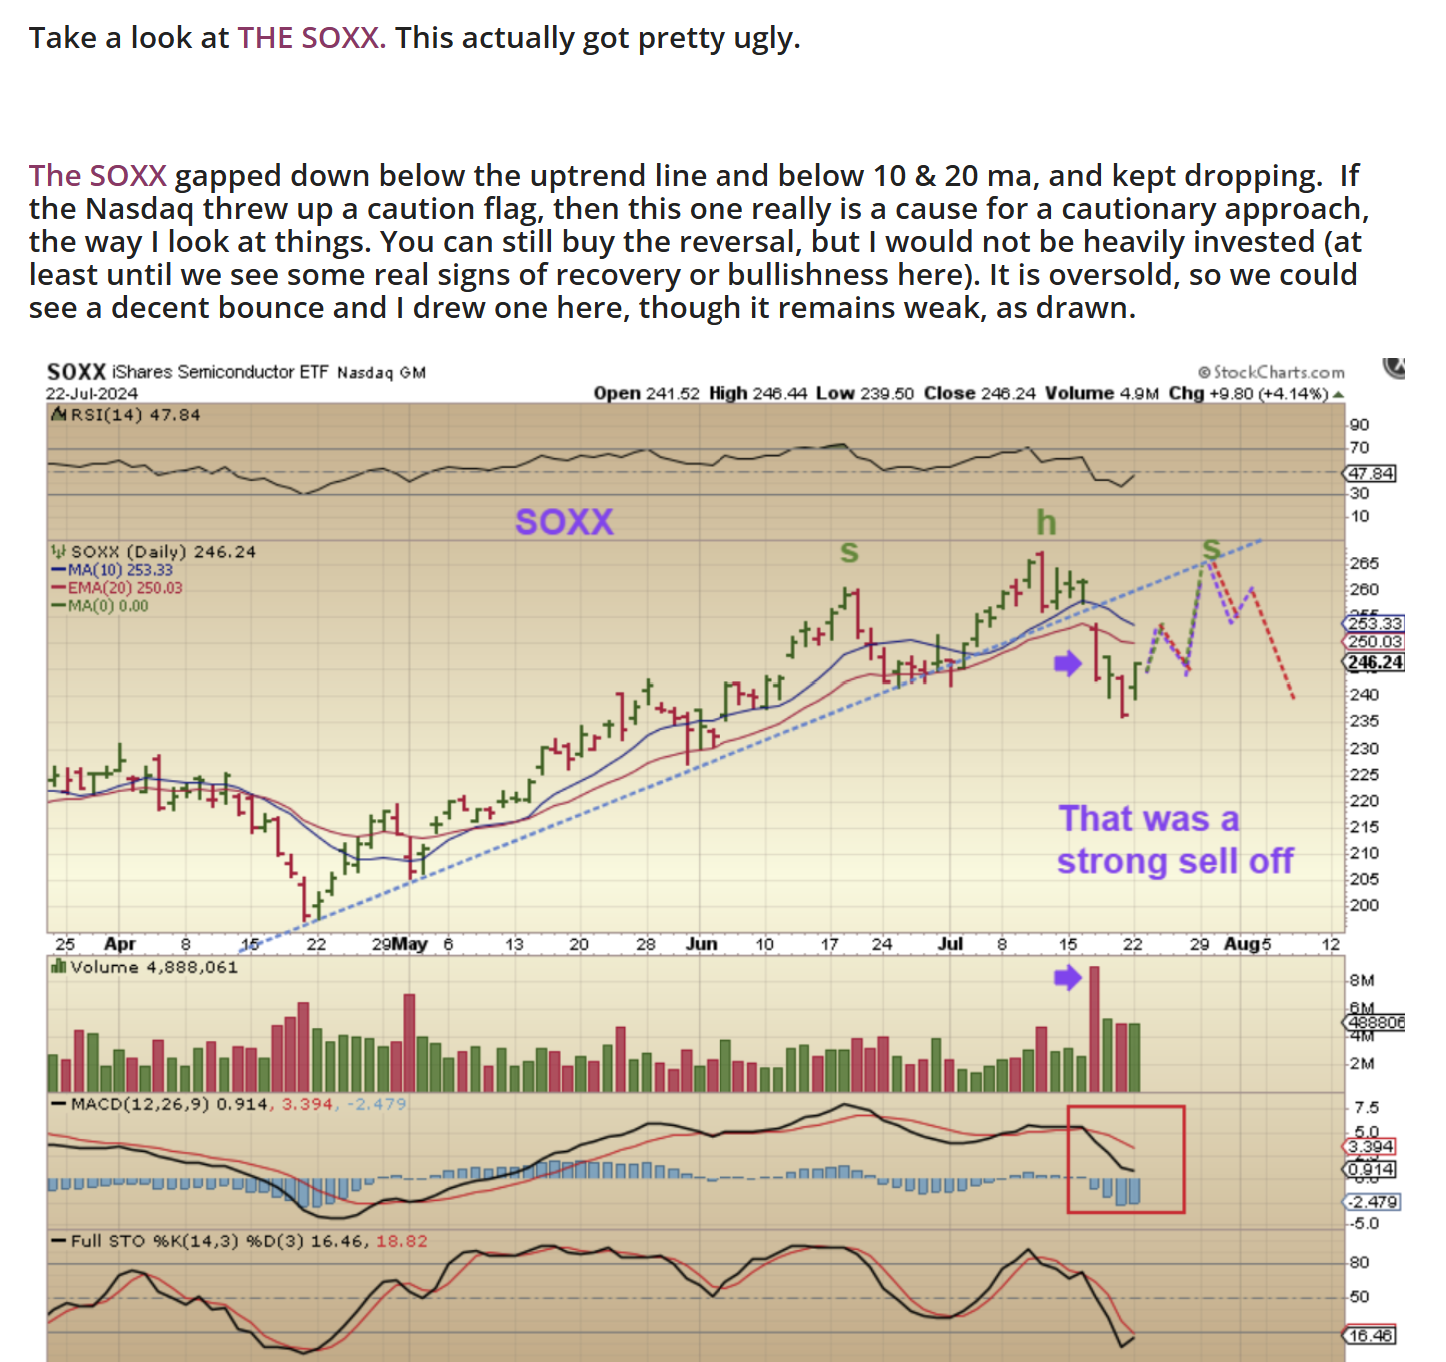
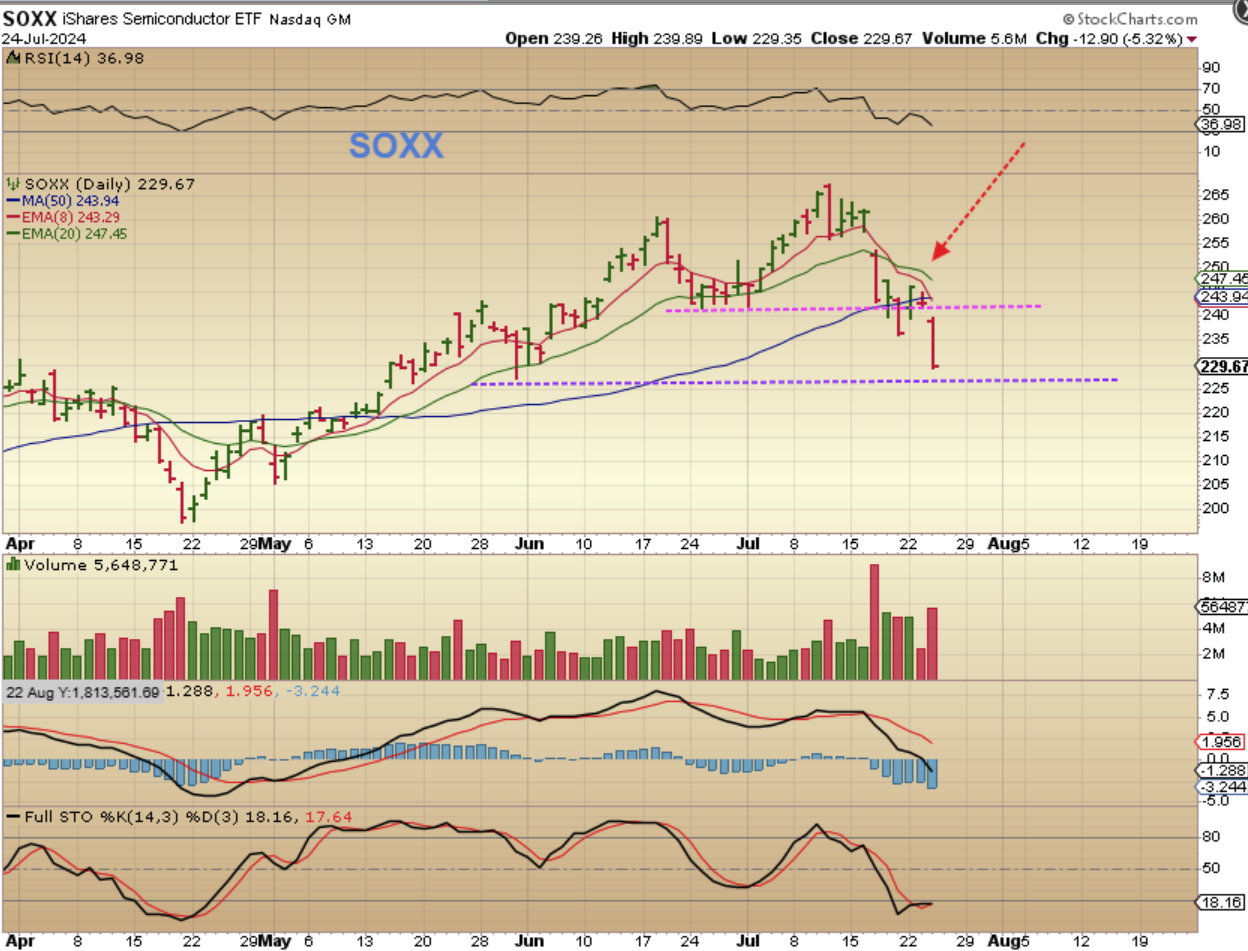
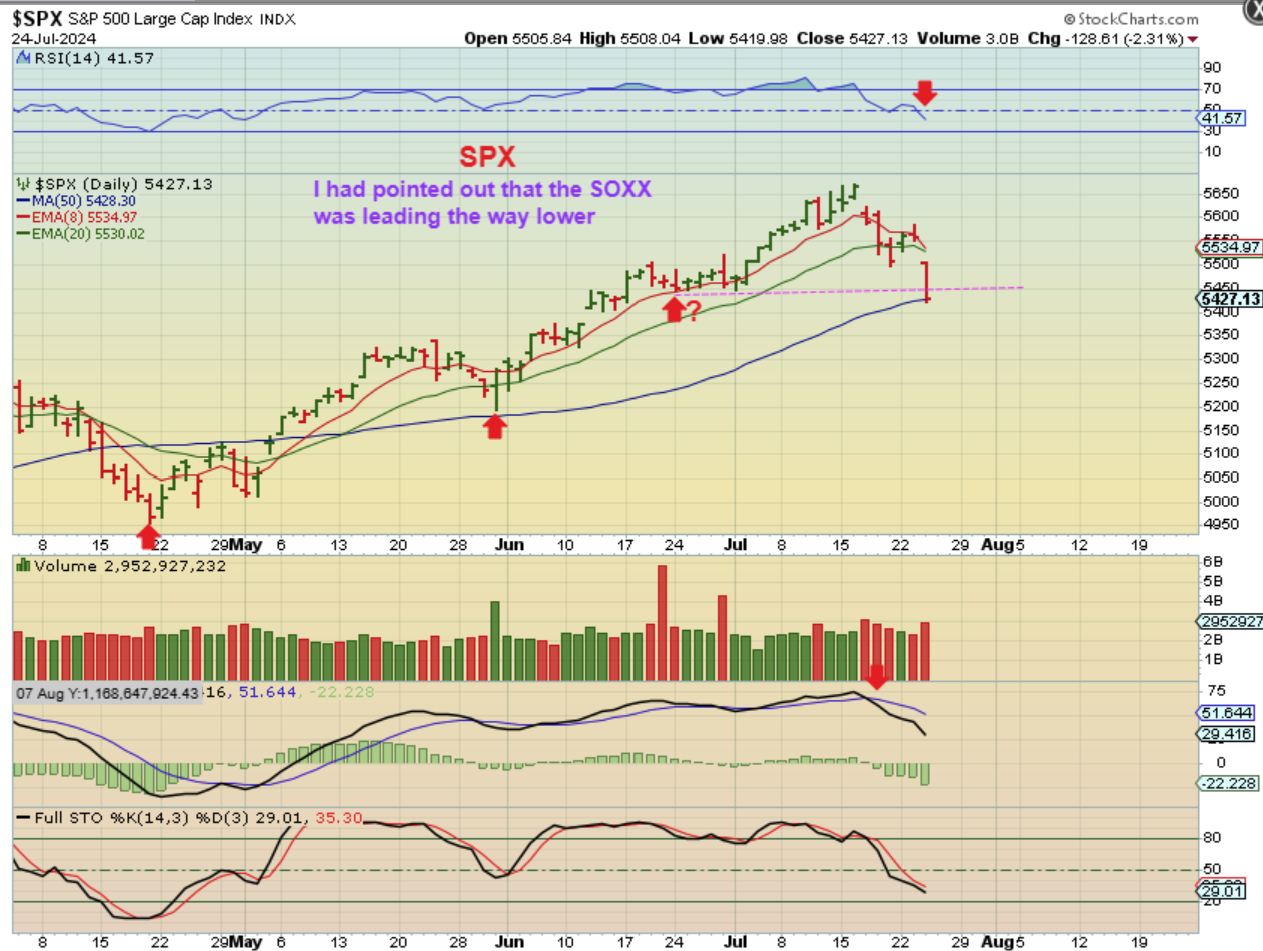
SOXX – Even before the weekend report, You may recall that I pointed out a week ago that the SOXX, often leaders of the markets, broke below what I was calling the visible DCL. THAT IS A FAILED DAILY CYCLE and longer term bearish. The 10sma turned lower at the end of June and I saw that as a dcl and this is now the 2nd daily cycle. I said that what we were seeing then was at least a warning and today we got the proof.
.
So The SPX broke down on Wednesday too. I had mentioned that the MACD was showing weakness and losing momentum. We can bounce, but take note that this is a bad sign in the 2nd daily cycle.
.
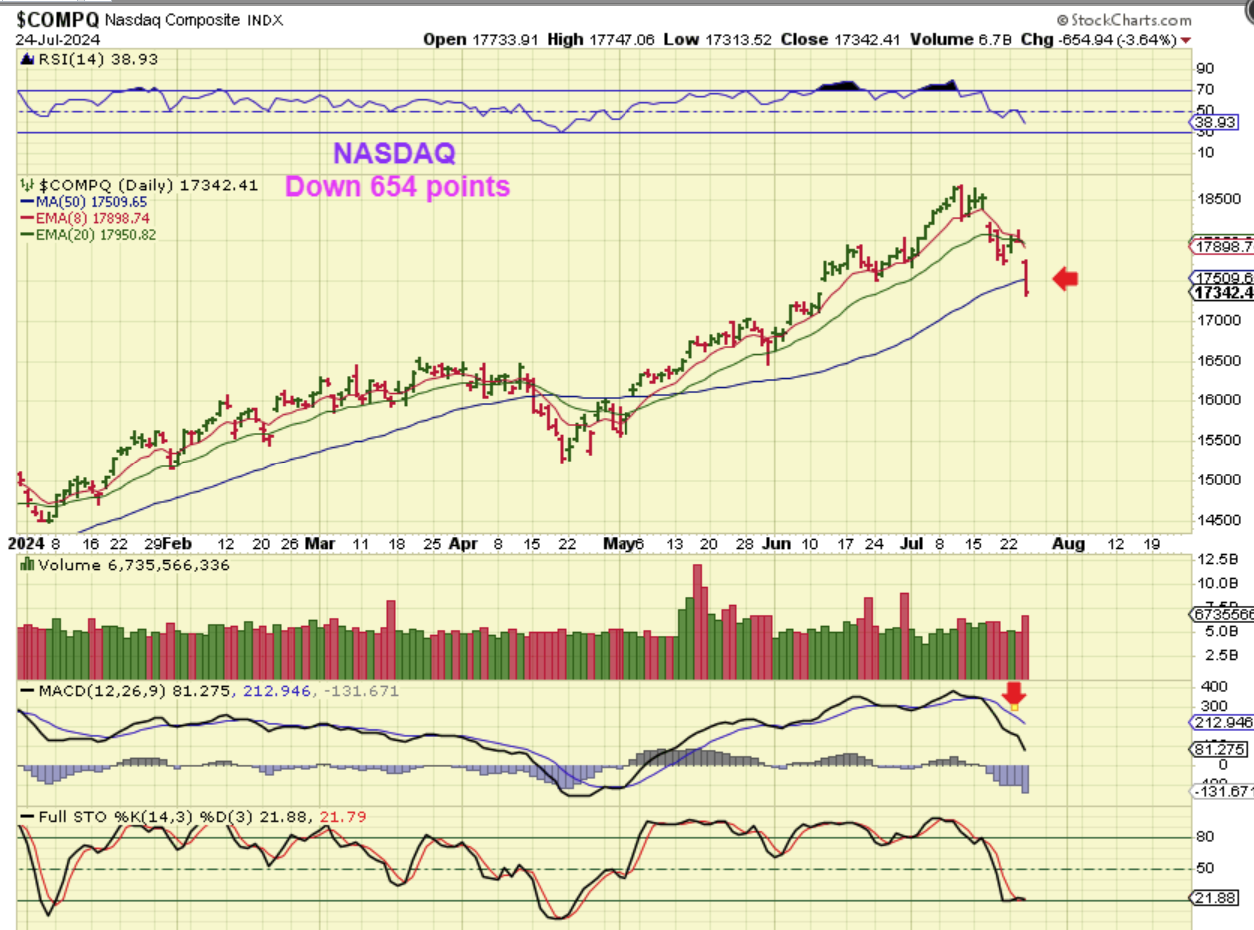
And as we approached the 50sma, THE NASDAQ did not bounce. The NAZ was down 654 points and this could get ugly over time. I kept showing the longer-term charts to view similarities or differences at the 20ema. We SEE A BIG DIFFERENCE NOW.
.
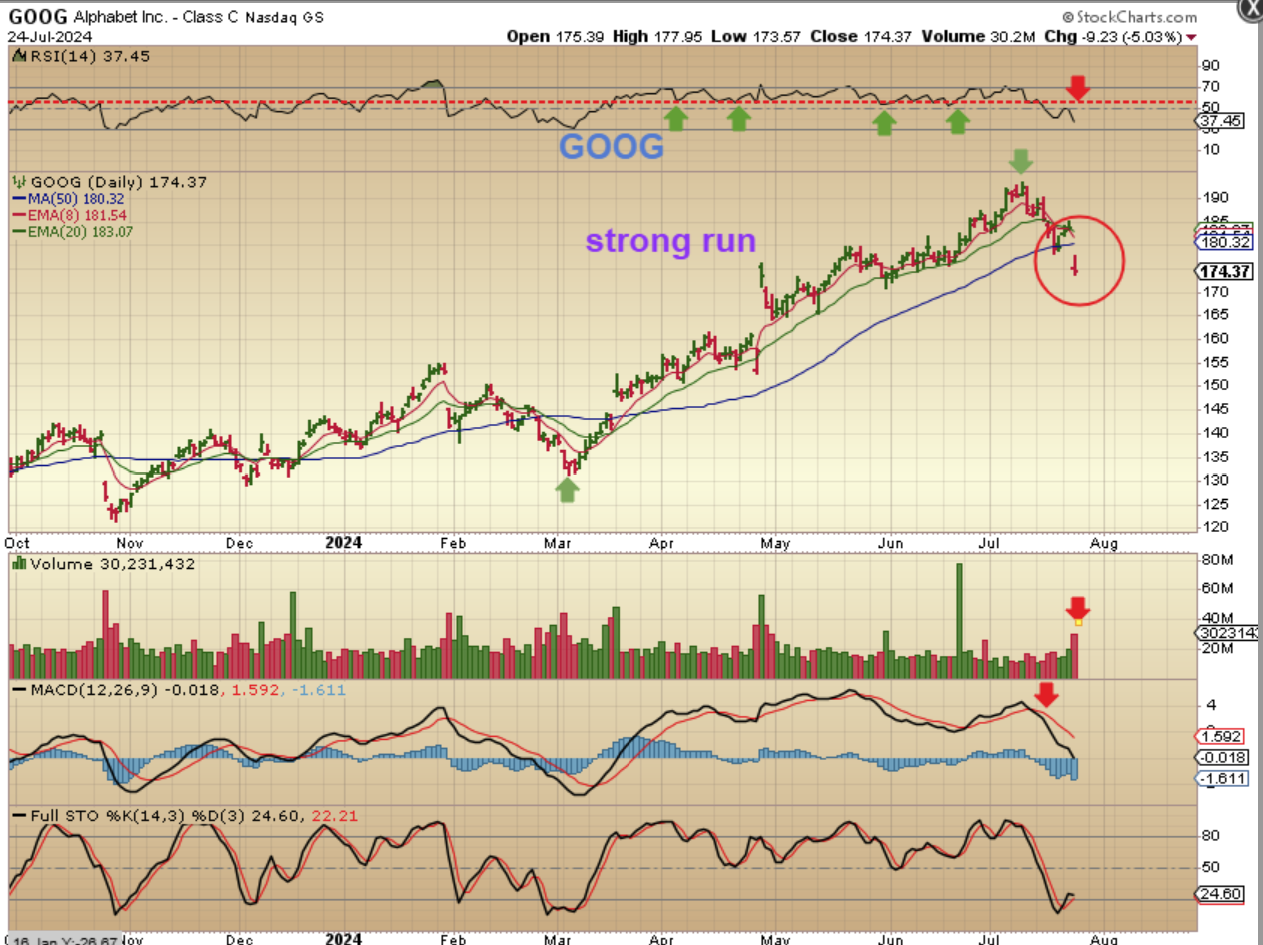
GOOG – We have had some very strong tech stocks running, but you can see that for now—the Bulls are taking a rest. Even if it bounces soon, I think that it may only back-test the 50sma and then run lower again. Why? We are only in the 2nd daily cycle, so this could get ugly. I’ll discuss this more as time goes on, and that could include a short with SOXS, SQQQ, SPXS, etc.
.
I WANT TO MENTION THAT WE ARE FAIRLY EARLY IN THE INETERMEDIATE CYCLE, SO BREAKING DOWN NOW COULD LAST INTO NEXT WEEKS JULY FOMC MTG, THEN MAYBE A BOUNCE (DCL) AND THEN SELLING ON INTO THE SEPTEMBER FOMC MTG. It just does not look good if the selling continues in the 2nd daily cycle, and it gradually affected Gold, Silver, and Crypto stocks. I’ll discuss that too.
.
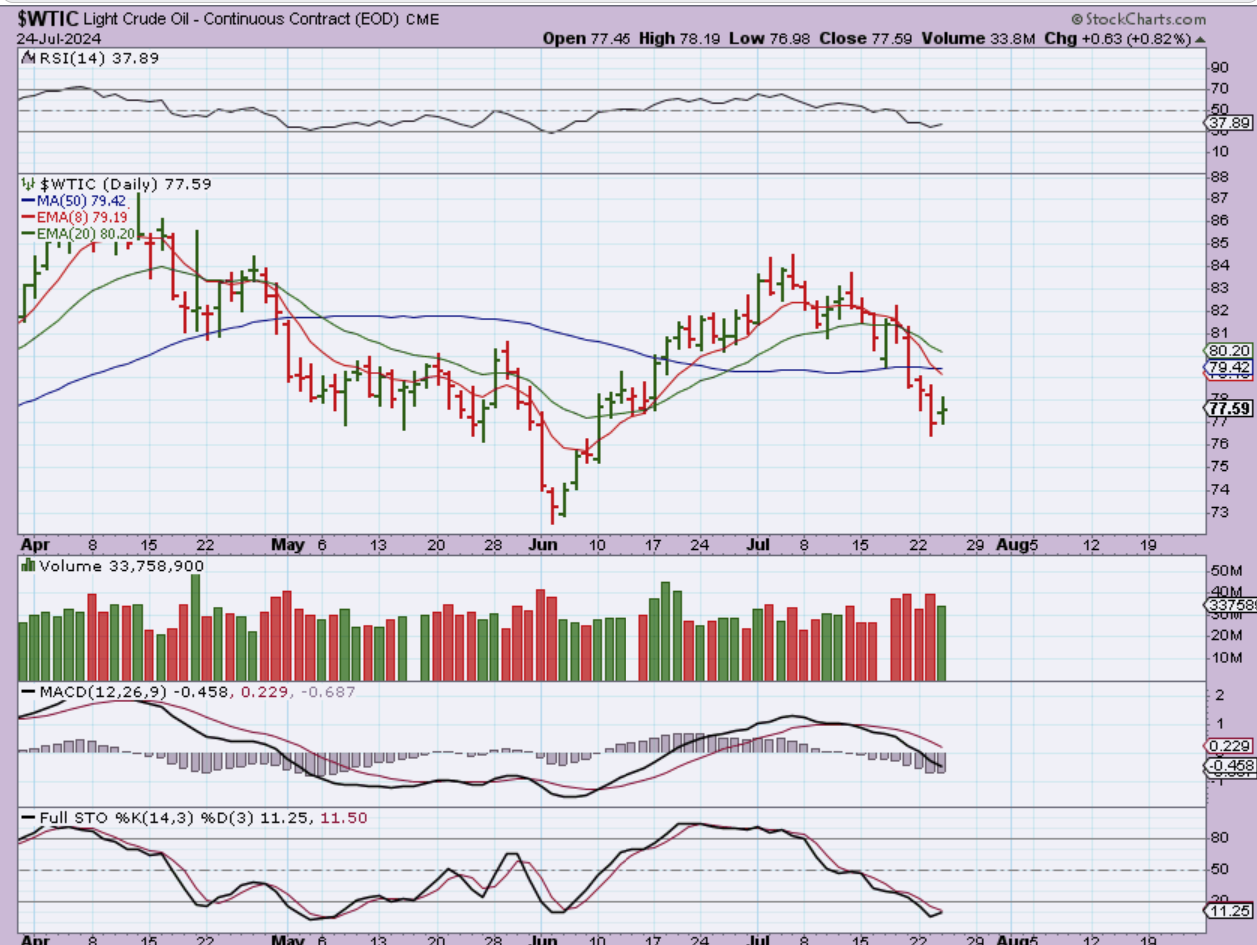
WTIC – Oil sliced through the 50sma, but it paused and is oversold. With Oil, this could be a half cycle low if its going to have a 50 day daily cycle, HOWEVER, it also may be a day 32 dcl or it may bounce & dip 1 more time to form a day 39 dcl. At this point, the peak is on day 20 and it should remain R.T. as a move out of an ICL.
.
GOLD rallied Wednesday morning, but then sold off as the day progressed.
.
GOLD has 2 views: We know that Gold has been confusing, because of the way it just took off out of a sell off and went on to make new highs. So I want to show the 2 possible cycle counts starting with chart #1 below.
.
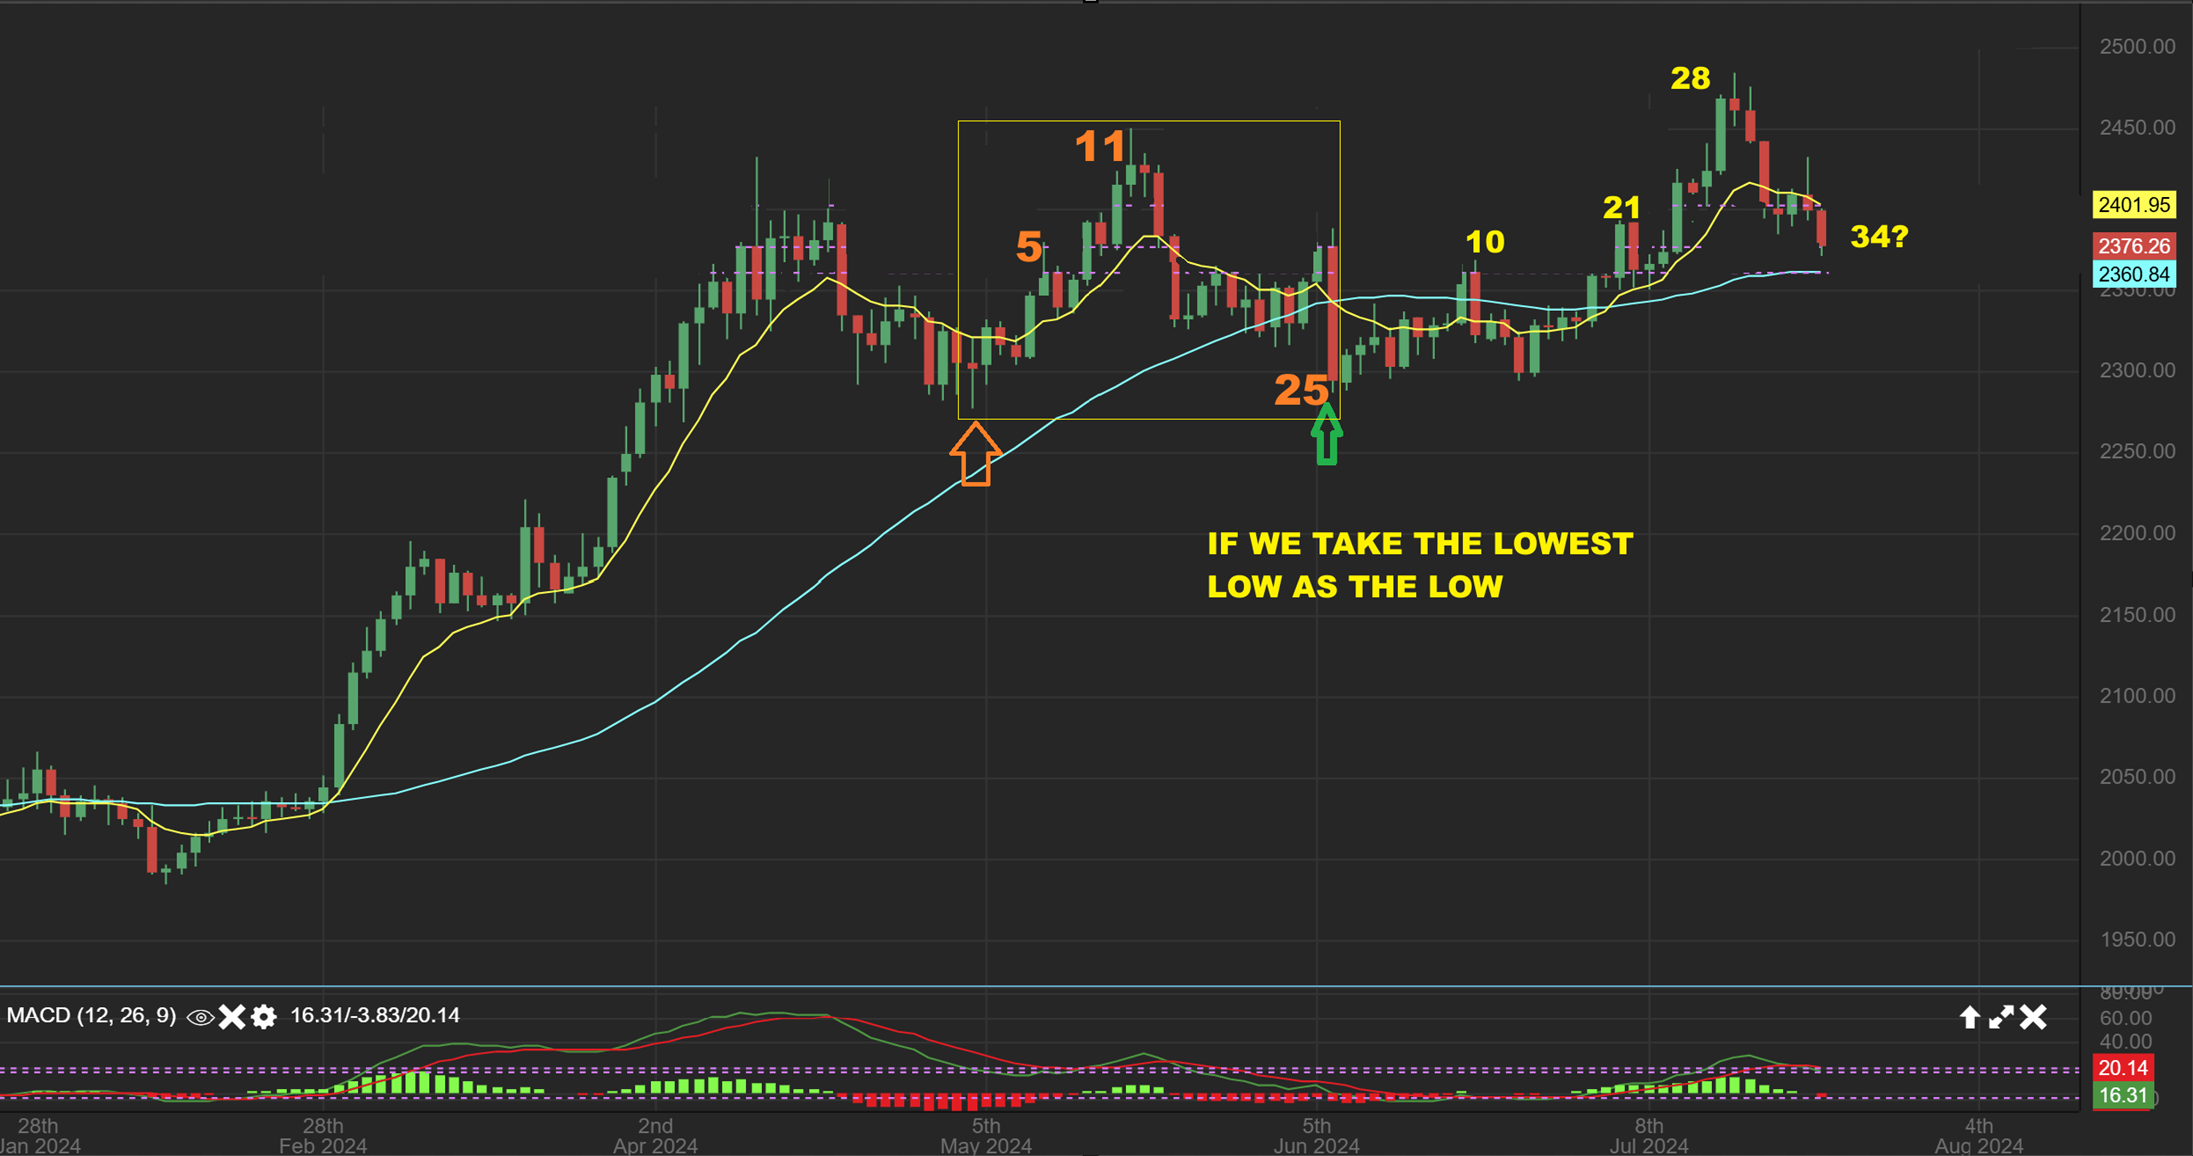
GOLD #1: I will explain the conundrum with this chart…
1. That slam down where the arrow is was only day 25 and we already had a day 11 peak. That is L.T.
2. So this was Left Translated and weak, and it slammed down sharply on day 25, and it was seeking out an ICL. After day 25, Gold should have bounced and dropped to new lows.
3. After a bounce I expected a lower low, but then it took off higher. SO IF I COUNT FROM THAT DAY 25 SLAM DOWN LOW, we would be on day 34 now. If that is correct, Gold could be ready for a dcl at the 50sma(?).
.
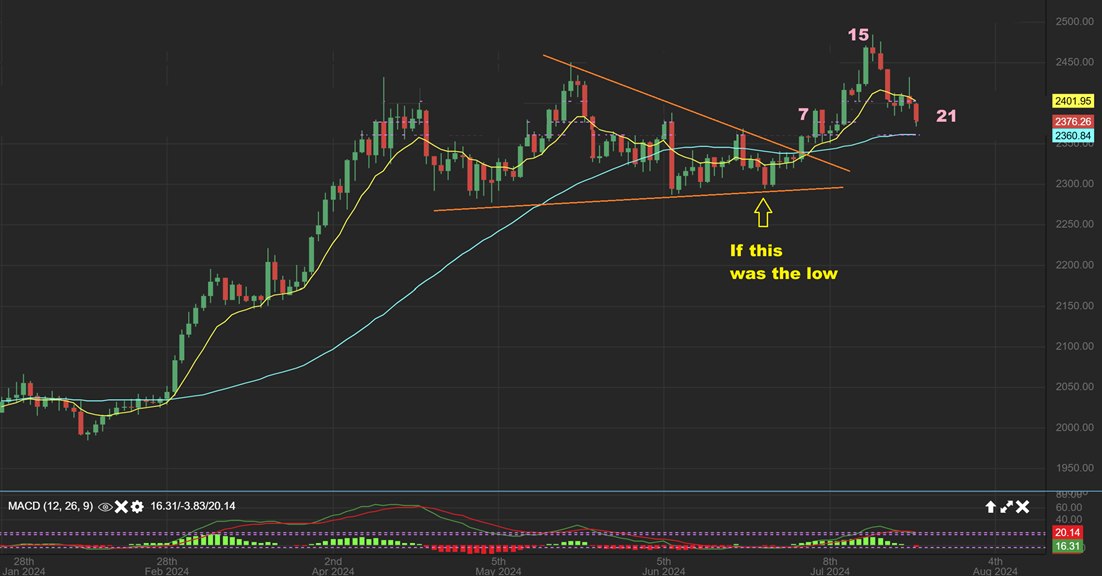
THE SECOND VIEW:
GOLD #2 – The triangle formed and when we have a breakout from a triangle, it can form a stealth dcl, even if it is a higher low. The drop is prevented from making a new high due to the strength in the triangle. USUALLY we start the count from the low in the apex of the triangle, so I moved the arrow. If I start there however, we are only on day 21 and not quite ready to form a dcl at the 50 sma. NOTE: This is the count that I HAVE BEEN USING ALL ALONG AND…
.
NOTE: The above Gold count in chart #2 is the count that I HAVE BEEN USING ALL ALONG, AND IT PUTS GOLD AT DAY 21, AND THAT ASLO MATCHES SILVER AT DAY 21.
.
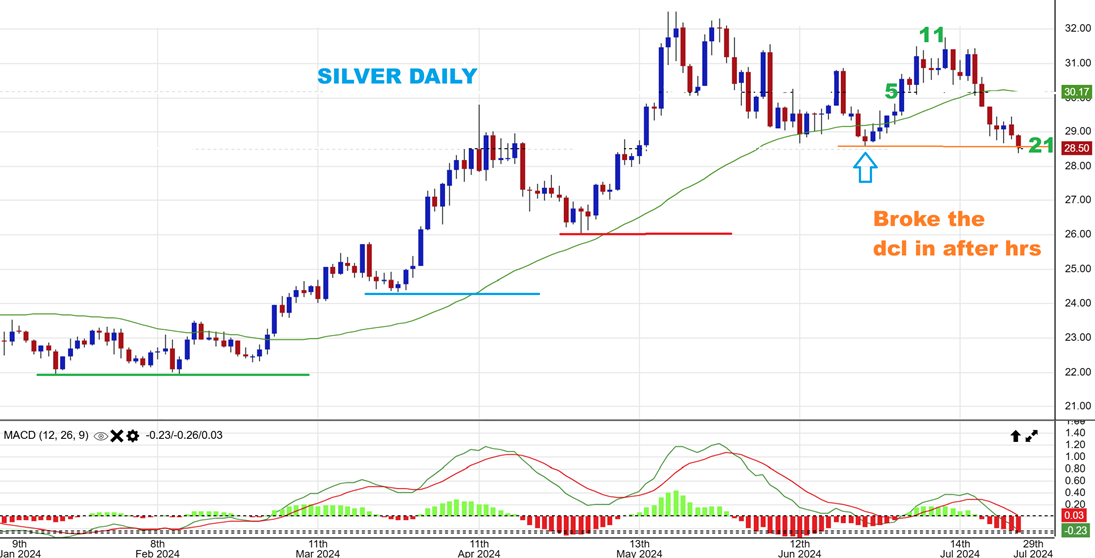
SILVER is on day 21 and it did NOT break to new highs. It also has a day 11 peak, so it is about to become L.T. This chart is from 11p.m. ET Wednesday and NOW Silver broke the dcl in after hrs. THIS IS A CONUNDRUM. Gold and GDX look like ICLs and Silver looks ready to drop into one right now.
.
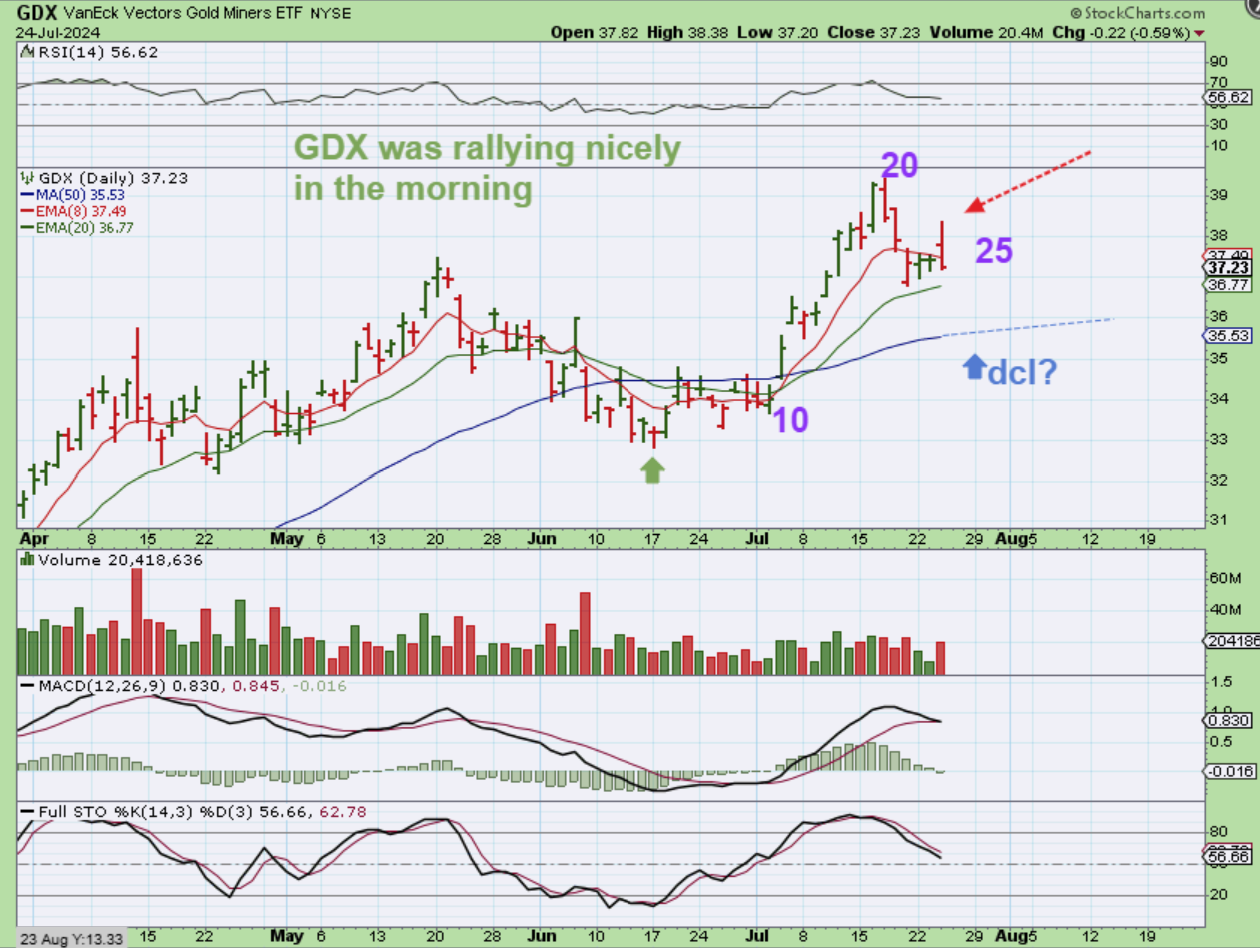
GDX rallied in the morning and many Miners rallied, but then the selling of the General Markets seemed to weigh on the Miners too. We got a pop and drop, and this looks like day 25 for GDX. This MIGHT be bullish for next weeks FOMC MTG.
.
I’m going to keep the conclusion short and to the point. The General Markets futures were down before the markets opened and I wrote this:

..
.
The Precious Metals Miners and Crypto stocks rallied in the morning and some really nice gains were being made. You saw that in the first hour, but then the General Markets continued to grind lower and lower, and it became contagious. I mentioned in the comments before 11 a.m. that I was selling, I didn’t like what I was seeing. I want to say this however: The General Markets dropping in the second daily cycle could last into September, but the Precious Metals, being in the area for an ICL, could rally at the next fomc meeting next week. We might see a Bull emerge in precious Metals and Silver may join in this time.
.
How do I feel today about what we saw yesterday? Let’s put it this way:
If someone goes poop in the swimming pool, I don’t keep swimming just hoping that someone will clean it up later. I need to get out of the pool until it is definitely cleaned up. Well, the NASDAQ sold off 600+ yesterday and someone just pooped in our swimming pool. I saw Gold, Silver, and Crypto miners rally strongly after the open, but then I saw that it was spreading over to Miners and Crypto Stocks, so I’m out until I see signs that it has been cleaned up. Yes, I was hoping for an end of the day rally in those 2 sectors, and I wanted to jump back in, but we closed at the lows. For Metals and Crypto, It’s time to watch from the sidelines, but that may change soon. As for the General Markets? It may be time to go short with the stronger bounces over time. We’ll see what Thursday brings and I will keep an eye on all sectors mentioned as time moves forward, because the cycles are in different stages of their Intermediate set up at this time.
.
~ALEX
.
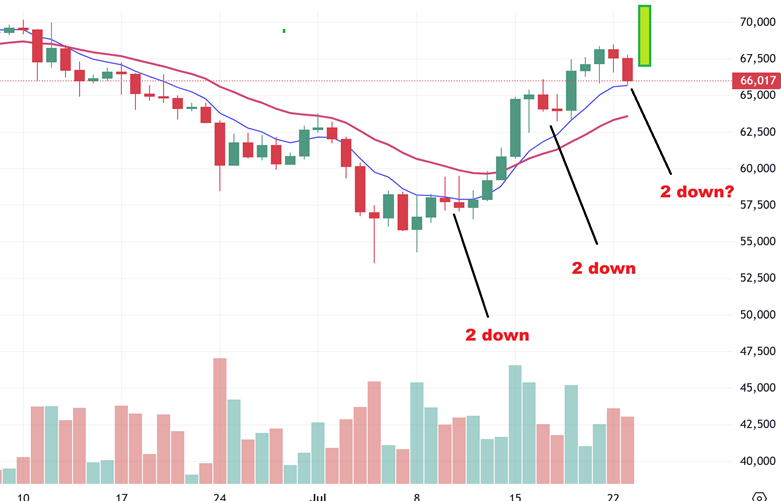
YESTERDAY I POSTED HIS CHART OF BITCOIN: I mentioned that it has mild pullbacks to the 10sma, so far. I had hoped for a surge from there, but the problem that I mentioned in MONDAYS report persisted and that was that many Crypto-related stocks are not acting quite as bullishly. They weren’t crashing, but they weren’t acting bullishly, so I said that we want to keep an eye on that. That pullback to the 10sma started to change yesterday, so I …
/
AT FIRST, THE CRYPTO STOCKS RALLIED IN THE MORNING with the markets selling off, but eventually they turned and dropped to ‘break-even’ and then to red, so I POSTED THAT I SOLD A LOT OF MY POSITIONS AT 10 50 a.m. I wrote :

,
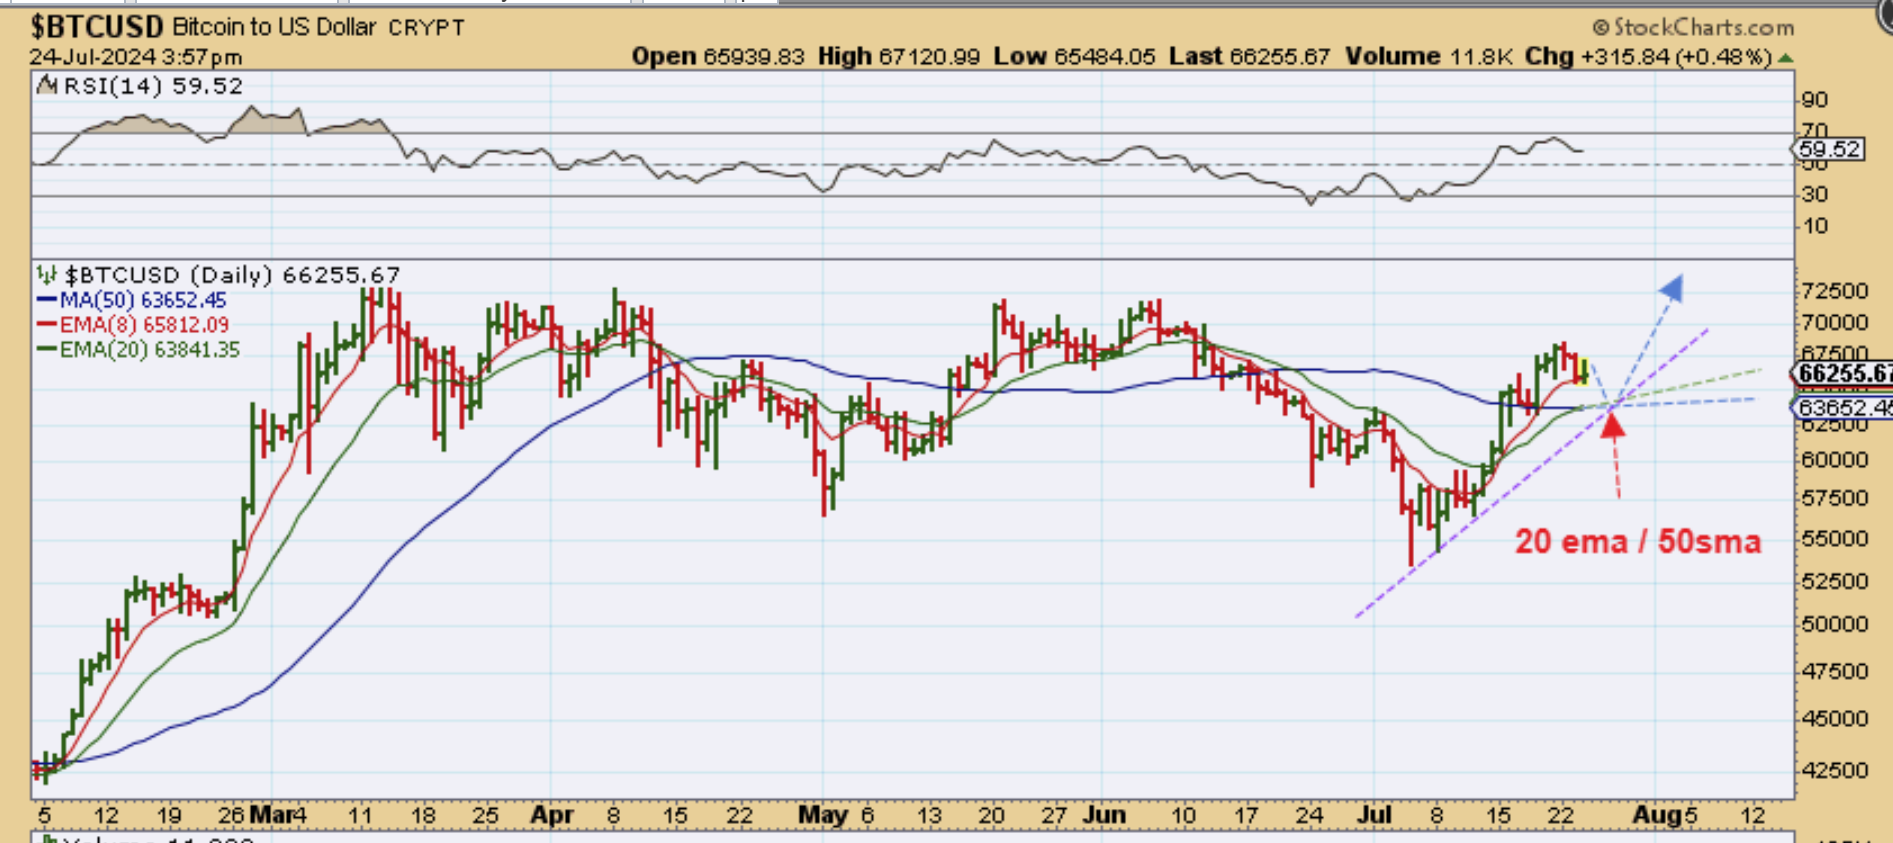
That pullback to the 10sma for Bitcoin started to change yesterday too, so I drew this chart at noon and posted in the comments midday ( I don’t know why the chart had a timestamp of 3:57 p.m., it was only noon and the timestamp on my comment was midday) .…
.
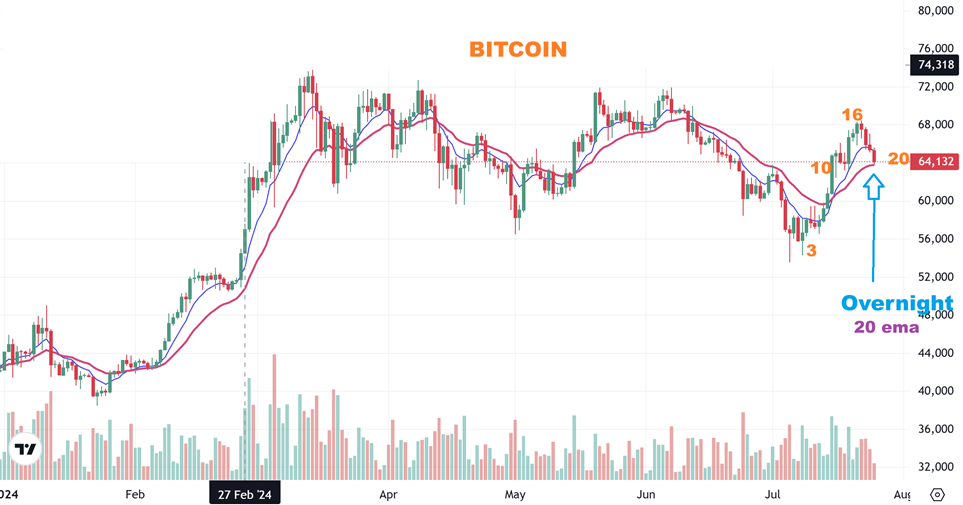
BITCOIN: I was thinking that Bitcoin could drop to the 20 ema, a rising trendline , and the 50sma. That looked to be $63,600 area. This was my next target. And…
.
BITCOIN: And overnight Bitcoin dropped to the 20ema with a low of $63.800, but I don’t know if I trust the crypto stocks at this point with such a sell off yesterday. Again, the charts are not absolutely ugly, but they started to get caught up in that market selling yesterday after rallying in the morning, and now the price action has me a bit concerned with a market sell off. I am watching that today…
.
Again, the charts are not absolutely ugly, but they started to get caught up in that market selling, and now the price action has me a bit concerned with a market sell off. I am watching that today. Let’s look at charts…
.
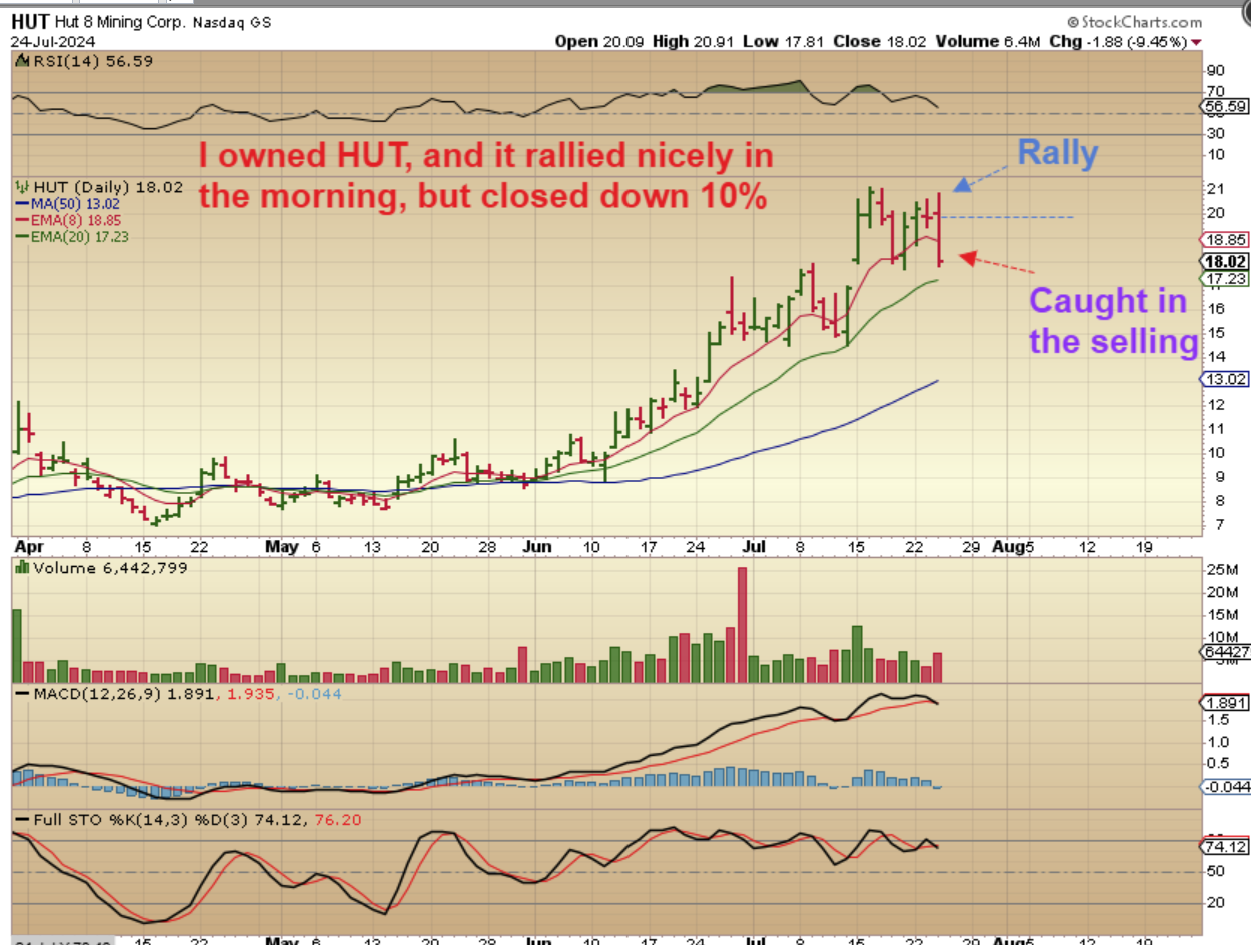
My account was up nicely in the first hour of trading, even with the General Markets selling off, but after an hour price dropped and it started to go red and moving averages were being broken with Bitcoin looking ok. I stepped aside. You can see that HUT rallied early and then closed down 10%. Volume was not HUGE, but the MACD is crossing and price action is weakening.
.
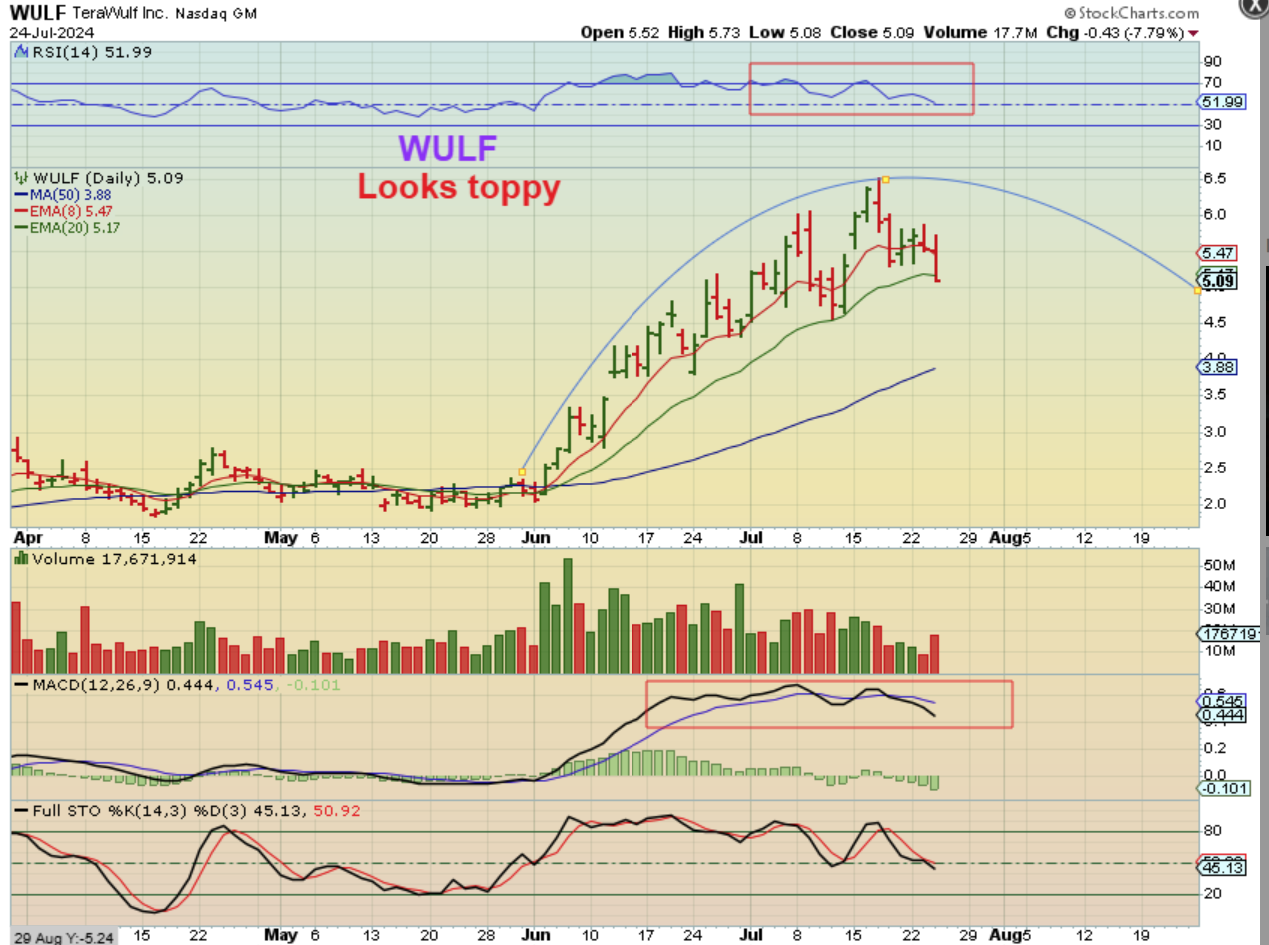
NOW TAKE A LOOK AT WULF: This is a sad development for me. I wanted to buy and hold from these June lows and just ride it as Bitcoin runs to $80,000+, but this is starting to look toppy. CAN IT RECOVER? Yes, it dropped to that 20ema 8 days ago and then made new highs, but this ‘looks’ like it is getting weaker, not stronger at this point. I sold mine in the morning when it was down 3-4%, and it closed 7%.
.
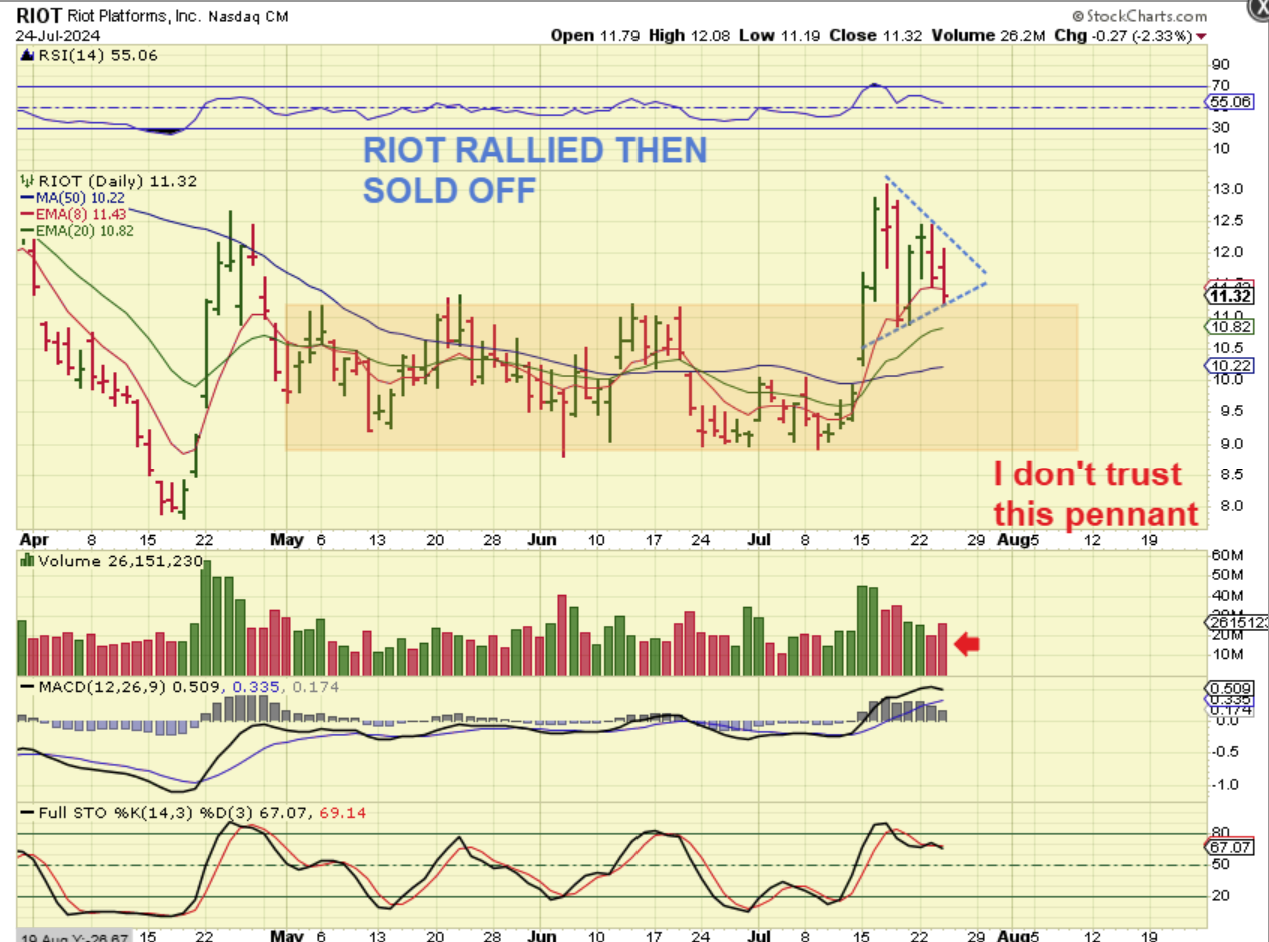
RIOT I actually took a loss on RIOT because I bought it more recently at $10.50ish, but then added heavier on the large move up to $11.50 & $12 a week ago. This was a lot of chop, but I thought that it would form a pennant and break higher with Bitcoin. It rallied yesterday morning too, but then sold off. I sold this for a loss.
.

