Thursday July 18th – Just A Speedbump?
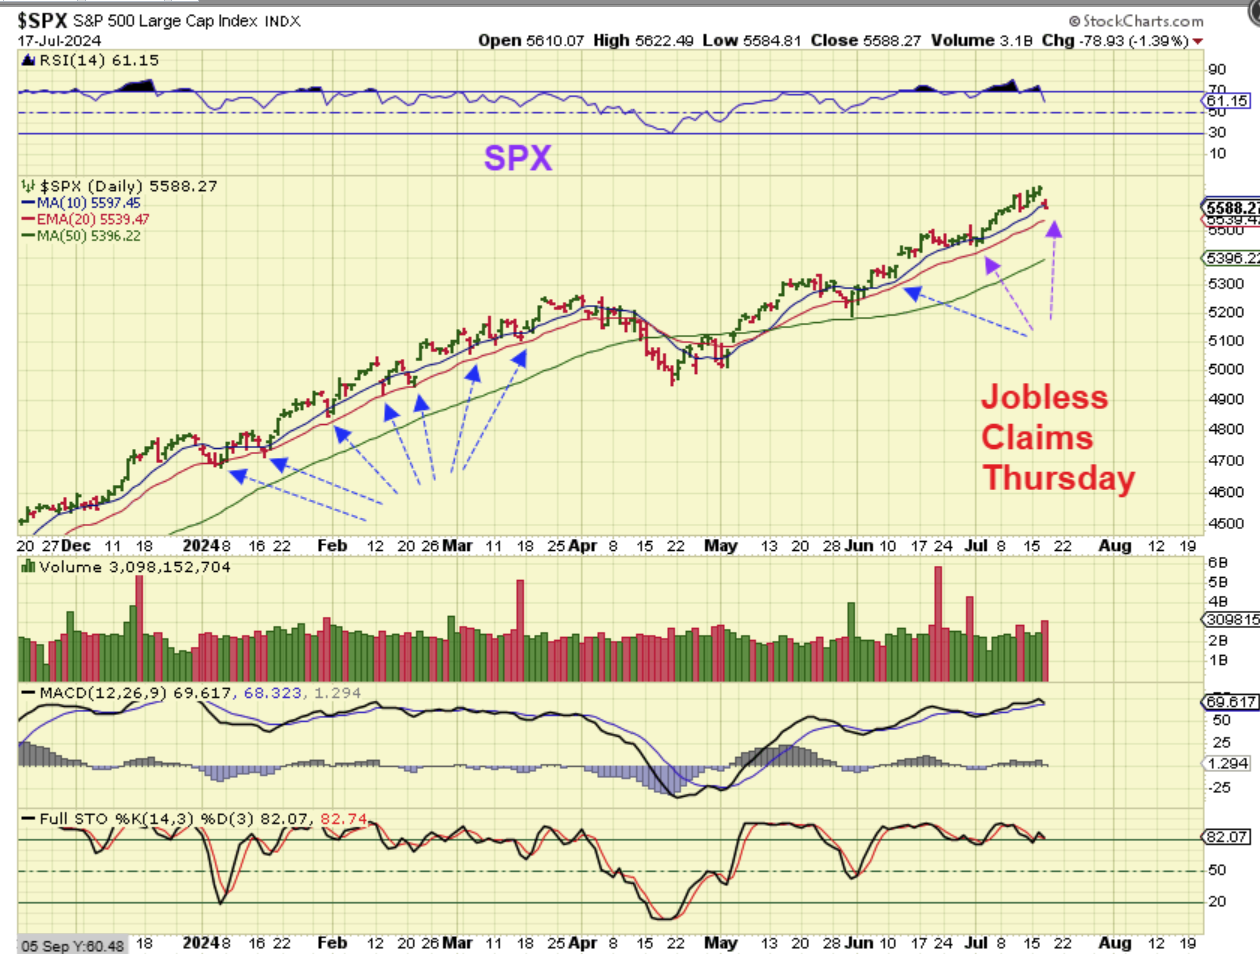
We do have possible market moving data at both 8:30 and 10 a.m., and recently this data has been followed by a rally or a green day. We’ll see if the data can save the sell off that started this week, making it just a ‘speedbump’ on the run higher, or not.

.
The SPX gapped down below the 10sma, but I am pointing out here that it HAS done that in the past rallies too. In fact, it dropped to the red 20 ema often, or ALMOST to the 20ema. So again, we’ll see if that jobless claims can save the day or not.
.
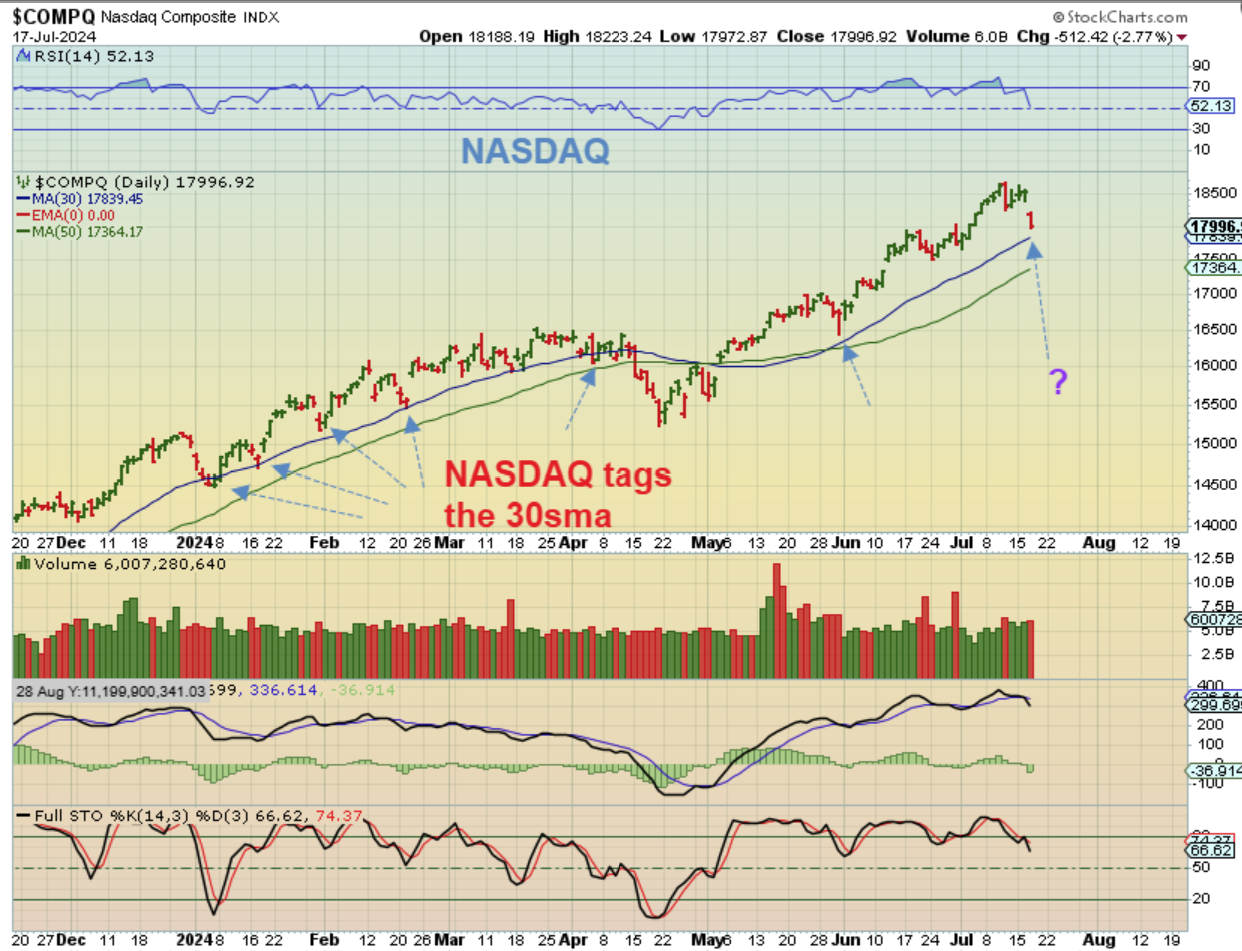
The NASDAQ has a deeper drop, but that is also what happened during past rallies. I will say that the MACD is looking vulnerable and seems to be showing weakening momentum, so we’ll just have to see how this plays out. Jobless Claims is the next speedbump.
.
YESTERDAY I SAID ABOUT OILs DIP:
.
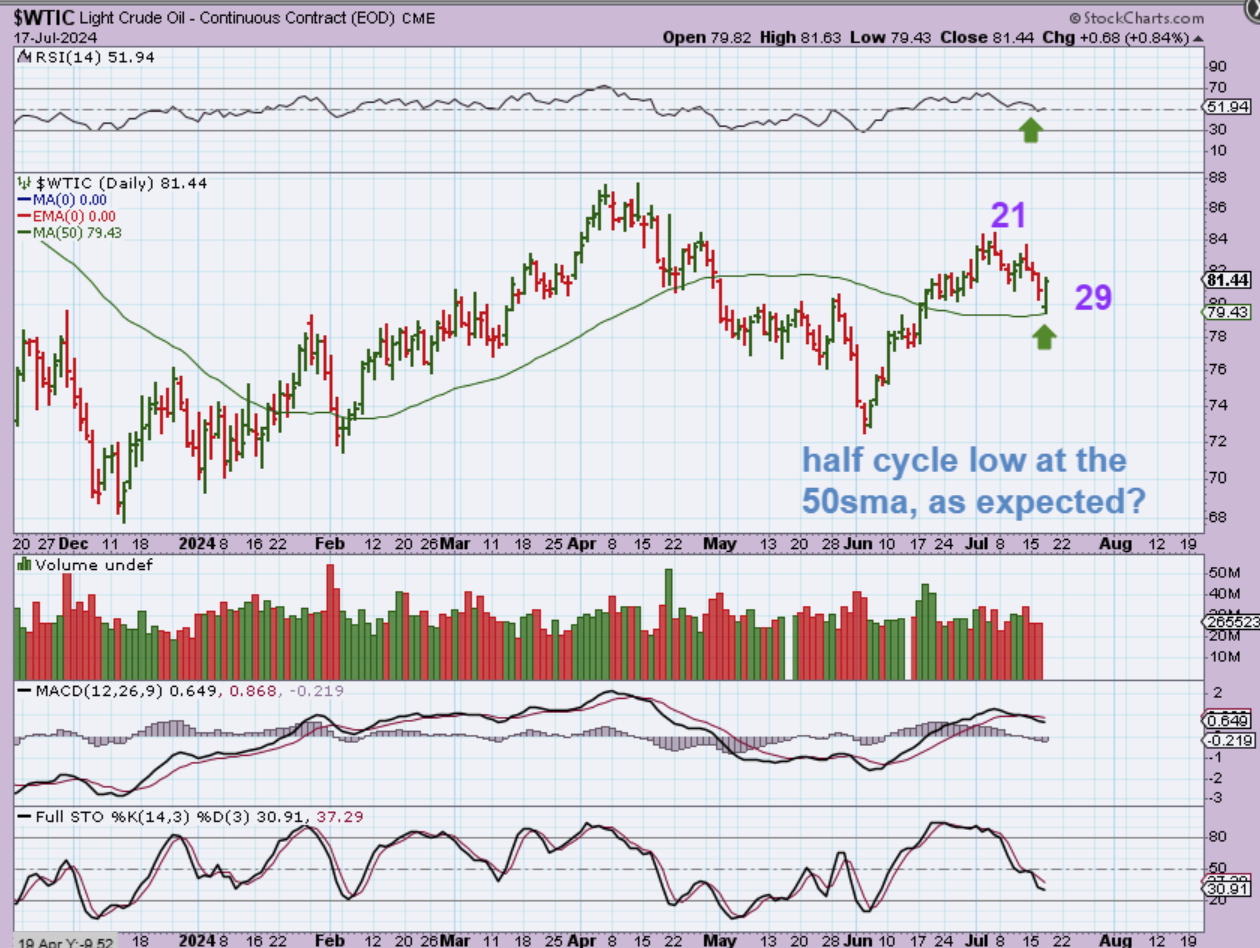
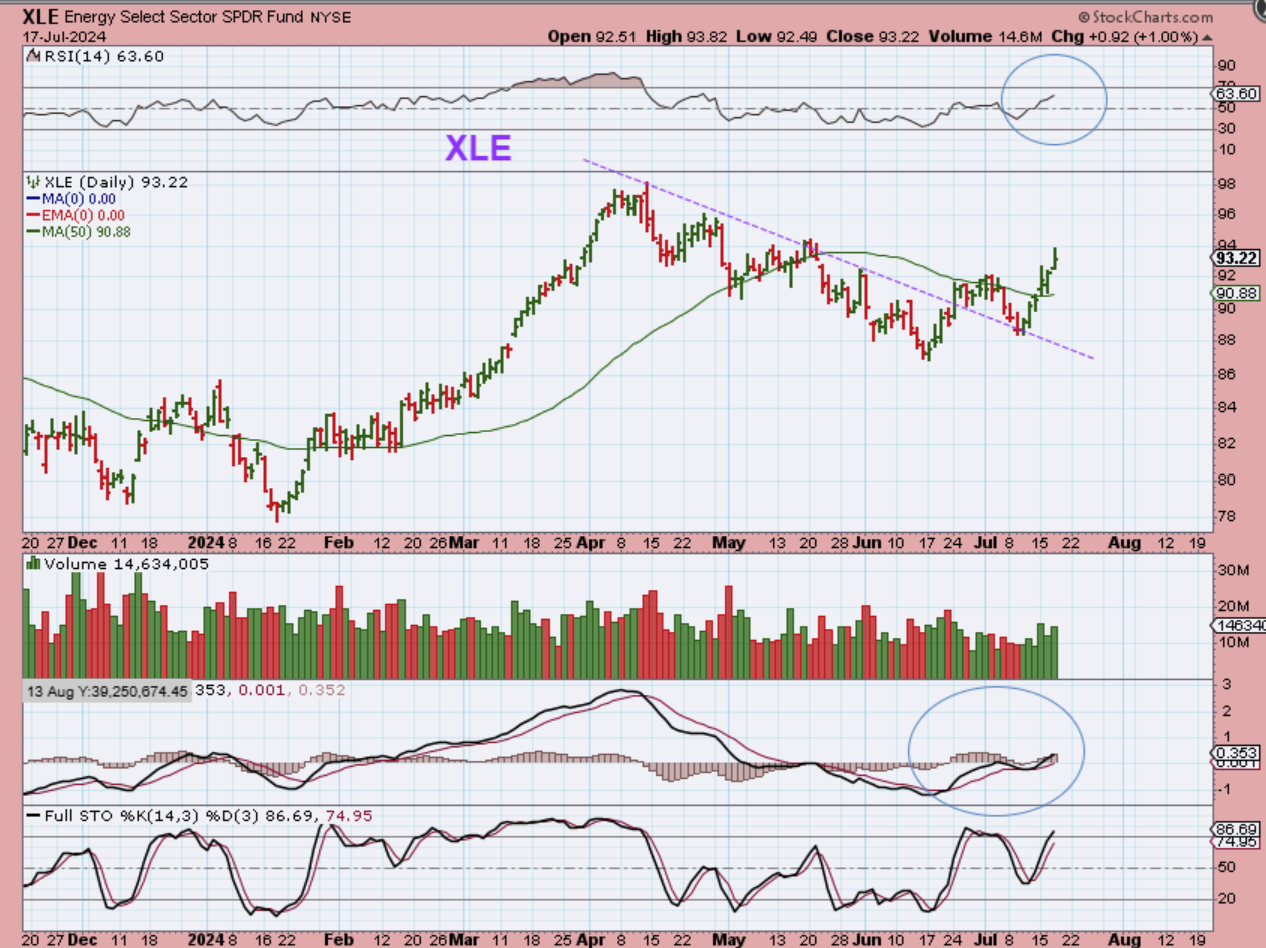
WTIC – Oil has been dropping and I think that it may just be a 1/2 cycle dip. Why? The timing is perfect and back test of the 50 & 200sma is normal. Also the XLE & XOP are moving higher even though Oil is dipping, so that adds to the idea that this is likely just a temporary dip.
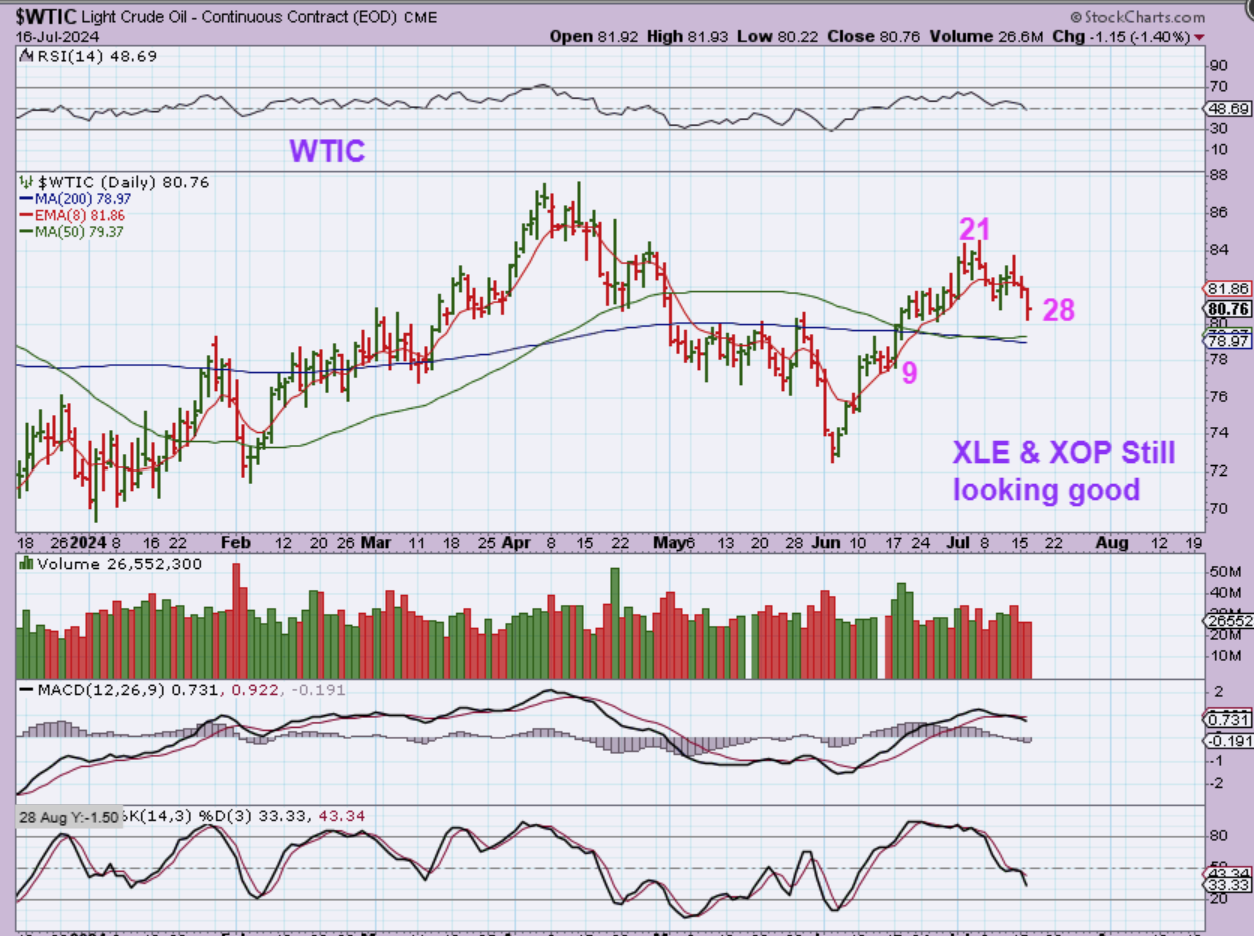
WTIC – Oil tagged the 50sma and reversed rather strongly yesterday, so this is a buy with a stop and again, and it is likely a 1/2 cycle dip.
.
XLE – Oil stocks remained bullish with Oils recent drop.
.
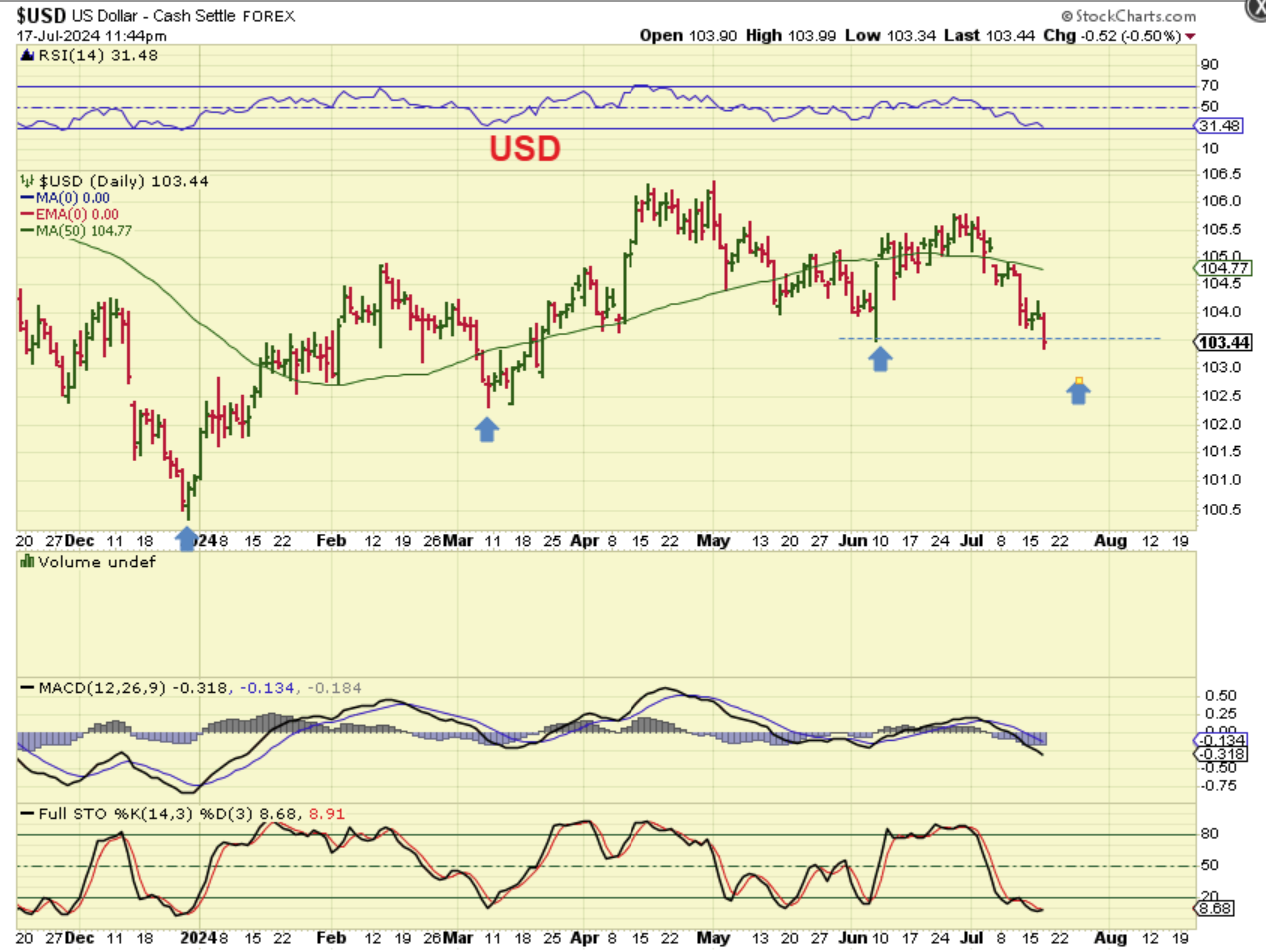
THE USD actually continued to break down. This was expected, but it may be close to finding a low soon too (timing-wise).
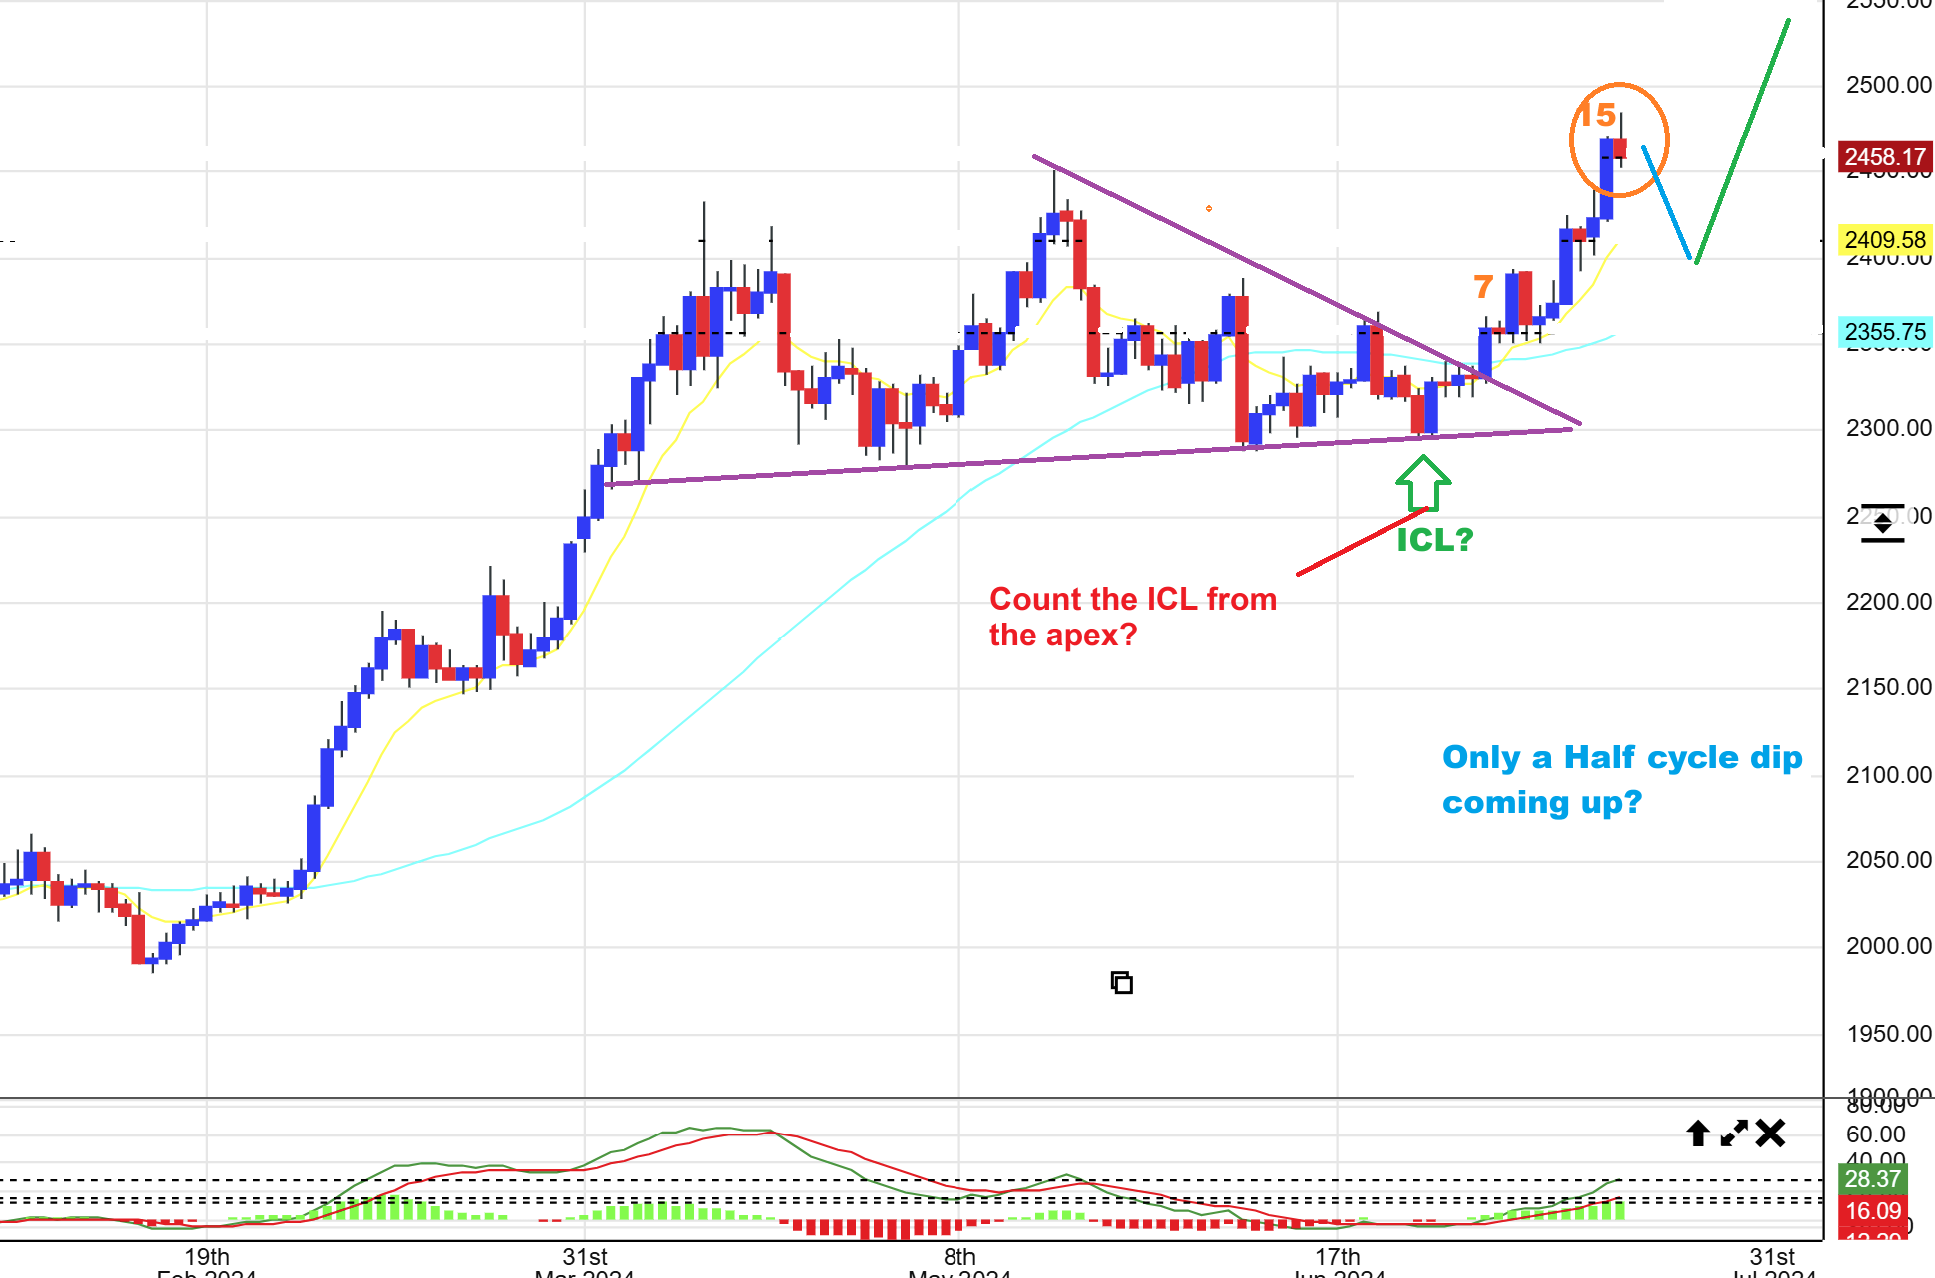
Gold has been in a strong push higher. It did pop and drop on Wednesday, so let’s take a look at 2 cycle count possibilities.
.
GOLD #1 – If I take that a-b-c crash as the ICL, we would now be on day 27 from that low, and we’d be due for a dip into a dcl. Note: That dip could be mild. However…
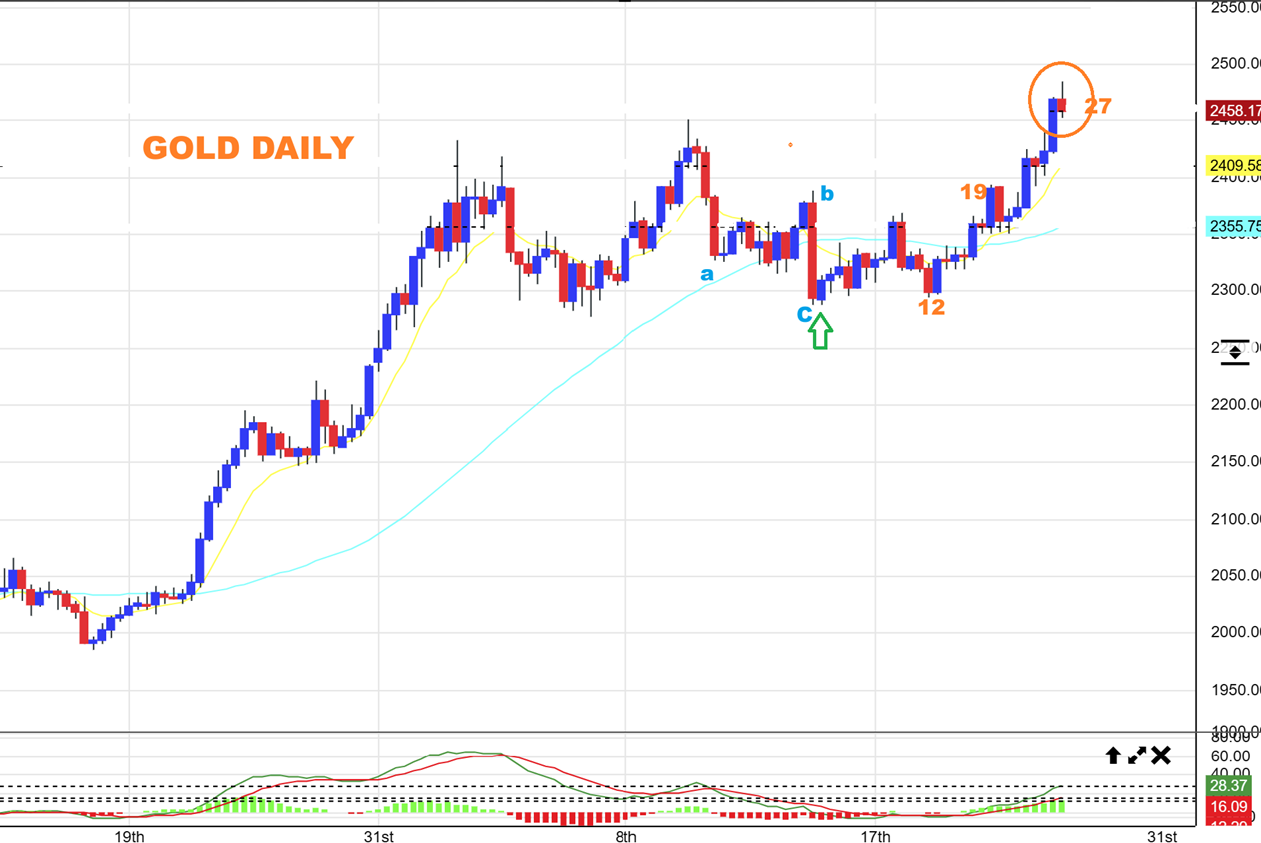
GOLD #2 – I have discussed the stealth dcl’s that appear in a triangle. Usually, I mark the low at the low that is right before the APEX breakout. I do that because that is the low that should have broken lower in a 4th daily cycle, but it was held up by the triangles buying strength. If that is the case, then we would only be on day 15. This could be a ‘pause’ in a move higher, or it may be the start of a dipinto a half cycle dip. Either way, this is still a very bullish set up in the long run.
.
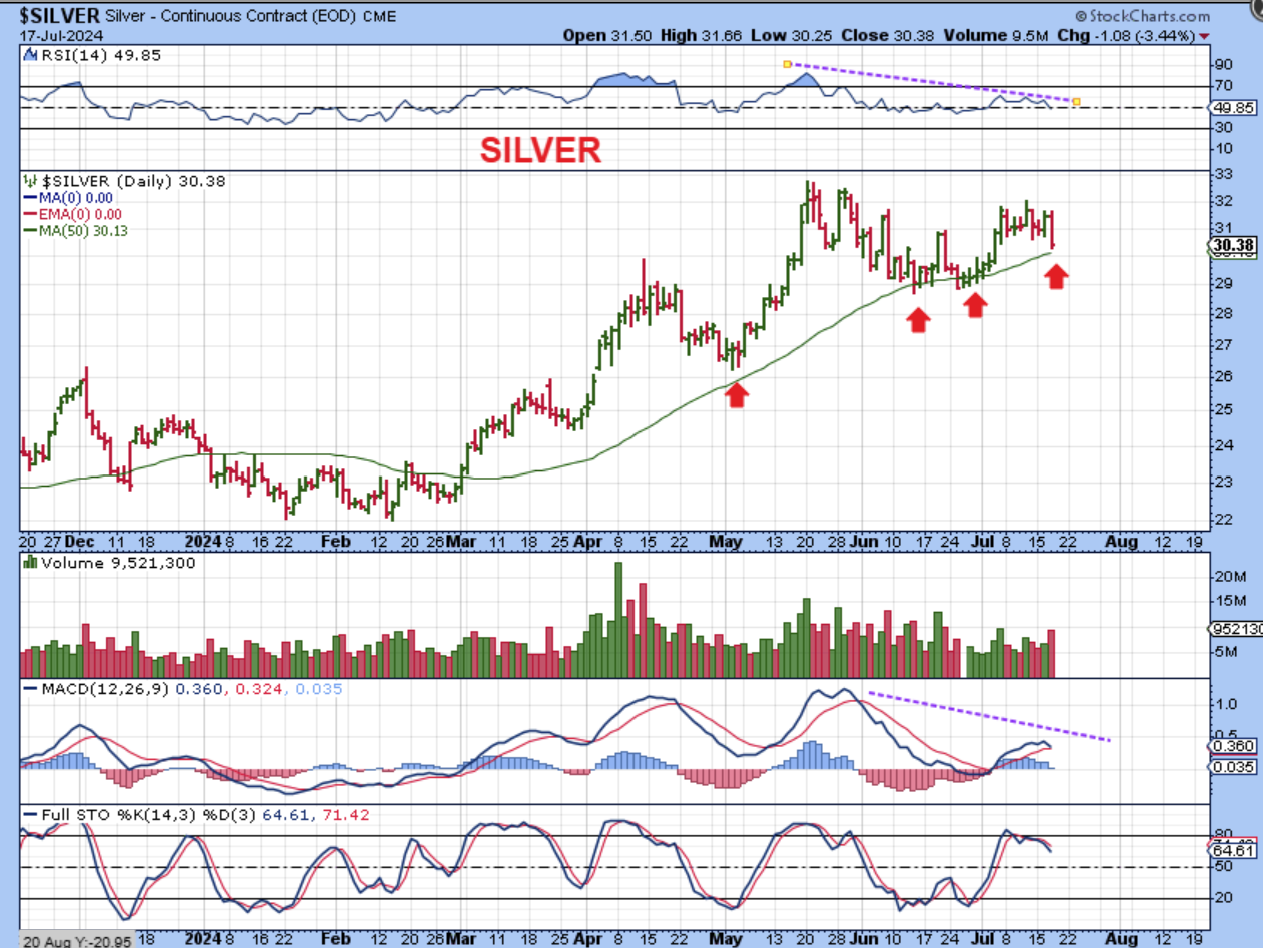
SILVER dropped 3.44% and that is somewhat of a sharp dip, and the divergence in the MACD is rather sharp too. At this point, we will watch to see if the Jobless Claims can save the day and make this a simple dip to the 50sma? Just a speedbump in the road? I will note that we have seen these sharp drops in the past too and they’ve lasted for a couple of days.
.
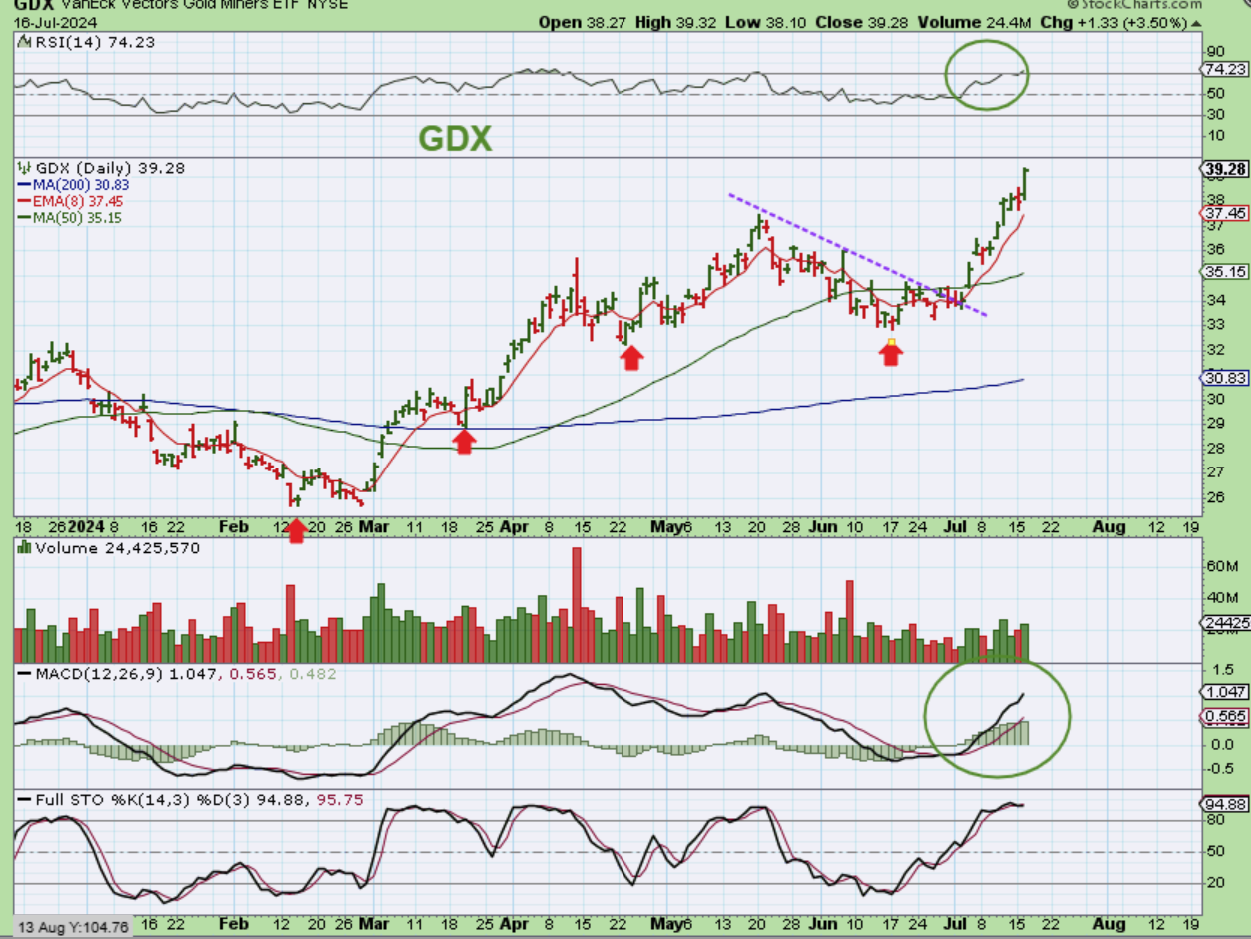
THE GDX also dropped on Wednesday, but before I show that, please note again what it did on Tuesday using the chart below. That was a big 3.5% pop on day 19 Tuesday. I said…
THE GDX is on day 19 now and that was another strong Pop. It broke the downtrend and started to run swiftly. I only really see 2 down days since the break of the downtrend, as it runs along the red 8 ema.
.
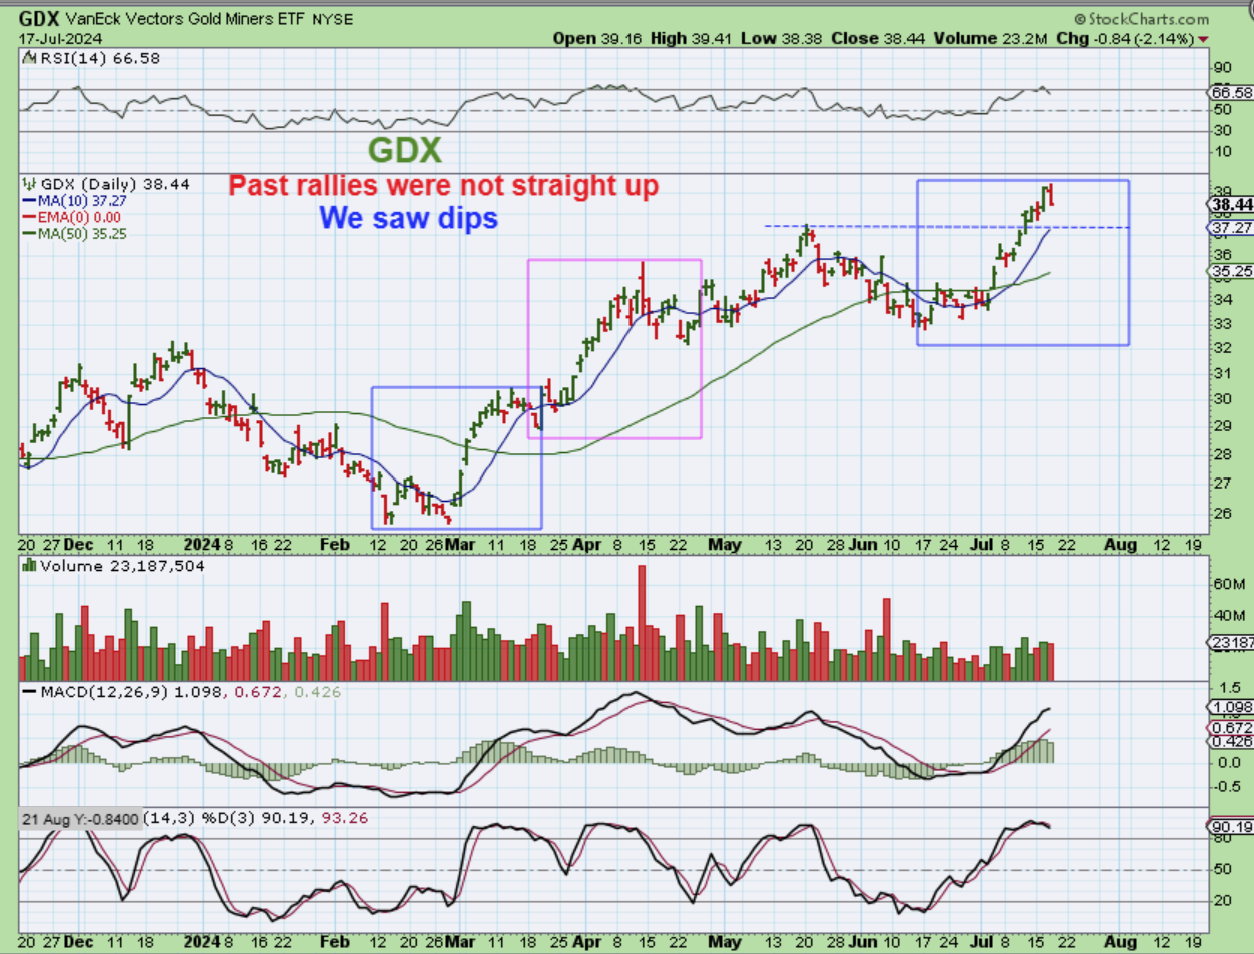
Yes, The GDX dipped 2% after a 3.5% pop on Tuesday, but this has been a strong rally. We only have had a couple of down-days in this rally, and yet I saw a little panic today with this dip. Well, The GDX did just rally for 3 weeks, right? So we have to expect dips along the way. We will get a more prolonged sell off too, at some point, but for now price is still WELL above the 10sma and it can drop further and still be bullish.
.
So we saw a normal dip on Wednesday in several sectors (except Oil and Oil Stocks, and some MJ stocks were green too), but these dips obviously happen in bull markets too. We have to just see how things play out going forward and that next speedbump could be the jobless claims. Let’s see what Thursdays trading brings our way. I hope you can enjoy your Thursday trading, post Jobless Claims! If not, it may become a buy the dip opportunity over time. 🙂
.
~ALEX
.
FROM YESTERDAYS REPORT:
.
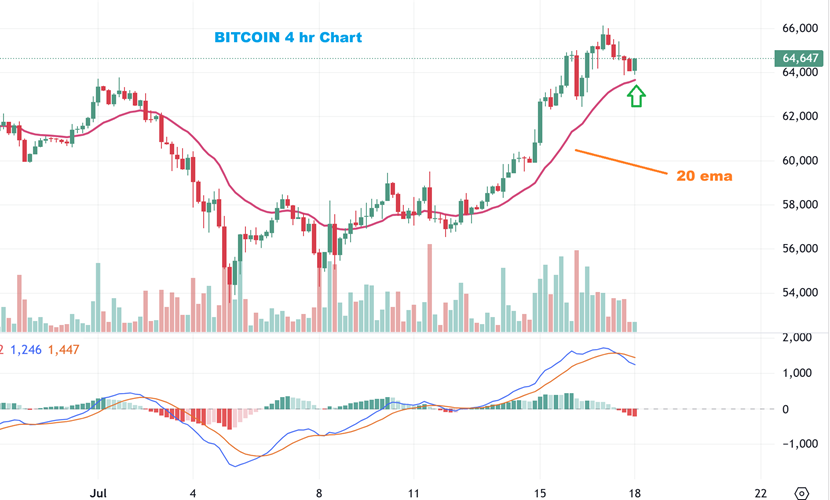
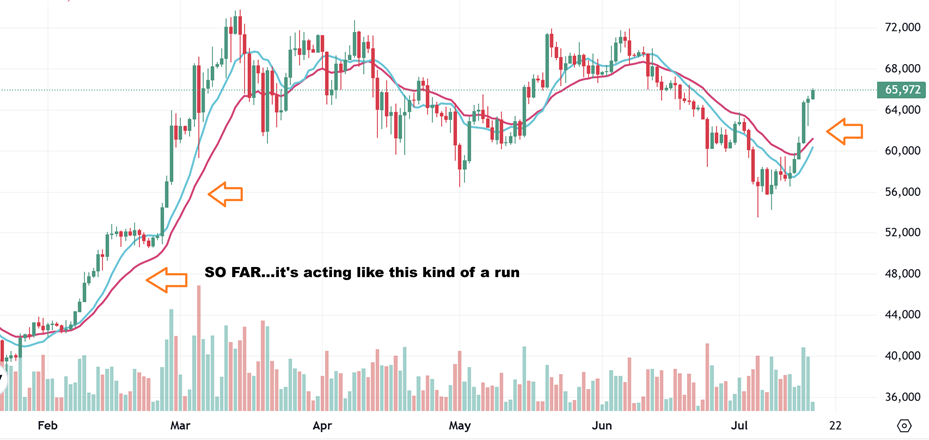
BITCOIN on day 12 continues to be green. Sometimes Bitcoin runs with large pullbacks, other times (like where the orange arrows are) it just runs straight up. So far this run has been strong out of the ICL. That was also a ‘shake out’ move or a stop run.
,
Bitcoin did not crash, by any means yesterday. There are times that it chops sideways and moves over to the 10sma, and there have been times that it ‘pauses’ and works its way all the way over to the 20 ema too. That can take a few days to 2 weeks. I pointed that out on this chart, please take a look at the arrows. Yesterdays dip or ‘pause’ did ABSOLUTELY NOTHING that changes this picture. I got an email…
.
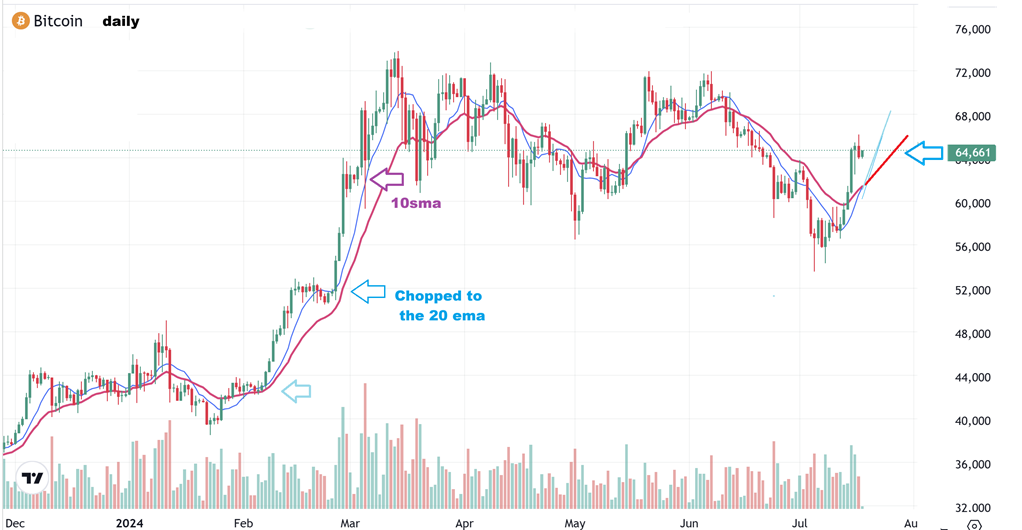
I got an email asking me if I was “concerned about Bitcoin falling apart so early in the first daily cycle?” I also saw comments in our commenting section that seemed as though we were crashing down, but when I went to the charts I just didn’t see it. This is NOT ugly price action.
Bitcoin– This is a 4 hr chart and there has been no damage here either (I am writing at 8 p.m. Wednesday night). This can chop and pause and bull flag or form a pennant, and then continue higher when it is ready to go. In fact, this just looks like a ‘speedbump’ in the road higher, to me.