July 7 Weekend Report
I got back home Sunday night and want to spend a few hours on the weekend report, but I wont have time to proofread, so thanks for overlooking any typos, mistakes, etc. 🙂
.
Last week was a holiday week in the U.S. Markets. Often they say that holiday trading is light volume and as a result it is ‘easy to push the markets around’. Well, we saw a few Bullish surprises to the upside, and I would say that it was accompanied by plenty of volume. What caused this surprise to the upside?
The Fed Chairman Powell gave a speech on Tuesday indicating that a rate cut was actually still possible sooner than later. Next, the inflation DATA that was released indicated that that rate cut could possibly even come in September. The General Markets and Precious Metals Markets took off higher with that news. This was late in the intermediate cycle for Gold, so that was definitely a surprise to the upside.
Let’s take a look at what we have in the charts…
.
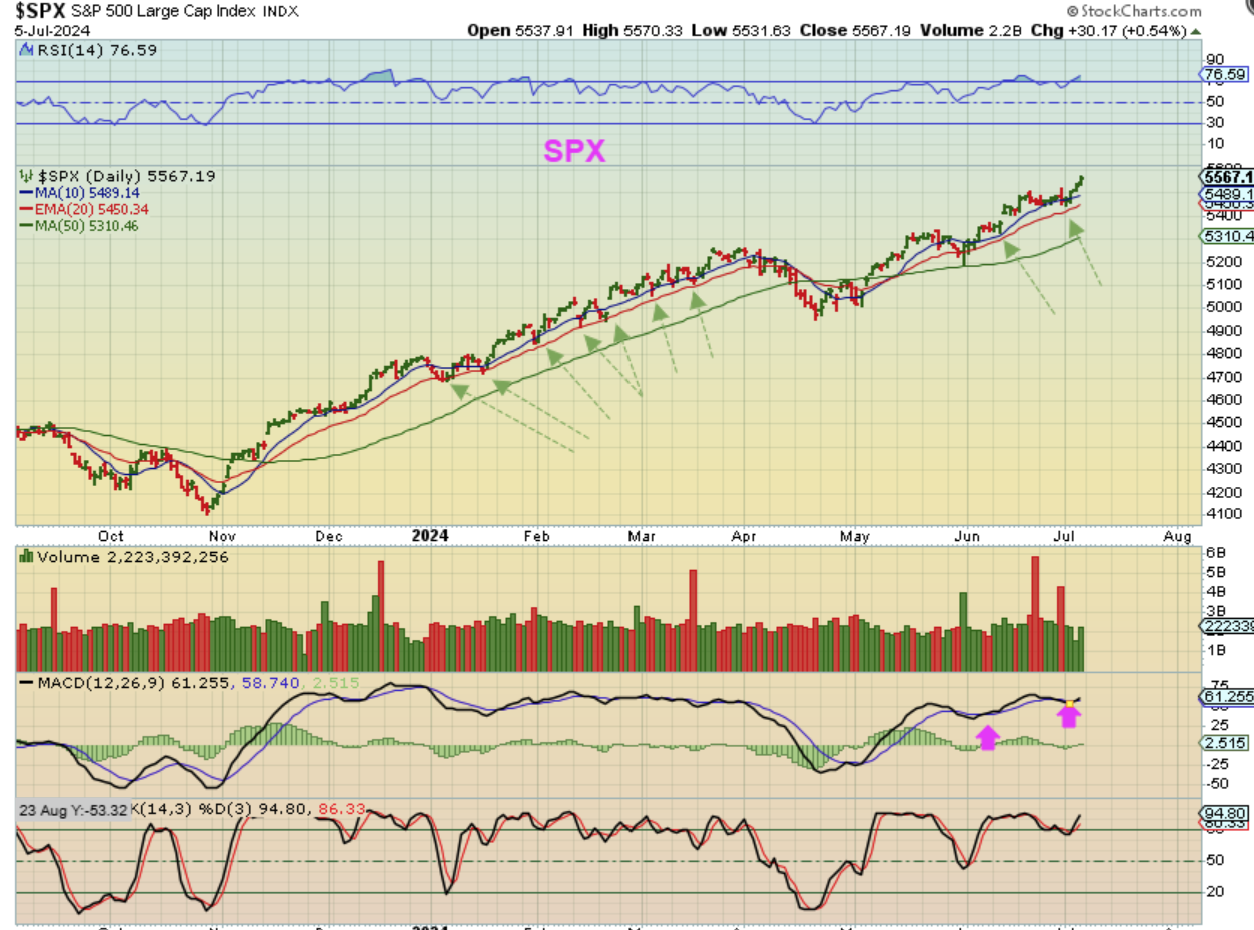
As pointed out in past reports using the previous Bull Run, The SPX seems to just run along the 10sma & 20ema, without a deep dip that resembles an easy to identify dcl. That continued last week. After a 2-week sideways chop, these markets continue to break & run to new all-time highs without a deep dcl (except for that day 29 drop to the green 50sma. That must be the dcl at day 29 – and as the saying warns, “Do not short a bull market”.
.
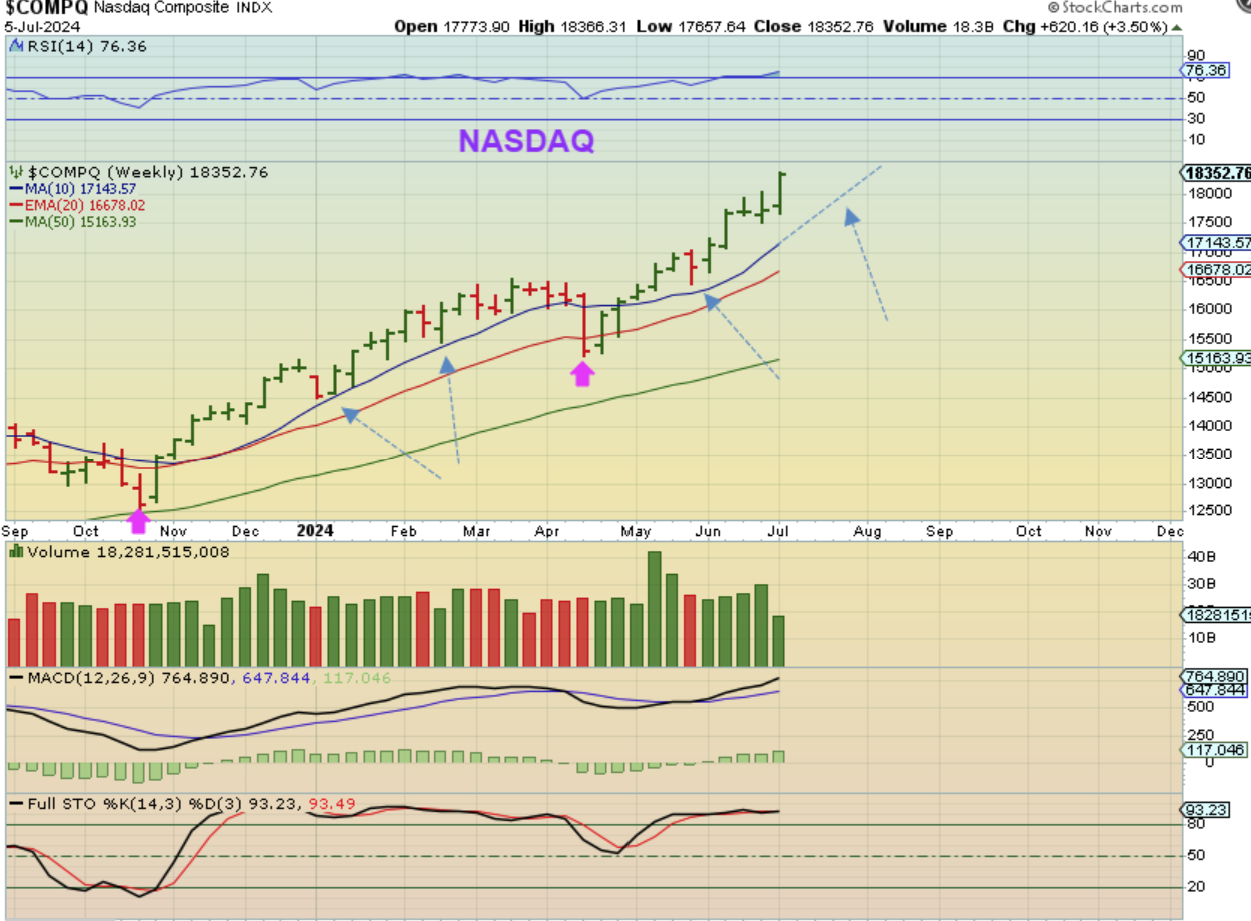
Using The NASDAQ WEEKLY we see
1. 5 or 6 weeks up out of the slam down into an ICL, then
2. 1 week down that started to bounce back (dcl?),
3. Followed now by another 5 green weeks (though 3 of them were recently really sideways chop). The weekly MACD continues to show bullish alignment.
.
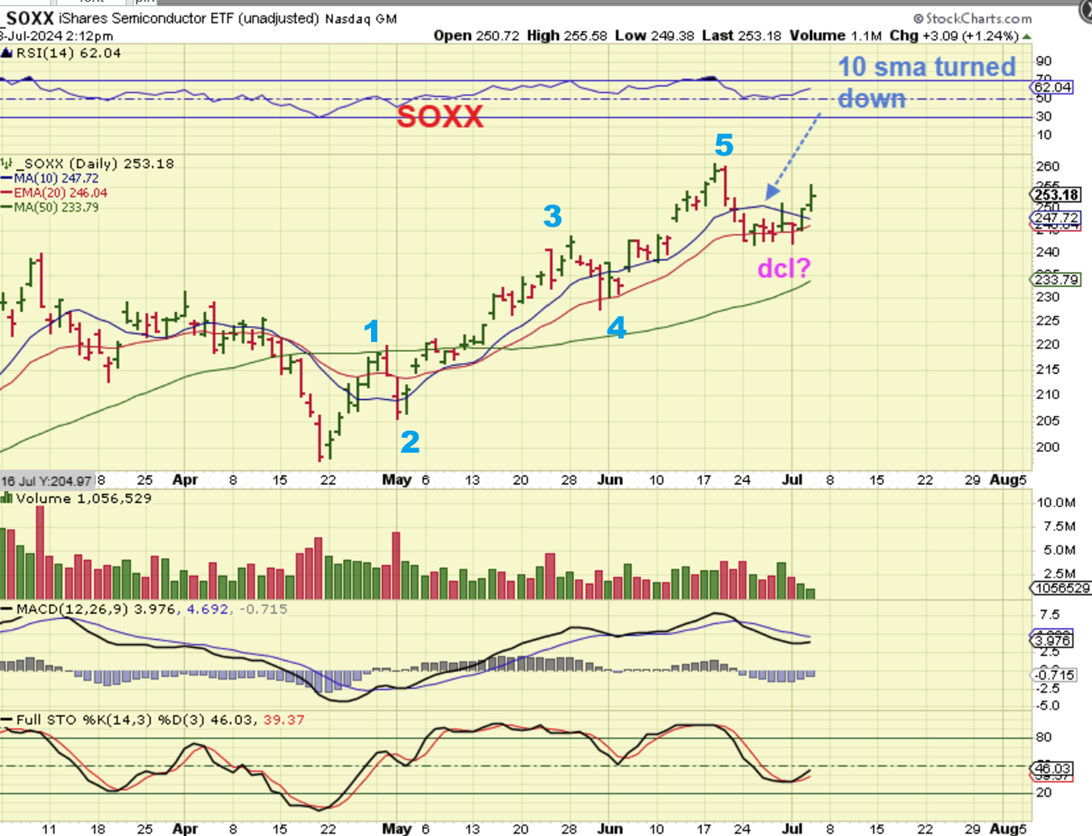
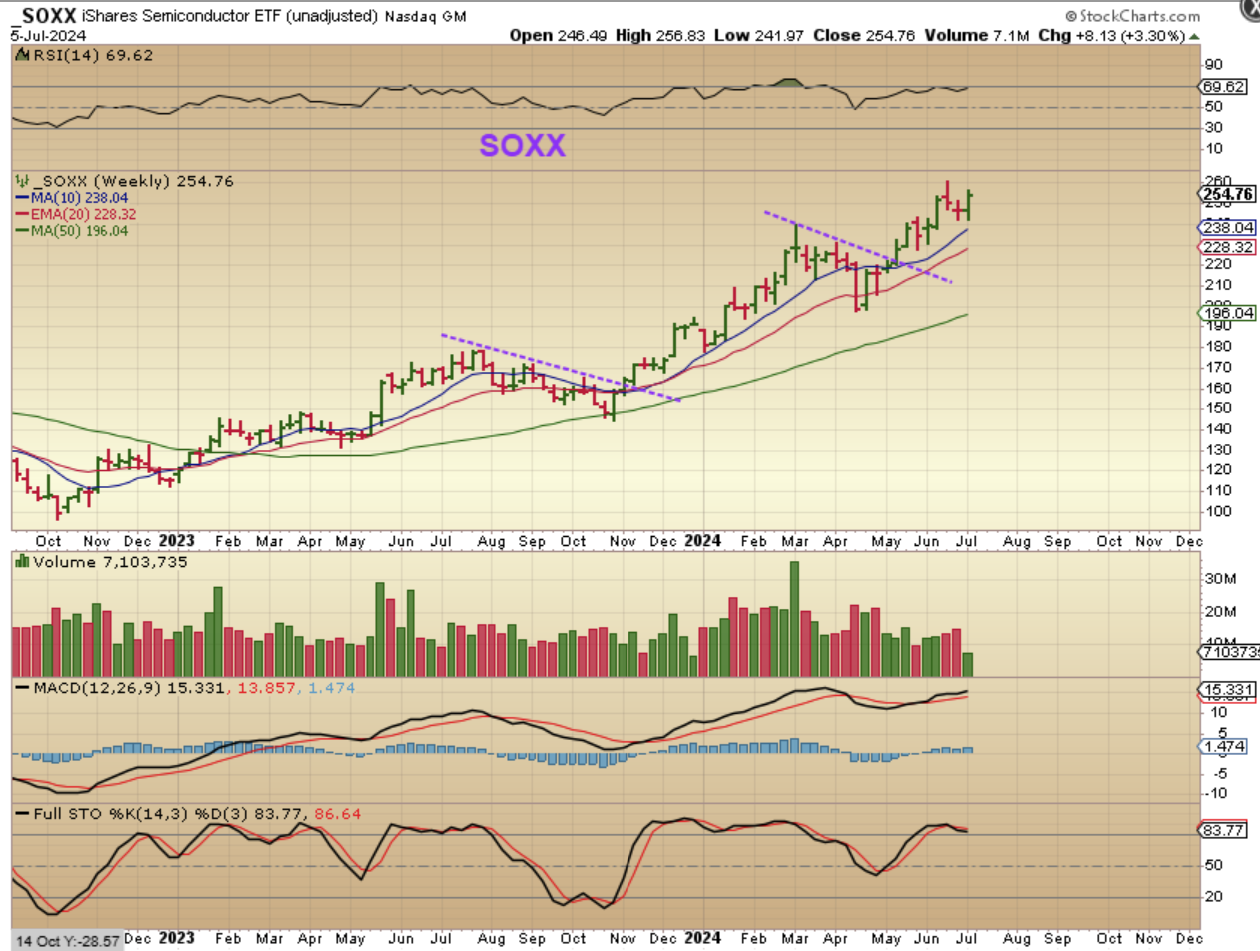
I used this chart last week to show that THE SOXX had a deeper 2 week dip after 5 waves up, and so it looked more like a clear dcl. The 10sma had turned lower and it showed weakness where the NASDAQ & SPX only chopped sideways. This was how the DCL could be identified, so…
THE SOXX WEEKLY shows the 2 week dip as a drop to the weekly 10 sma and then we got a reversal there last week, so the SOXX took a break and returned to bullishness with that hint at a Fed Rate Cut.
.
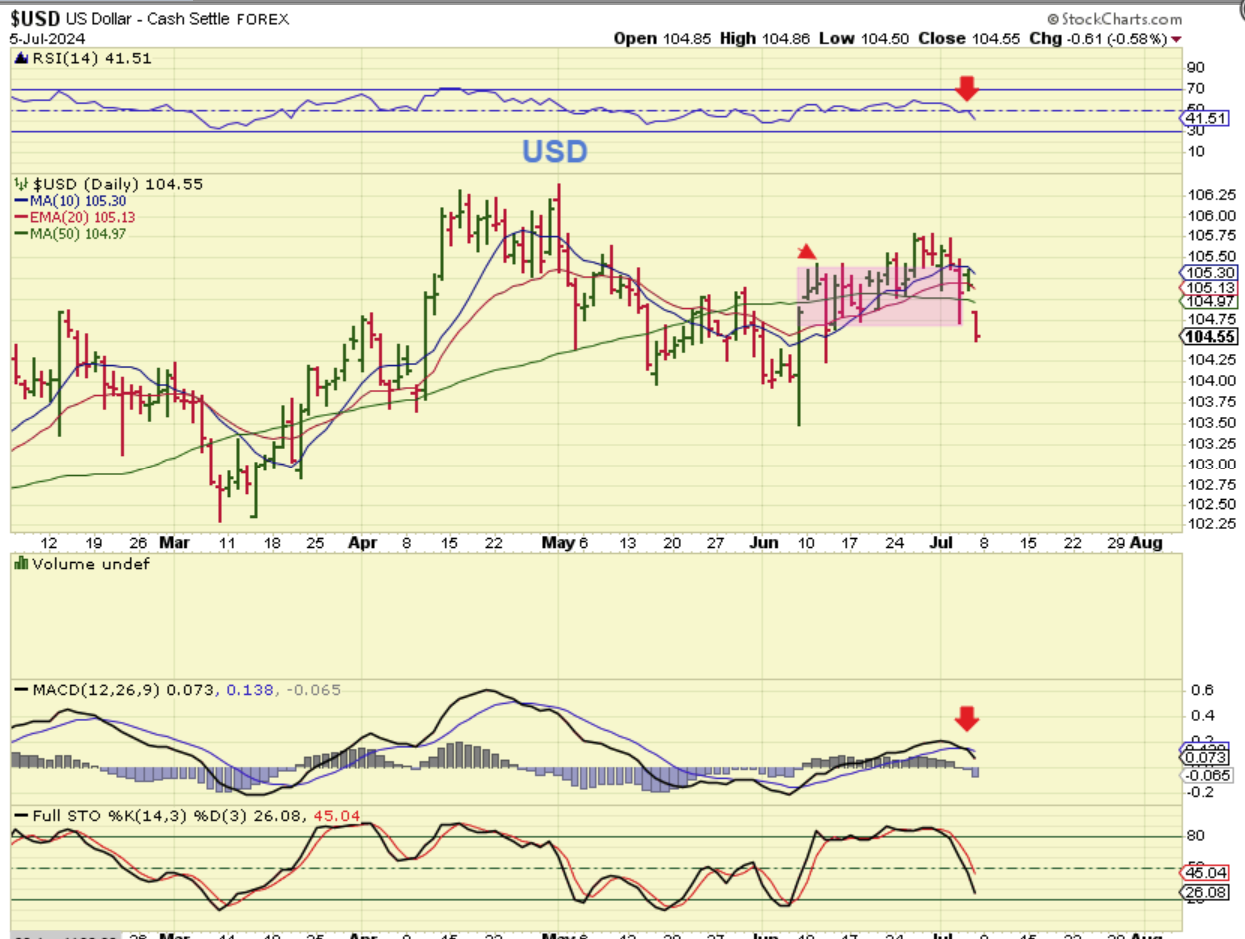
The hope for a rate cut was not positive for The USD, and it was time to dip into a dcl, so this dip on day 20 was expected. It looks like it wants to fall further, because it is not oversold and the MACD just crossed down. That could boost Gold further.
.
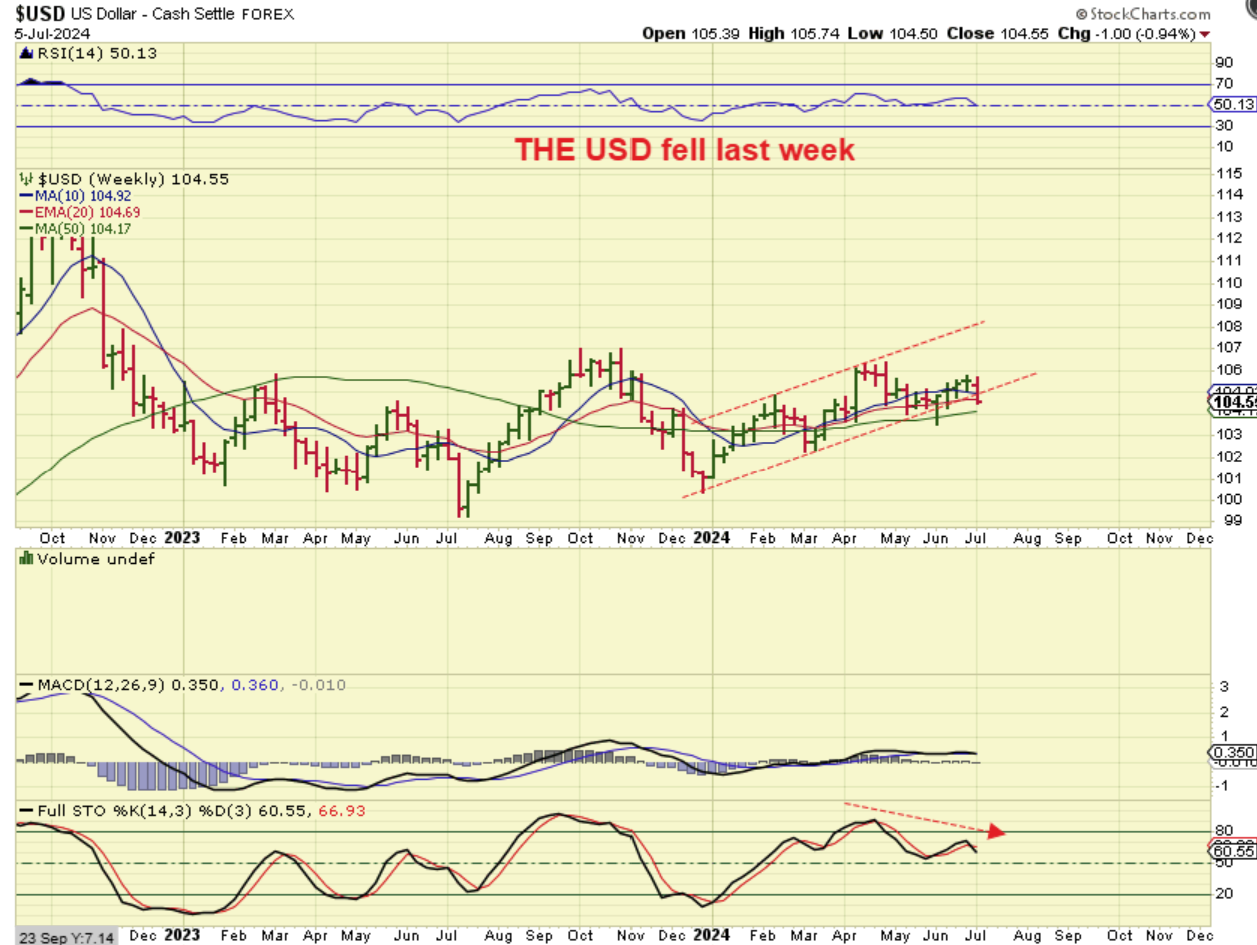
The USD WEEKLY is breaking down and that stochastics makes it look like it also could spend weeks chopping lower (that could prove to be another daily cycle lower after a dcl forms).
.
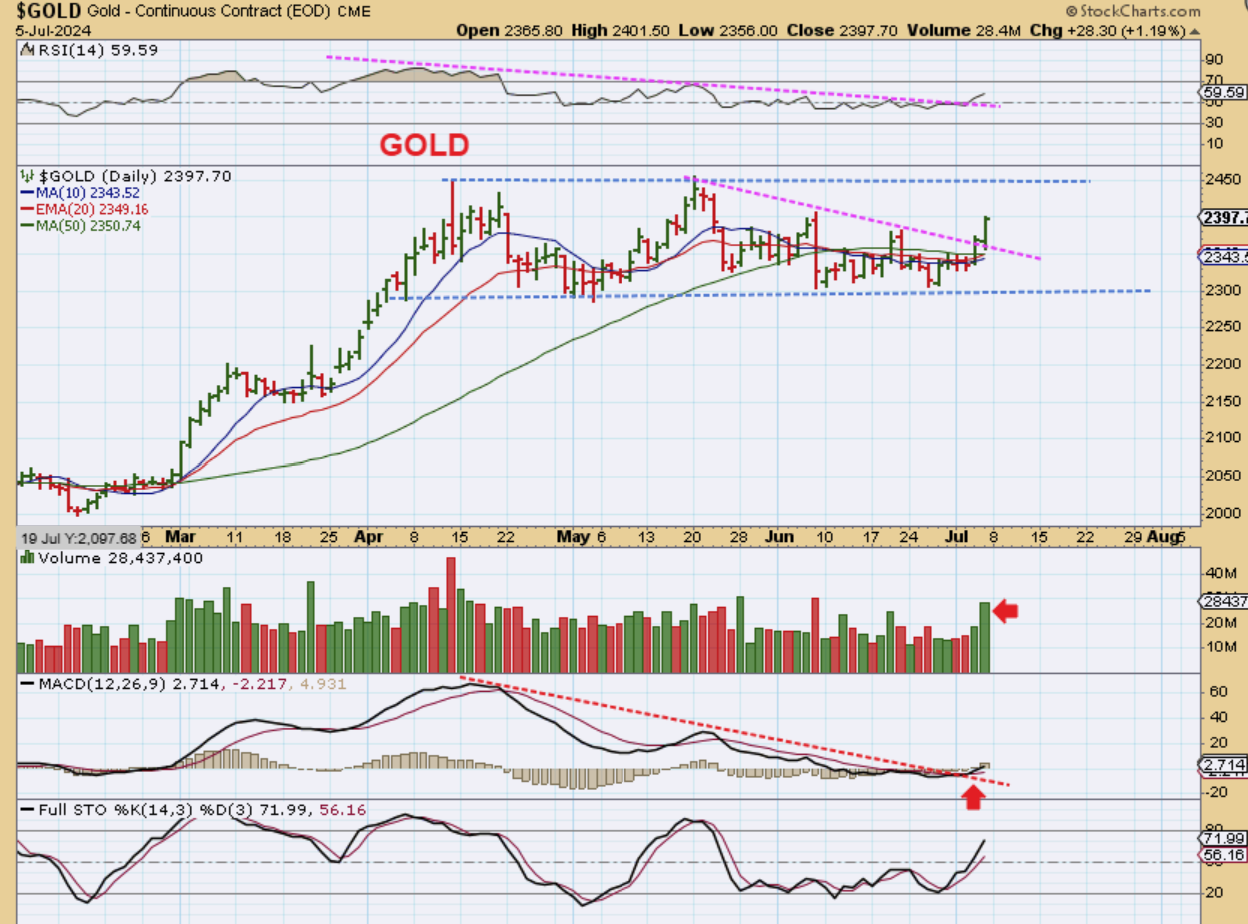
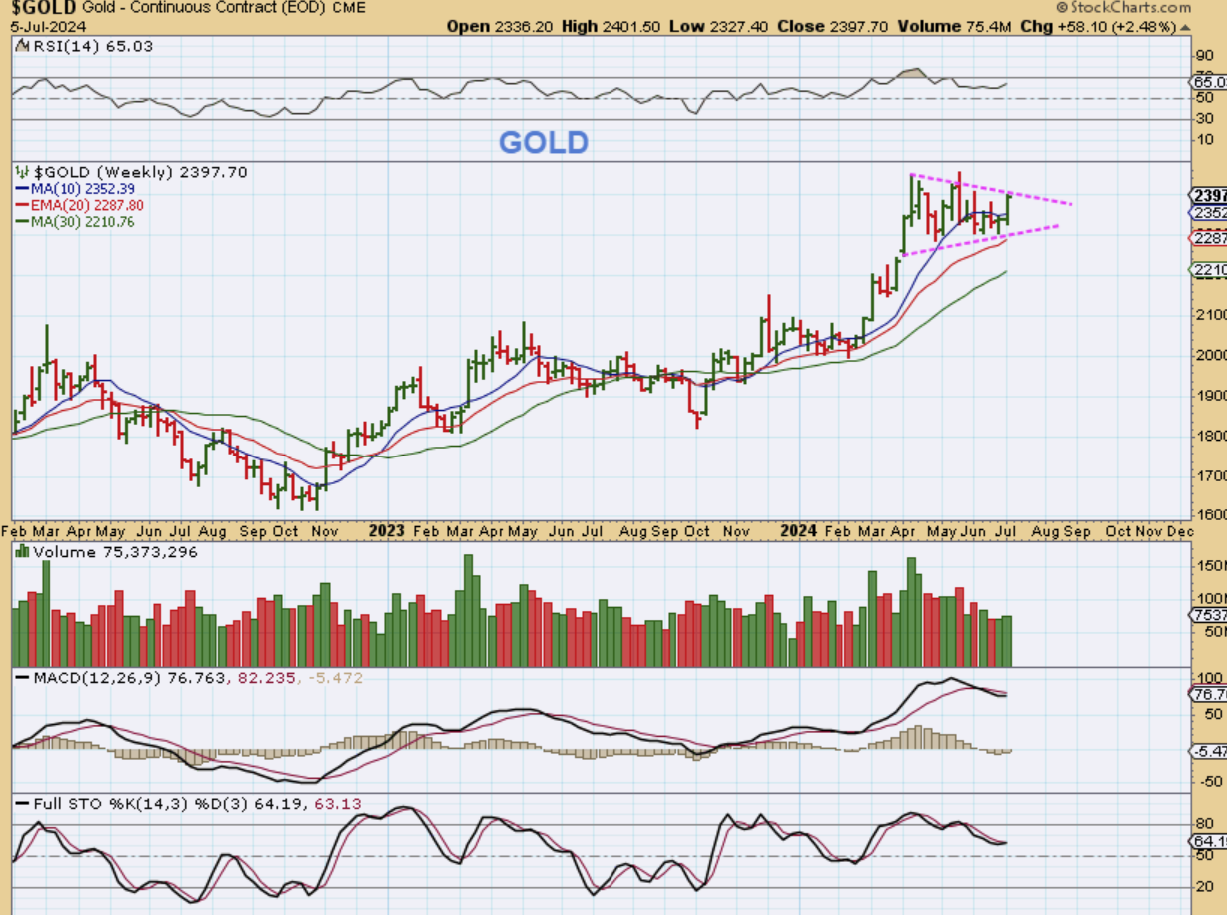
GOLD – Well, this was a long sideways chop that was due to drop into a dcl, but the inflation data and the thought of a rate cut this week seems to have caused this ‘surprise to the upside’. The volume was actually excellent on Friday and a down trend line was broken on Wednesday, so you have to take this as a real bull move. I recently ran through a number of ‘miners’ and showed how the most recent low was likely in the June 17th area for many of them. Gold dipped before and after the 17th, so for Gold it could be that last low at the 26th, and this would only be day 6. Could this be an ICL? It doesn’t really fit the criteria, but in 2016 we saw that runaway move that lasted for 8 months and we could see that here…
.
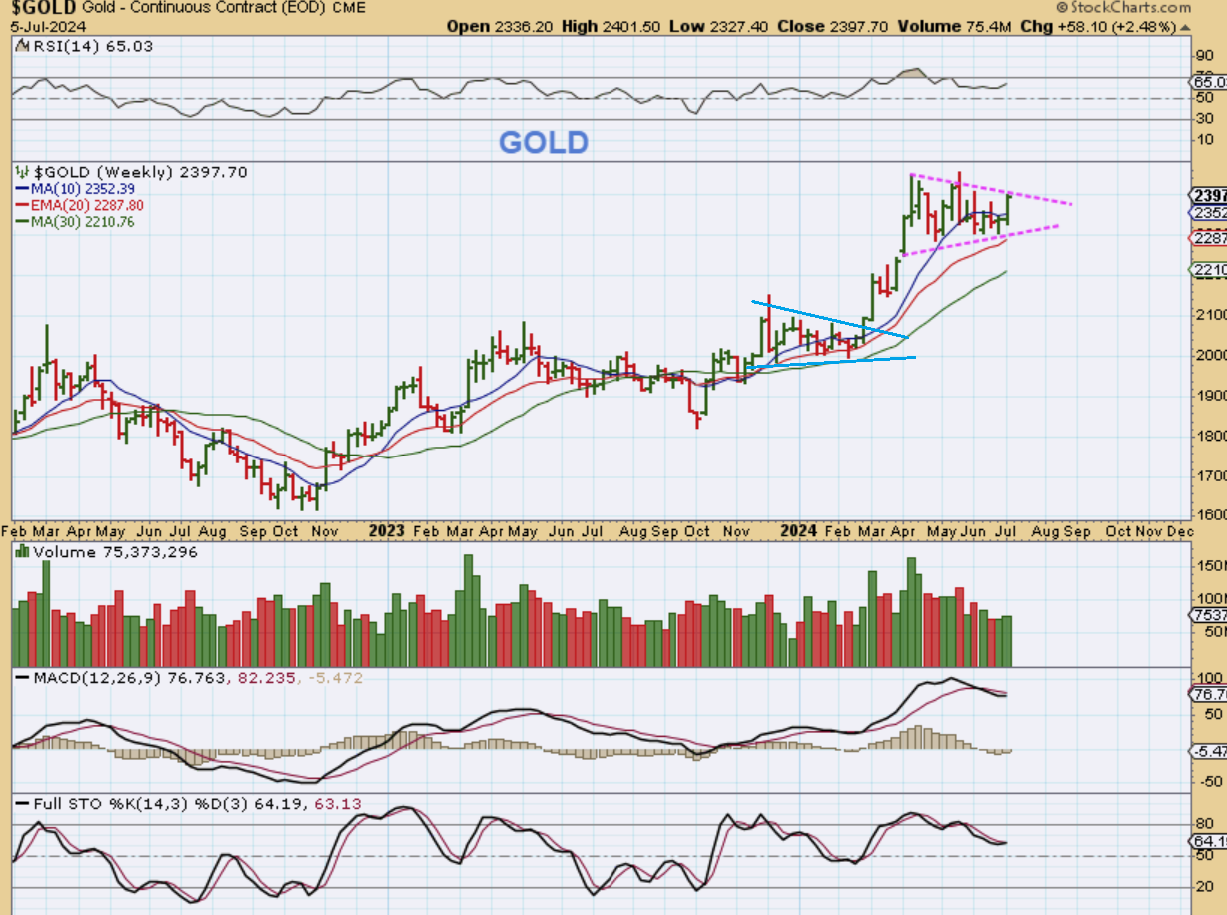
So I flip to the GOLD WEEKLY CHART and wow- a perfect pennant that looks like it might be ready to break out, but it also may have time to continue to form. This was interesting…
.
THIS GOLD WEEKLY CHART resembles that blue sideways pennant pattern that we saw at the last breakout and run.
.
This could stay inside of the pennant, drop into a dcl over time and then breakout and run from an ICL too, since it is a weekly chart. It is not a normal set up this late in an intermediate cycle, so what I have said with reversals:
“Sometimes you just have to buy those reversals with a stop last week and take a chance that its going to run …or …you’re going to get stopped out.” In this case, you could also buy it if it breaks out this week.
.
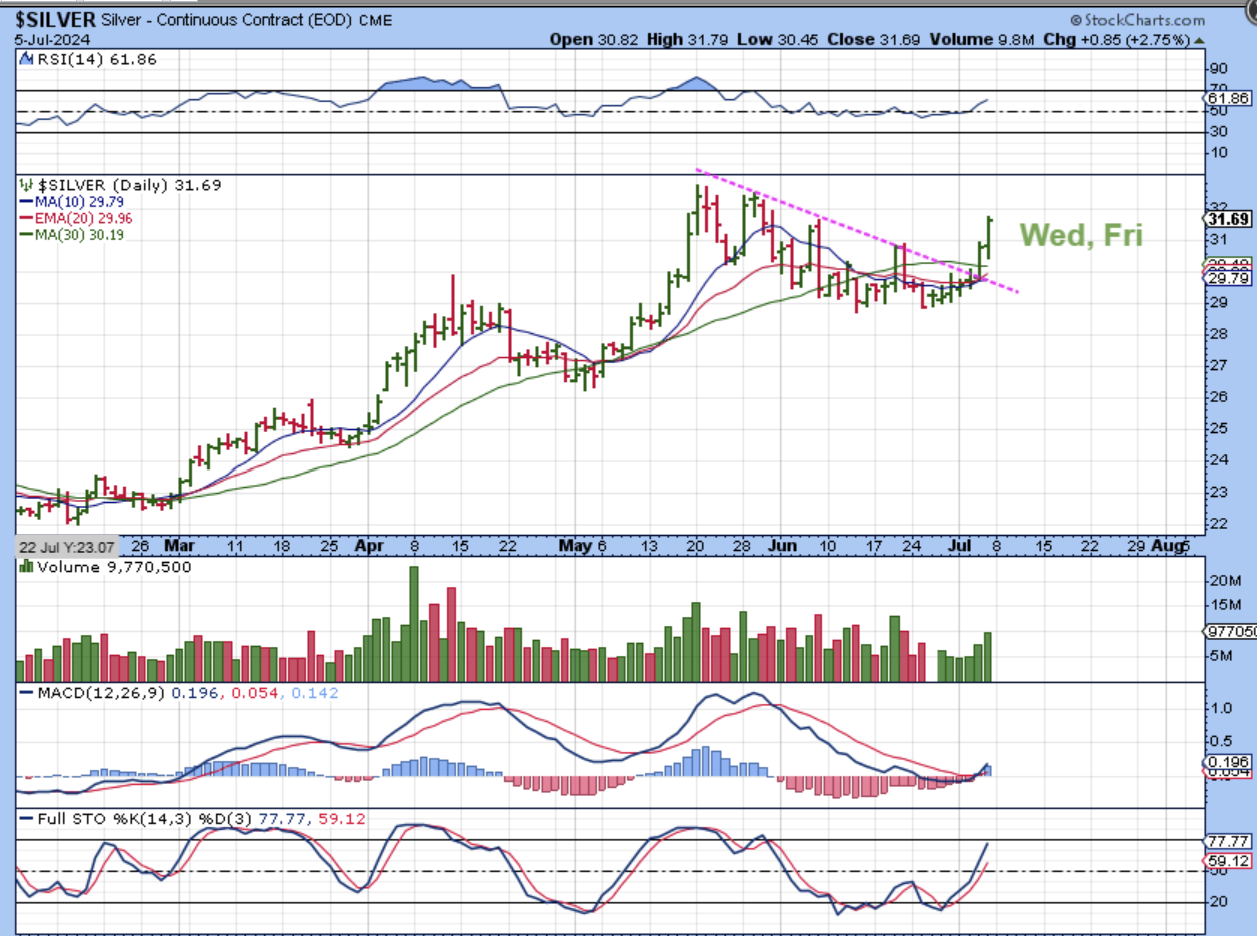
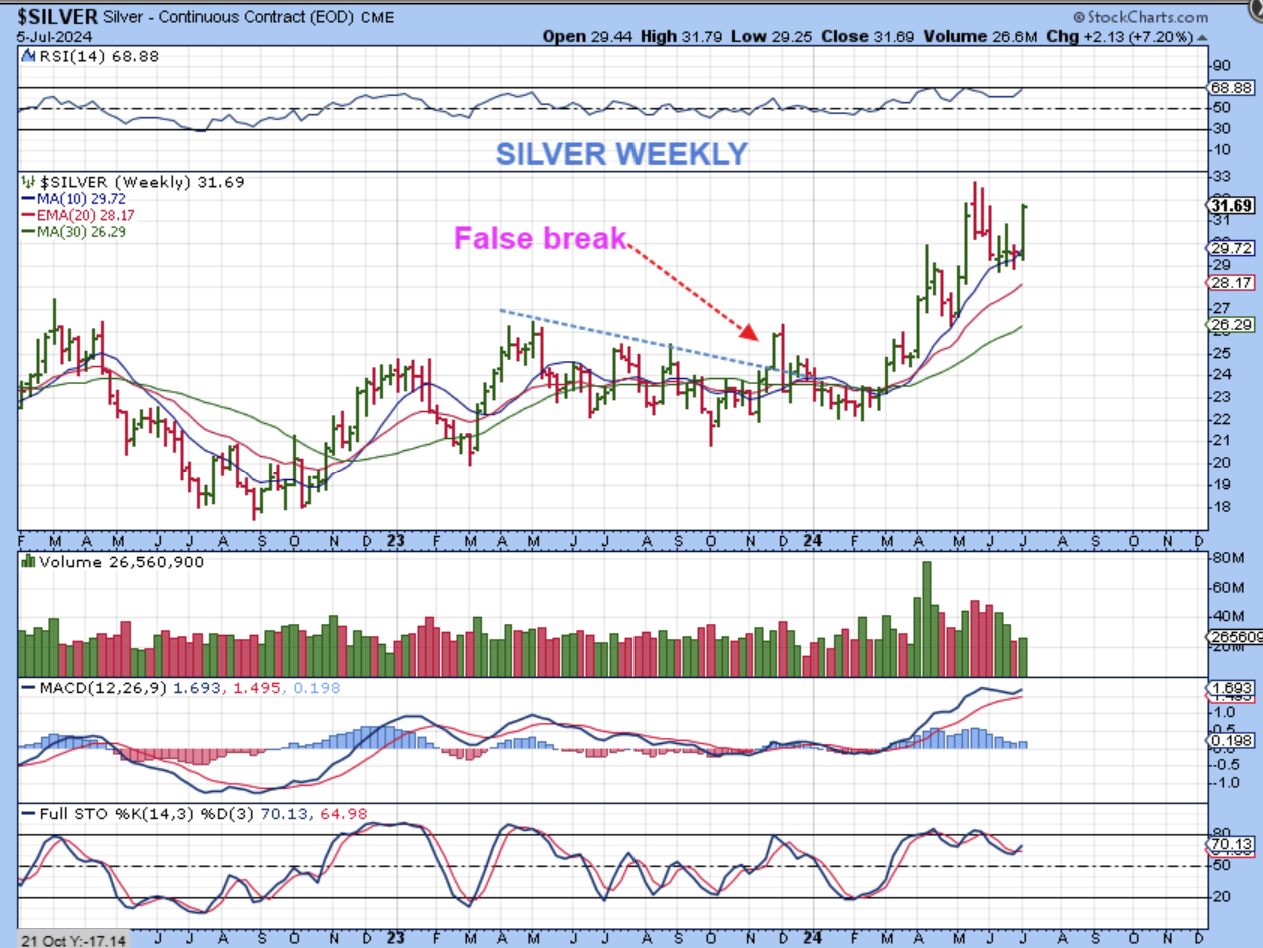
SILVER – If Silver bottomed at June 17, wouldn’t that make this R.T. on day 14? Yes, I think that it could if it doesn’t drop soon. This does look quite bullish, breaking above the 50sma & a downtrend line last Wednesday (except that the MACD is lagging and that can lead to some chop). This is really a bullish surprise though. Let me show you something…
.
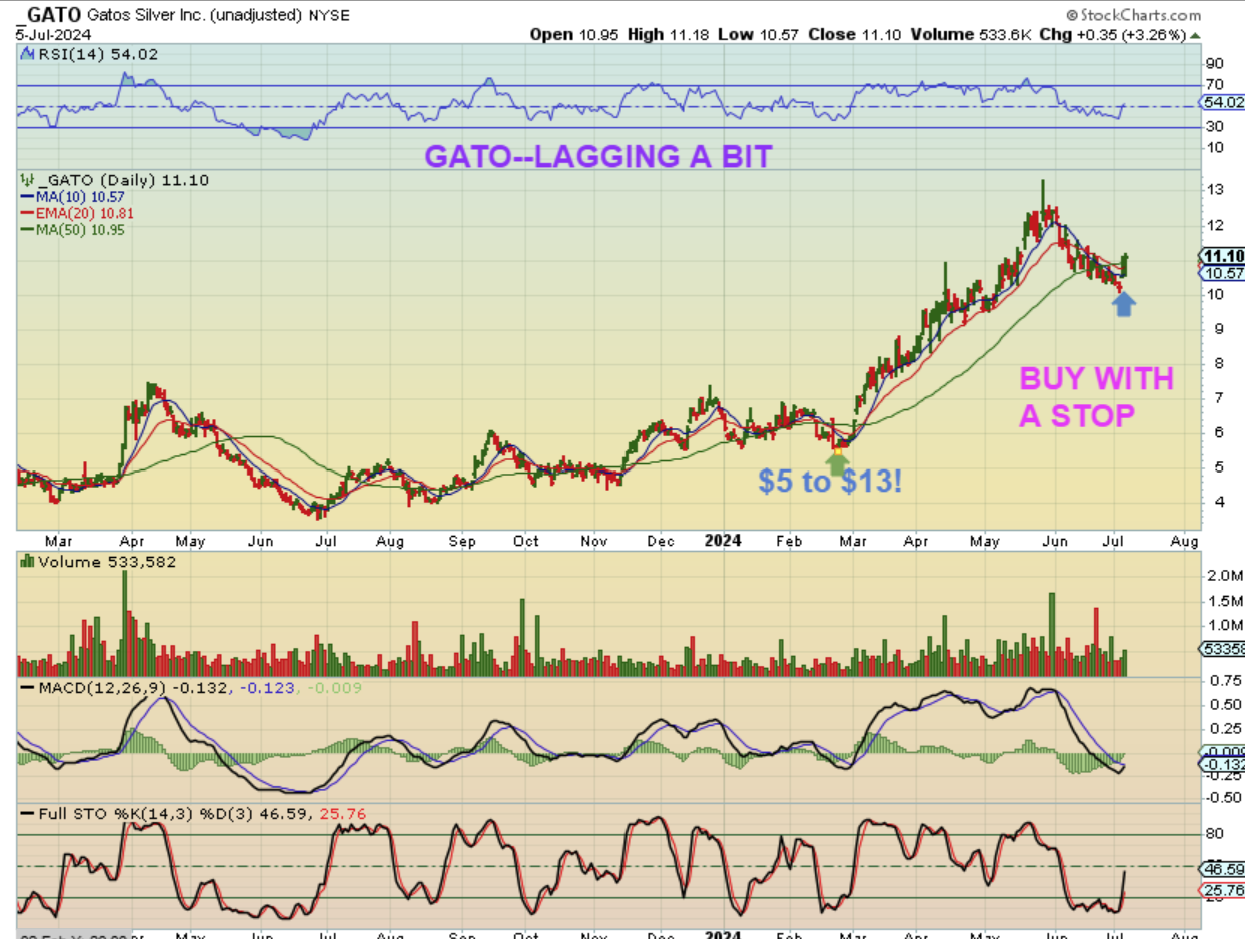
CDE, EXK, PAAS, etc also made decent gains on Wed and Fri. HL, FSM and a couple of others did not. FSM was actually Red Friday, so its a slightly mixed picture. GATO is a buy , because it just reversed at support, so you can still find some ‘lagging’ if you want to buy or add and see where this goes.
GATO just had an excellent run and pulled back to the $10 area.
.
SILVER WEEKLY- When I switched to the weekly chart it sure looks like a bullish 7% surge last week, that’s for sure! I am pointing out that we did see a surge like that in the past, and it also broke a trendline and looked ready to go, but it didn’t have follow through ( false break out). So this week I’m looking to see if we DO get some follow through or not.
.
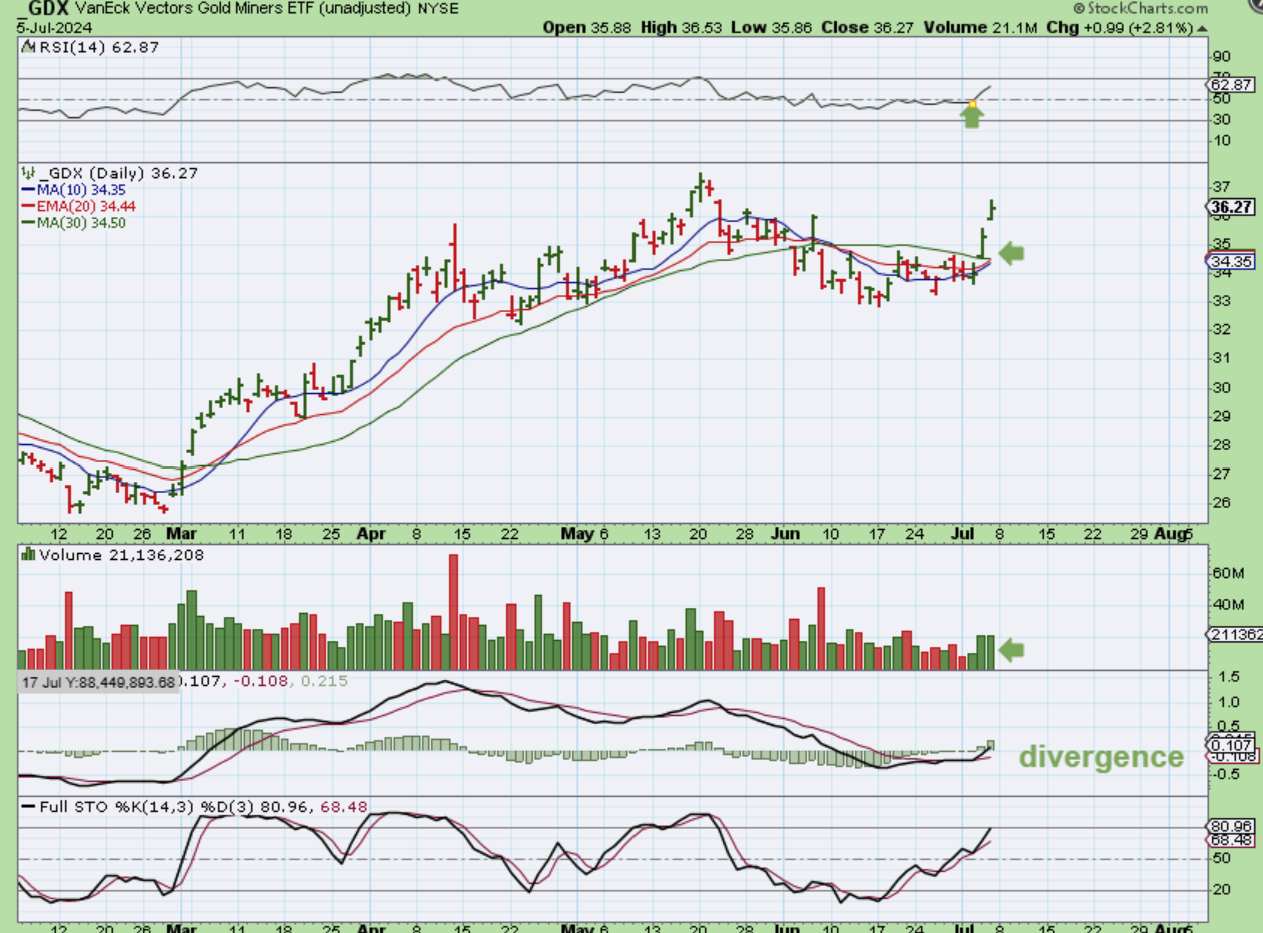
GDX is the only area that looks like it could have sold off enough to give us an a-b-c down into an ICL. It wasn’t the sideways chop that we saw with Gold and Silver, but even at that it would have been a shorter than normal ‘3 daily cycle’ run. To be honest, this is just an abnormal bullish pop at this time in what should be a 4th daily cycle.
.
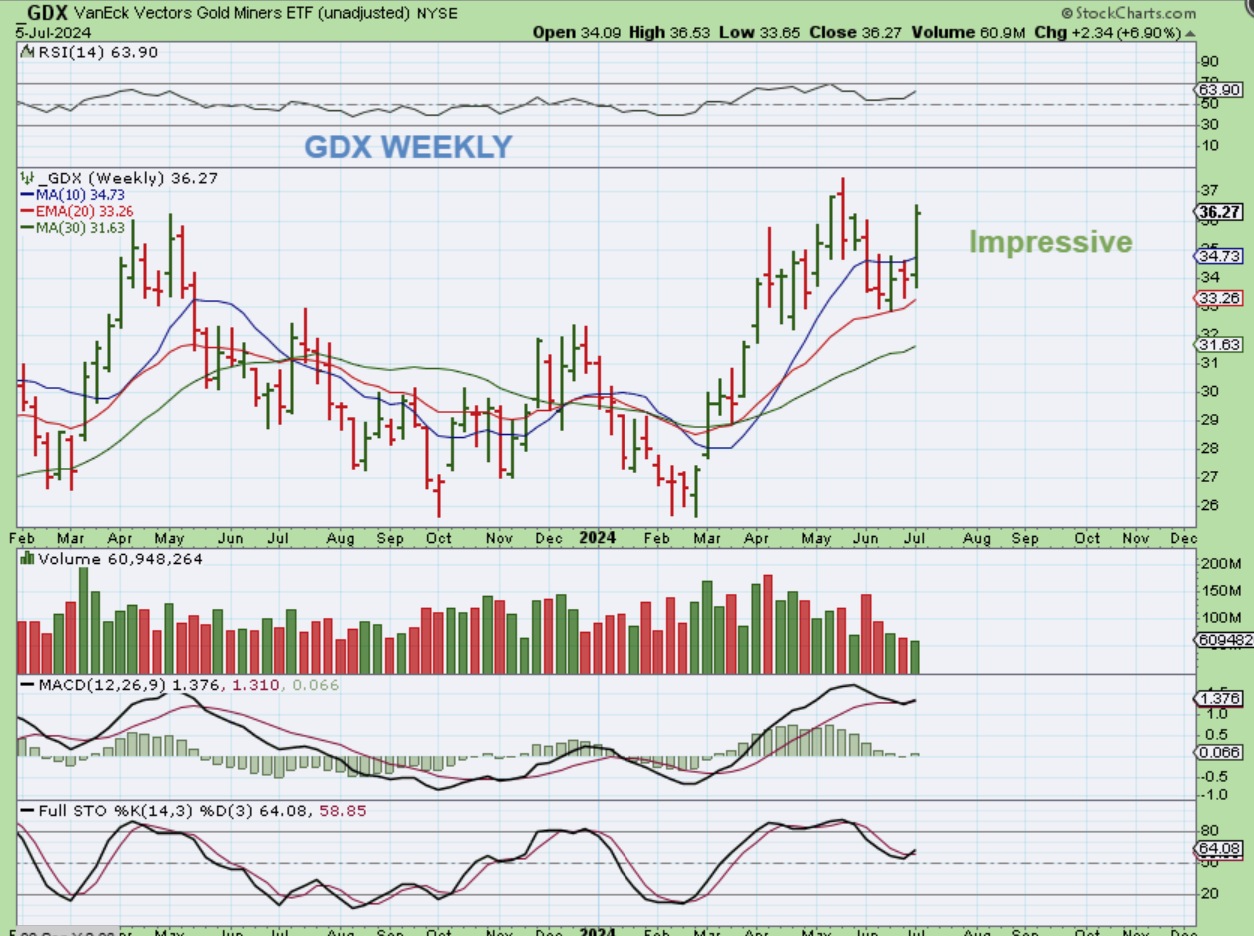
How does the GDX WEEKLY CHART look? That was an impressive 7% pop on a holiday shortened week. It was selling off to the 30 week ma, as it should, but now it reversed at the 20 week ma and looks like it May continue higher.
.
Last week was a bullish surprise to the upside, with the Fed looking more and more like they will be giving a rate cut sooner than later. These surprises to the upside are buyable when they happen, but then you just have to see how they act going forward (continued strengthening & short covering (?) or weakness again). We’ll see what Monday brings, have a great Sunday night & Monday!
.
~ALEX
.
On Wednesday evening I wrote:
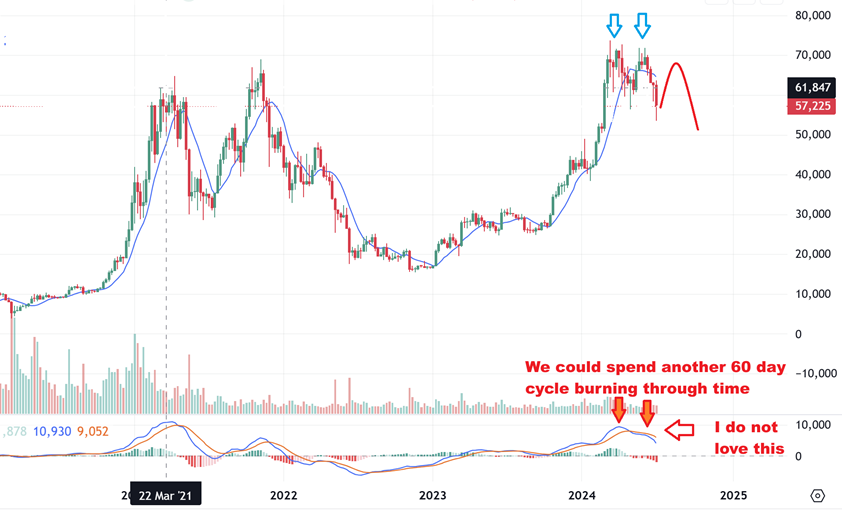
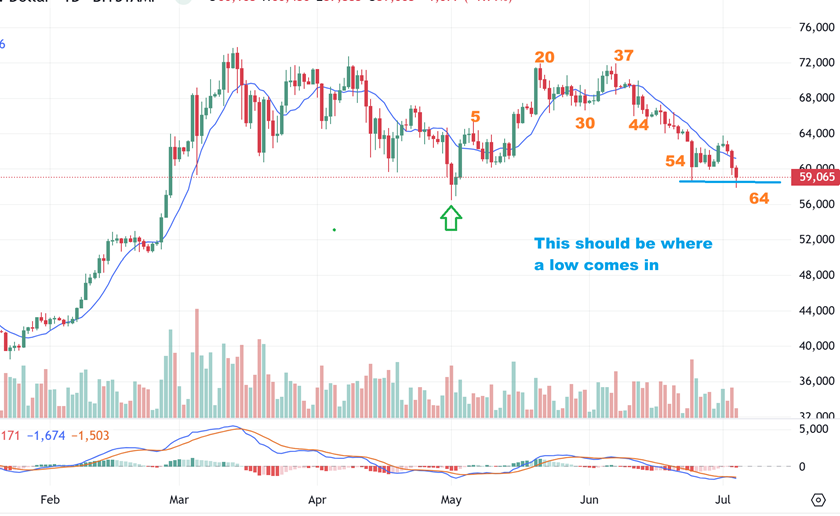
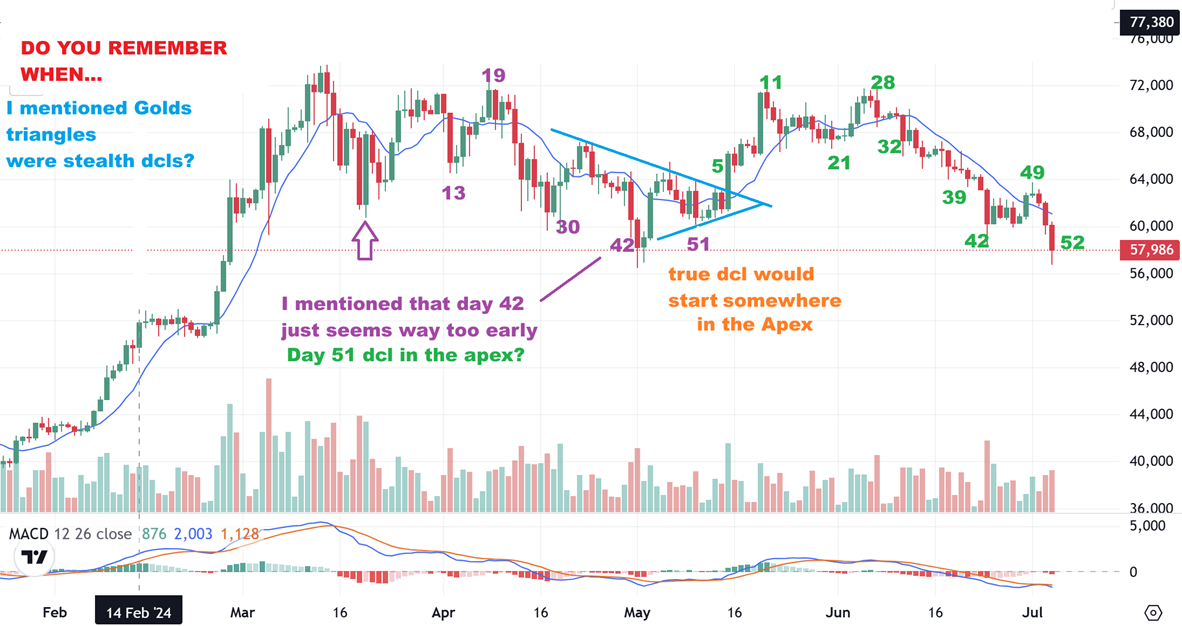
BITCOIN Midnight – Bitcoin did break that day 54 low, so that should simply extend the count to day 64. That should not damage the set up, it could act as more of a ‘stop run’ by breaking those lows & recovering soon. It has not broken the last dcls lows (yet). A day 64 low really puts us in the timing for a dcl. Crypto stocks are still acting correctly, but they can become choppy under these conditions. Once Bitcoin rallies, the Miners should make a nice run higher.
.
BITCOIN – This was another idea that I had, but did not share yet. I mentioned a triangle dcl in the past, and if THAT was the cycle count, it changes that count and pushes it forward. That would have only been day 52 of a possible 60. Please read the chart.
.
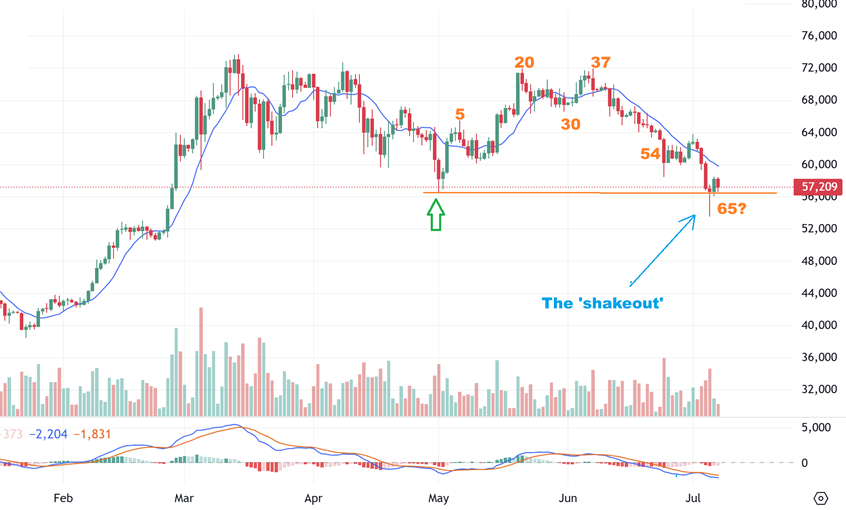
BITCOIN DAILY – So we saw a crash down on Friday while I was away, and then it started to bounce back. I saw Bitcoin on my phone, but I didn’t look at my account while I was away. I was hoping that this was just that shakeout that I mentioned. I was AMAZED to see that my account would have been (or was down A LOT) in the morning, but it closed green. Green? On a crash day like this? THAT was amazing. So we may have a shake out on day 65.
.
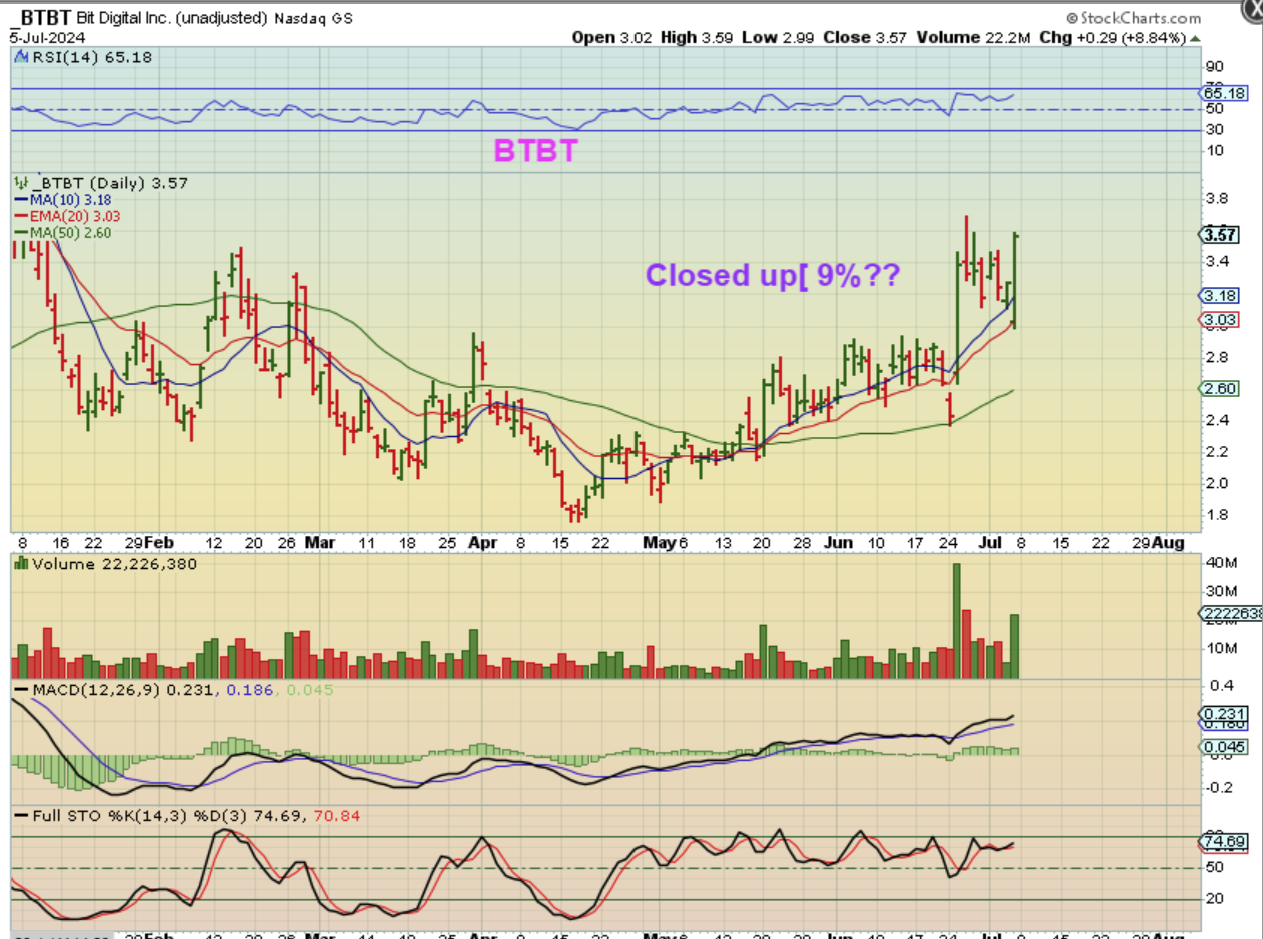
BTBT – Many of these crashed and recovered, and I was amazed to see that when I got home. BTBT was up 9%.
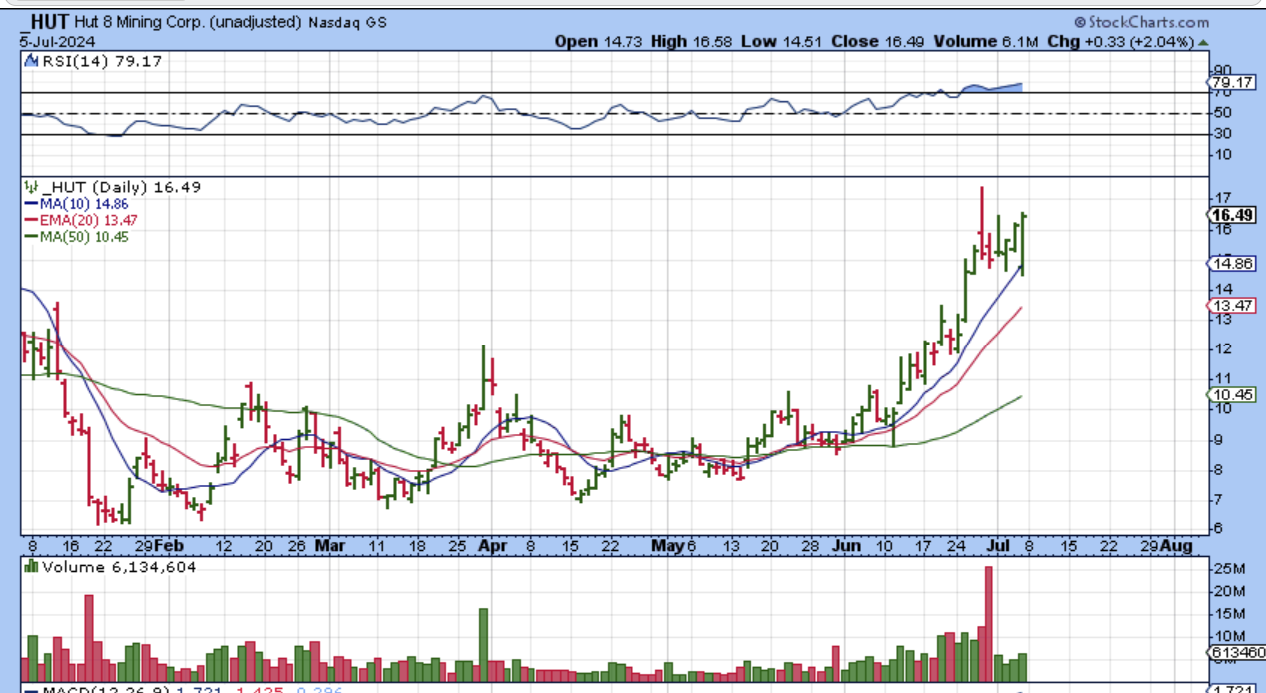
HUT was dropping from over $16 to under $15, and then snapped back to $16.50.
.
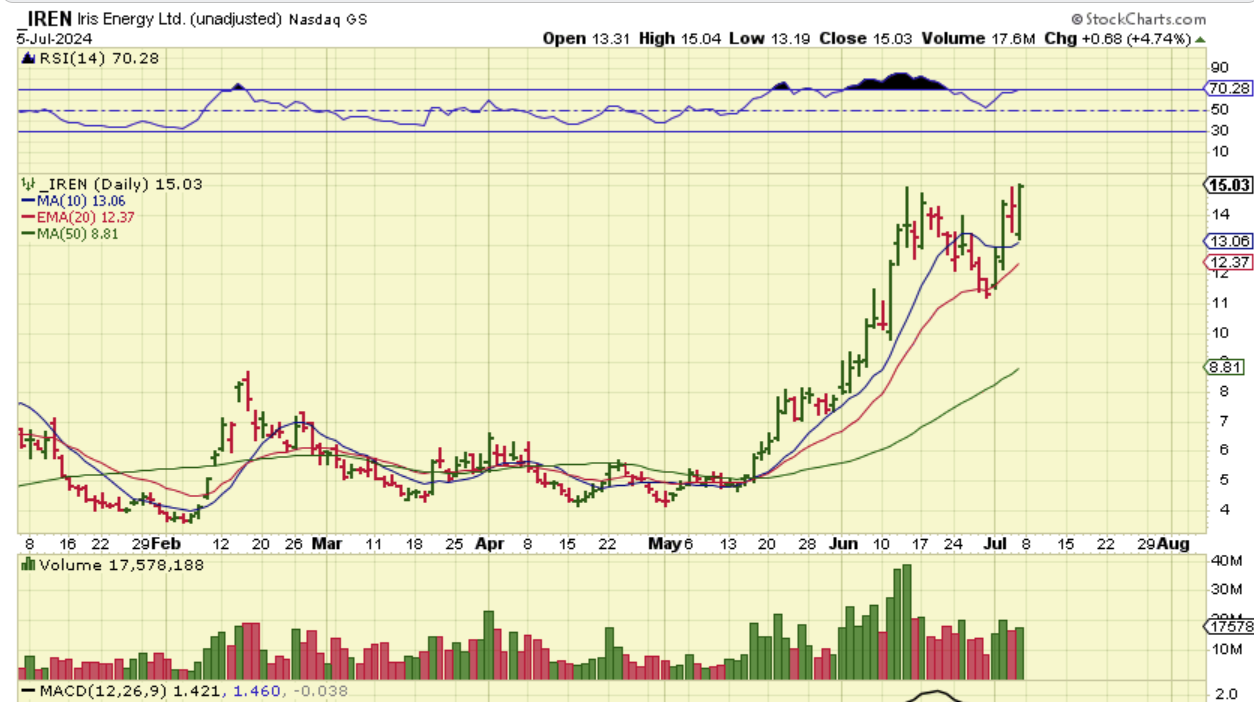
IREN dropped and recovered too, closing up almost 5% on a bitcoin crash day. So this is encouraging at this point.
.
BITCOIN WEEKLY – I do have to say that this is not what I like to see. There is time for it to change, but at this point that MACD is weak on a weekly basis, so it looks like a double top. If we have a shakeout dcl, we’ll bounce and see how this weekly chart looks after a couple more weeks.