Wednesday July 3 – Bitcoins Overnight Drop – How Bad?
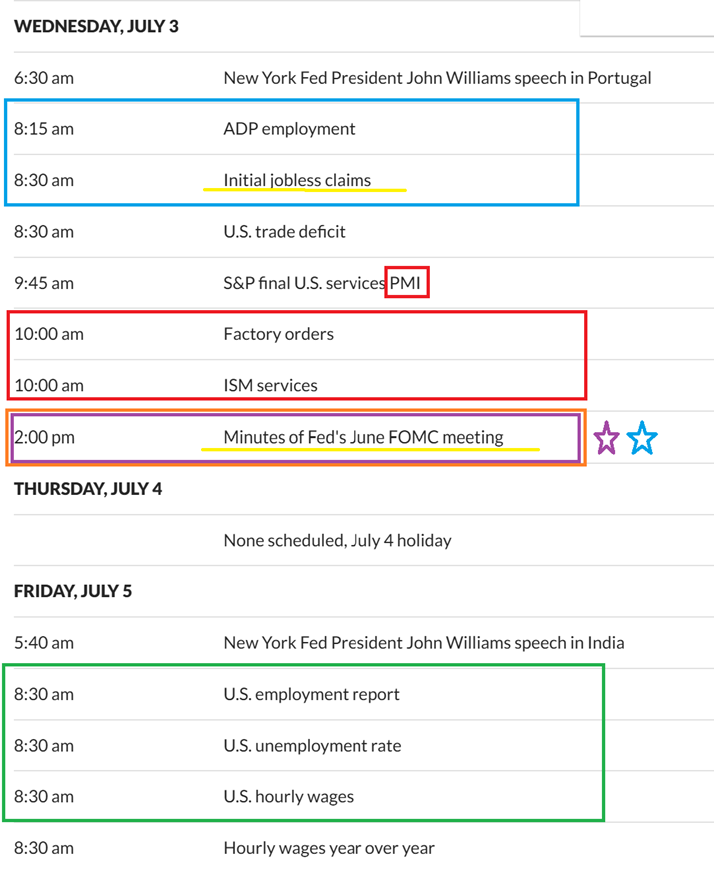
DATA – We have important data today, on Wednesday, the day before a holiday in the U.S. Notice the morning pre-market, and notice the afternoon at 2 p.m.
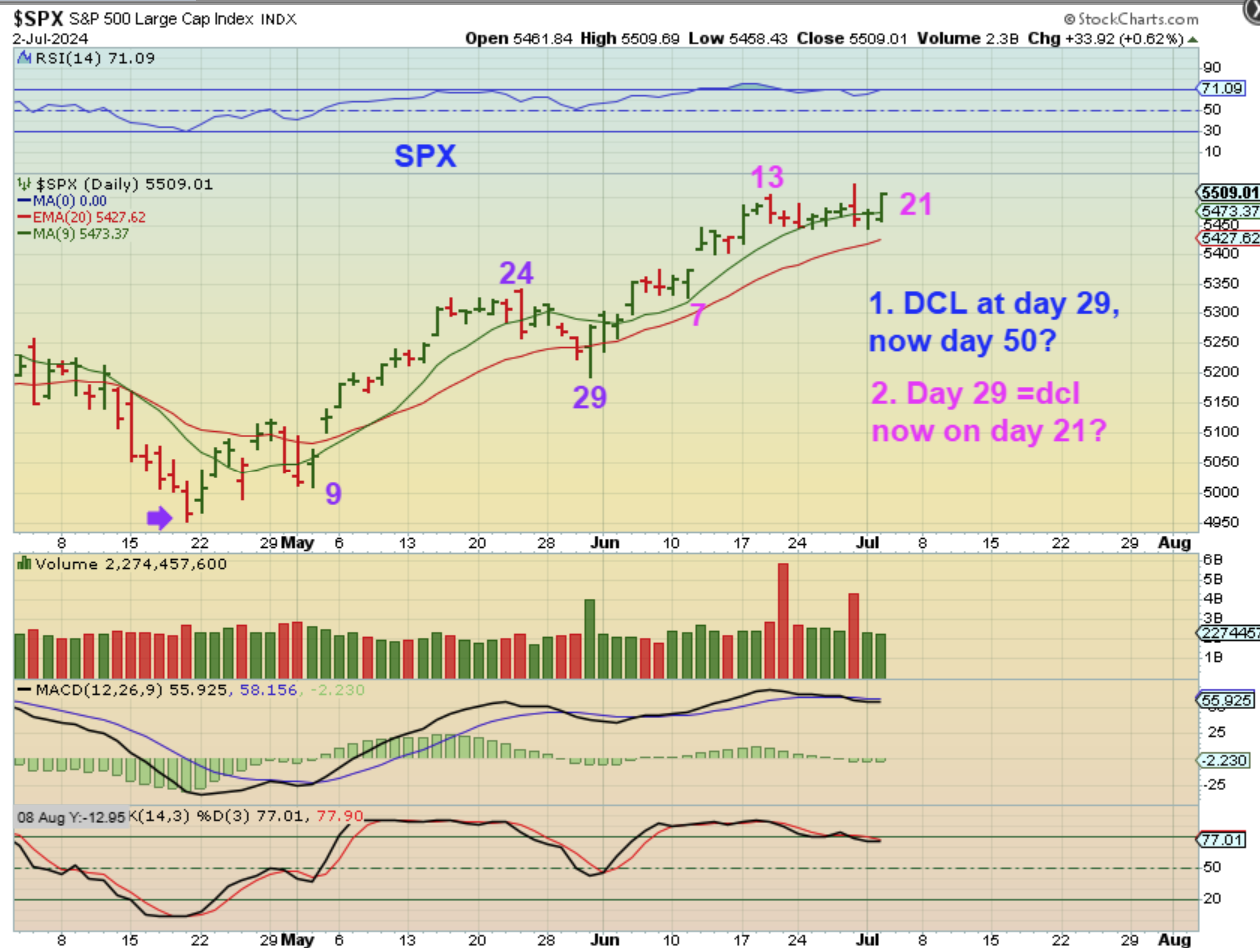
SPX 1 – Again, we are not getting a dip lower this week so far, so if todays data doesn’t drop things…
1. I wrote this wrong on the chart, but I meant to write that we may have seen a ‘Half Cycle Low’ at day 29 and now we’d be on day 50. Tuesday looked like a small sign of strength though, so another possibility discussed in past reports was idea #2 on the chart…
2. We may have had a short daily cycle with the dip at day 29, and now we’re on day 21 as shown on this chart.
.
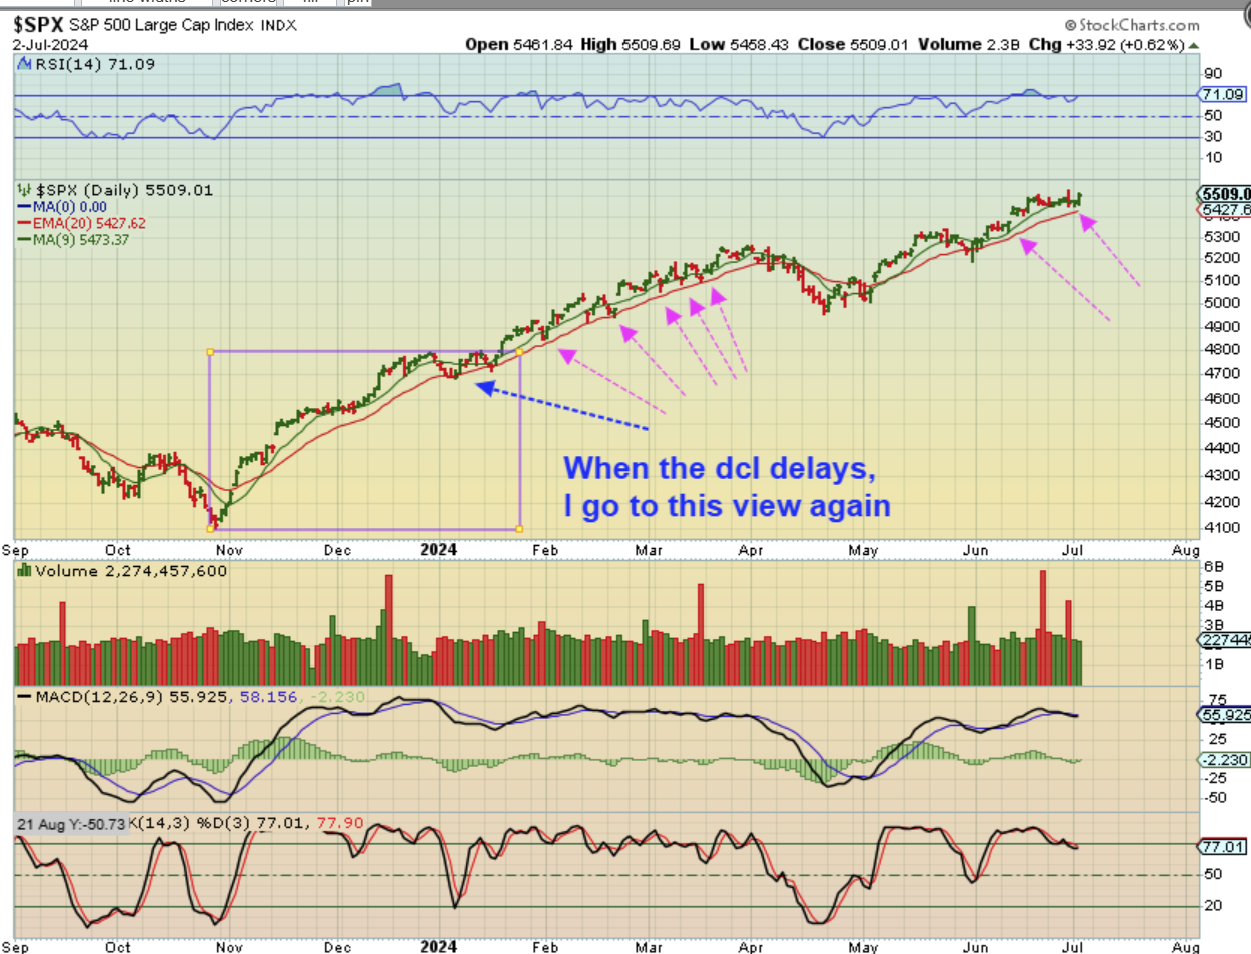
SPX 2 – And again, we’ll look back at the longer-term Bull Market and see that at times the dips were shallow and it was hard to see a dcl on the run higher. This has been a strong bull run.
.
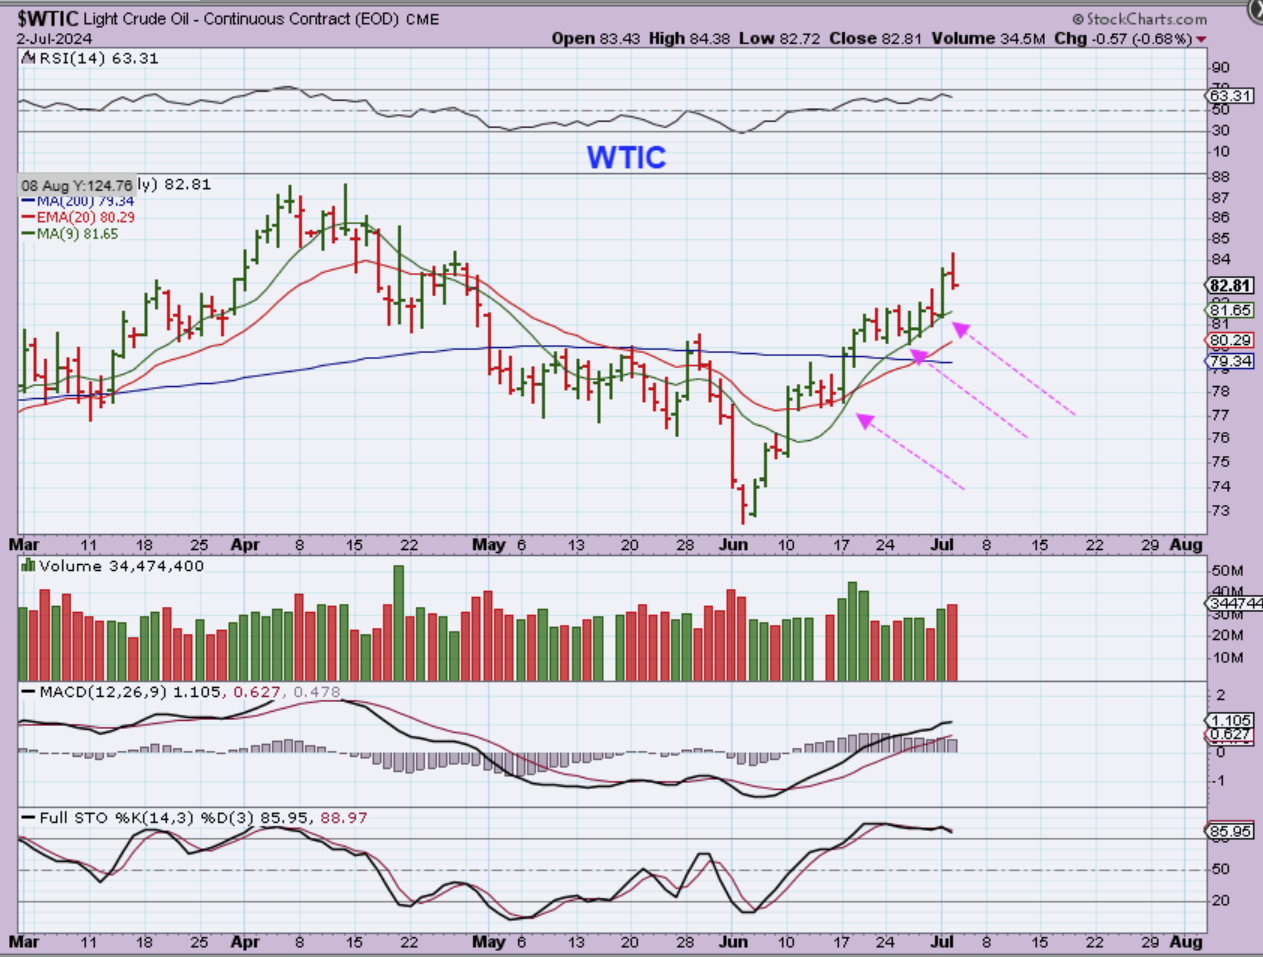
WTIC – On Day 19 Oil did a pop and drop , but it is climbing steadily higher over time.
.
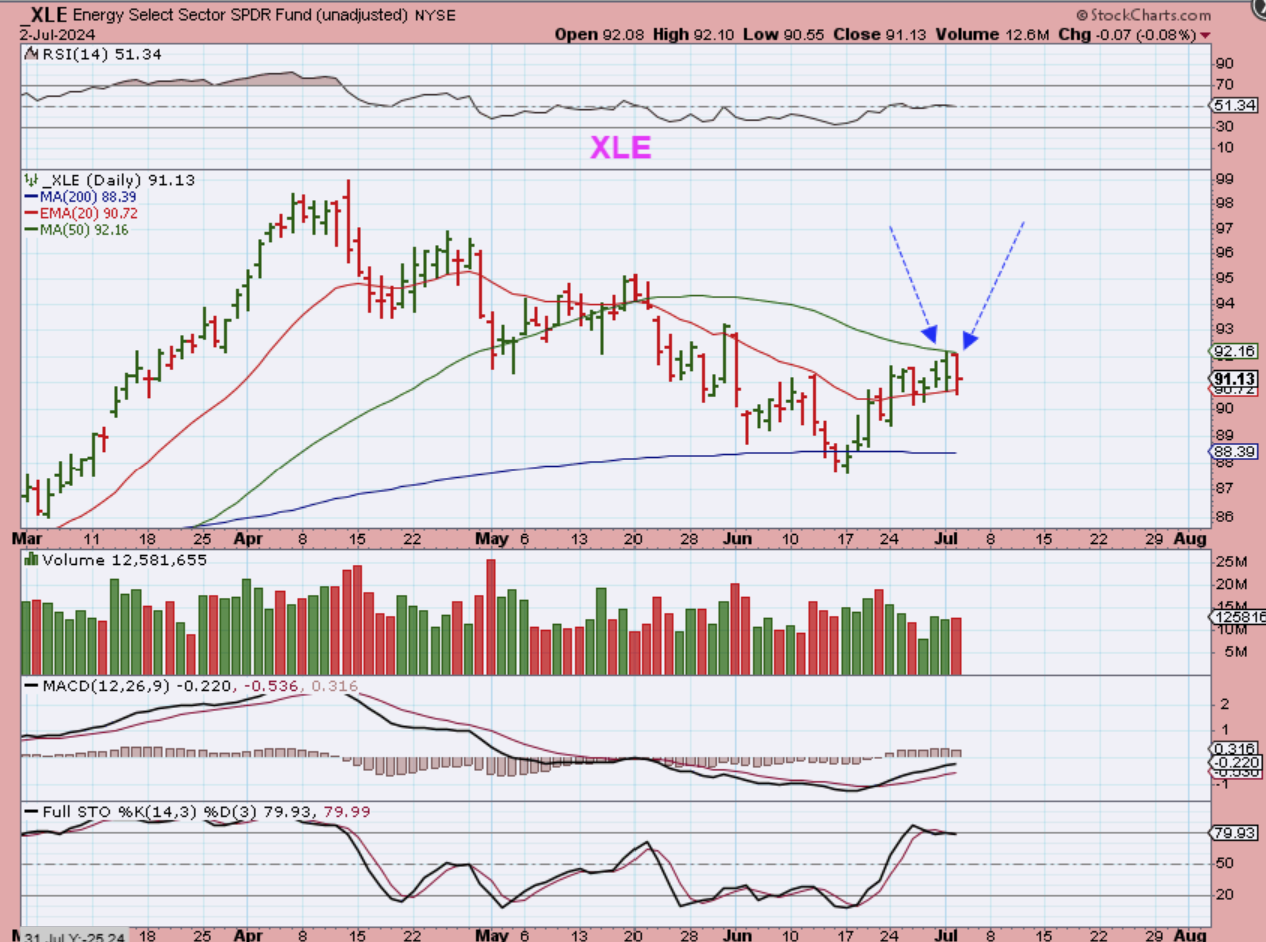
The XLE was again rejected at the 50sma, but it can crawl along here for a while to build energy for a breakout.
.
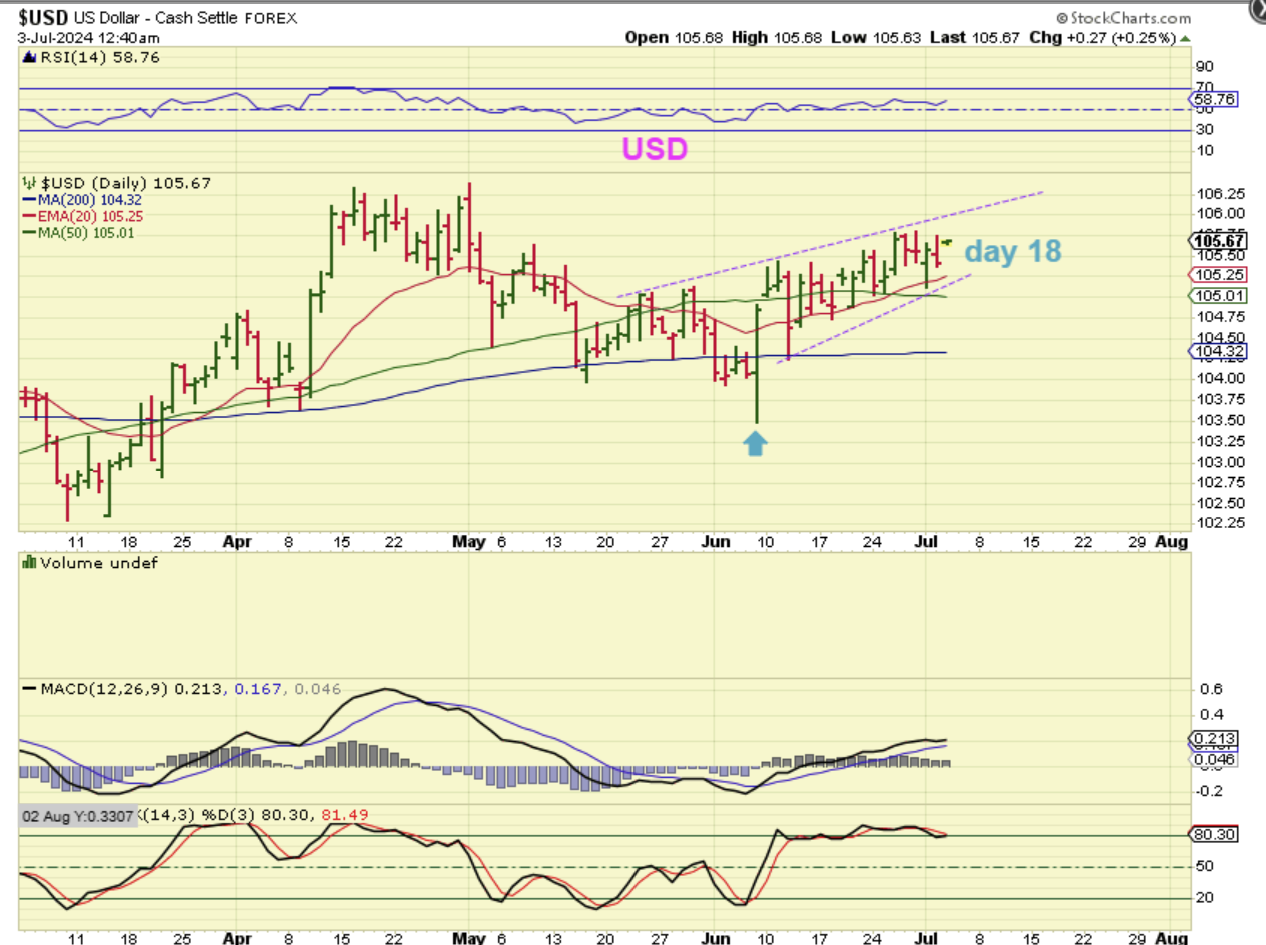
Today is showing up on this chart and this would be day 18 for The USD. It is getting late in the first daily cycle and this is starting to resemble a rising wedge (they break down eventually, into a dcl). The USD could be due to dip lower soon, but the USD is not affecting Gold like it used to.
.
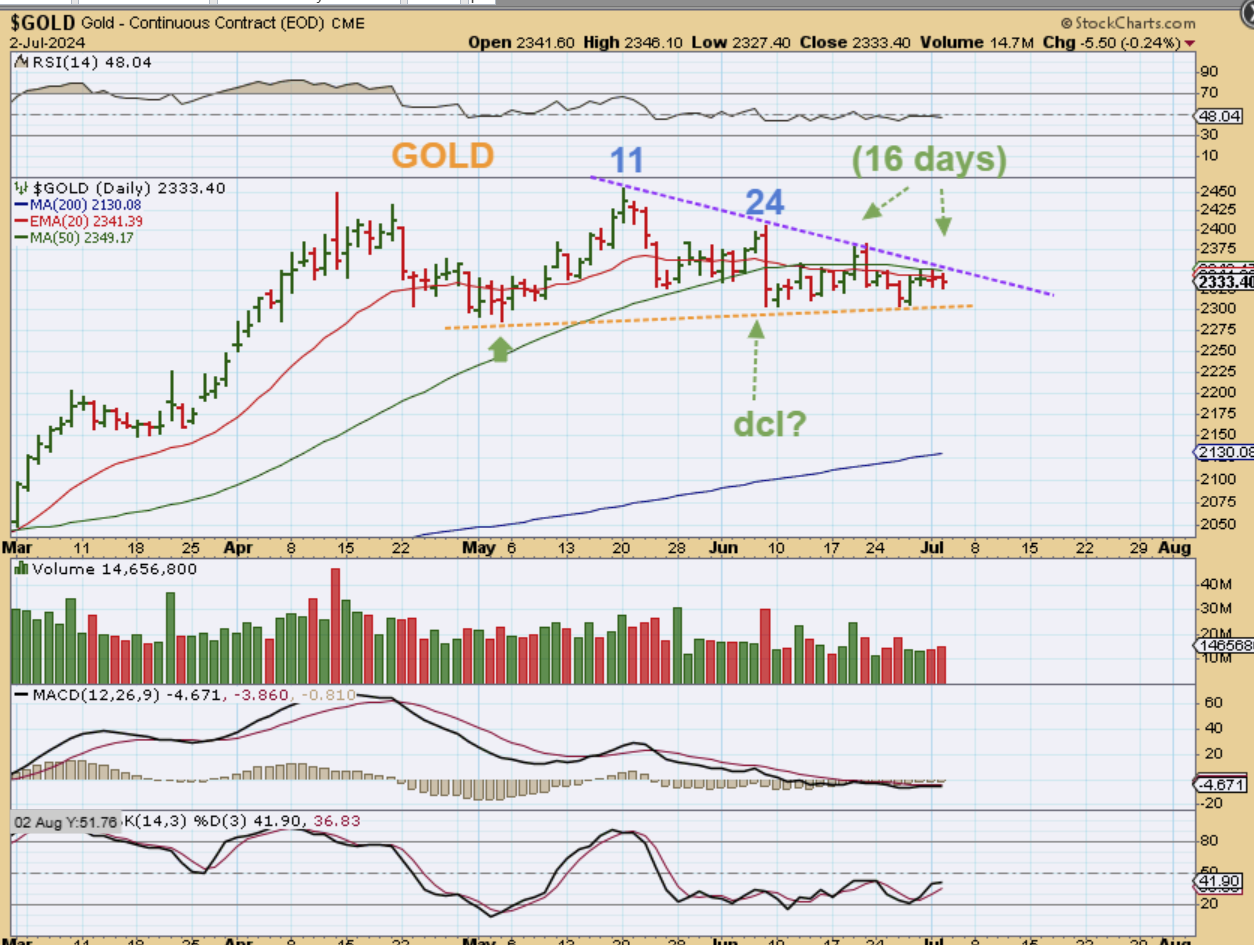
GOLD – Was day 24’s slam down a dcl? It could be, and that is because I do think that Silver and the GDX both bottomed shortly after that at June 17, so we are in the 4th daily cycle. Will it end L.T. or Right Translated? We’ll see, but next I’ll show you why I think that the dcl came at June 17 for Silver & GDX…
.
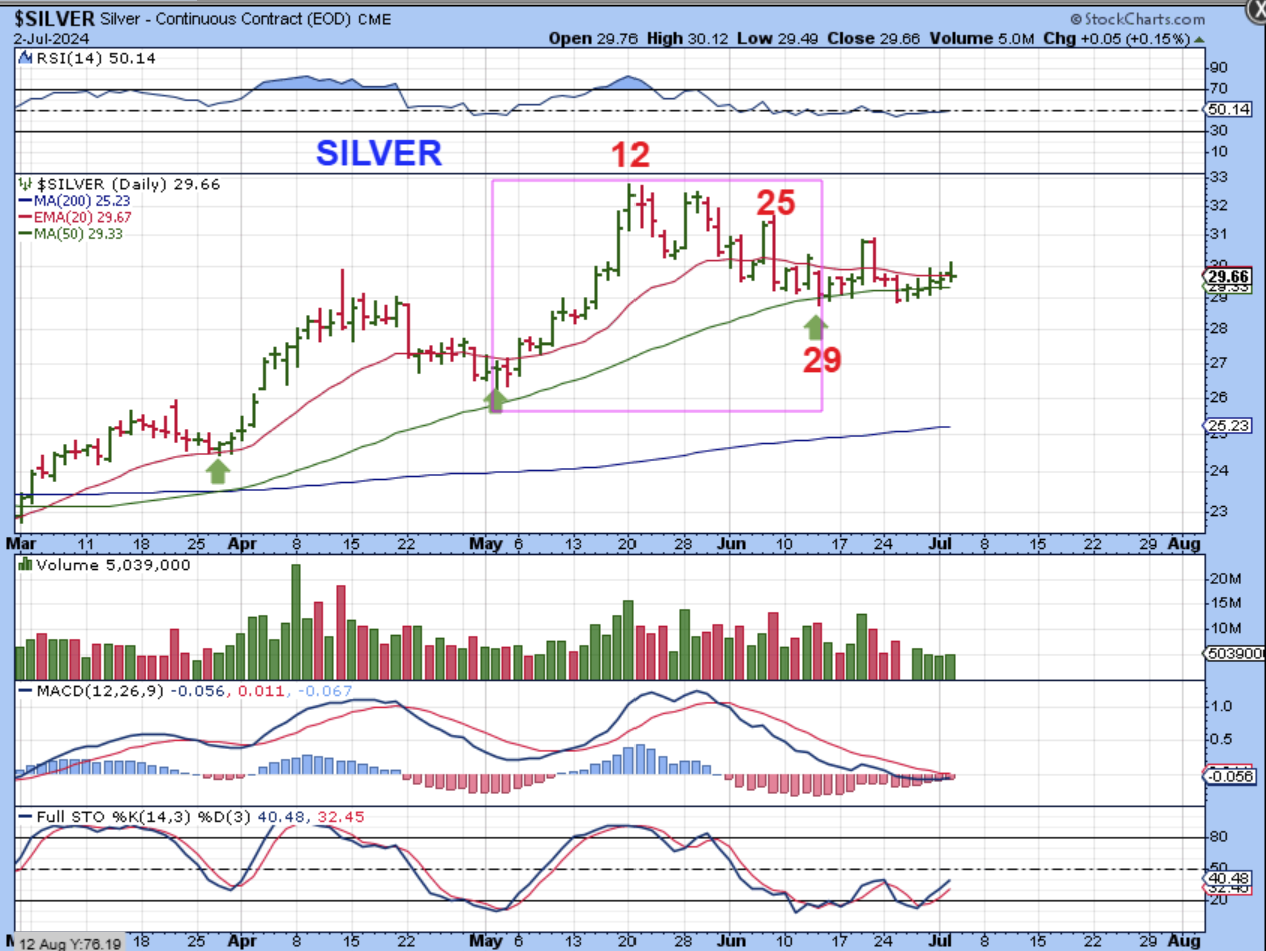
SILVER – This would be day 12. That’s because I feel we have a day 29 dcl in Silver near June 17, and you’ll see why I think that this area (July 17ish) is the dcl area shortly. Silver actually has a bullish look to it, back above the 50sma.
.
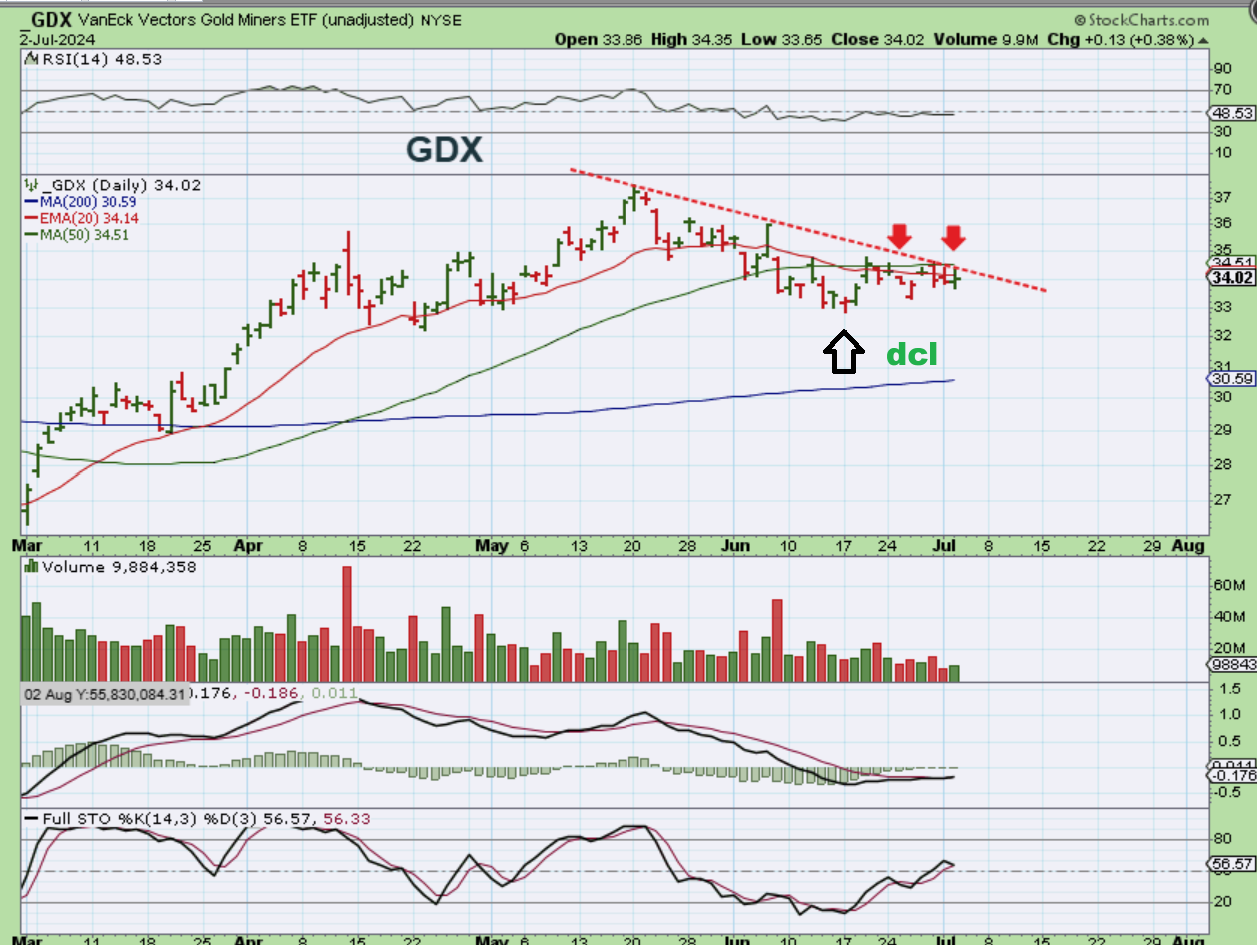
GDX – This would be day 10 of the 4th daily cycle. Look at JUNE 17 low point with the black arrow. I’ll show you why I’m calling that the DCL (and including Silver in that thought using the chart above). Can GDX get back above the 50sma? So far it hasn’t, but the MACD crossed up. This is starting to look like a normal dip into a dcl and then a stronger 4th daily cycle? If the USD is going to drop, that could happen.
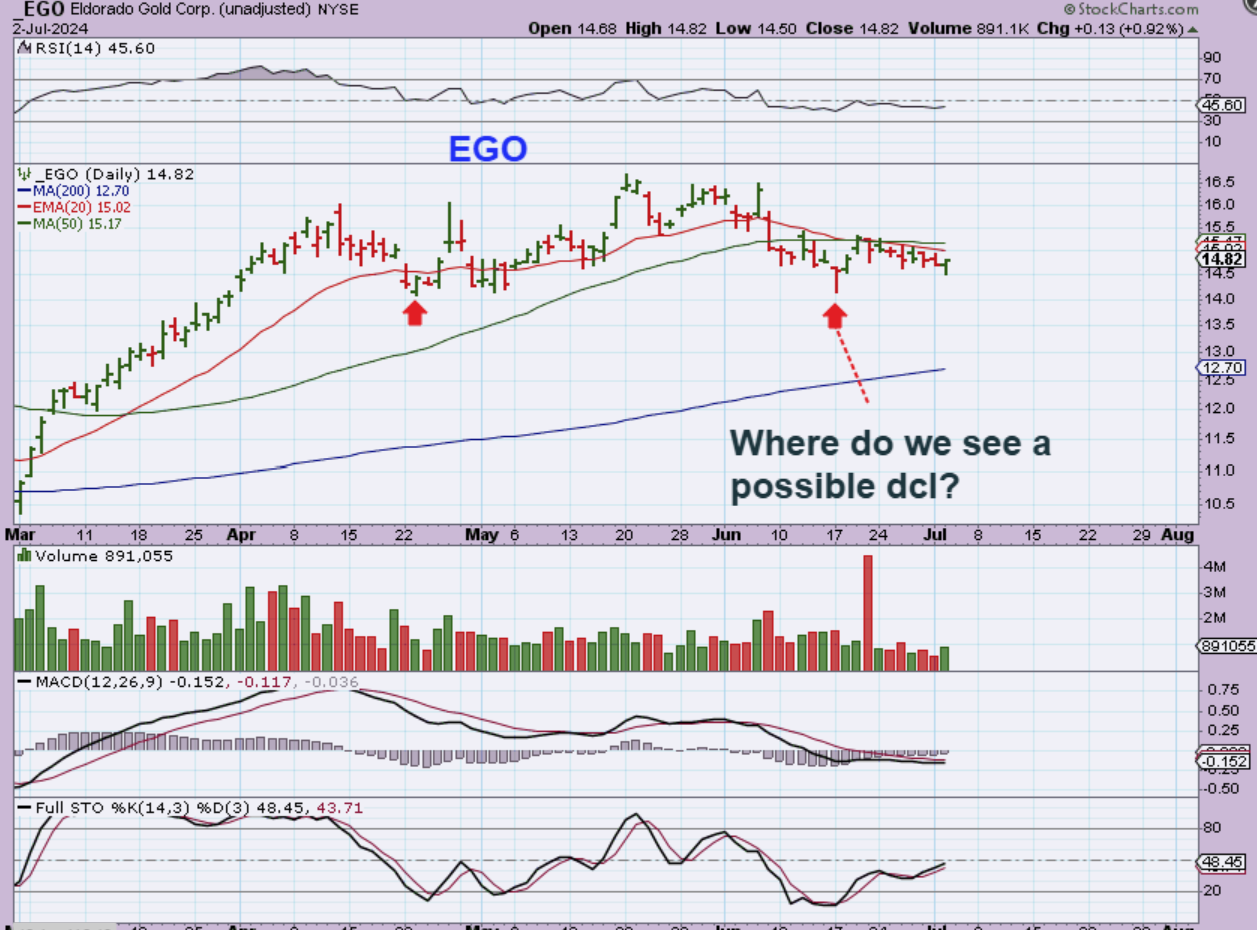
.EGO – When I look at some of the Miners like EGO, the low point looks more obvious. It was at June 17, so this would be day 10. Silver and GDX also looked to have lows at June 17.
.
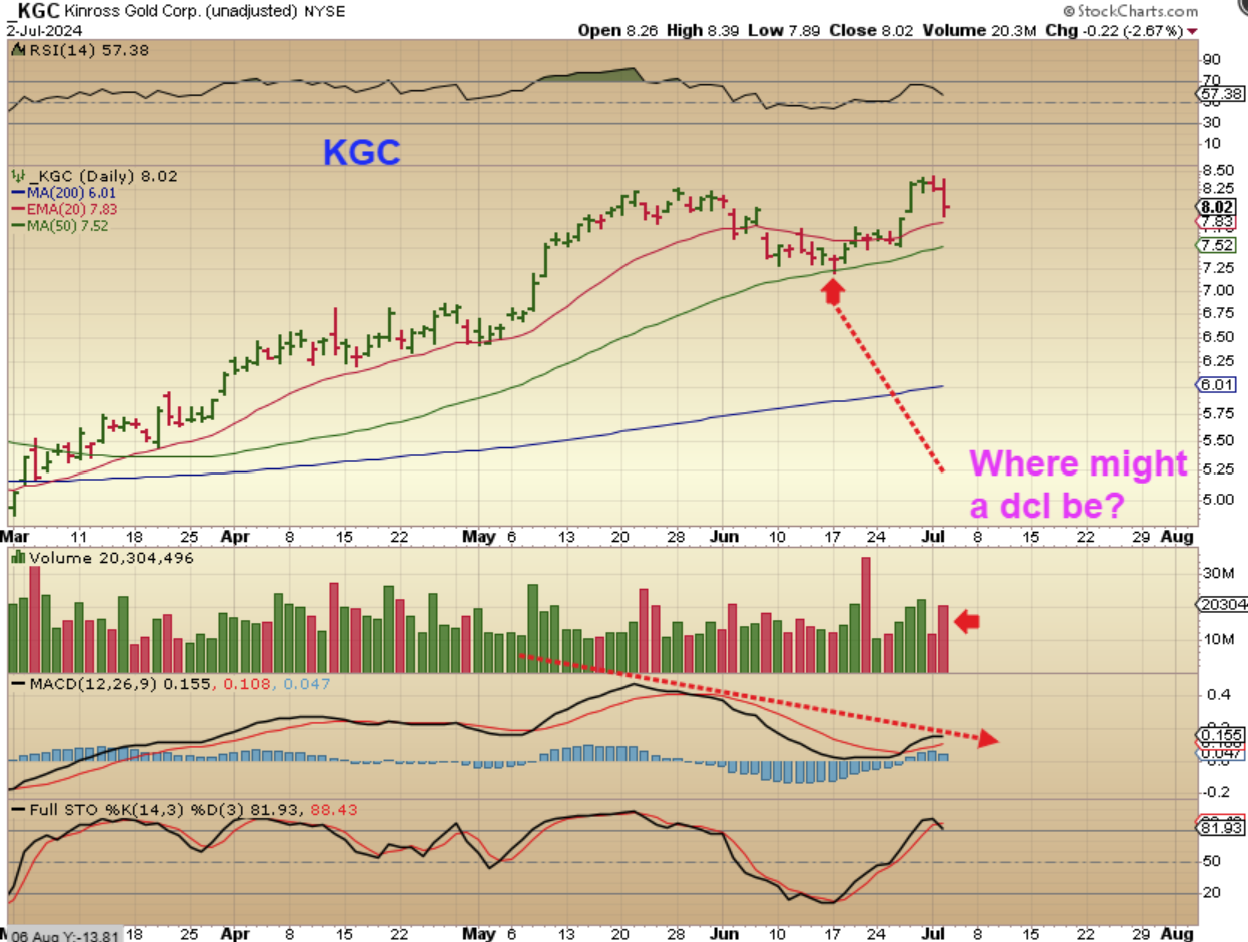
KGC – When I look at some of the Miners like KGC , and this low point looks quite obvious. It was at June 17, so this should be day 10.
.
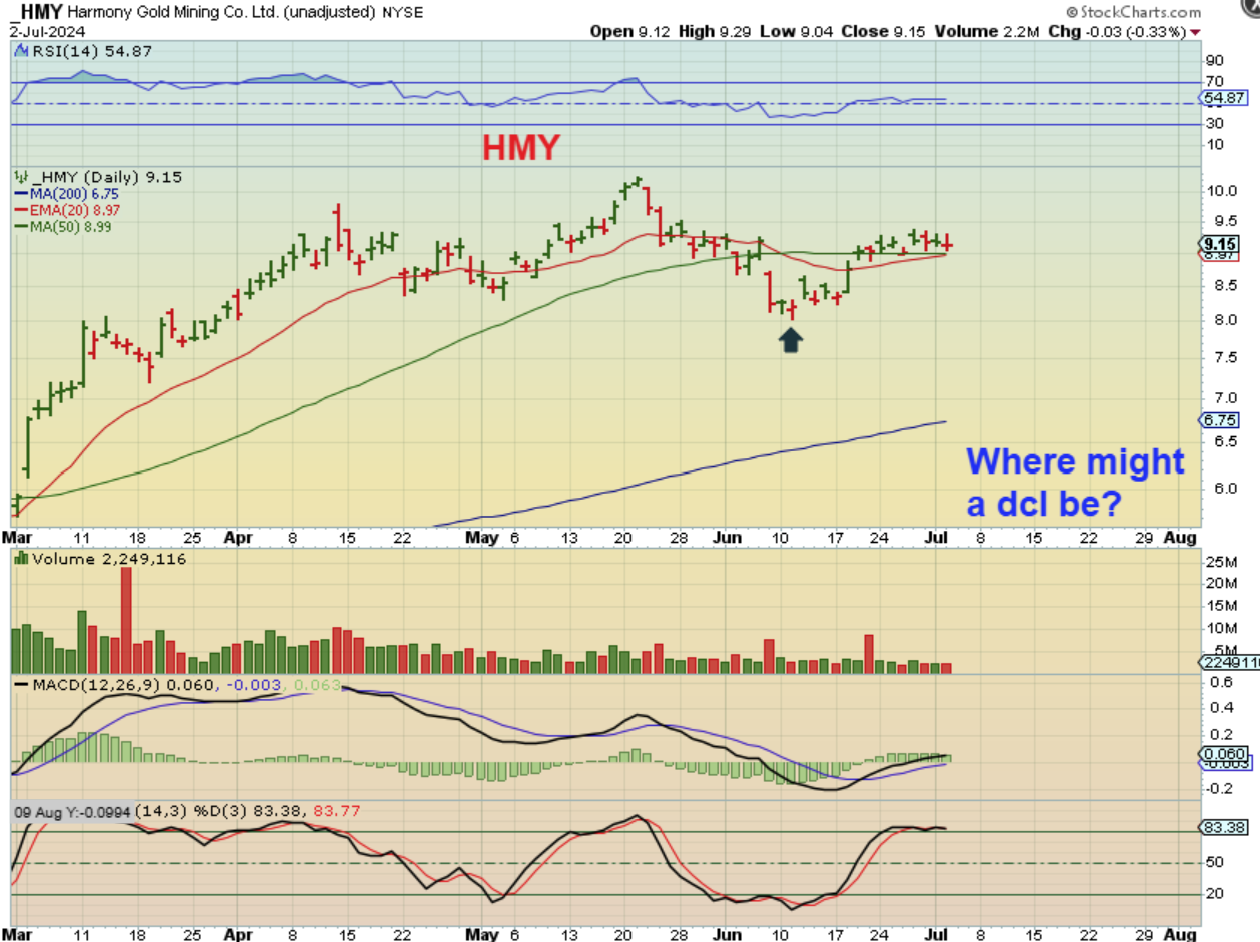
HMY – When I look at some of the Miners like HMY, the low point looks obvious here too, and it was 4 days before June 17. S0 that June 17th area is where I’d mark the dcl for the Precious Metals, and we’d be on day 10 of a 4th daily cycle.
..
So I feel that we have seen the dcl in the precious metals on or near June 17th, and that would put us on day 10ish of the 4th daily cycle. I would have expected this 4th daily cycle to ‘peak’ as Left Translated, but things feel like they are turning bullish near this dcl, especially with Silver. Eventually, I would have expected that in the 4th daily cycle, these will begin to get heavier and drop down into the next dcl (possible ICL) by ‘peaking’ Left Translated’, so we’ll have to see how this plays out. That may still happen, but let’s see what the data does today (especially the Fed Minutes). It has been bullish news for the precious metals, with a possible rate cut on the table for later in the year. Also the MACD crossed higher in the GDX yesterday as it crawls along under the 50sma? It almost looks like it could break out.
.
So Today we have Data that can move the markets in pre-market and then again especially in the afternoon with the Fed minutes being released. Keep that in mind and enjoy your Wednesday trading!
.
~ALEX
.
FROM TUESDAYS REPORT:
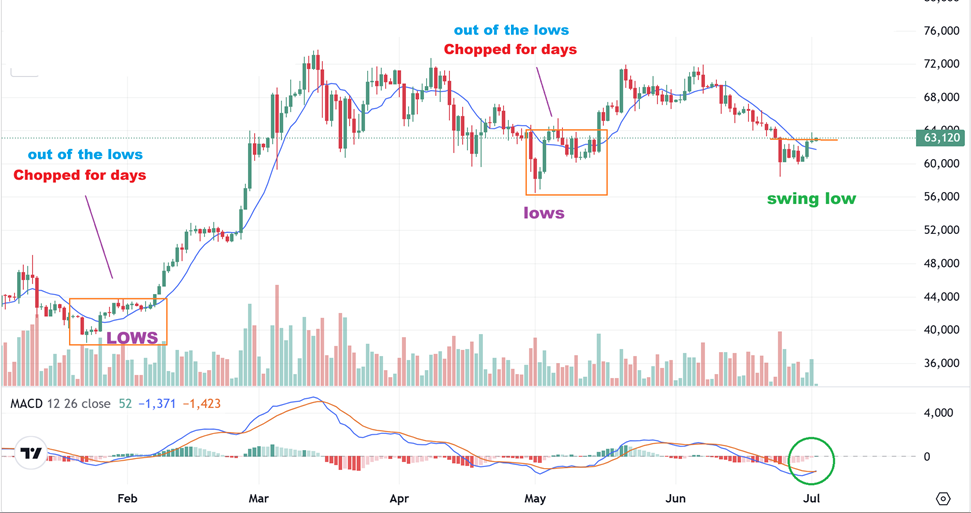
BITCOIN – Bitcoin did break above that 10sma and crypto stocks started to move higher ( or for several, continue higher). On this chart I just wanted to point out to you that
1. Bitcoin does not always run straight up out of the lows, like some may think.
2. Yes, it certainly can run straight up and leave everyone behind, but notice that at times, it got above the 10sma and then chopped sideways or lower for days. 7 of those candles equals a week, right? So I am seeing 2 weeks of chop at the lows in some cases.
3. My point? Don’t be surprised if Bitcoin stalls here, back tests the 10sma, or just takes off higher. It will do whatever it wants, but individual Crypto-related Miners have started to run before these lows, so they also can take turns running & stalling.
.
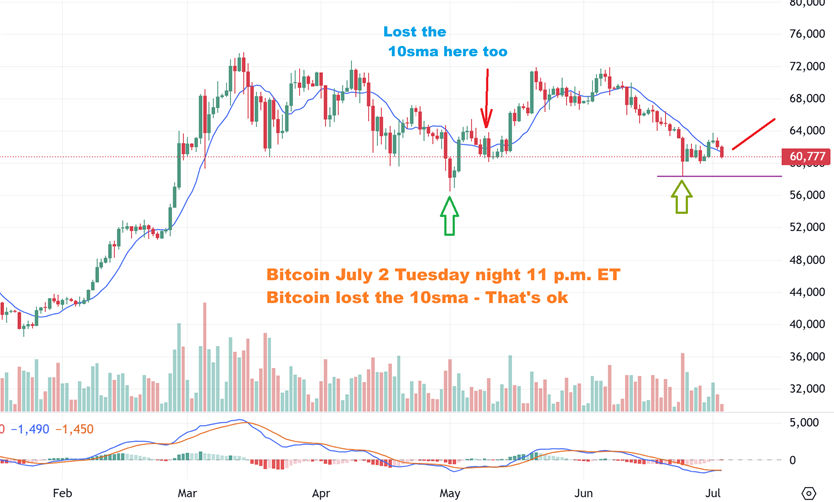
At 11 P.M. Bitcoin sold off to $60,700 and lost the 10 sma. We’ll see where it is in the morning when I release the report, but this is how I view the drop currently:
.
BITCOIN – Bitcoin was down on Tuesday, but then on Tuesday night it lost the 10 sma. I have seen that before, so I know that it happens and doesn’t necessarily hurt the set up. In fact, the last ICL gained and lost the 10sma too, so as of 11 p.m. on Tuesday, I’m not overly concerned. In fact, if the lows were taken out, it would be day 64, so a low would again be ‘imminent’, even if this broke down.
.
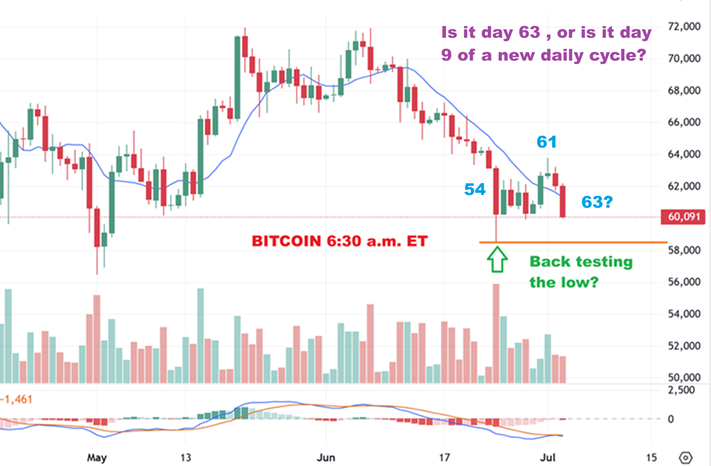
LIVE BITCOIN 6:30 am – Well here we go at 6:30 a.m. and Bitcoin continued to drop to about $60,000. If it back tests the lows and does not break the lows, we are on day 9 of a new daily cycle and day 54 was the dcl. IF THAT BREAKS, we are on day 63, but it should still bottom very soon.
.
Even with Bitcoin slightly down yesterday, some Crypto related stocks dropped, others continued higher AFTER OPENING RED.
.
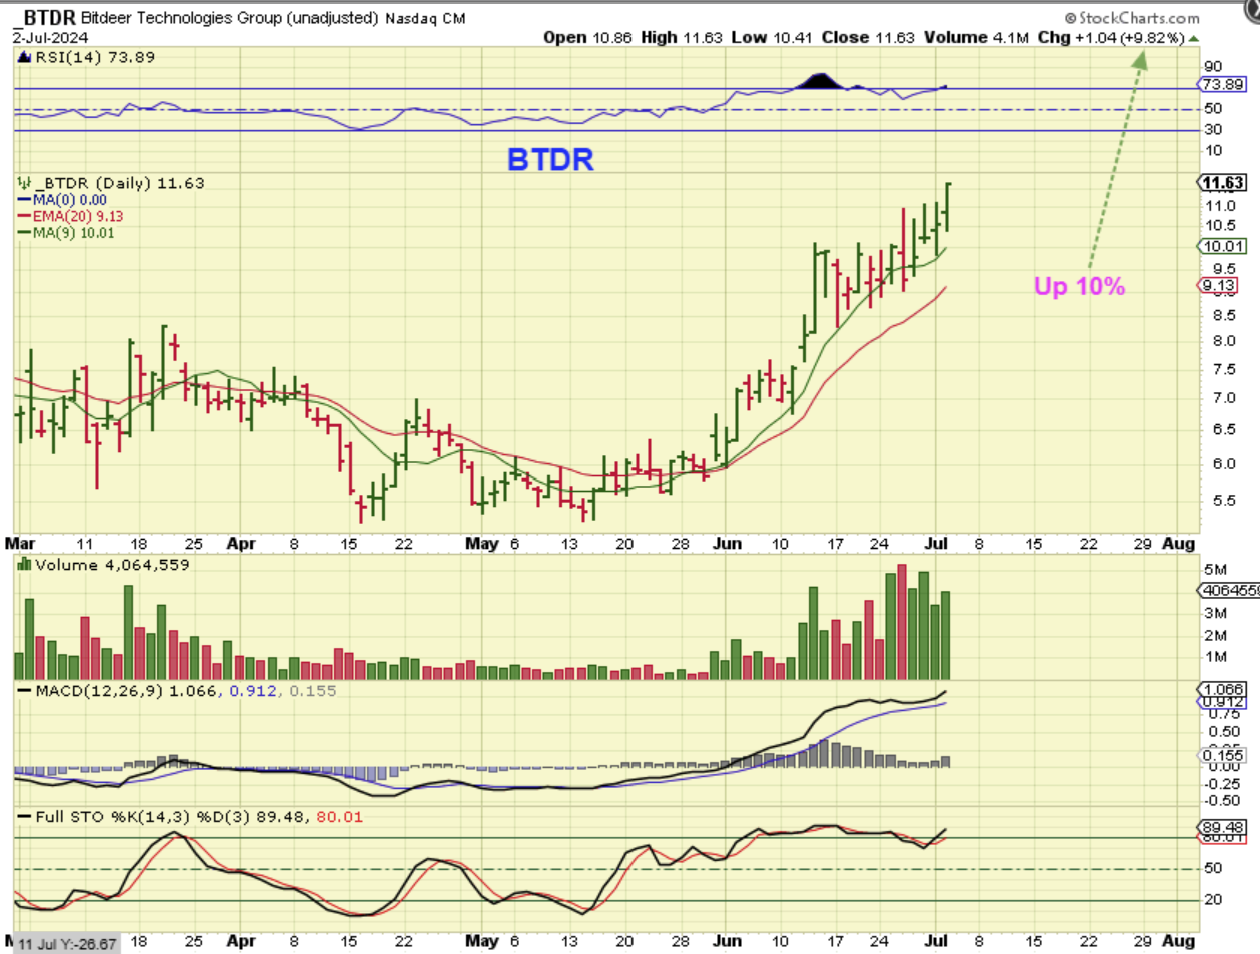
BTDR was red after the open and then recovered slowly all day long, eventually closing up almost 10%. Bitcoin was red.
.
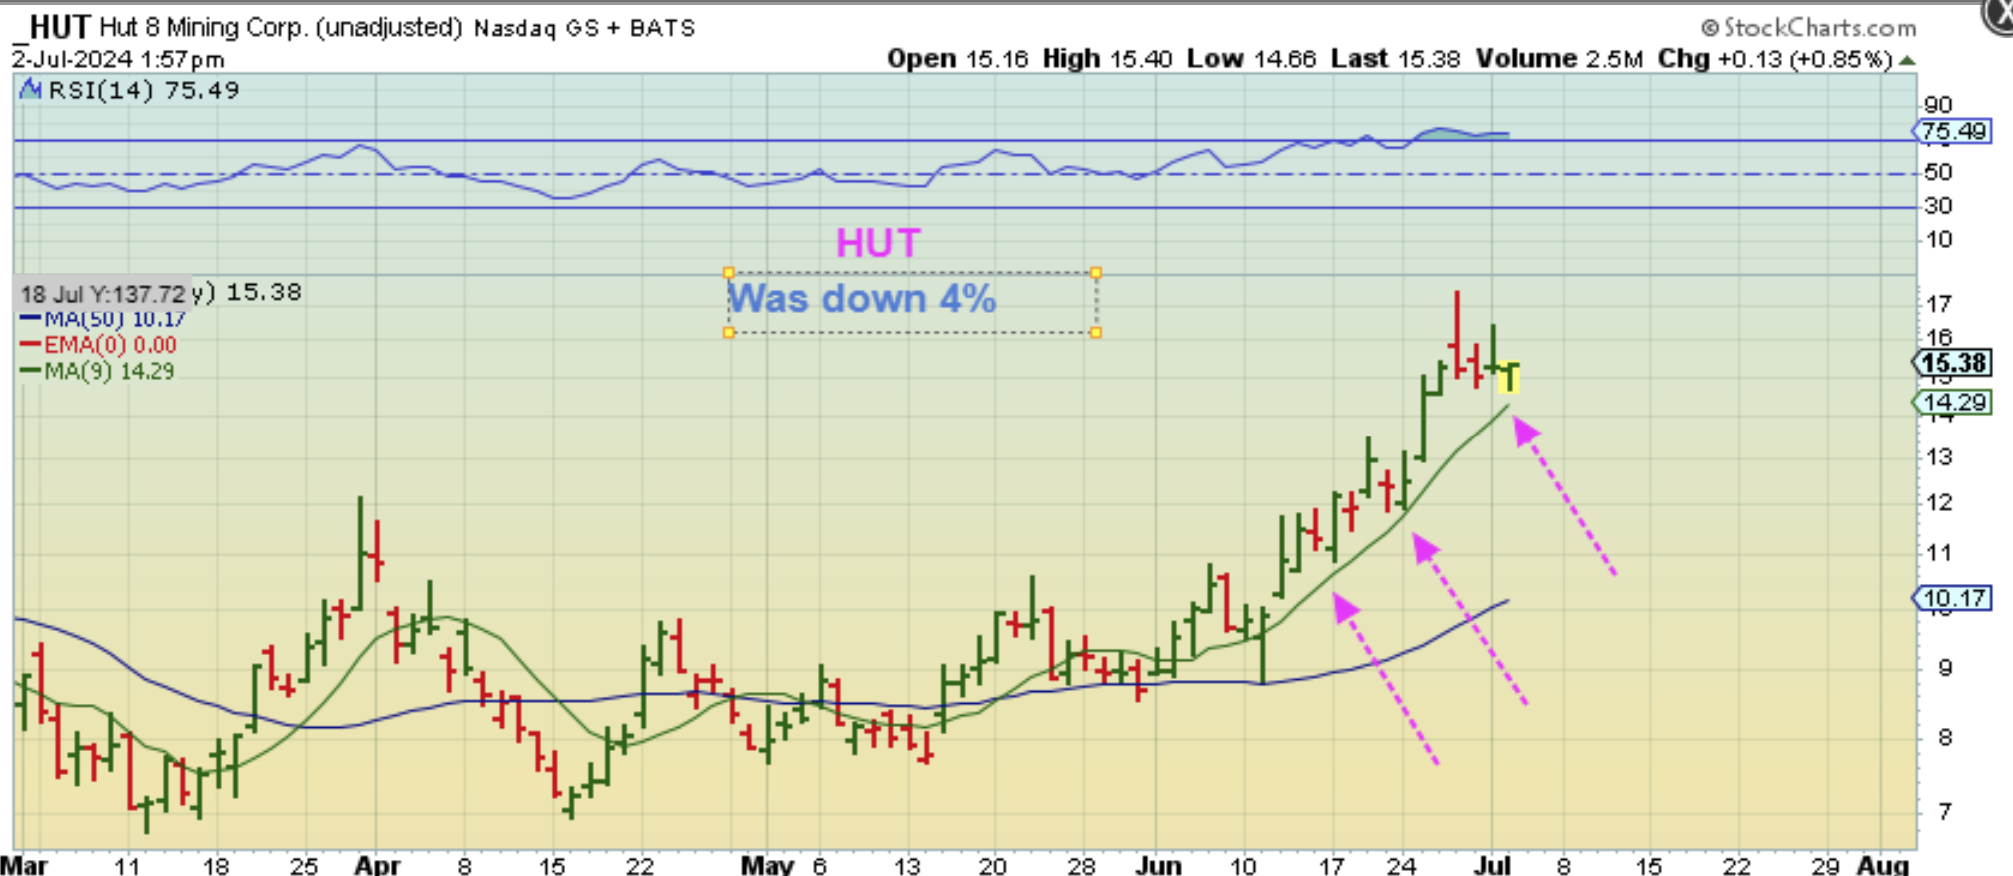
HUT dropped 4% and then returned to close green too.
.
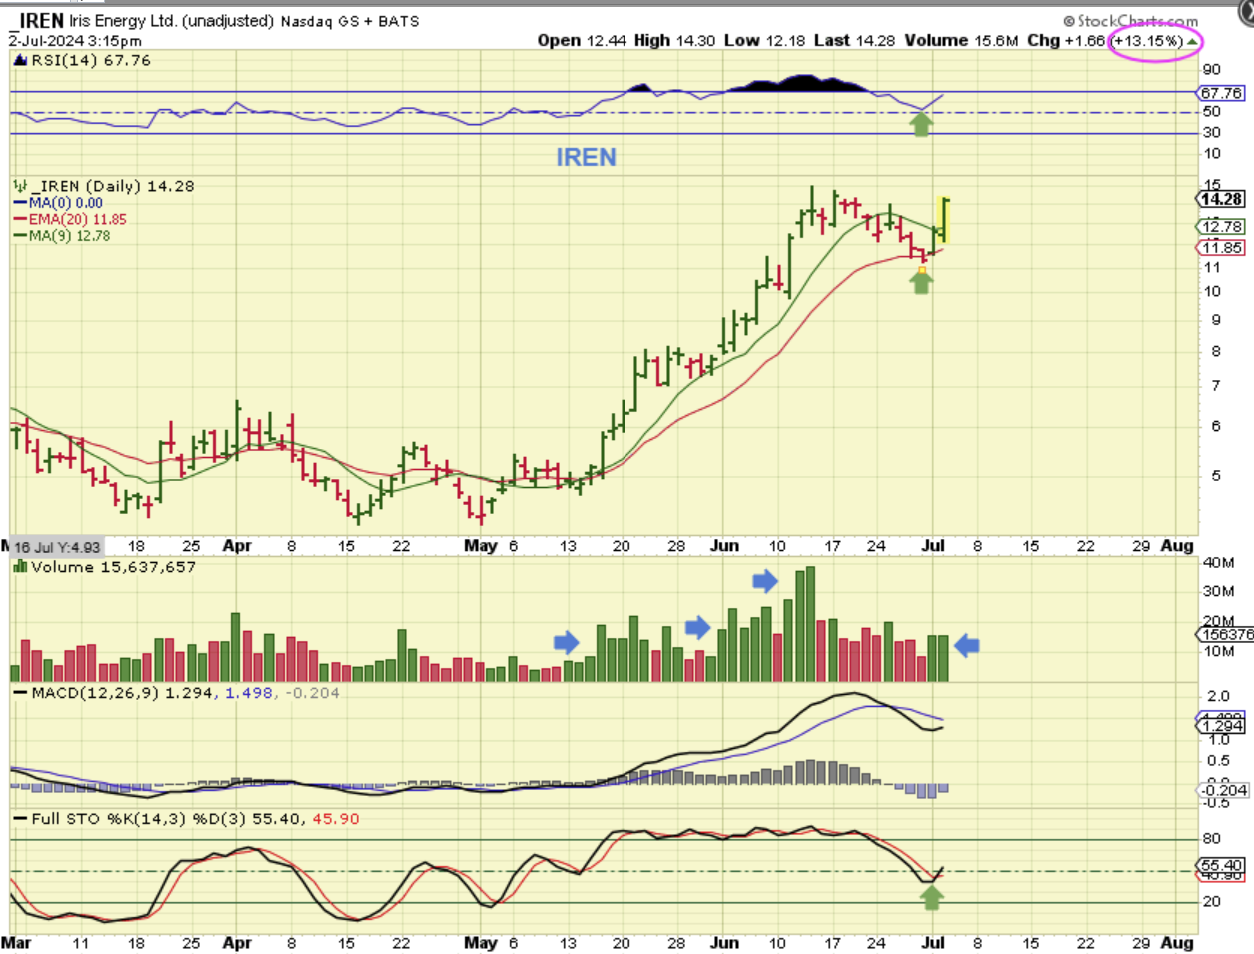
IREN was pointed out as having a reversal on Monday, and then it opened RED Tuesday, but it also started to run within the first hour and closed up 14% by the close.