Tuesday July 3rd – Slightly Choppy
.
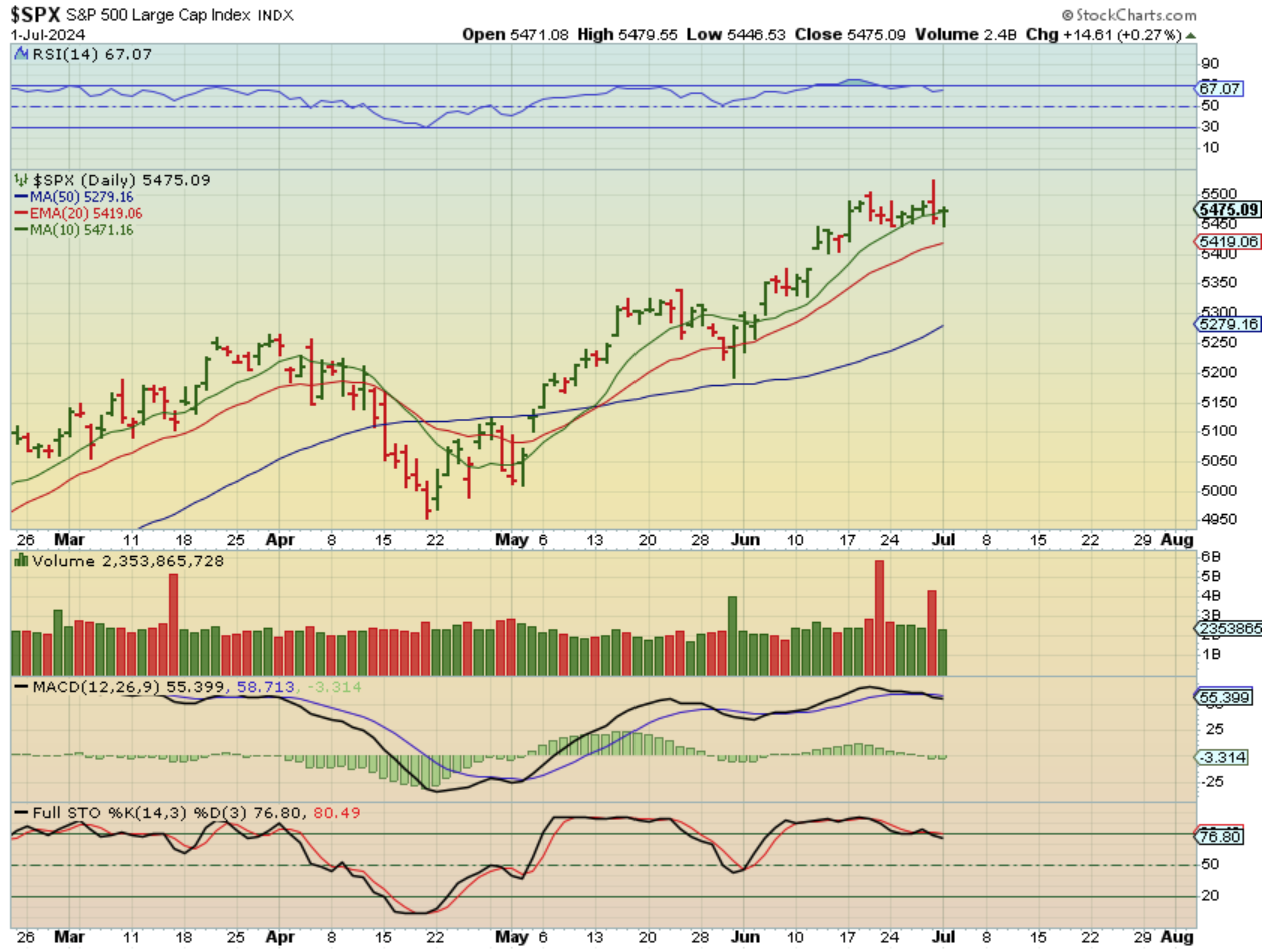
SPX – The General Markets remain strong so far, but are chopping sideways and a dcl dip is due. This does look a little like that sideways move that gradually dipped into day 29 too.
.
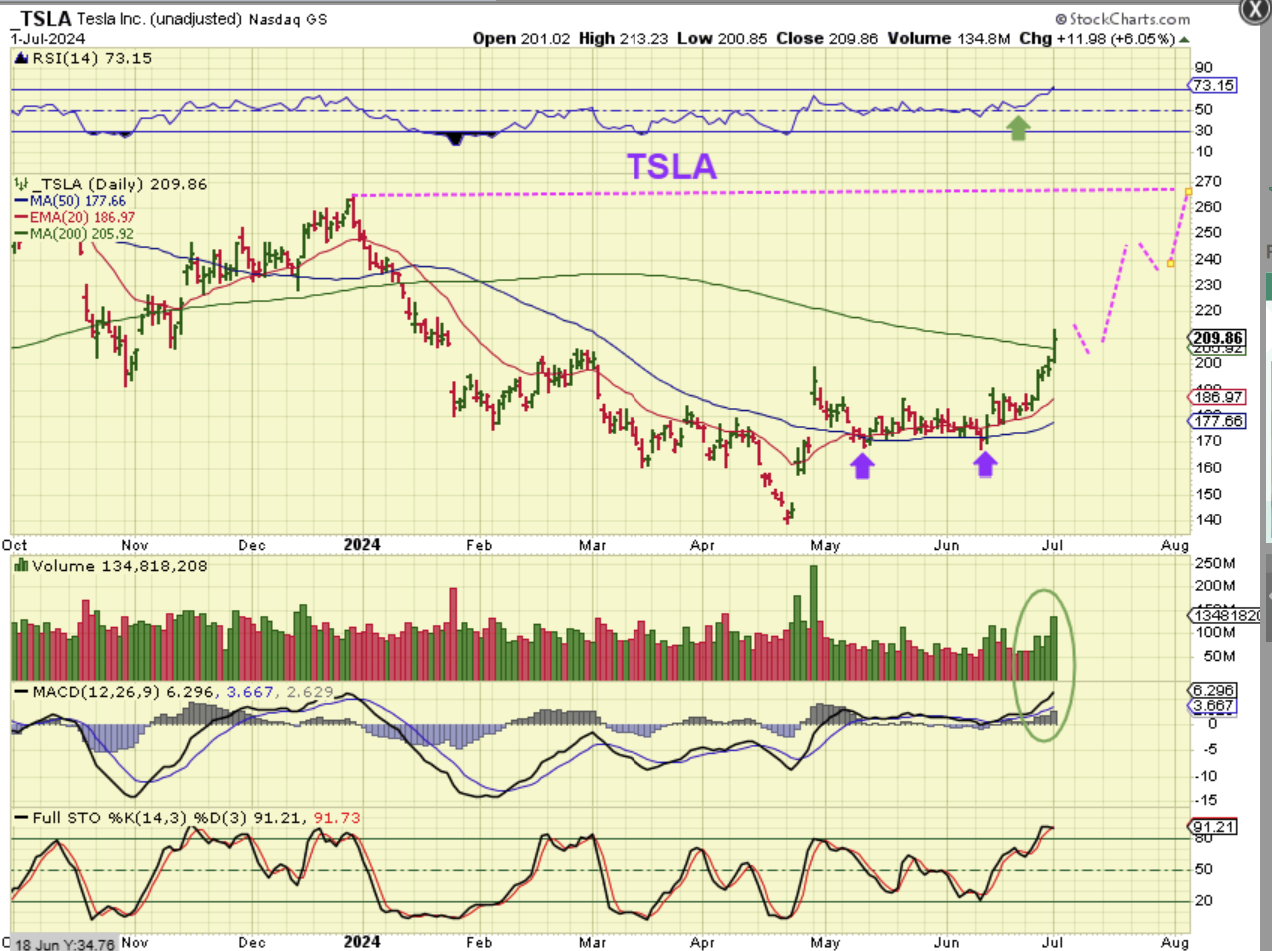
TSLA – I just wanted to show you the bullish set up on TSLA, as it broke through the 200sma. You may recall that it sold off quite sharply this year January into April, based out in May, but it broke out last week from that base and is now running with volume again. Buy it at the 200sma or buy the dip.
.
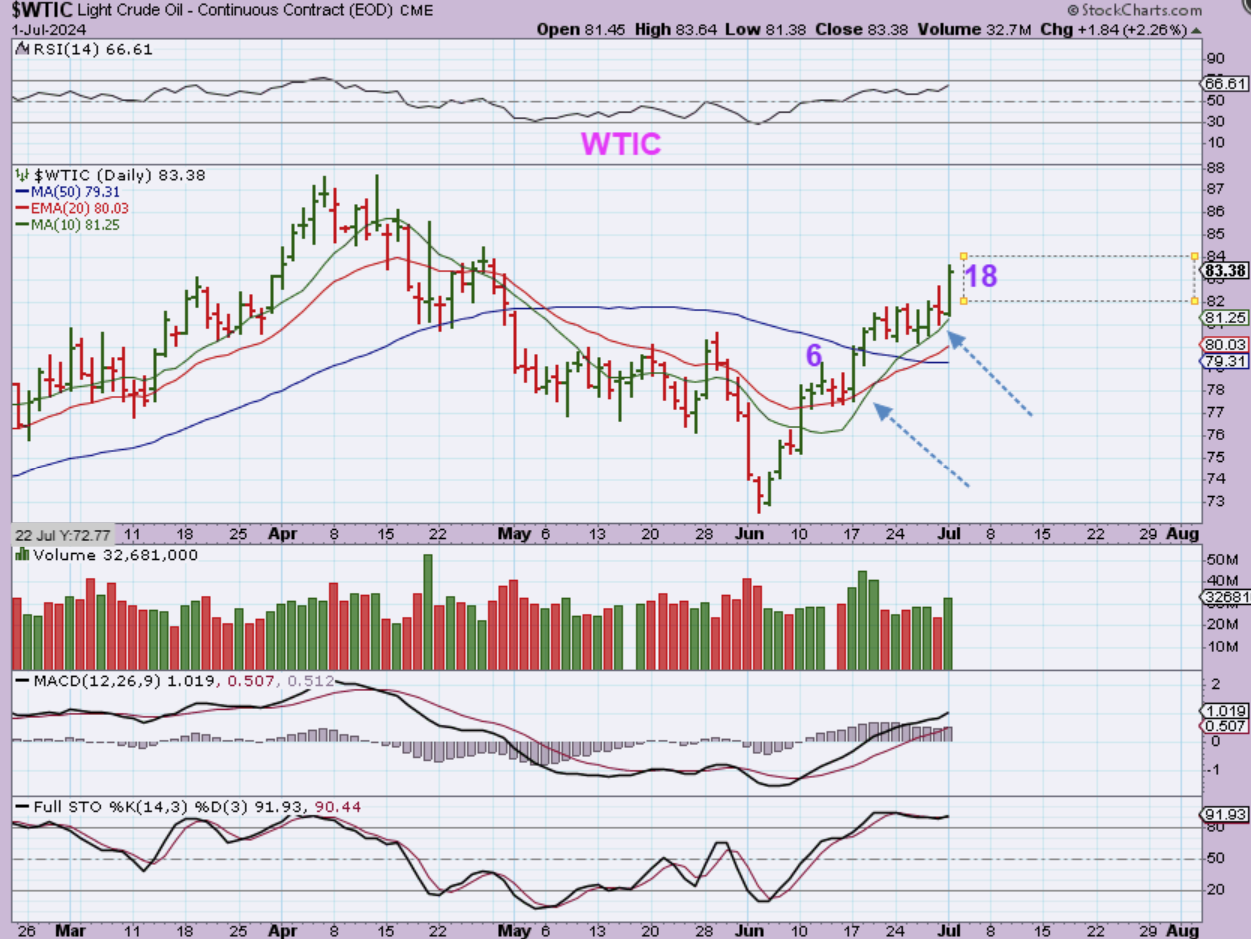
WTIC – Oil surged again on day 18 as it climbs that 10 sma. It has its down days, but they’ve only lasted for 1 day at a time.
.
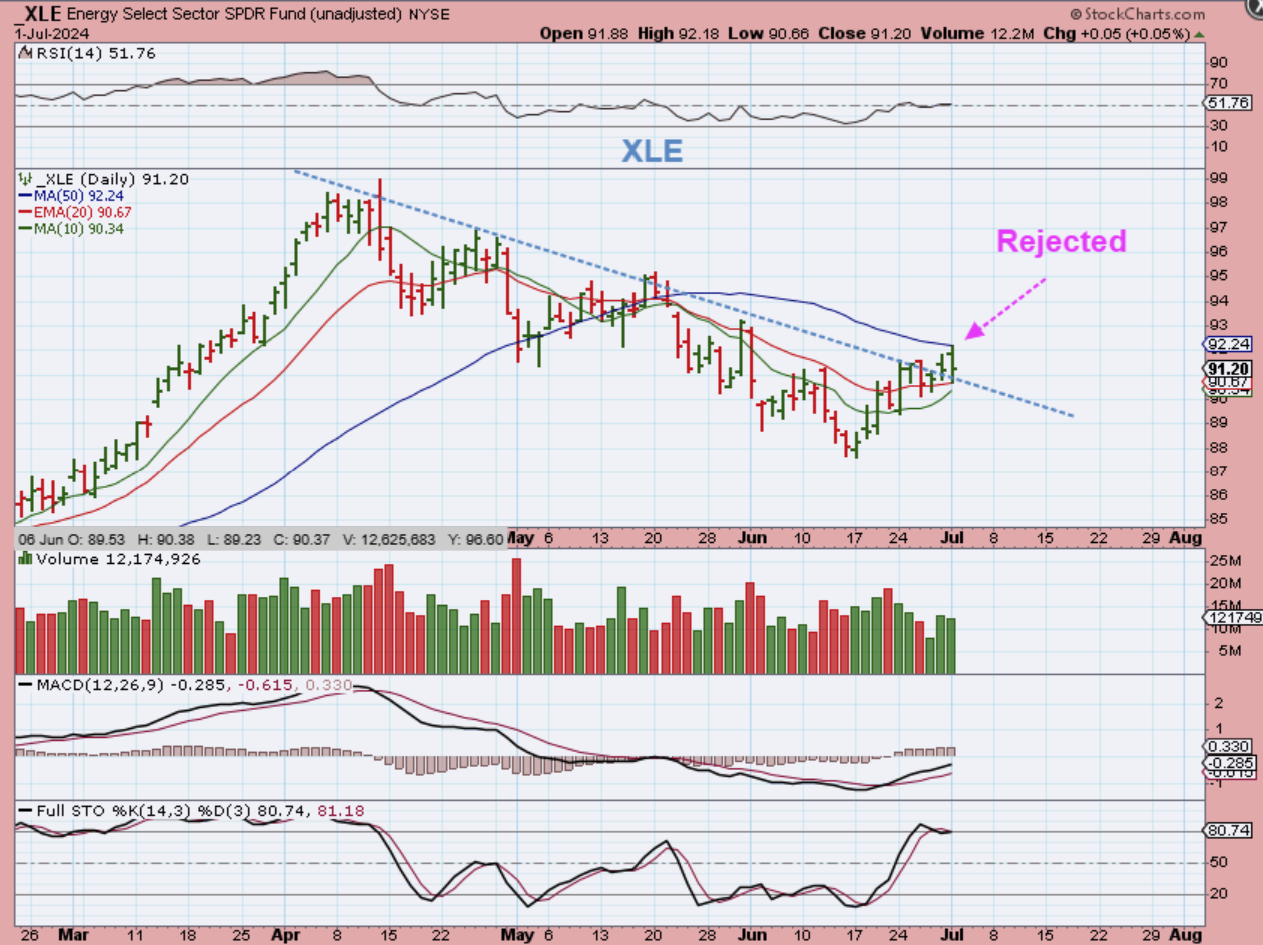
THE XLE was held back at the 50sma, even with Oils nice surge. It has broken the downtrend though, and with Oil running, the oil stocks should move higher.
.
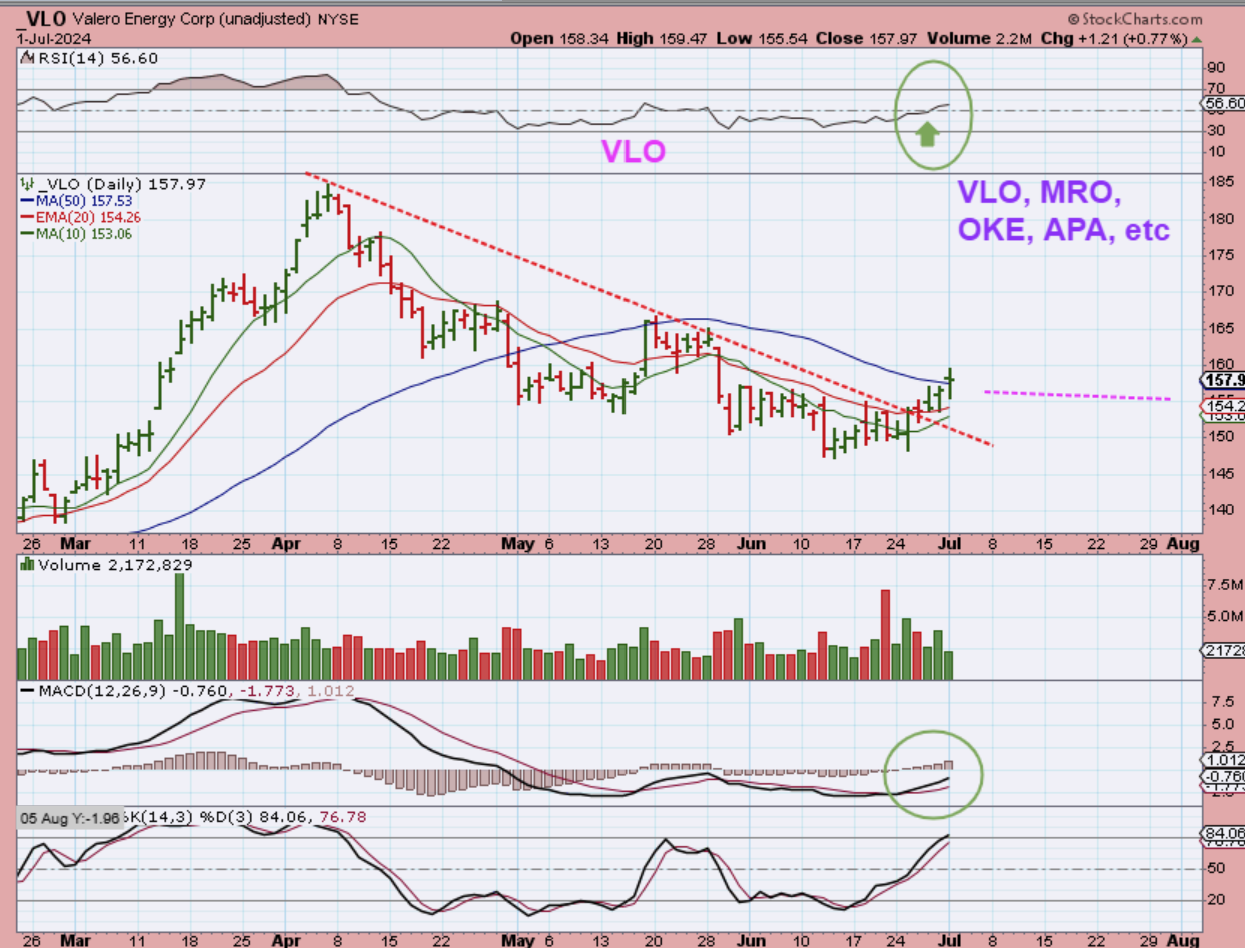
VLO, for example, chopped sideways at the lows as Oil raced higher, but it is now pushing above the 50sma. Note: OKE is one of the better looking charts, since it sold off mildly. I have mentioned VLO, MRO, OKE, NOG, and others.
.
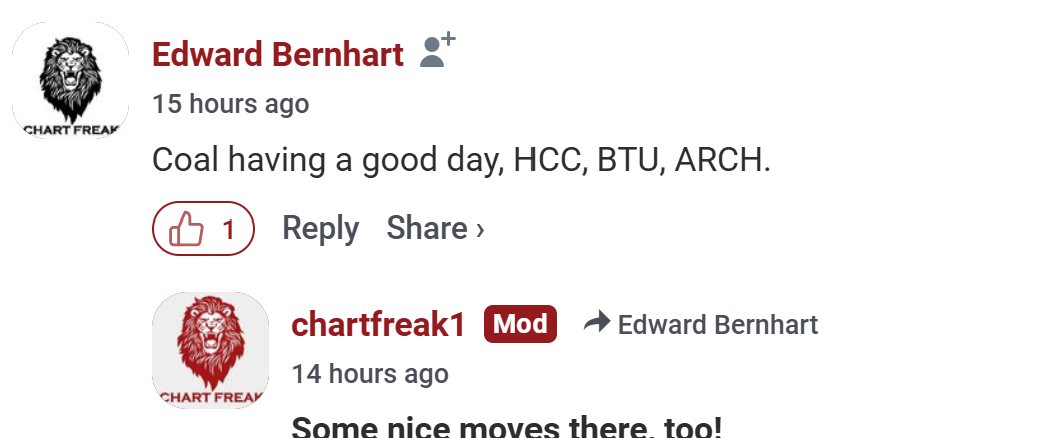
I wanted to point out what one of our readers mentioned yesterday, because the charts really do look good. One warning is that if you go back to a 1 year chart, these are often VERY CHOPPY.
Thanks Ed!
.
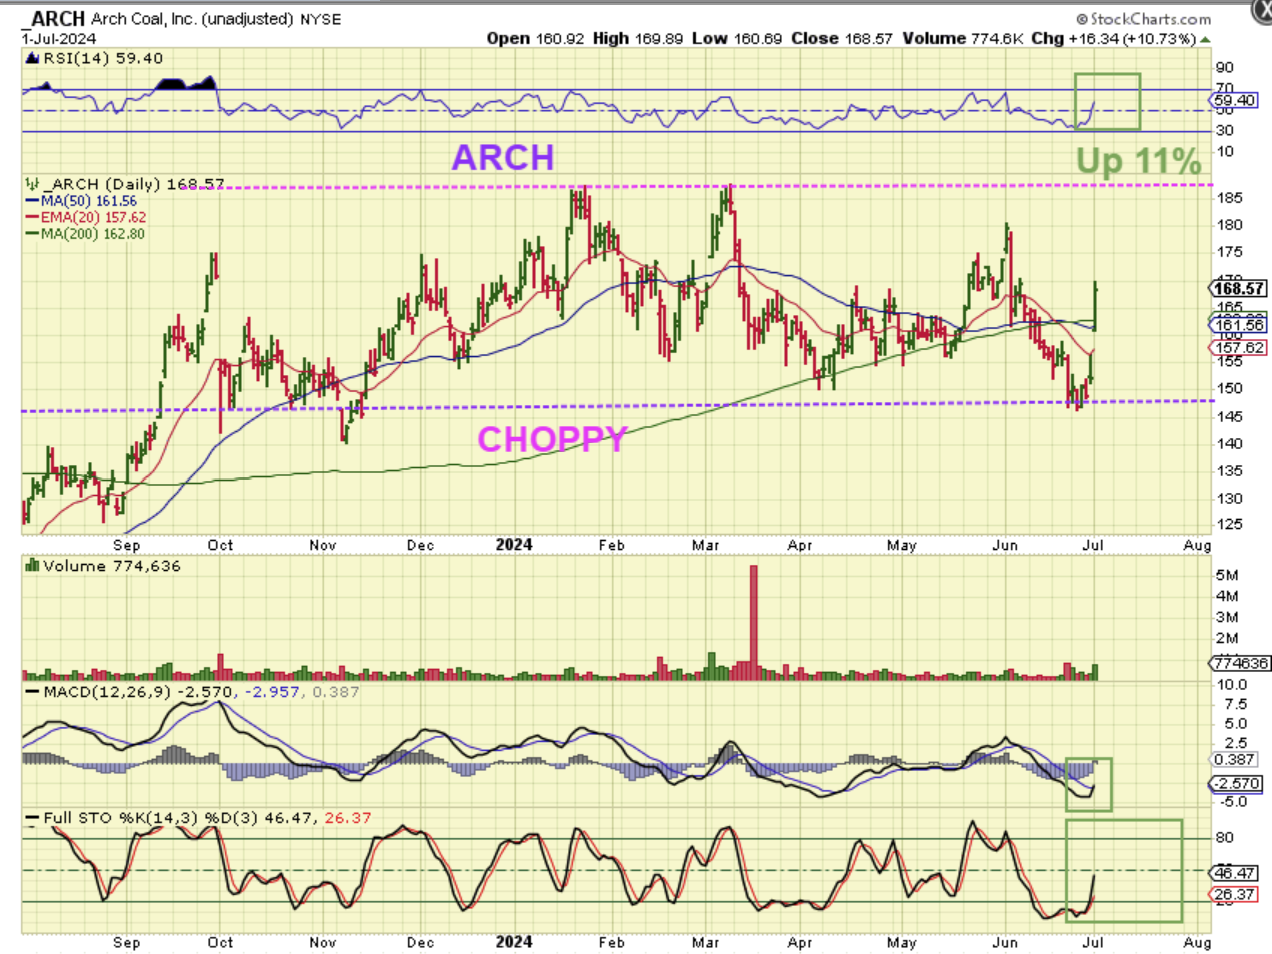
ARCH – You can see a very large trading range, but one day it could break out and run. For now, the 3 stocks that Ed mentioned have had 2 strong days in a row out of the low, yet remain oversold.
.
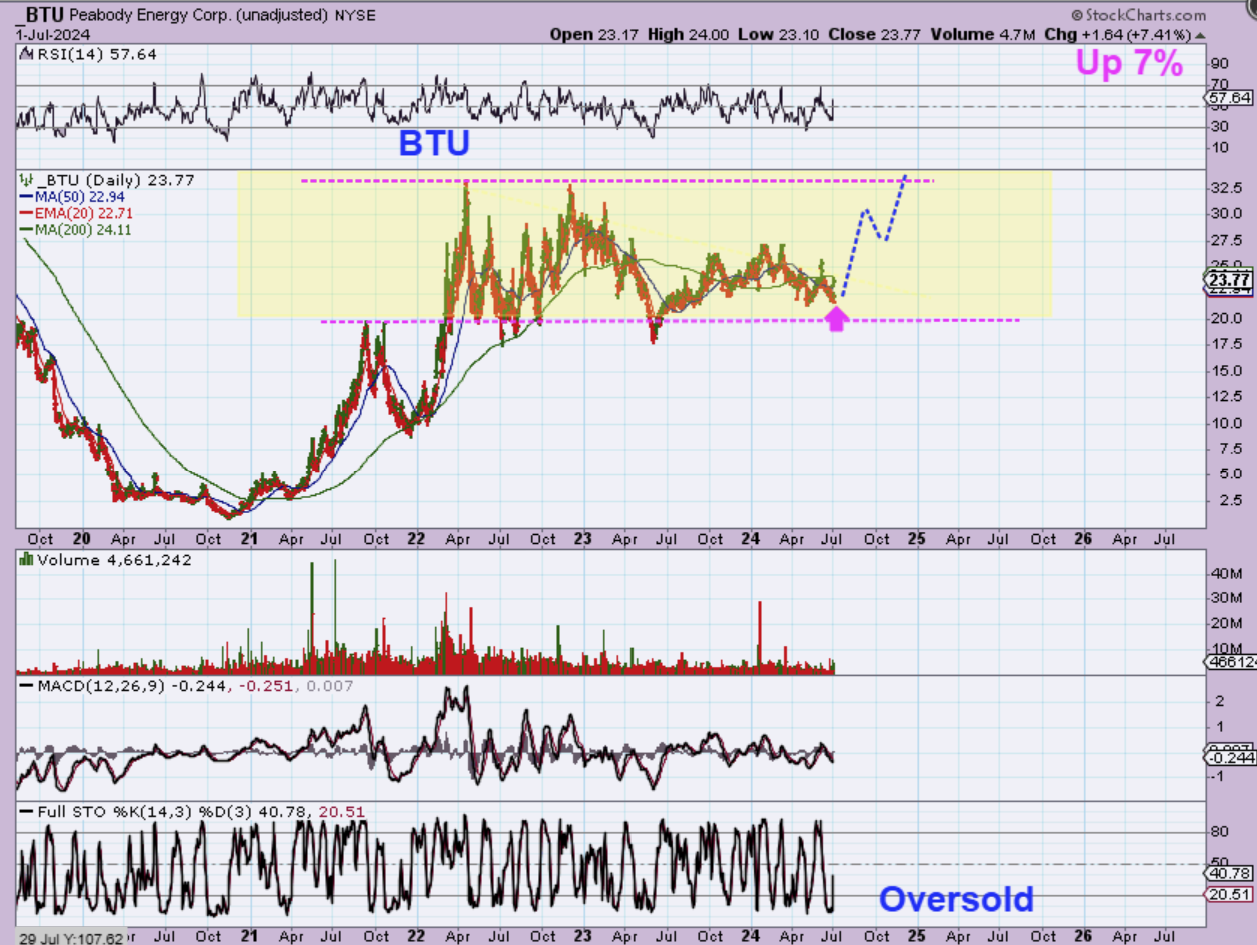
BTU – You can see why I said that these are choppy, but they could break out and run one day. They all rallied after Covid 2020, but then became extremely choppy digesting huge gains for the last 2 years. They are at their consolidation lows, are oversold, and had 2 good days out of the lows. It looks like $27.50 next, and then possibly $33 for BTU.
.
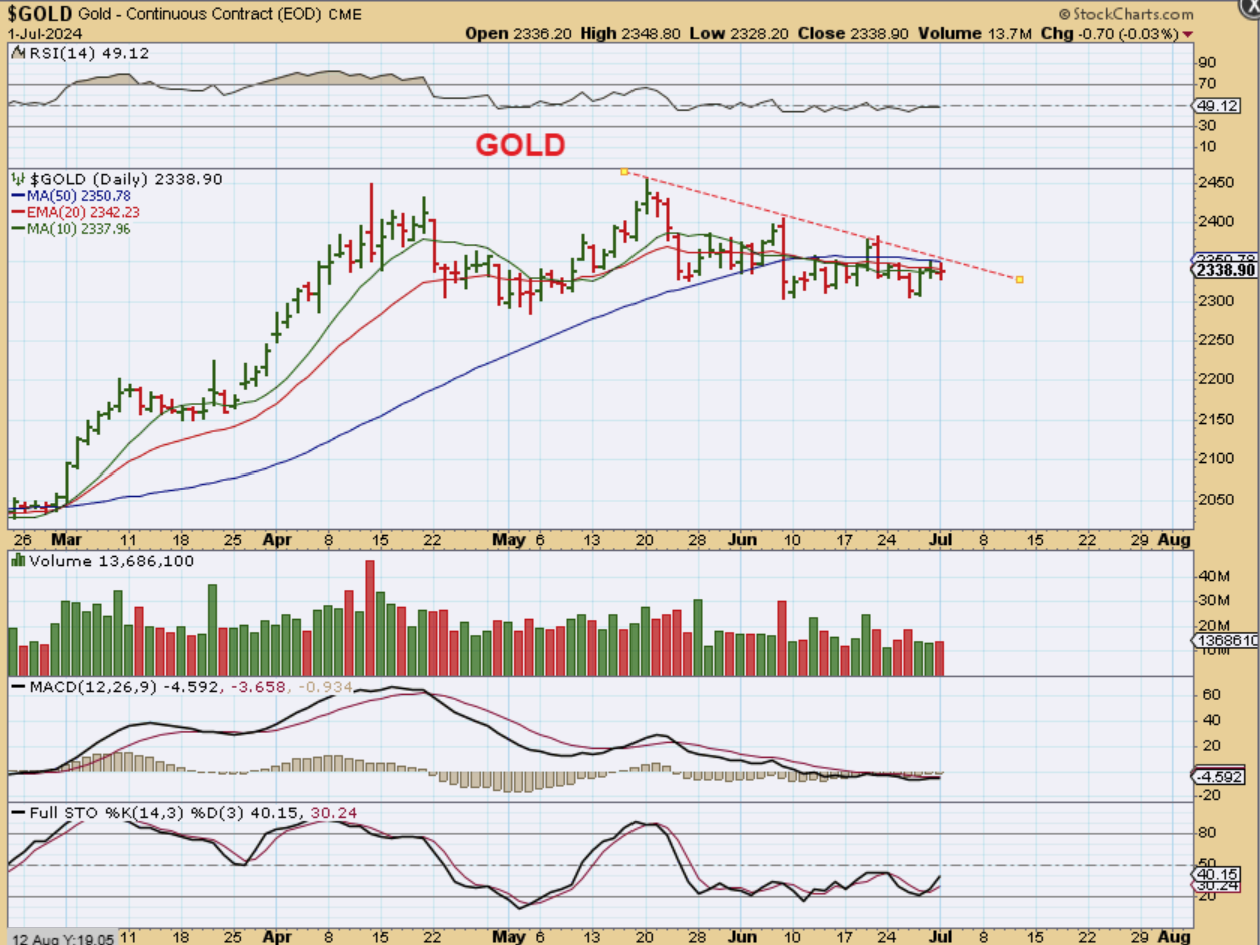
GOLD has been chopping sideways and holding up well in the 4th quarter. If that last large slam down day was a dcl, then we’d be on day 15 with a day 9 peak (L.T. so far) of a 4th daily cycle.
.
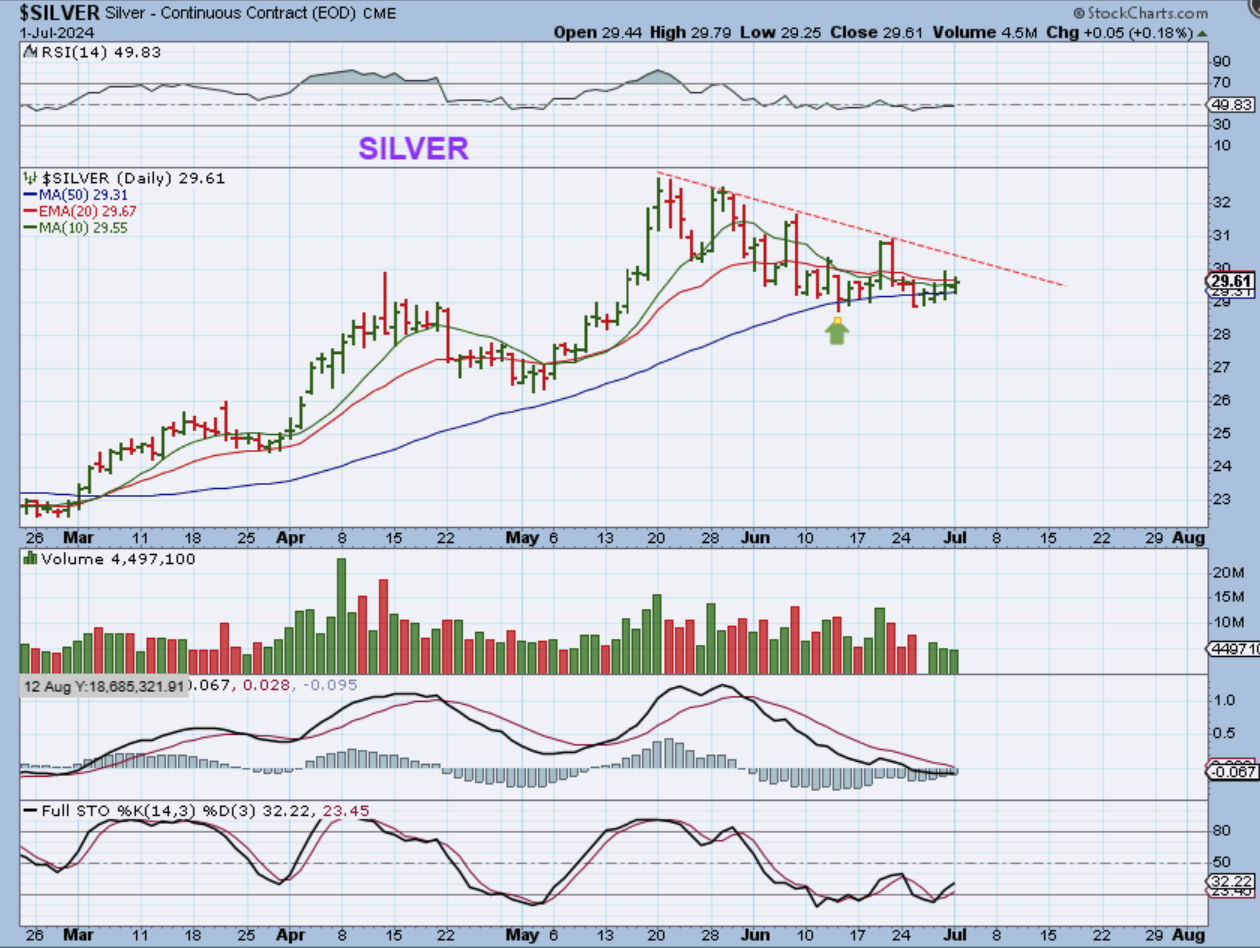
SILVER – Silver continues to bounce around and along the 50sma. This one looks like day 11 with a day 5 peak. I know that these look strong, but it is earlier in the daily cycle. As that daily cycle gets older, if these can’t Pop and Run, they will get heavier and heavier (that is the way I view it).
.
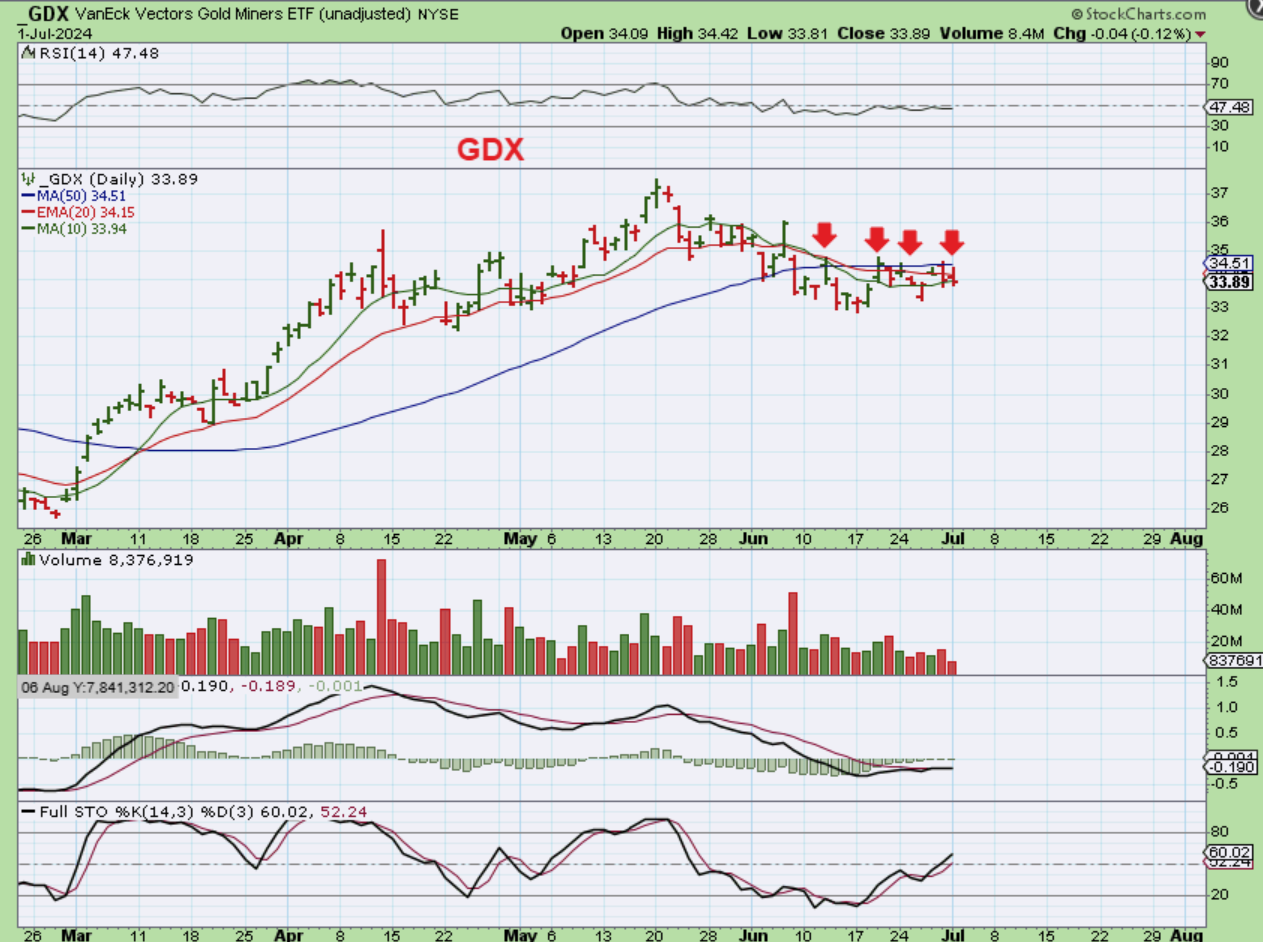
GDX – The Miners are also chopping along under the 50sma. Sometimes we see price chopping along to build energy for a breakout, but this is a 4th daily cycle and likely it is too weak to break out without a pullback first.
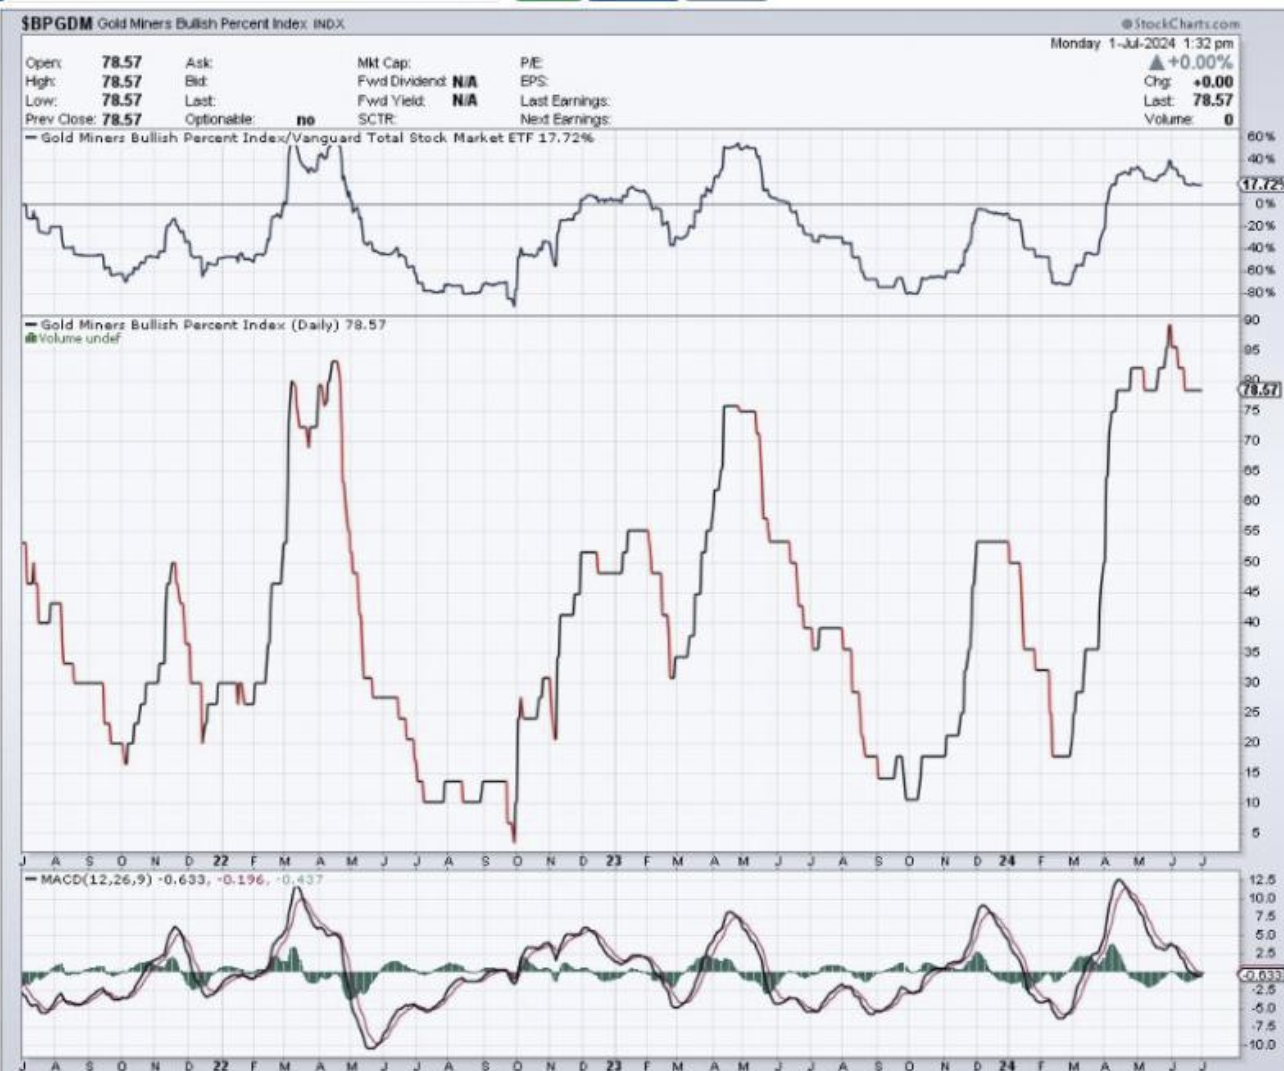
Yesterday Rob posted a chart that I usually look at after a strong sell off into an ICL ($BPGDM), because it can show weakness in Miners at an ICL and it kind of shows me where sentiment probably is too. In the past, when it is at the lows near 15 or less, it can be time for an ICL. So why did Rob post this?
.
If we were looking at the BPGDM and trying to see how close we are to an ICL, this would not look like good news, because the recent selling has been mild and the BPGDM is still up toward the highs. So does this show that an ICL cannot be close and we will sell off for months? With that I will say this:
1. The selling has been mild in this bull phase, so I would expect higher BPGDM numbers
2. We are still early in the 4th daily cycle, so we COULD suddenly sell off more sharply and then these numbers would drop. Drop how much though?
3. The question is, drop how far? Is it really necessary to get below say 15, to identify an ICL. No it isn’t, in a strong bull run. Let me show you something…
.
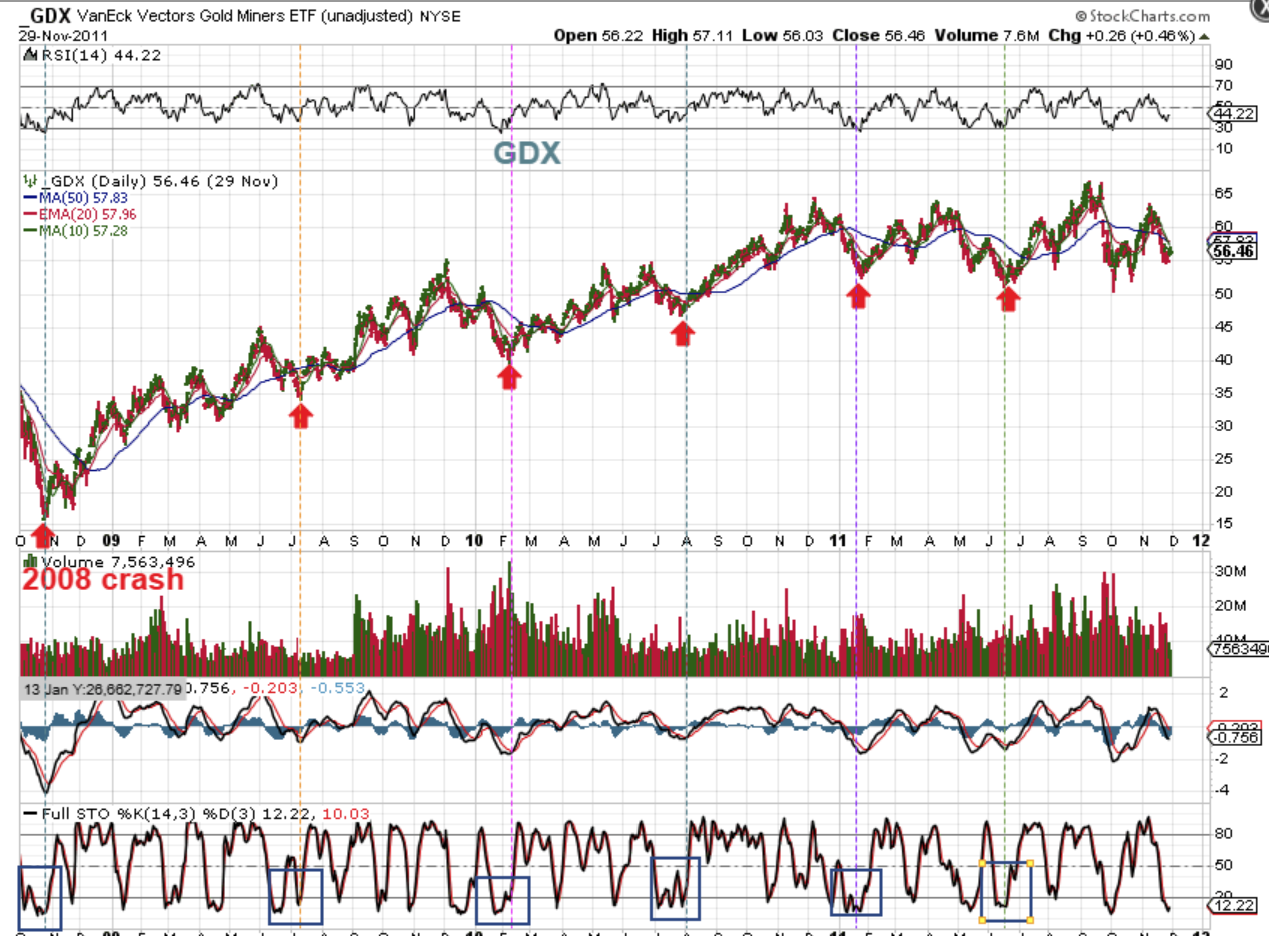
GDX had a strong or steady bull run coming out of the 2008 crash lows. That bull run lasted for years
.
Mild ICL drops can be seen at the Red arrows, and they come ‘Roughly; 6-7 months ahead of the last ICL. They can stretch a little, they can shorten too. This first arrow was 8 months, but MAYBE it was 4 & 4 months, but my point is that we are going to look at the BPGDM for this time to see what it looked like DURING THIS STRONGER BULL. This way, We will compare apples to apples, instead of a Bear markets to a Bull markets. We will look at 2008 to 2012, and we see 5 or 6 ICLs on this chart.
.
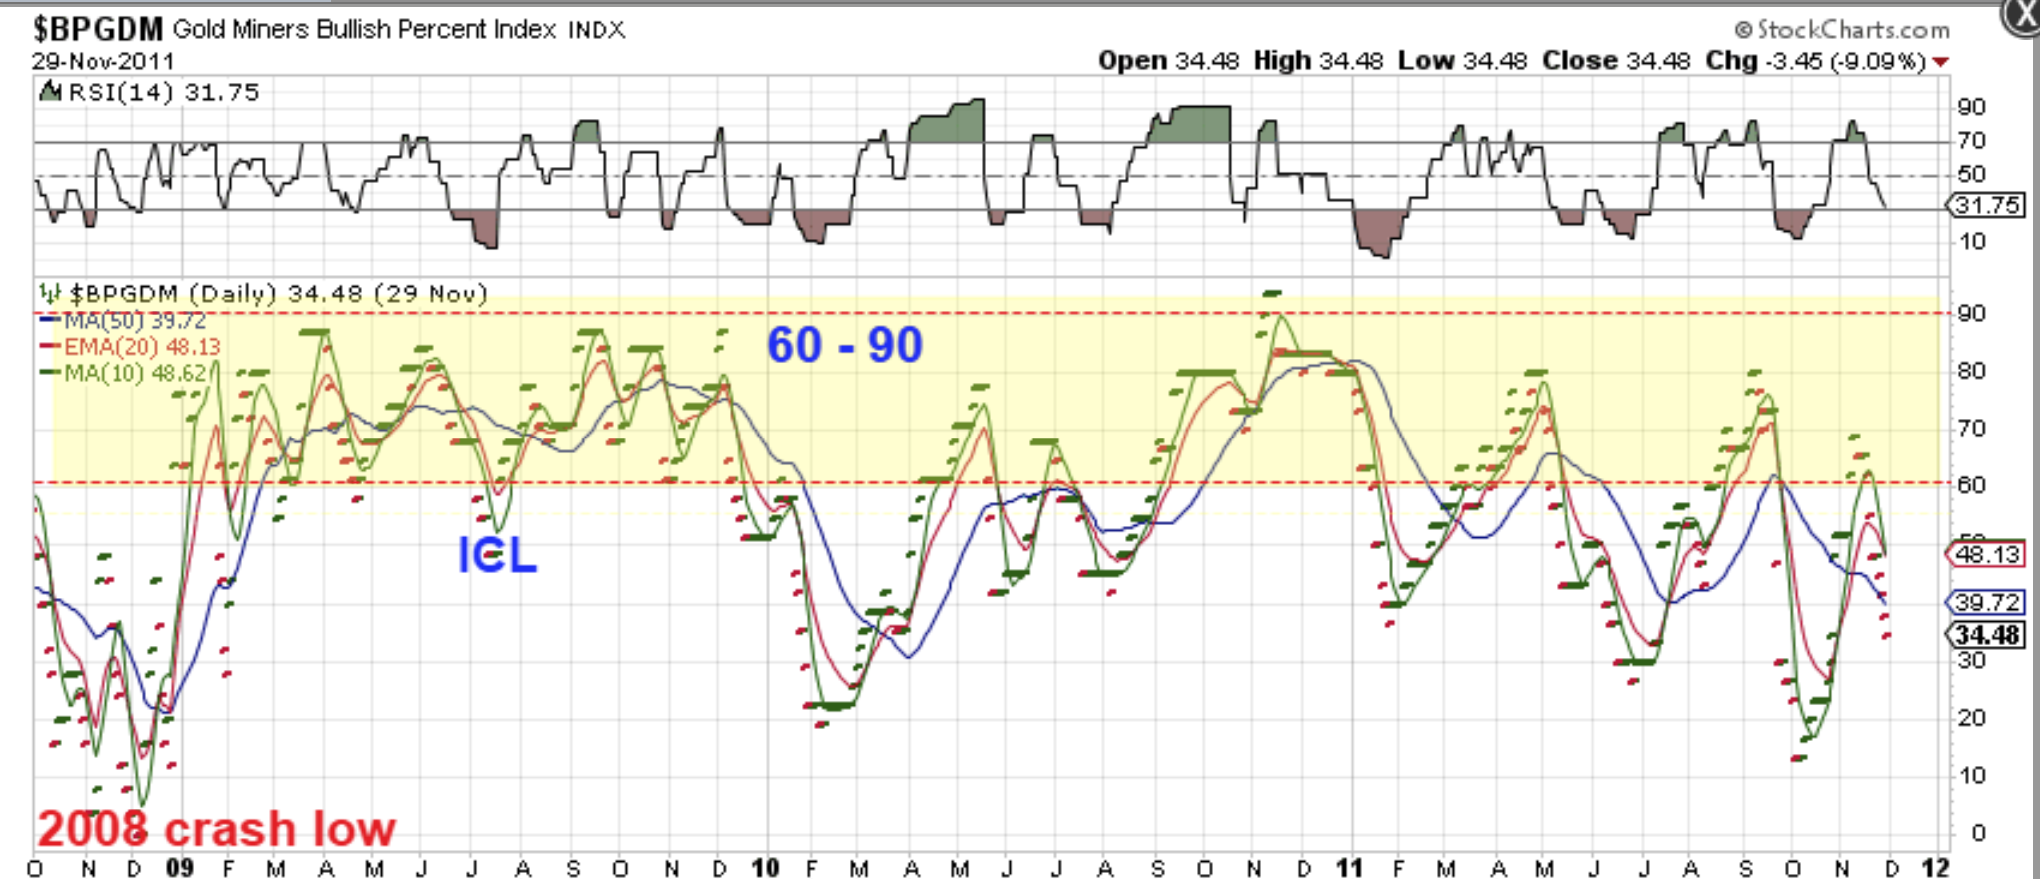
BPGDM – Now with this 3-4 year span, do you see 6 or 7 dips down under 15 , to identify those ICLs? No. In the 3-4 year span, it tagged 20 twice, but other ICLs were high up.
In 1 year, We only dropped to 60 (in 2009) seen using this yellow box. Then one sharp dip to 20 in 2010, then 48 was tagged a few times over the next year plus. Then BPGDM started to swing lower after 2 years of the 2008-2012 rally. So my point? This current ICL could dip to 60 quickly in a 4th or 5th daily cycle and that may be all that we see.
.
So the General Markets are chopping sideways as I anticipate a dip into a DCL. It could be a mild dip. Oil is strong and Oil stocks may be finally starting to follow. Gold, Silver, and the Miners churn sideways, but in a 4th daily cycle, I would expect a dip lower soon, rather than a sudden sign of strength to breakout higher. They say ‘Never Short a bull market’, and this is the reason why. They can chop and pop and frustrate your short position, until they finally dip lower. Bitcoin has signs of bottoming, and I have been discussing that process for weeks, so I will cover that below. Enjoy your Tuesday trading!
.
~ALEX
.
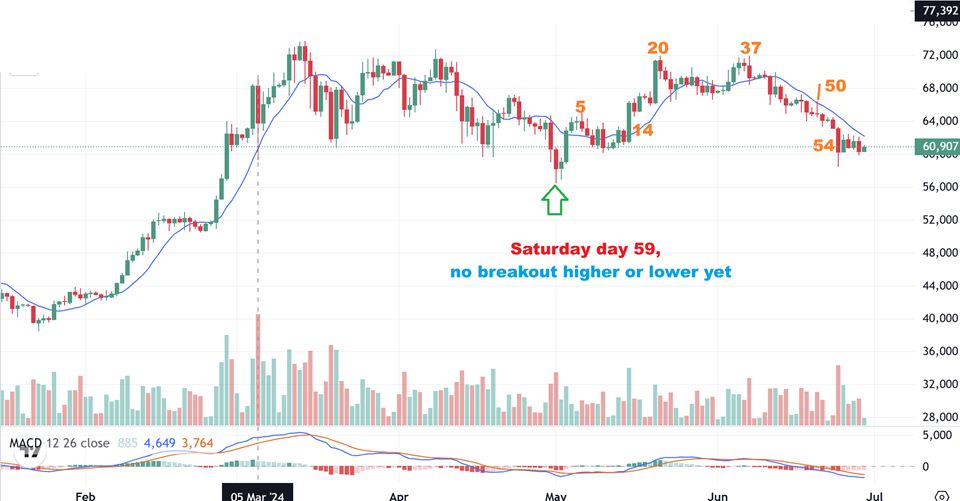
REVIEW FROM THE WEEKEND REPORT: Bitcoin Saturday morning,
As of Saturday, we are 59 days forward from the last low. We still do not have a breakout higher or lower, but one thing is certain, we should be very close to having that low in place. Please know that these roughly form every 60 days, so it could be day 63 or day 66, etc, before we see that actual low. It also could already be in place at day 54. If we do NOT get a dip lower from here, I am watching to see if we can close above that blue 10 sma line too. That may indicate that the dcl is in place.
.
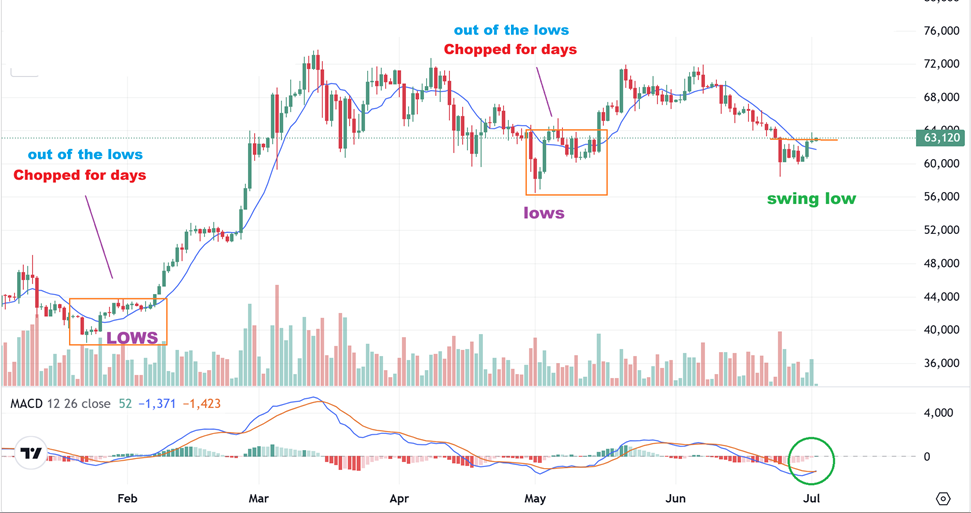
BITCOIN – Bitcoin did break above that 10sma and crypto stocks started to move higher ( or for several, continue higher). On this chart I just wanted to point out to you that
1. Bitcoin does not always run straight up out of the lows, like some may think.
2. Yes, it certainly can run straight up and leave everyone behind, but notice that at times, it got above the 10sma and then chopped sideways or lower for days. 7 of those candles equals a week, right? So I am seeing 2 weeks of chop at the lows in some cases.
3. My point? Don’t be surprised if it stalls here, back tests the 10sma, or just takes off higher. It will do whatever it wants, but individual Crypto-related Miners have started to run before these lows, so they also can take turns running & stalling.
.
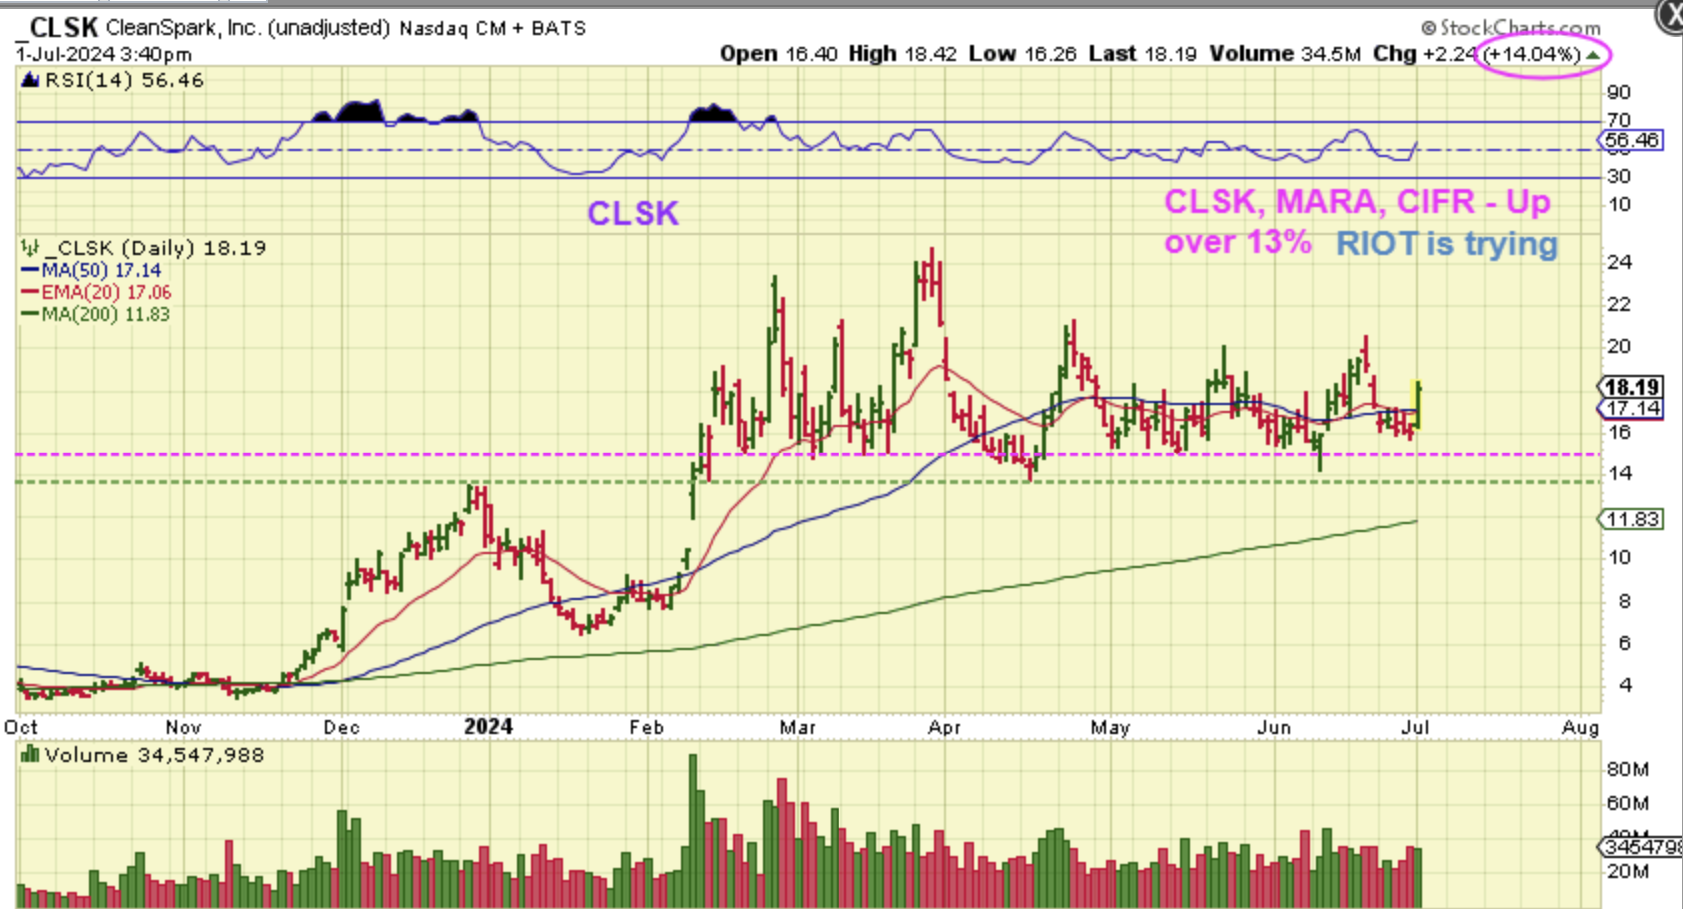
I have repeatedly put in my reports that CLSK visits that $14 and $16 area (as a buy) and then runs a good $8 to $10 higher, but with the recent lows in place, it could just run even higher.
.
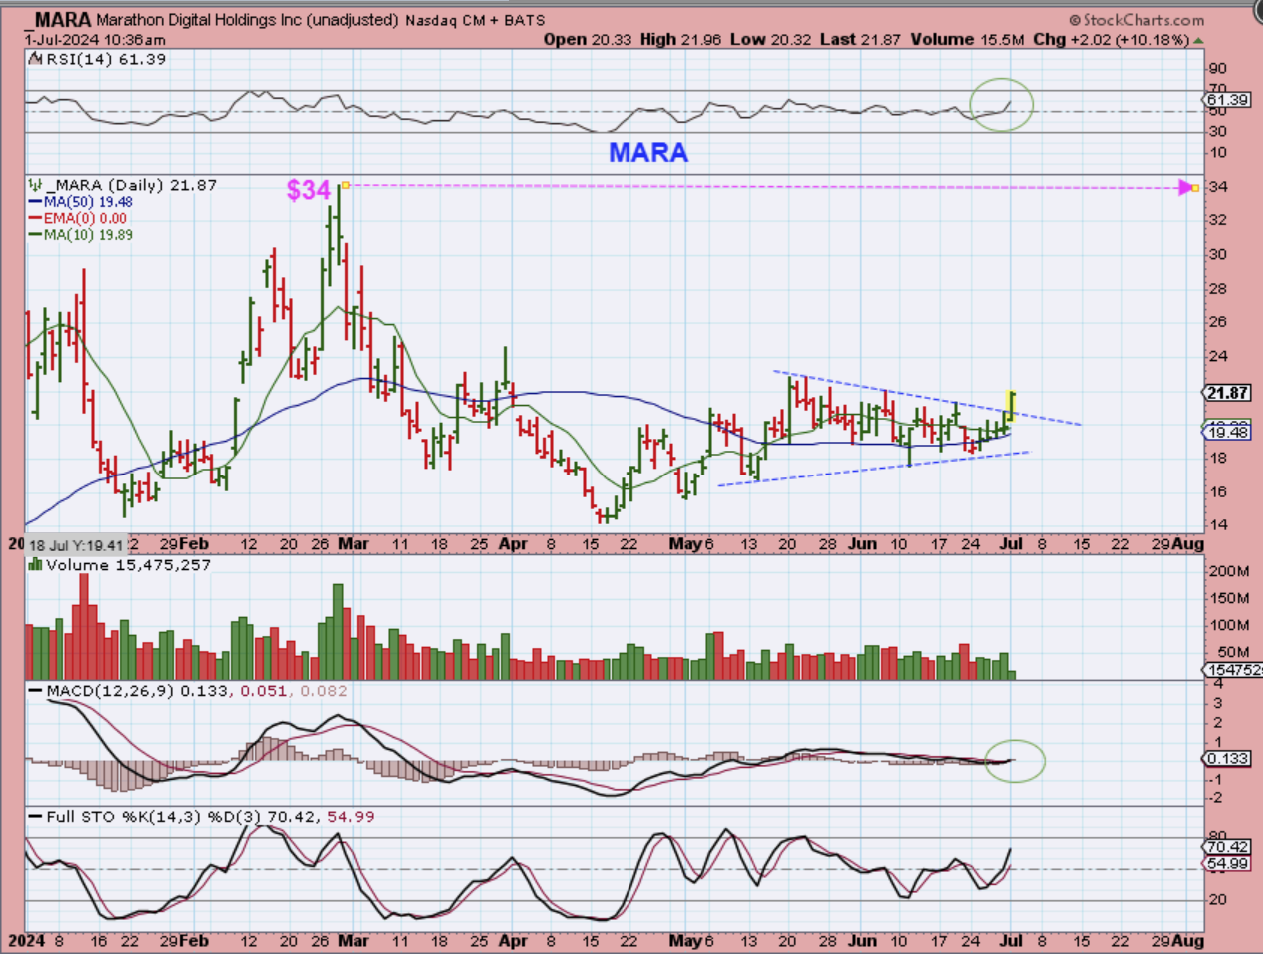
MARA started breaking out yesterday from a very tight yet choppy consolidation along the 50sma. It was up 10% in the first hour.
.
I posted this in the commenting area yesterday.
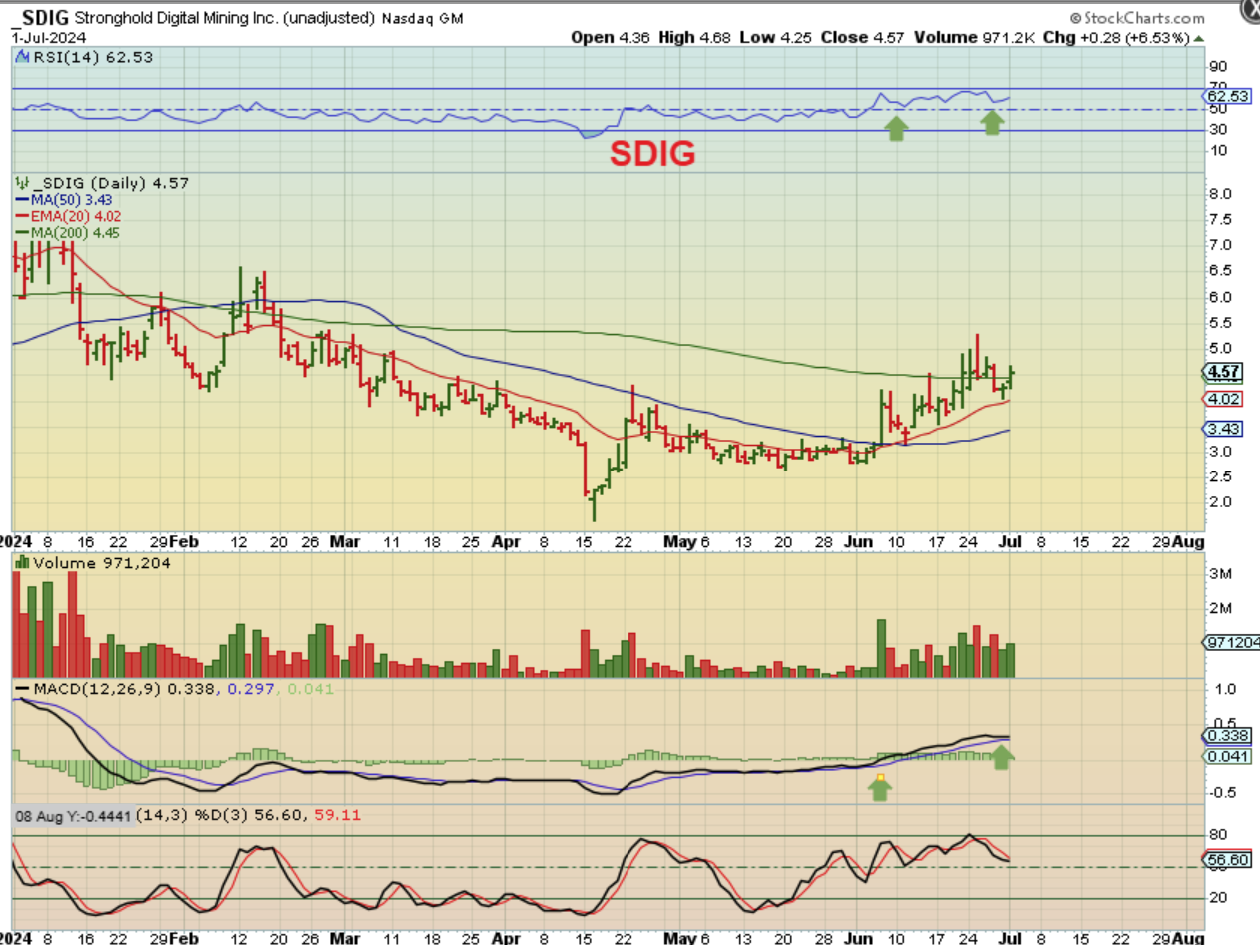
Look at the Bitcoin chart and you’ll see that Bitcoin sold off from $72,000 to $60,000 in June, but look at what SDIG and several others that I have been pointing out did during that time. WULF even doubled. It may seem surprising that with a Bitcoin breakout above the 10sma, this wasn’t up higher that 2% midday, but that may make it a ‘gift’. It looks ready to break out, and…
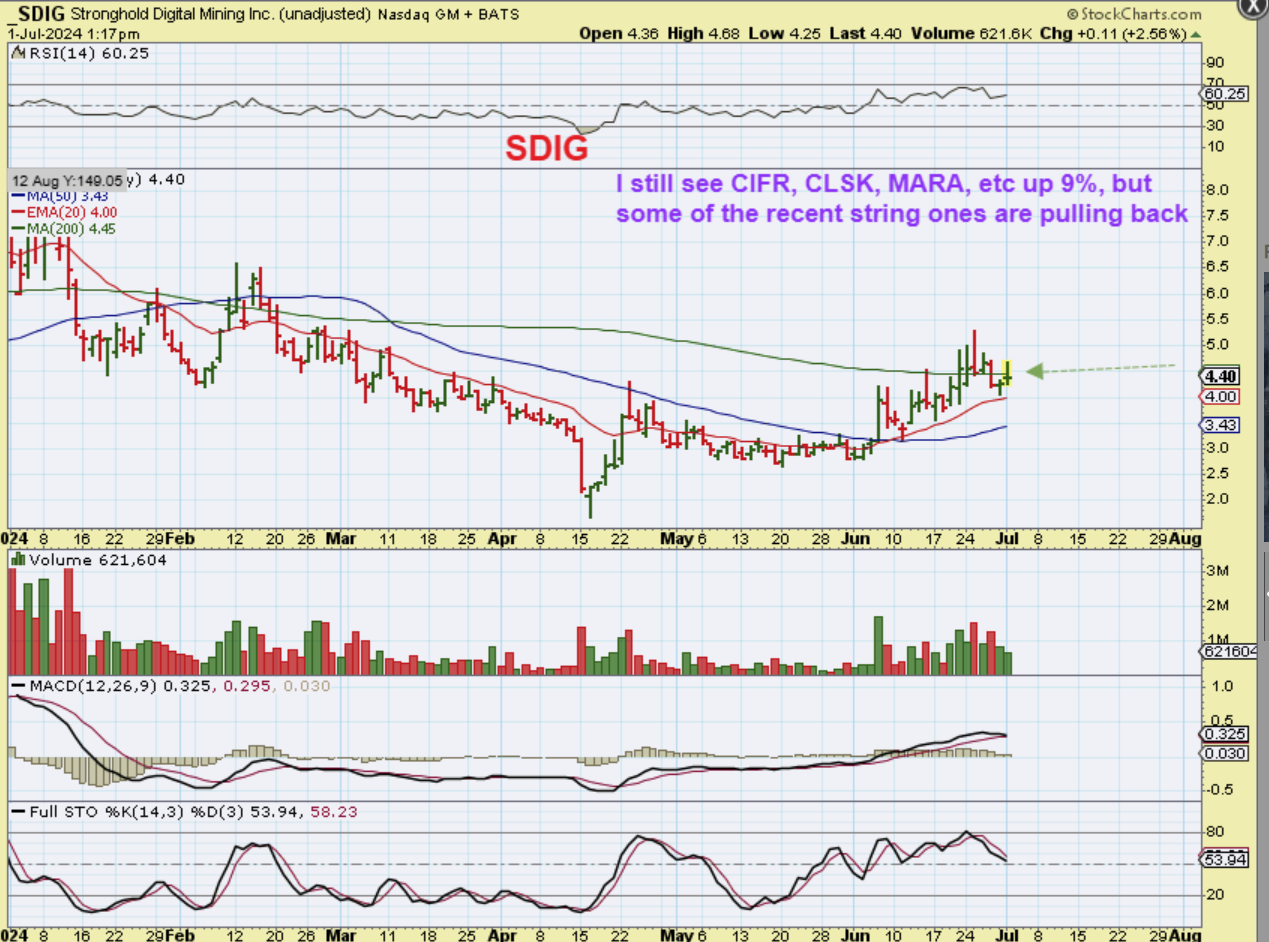
.
SDIG – by the close , it did close up 6.5% and above that 200sma. If bitcoin pulls back this may remain choppy, but in the long run I think that it could do quite well.
.
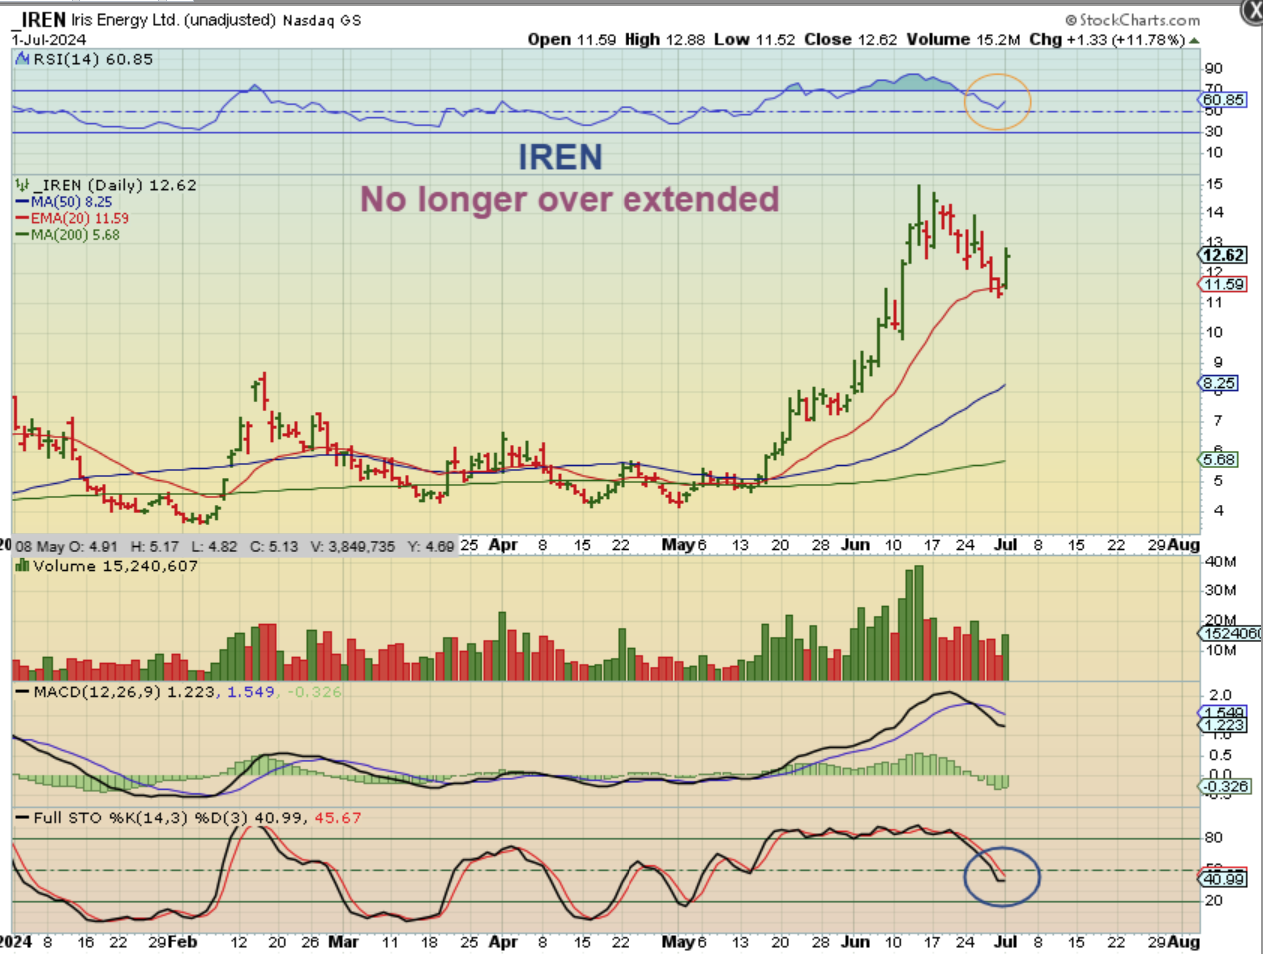
IREN ran $4 to $15 during Bitcoins sell off 🙂 It reversed at the 20 ema after a 2 week pullback to support.
.
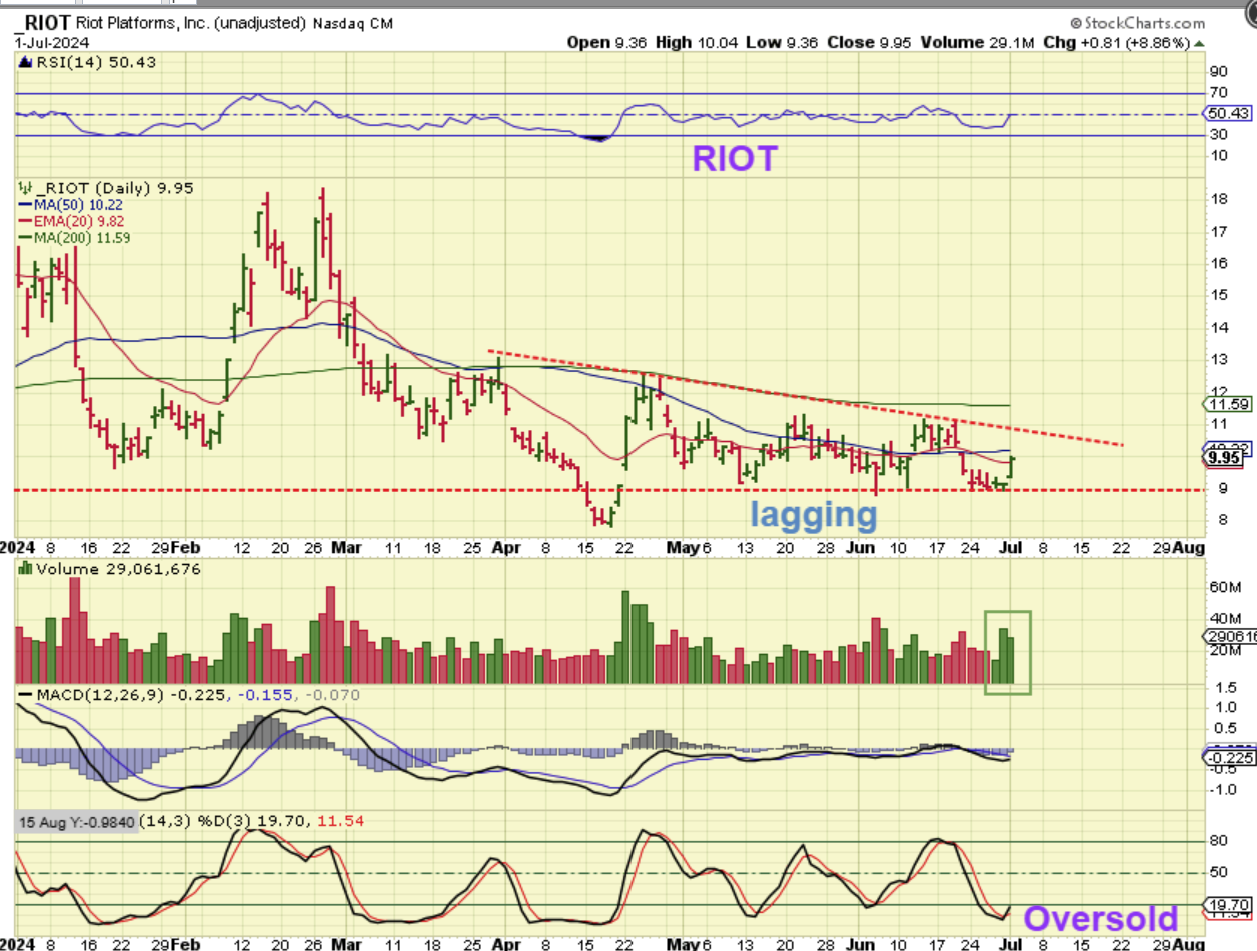
RIOT is a lagger lately, but it has been a strong runner in the past. Is it because they offered to ‘buy out’ another company? Maybe, but I do think that this will run over time. It was up almost 9%, so it may be ready to run with Bitcoin and how often can you buy RIOT in the $9 area? This just about doubled in February.