Friday June 28th
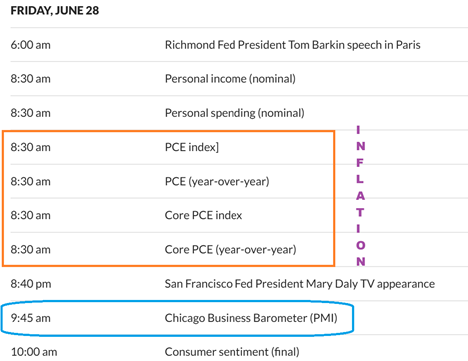
DATA – Todays data can be used to gauge inflation and THAT can move the markets.
.
AS A REMINDER, I WROTE THIS YESTERDAY ABOUT CYCLE COUNT:
.
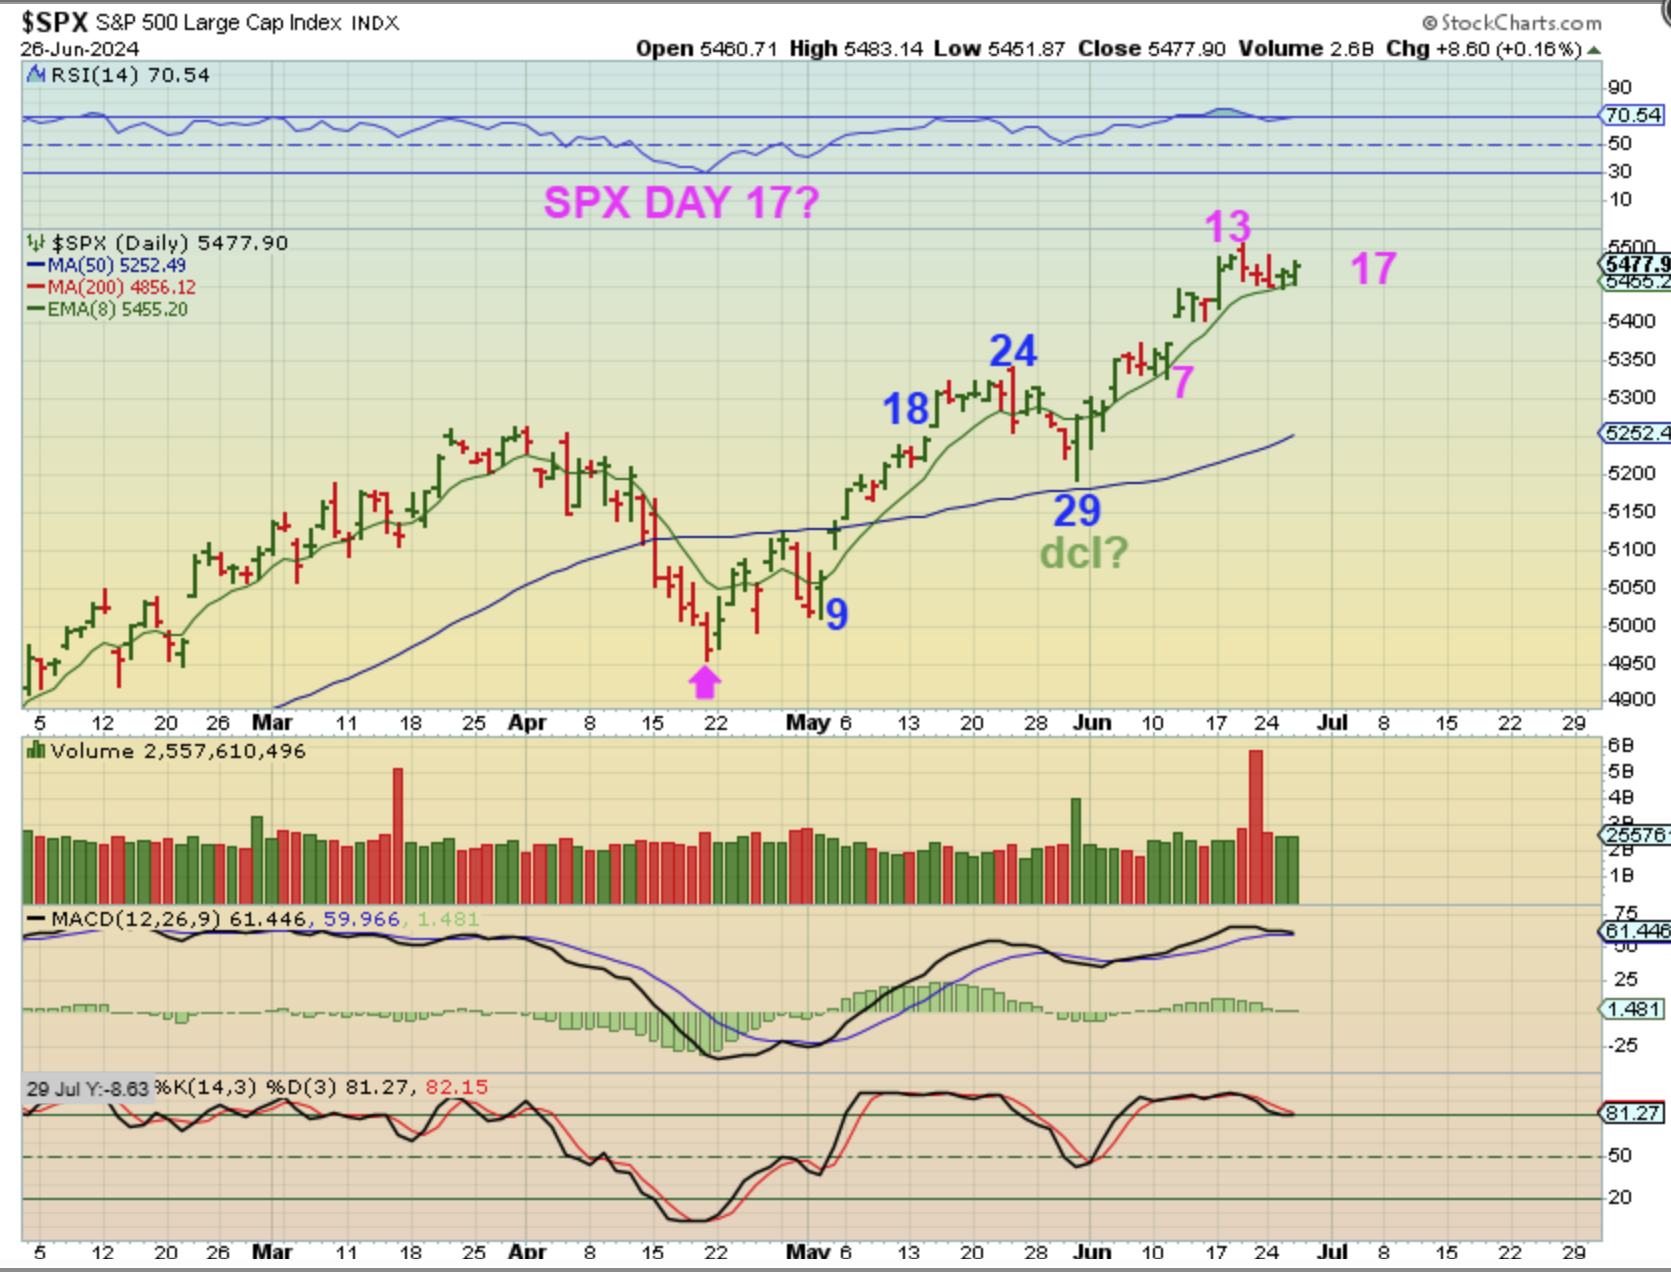
SPX – If that was a day 29 dcl, then this would be day 17 of the 2nd daily cycle and it could go higher or dip lower. It has been holding the 8ema or 10 sma, so it is on support as of yesterday. We’ll see what the DATA does.
.
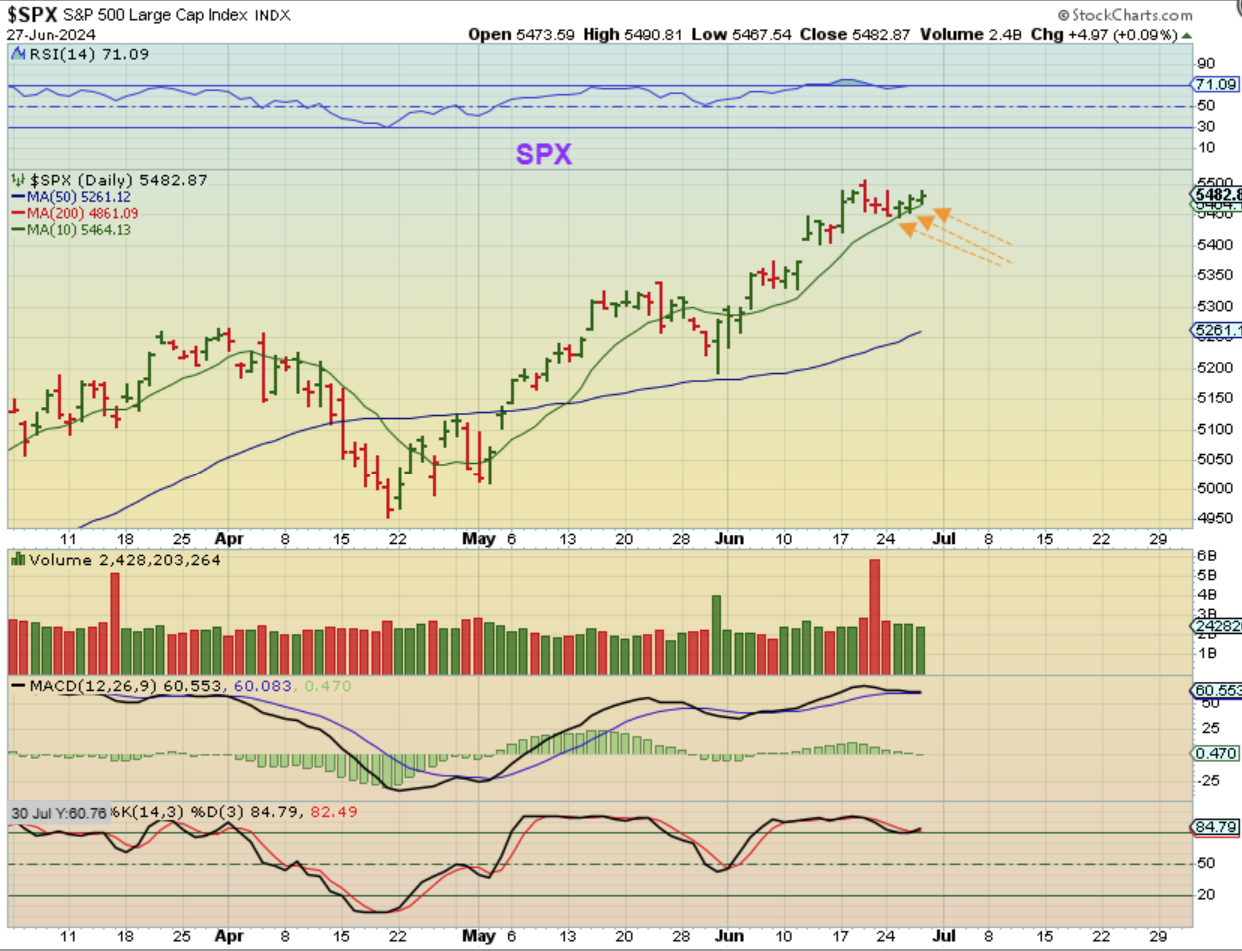
THE SPX has been riding the 10 sma this week. A dip that starts now would likely be that drop into a dcl at day 47, but if the markets moved higher with the data, then it would likely be telling me that we did have a day 29 dcl. This would be day 19.
.
This is more in line with what I have been expecting all along: One long daily cycle out of an ICL.
.
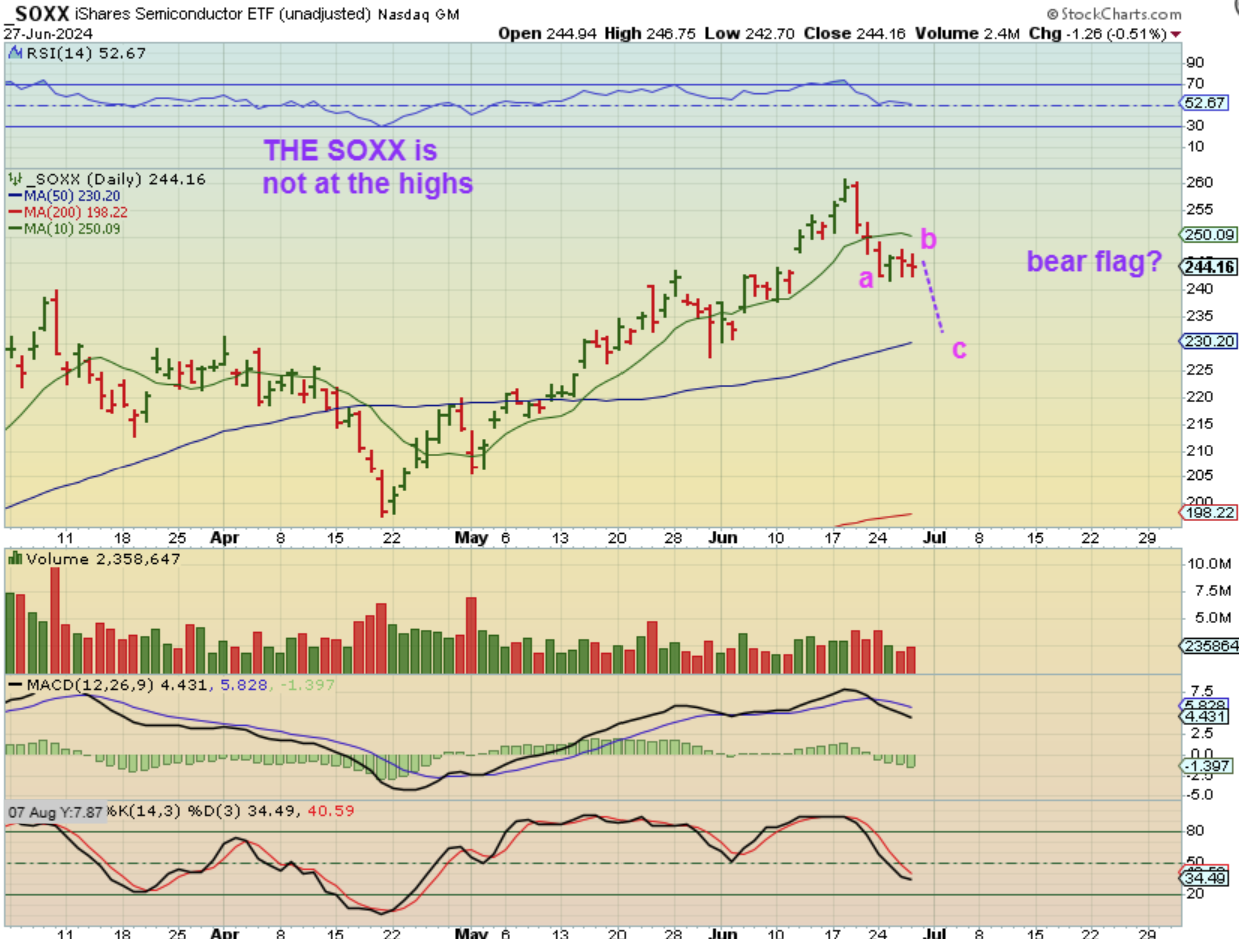
Taking a look at The SOXX, we see a very different set up with Semiconductors. They already dropped, crawled sideways in a possible bear flag, and would finish an a-b-c down if the drop continues from here.
.
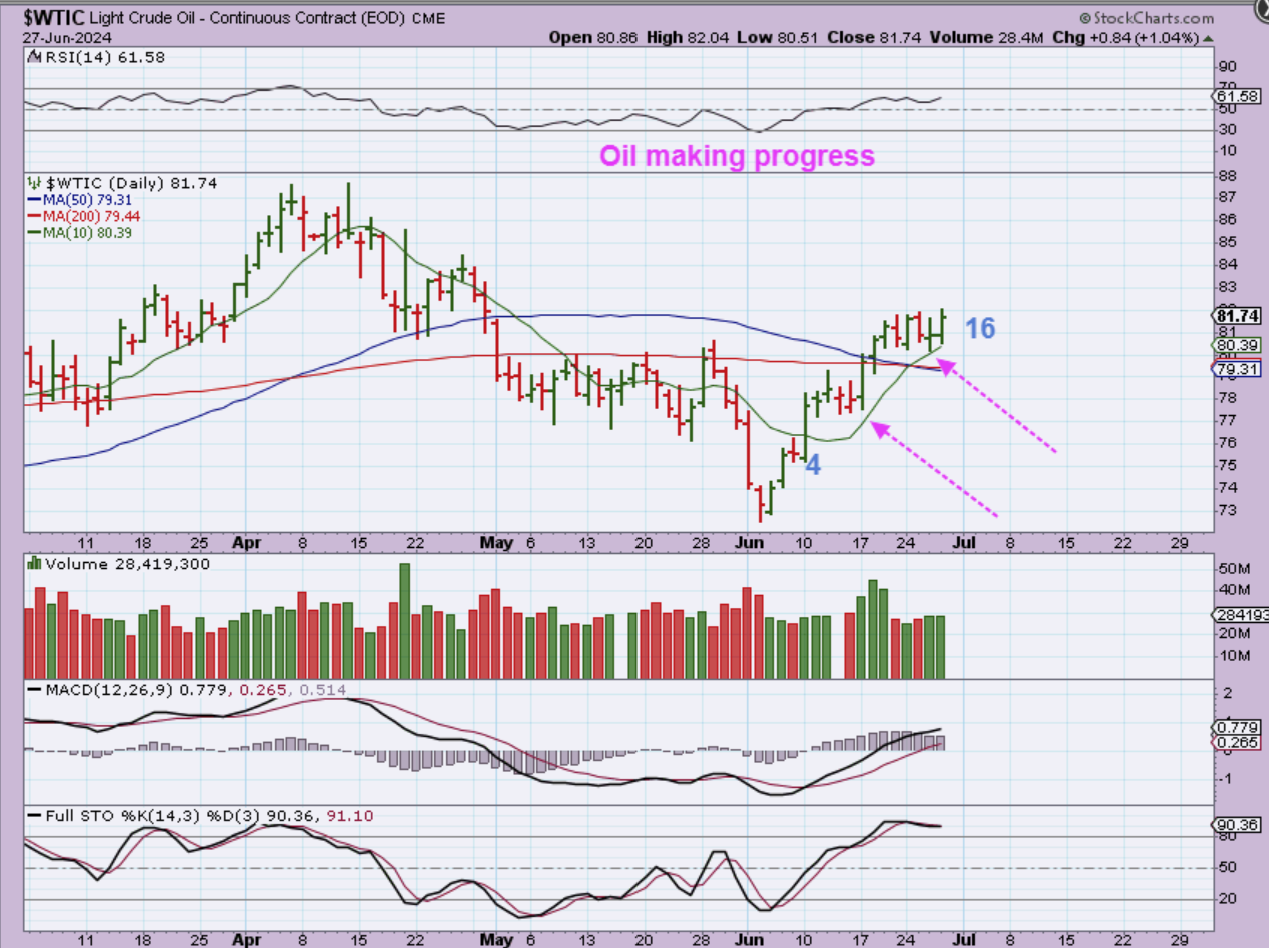
WTIC – Oil moved higher again on day 16 and it reversed at the 10sma. Oil is bullish out of the ICL.
.
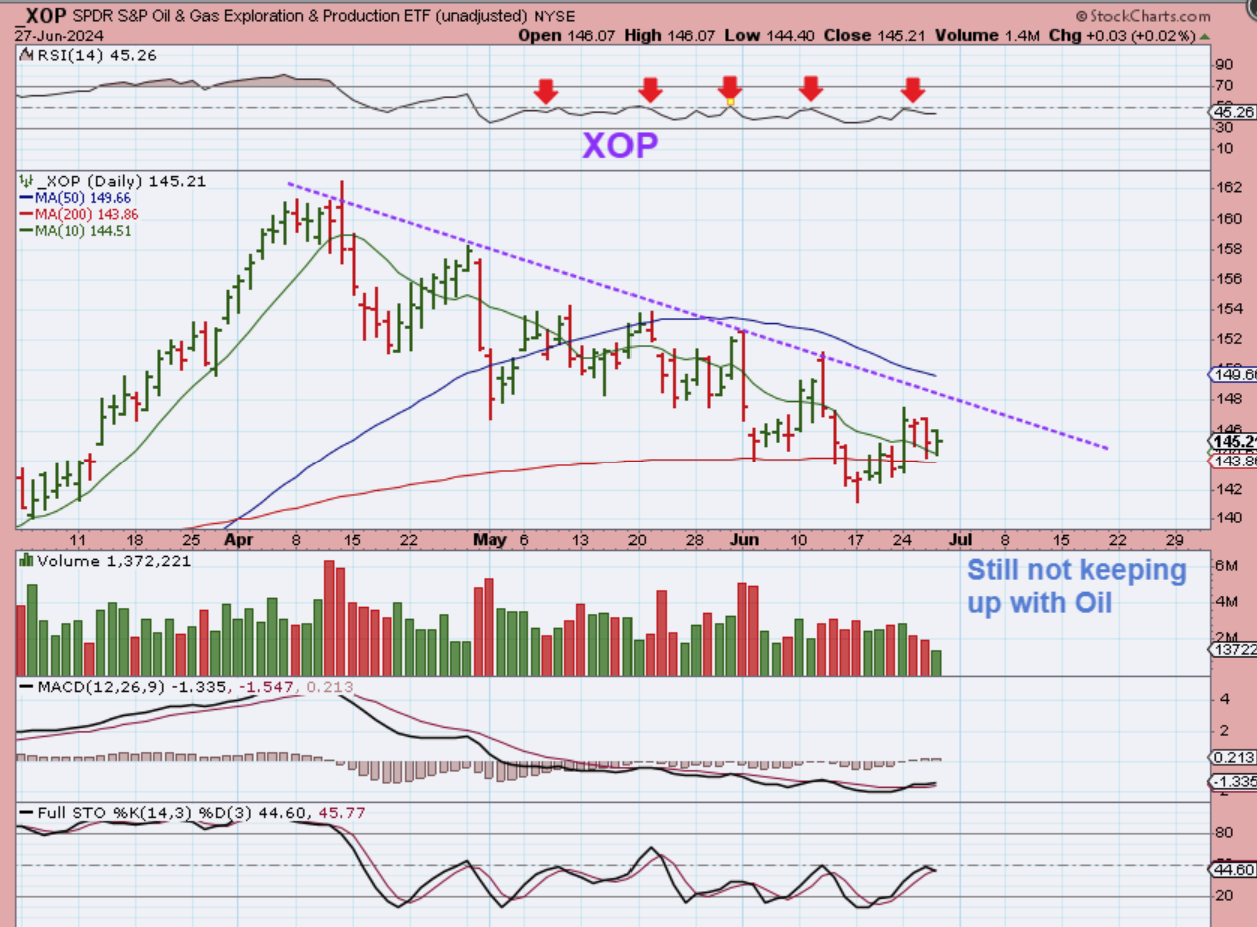
The XOP and The XLE are not closly following Oils move higher (yet).
.
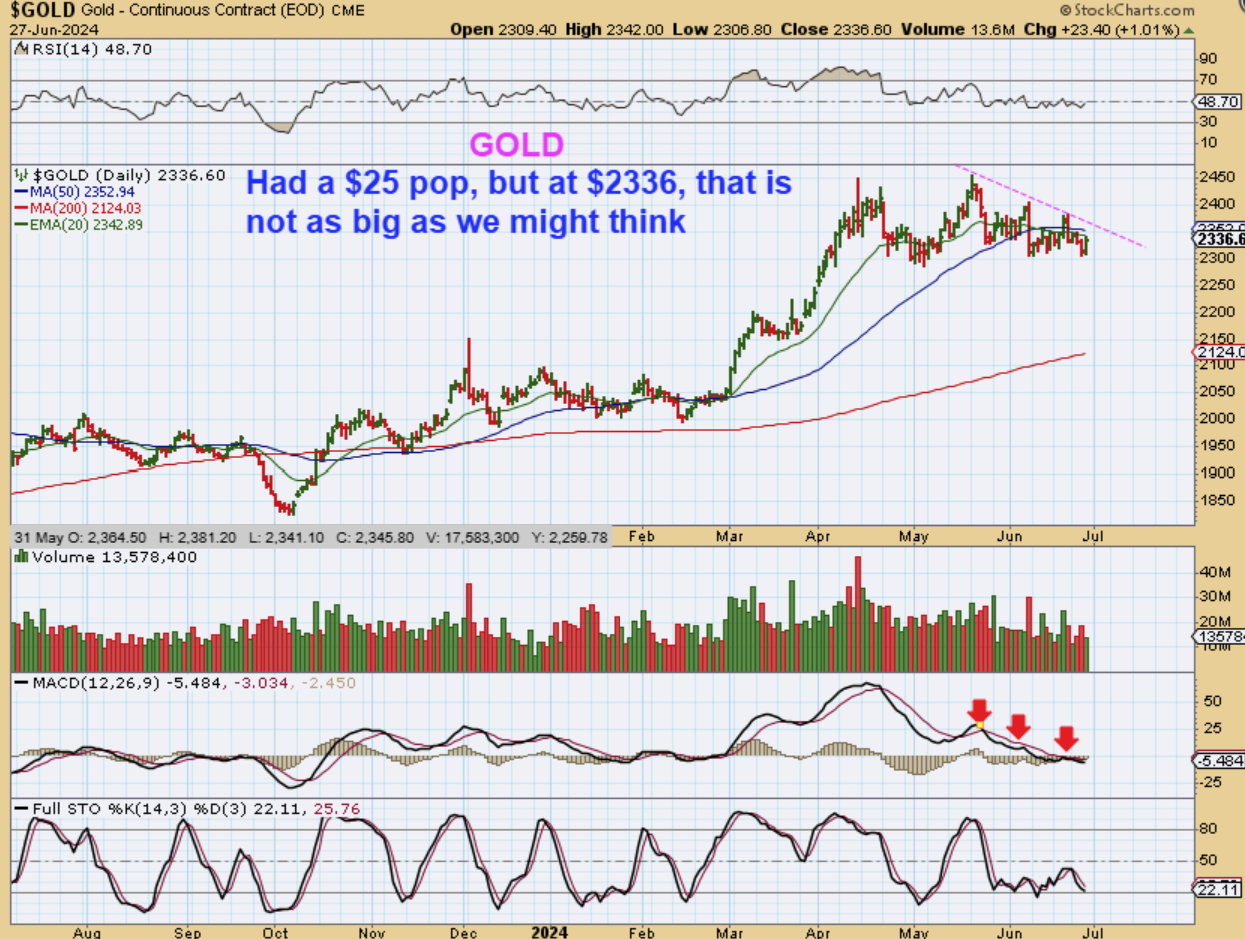
GOLD popped $25, and that used to seem like a nice pop when Gold was at $1100, but as you can see here, it looks like more of an average move now that Gold is over $2300. That is a 1% pop and it still has Gold under the 50sma and that downtrend line. The PCE numbers could drop Gold, since I have to expect a drop eventually into the next ICL.
.
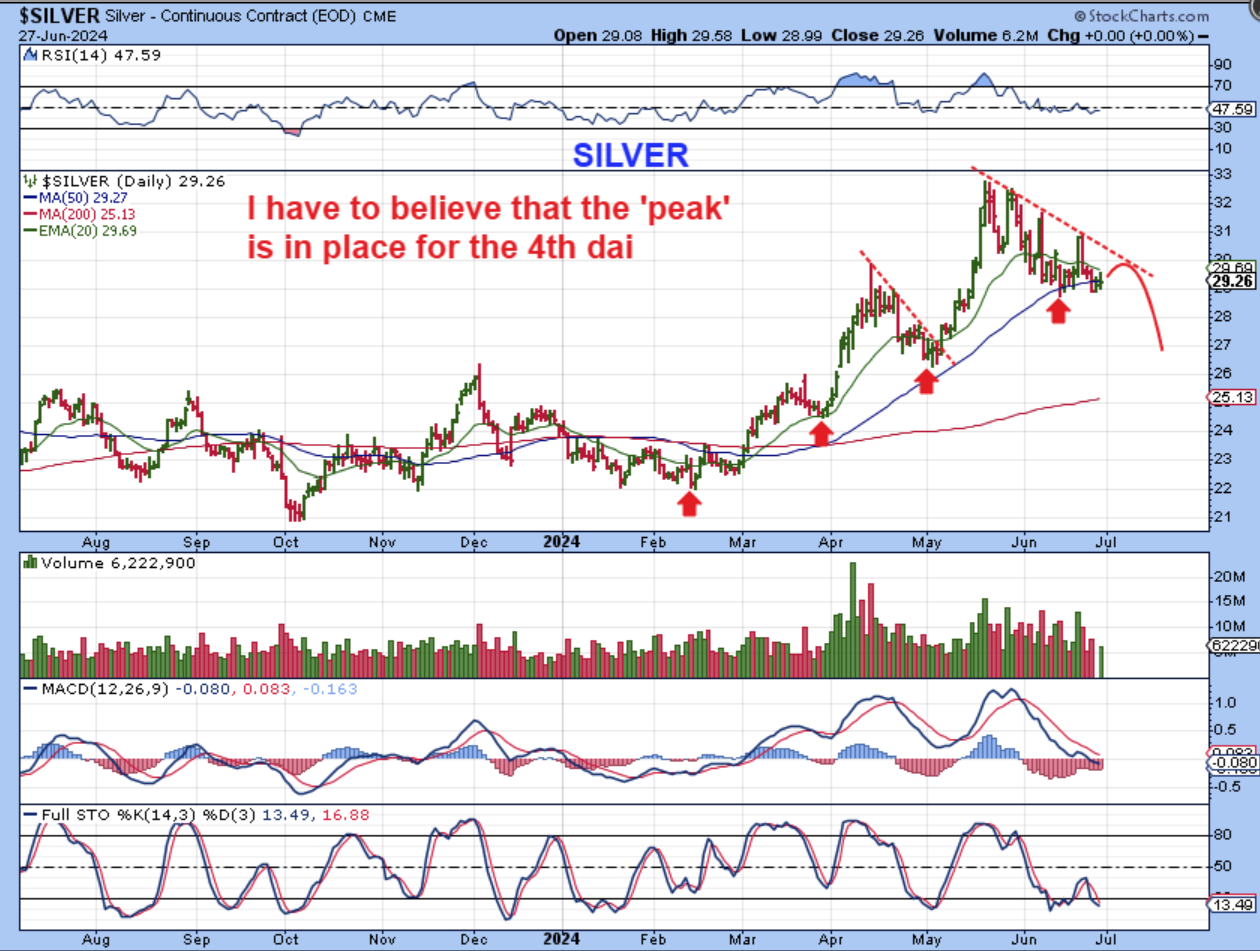
SILVER is trading around the 50 sma and normally this would look strong, but I have to expect a downside move, when I consider cycles timing. Both Gold and Silver have a downtrend line that is higher up, so they can Pop and then drop later too, as drawn here.
.
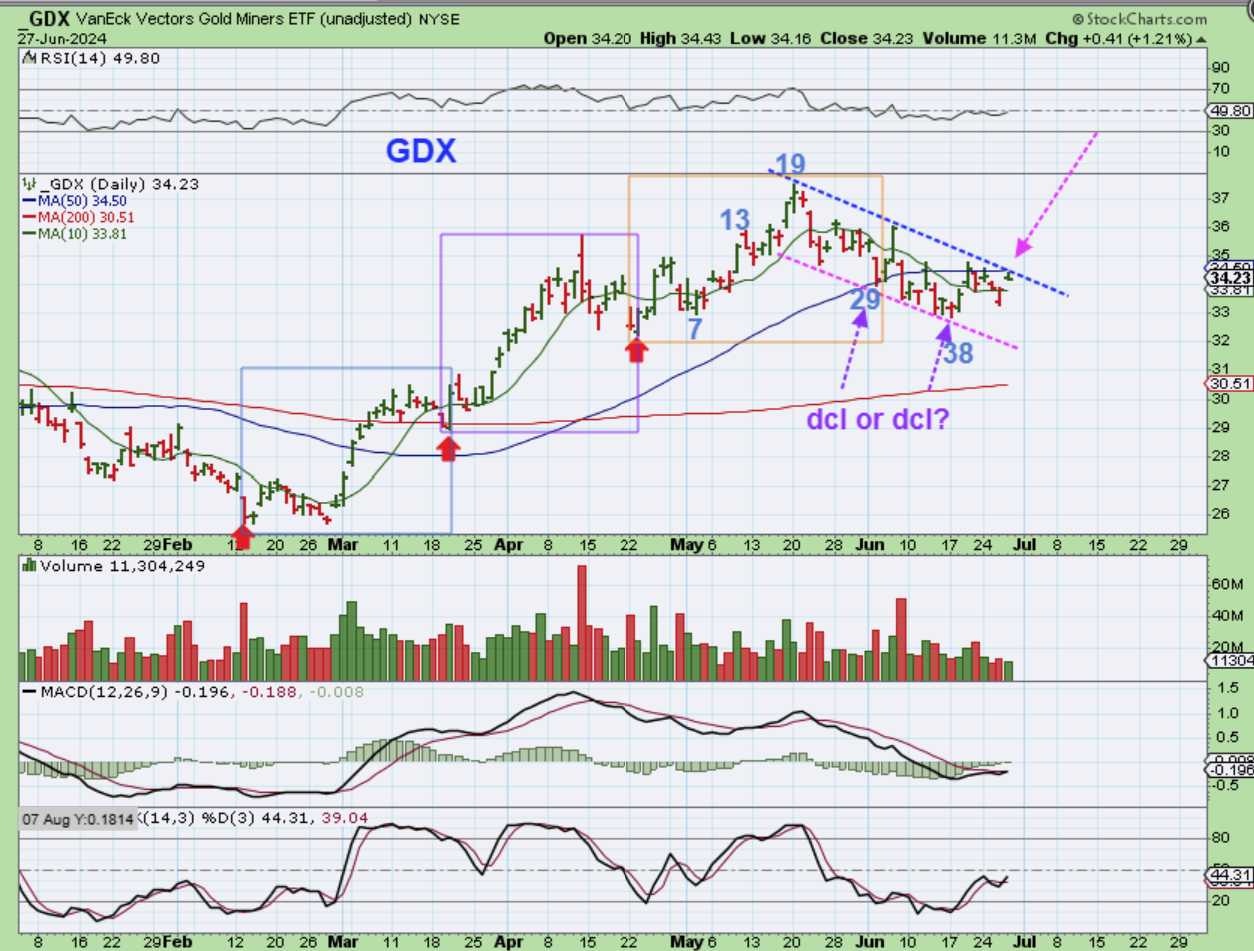
The GDX however, doesn’t look like it will move higher, since the price has repeatedly tagged the 50sma and is now at the upper trend line. This cycles timing looks to be on the 4th daily cycle, possibly day 7, which would match closely the timing for Gold & Silver. A 4th daily cycle could peak L.T. and that could happen at any time from day 7 to 13 or so.
.
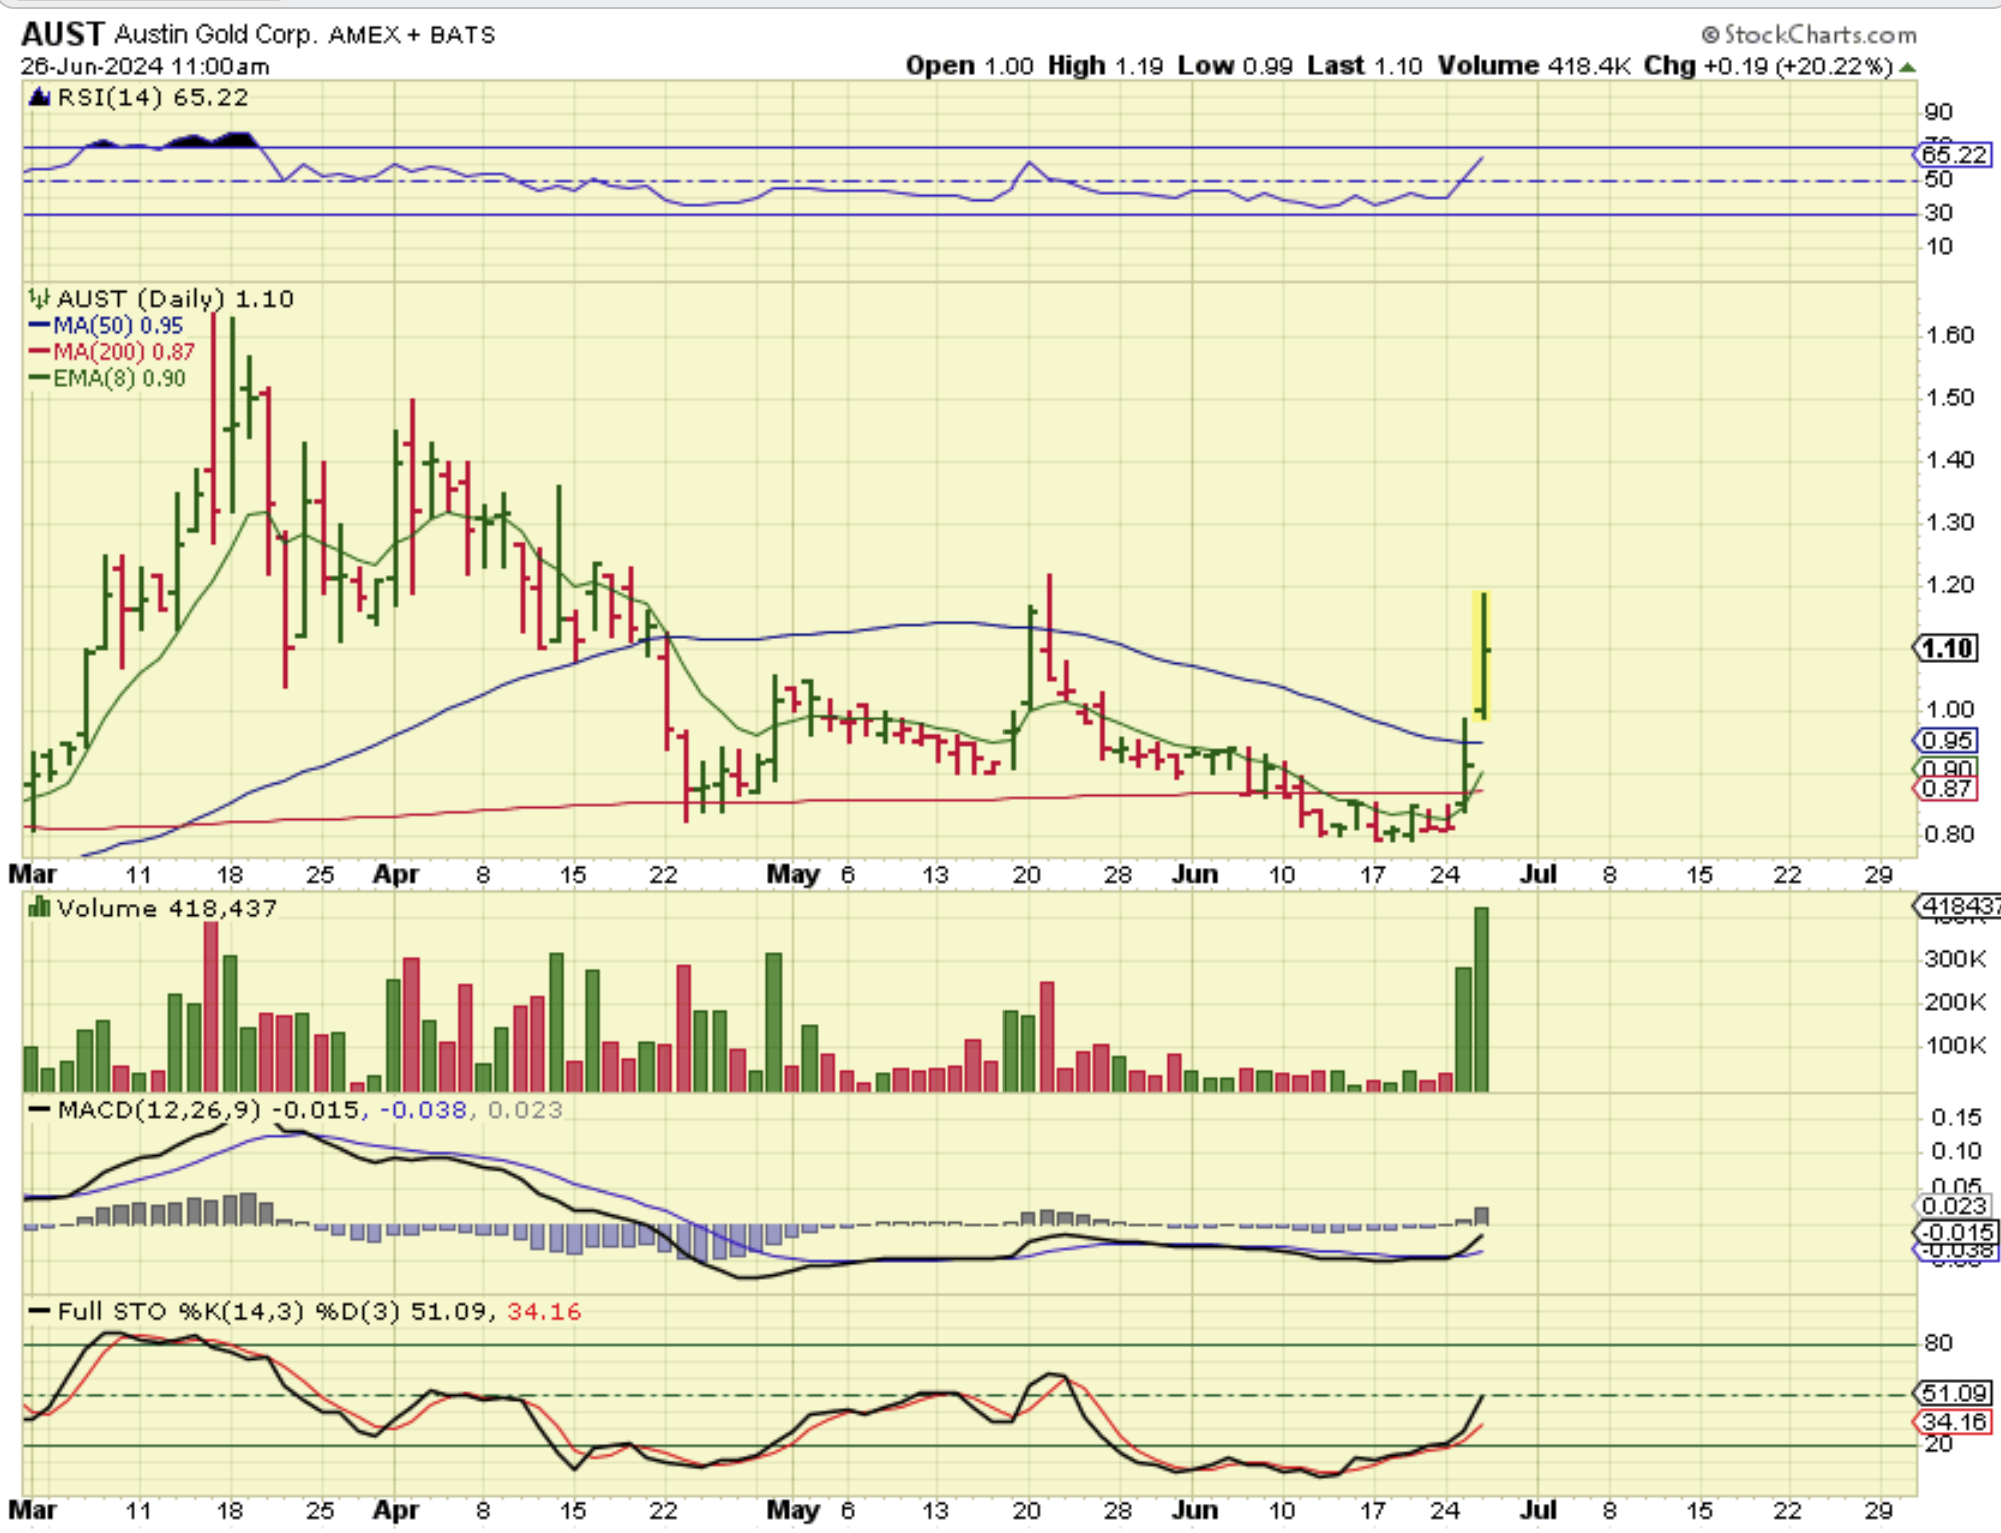
Oddly, I have seen some pretty strong looking Miners deep in this intermediate cycle. Surprises to the upside for a bull market.
AUST popped 12% Tuesday and 25% Wednesday. Yesterday, not shown, it dropped 7%.
.
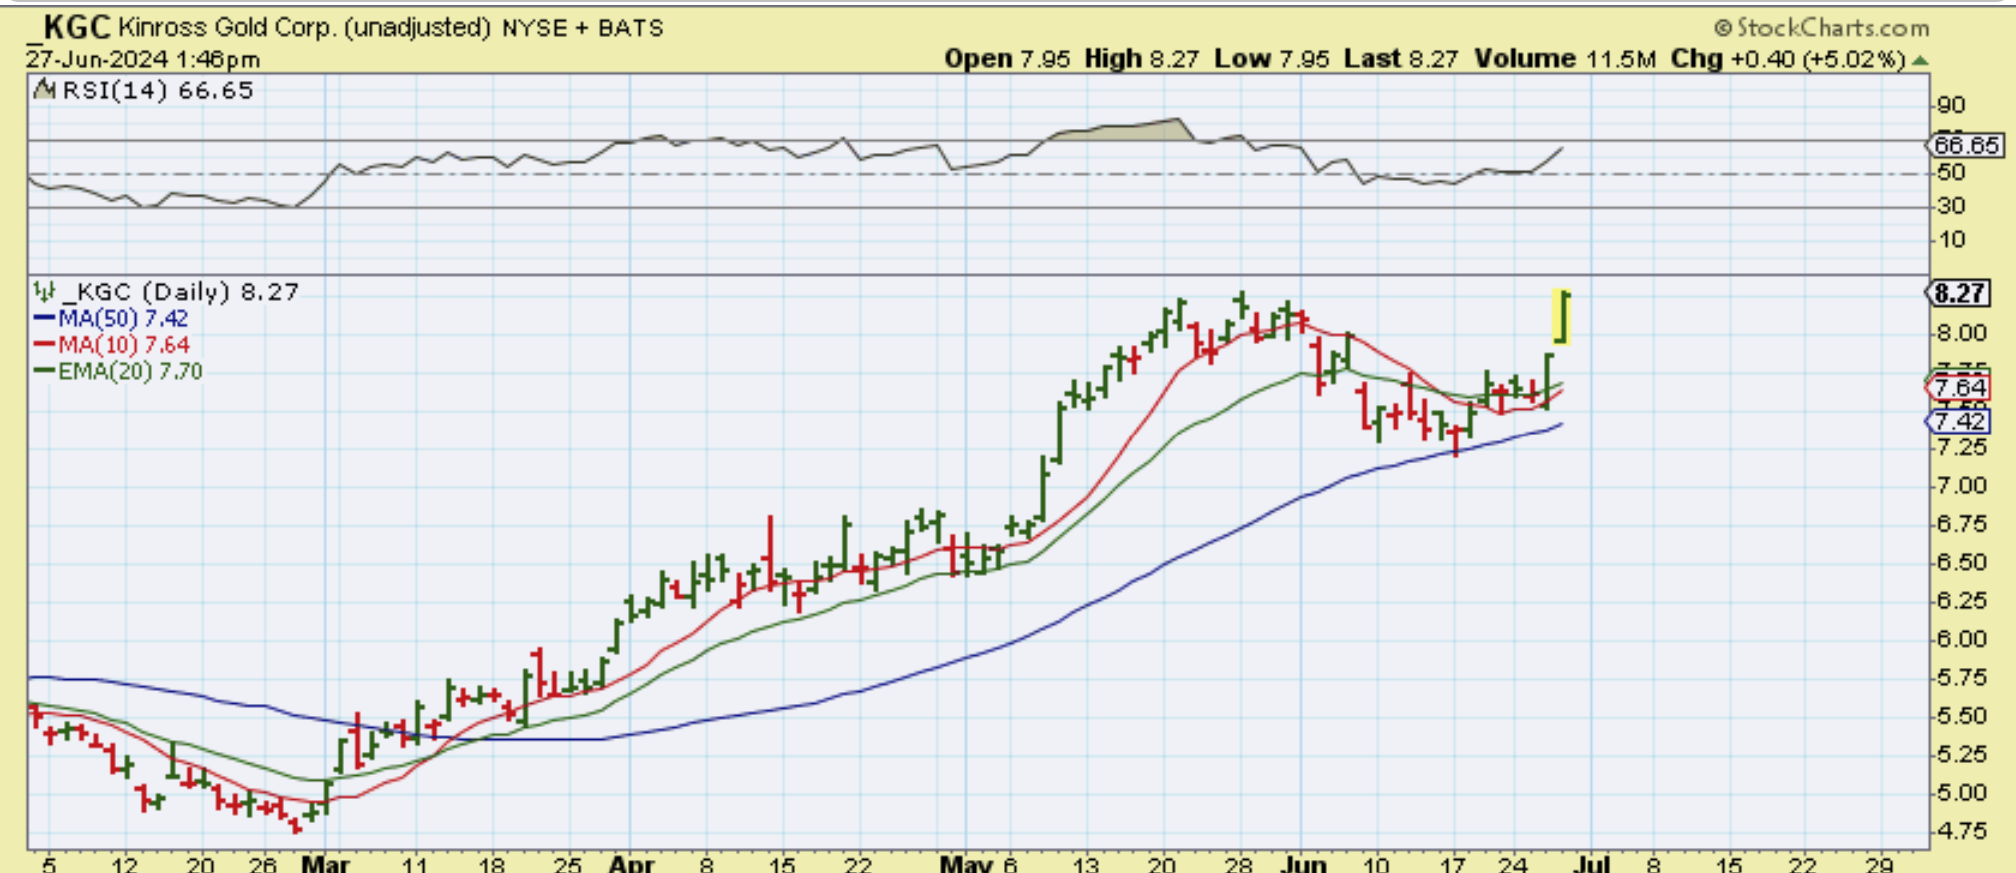
KGC actually made NEW HIGHS yesterday and this chart looks VERY bullish.
.
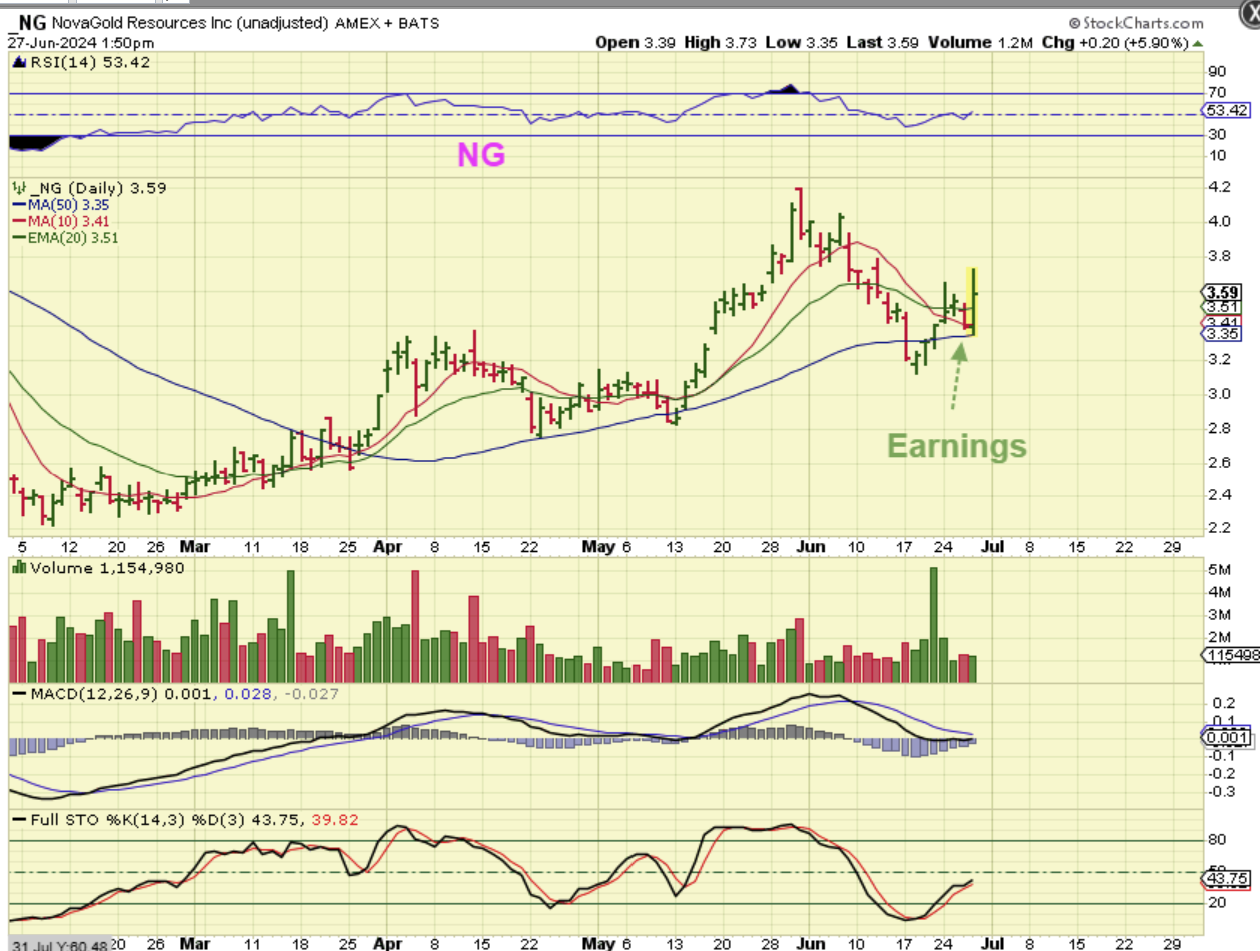
NG released earnings and it reversed right on the 50sma and pushed higher yesterday.
.
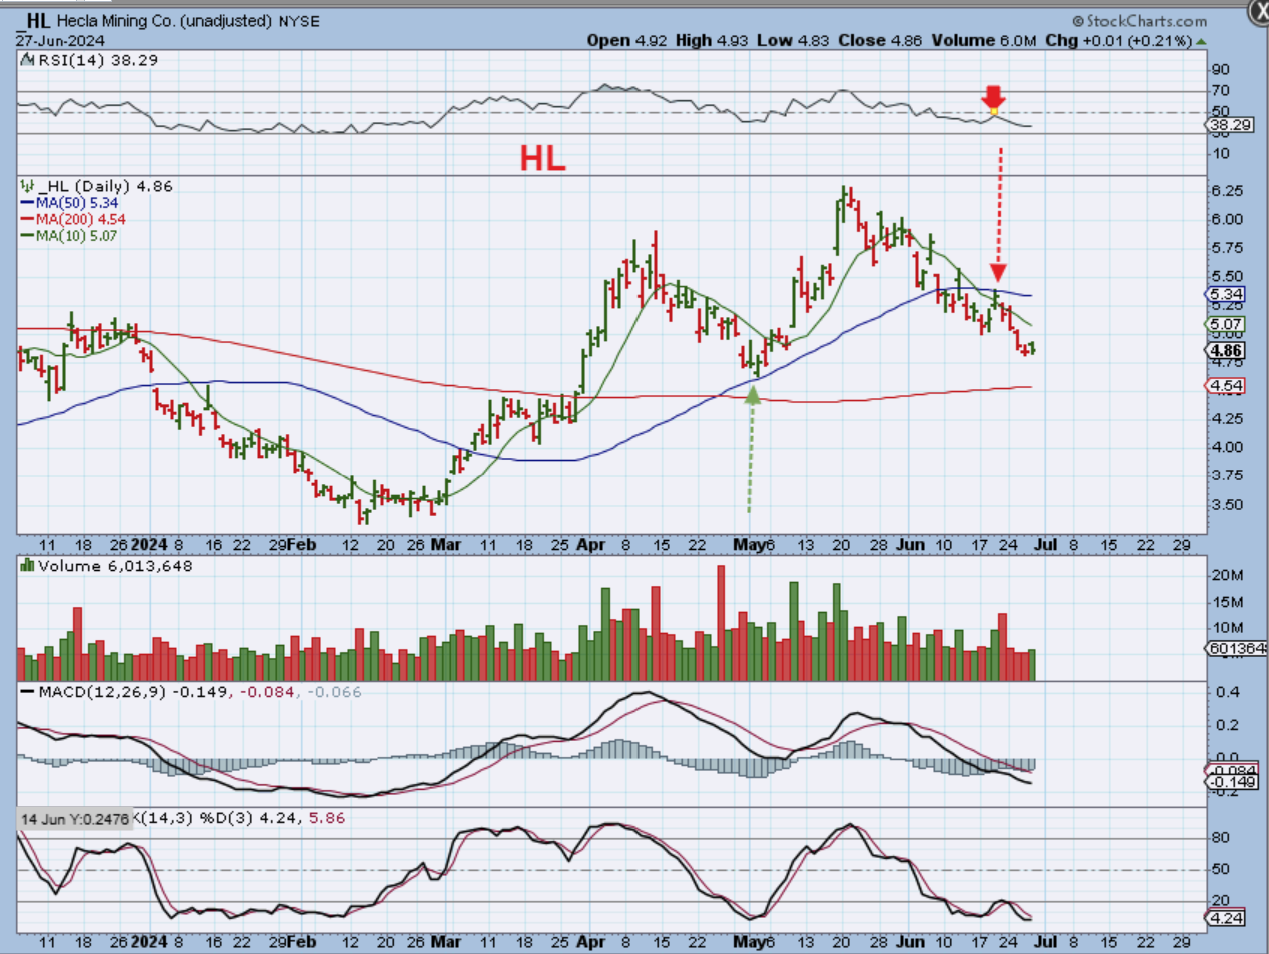
HL – I am NOT saying that all of the Miners have held up well. Many are also selling off as expected, so it is a mixed bag of Miners both above and below the 50sma.
.
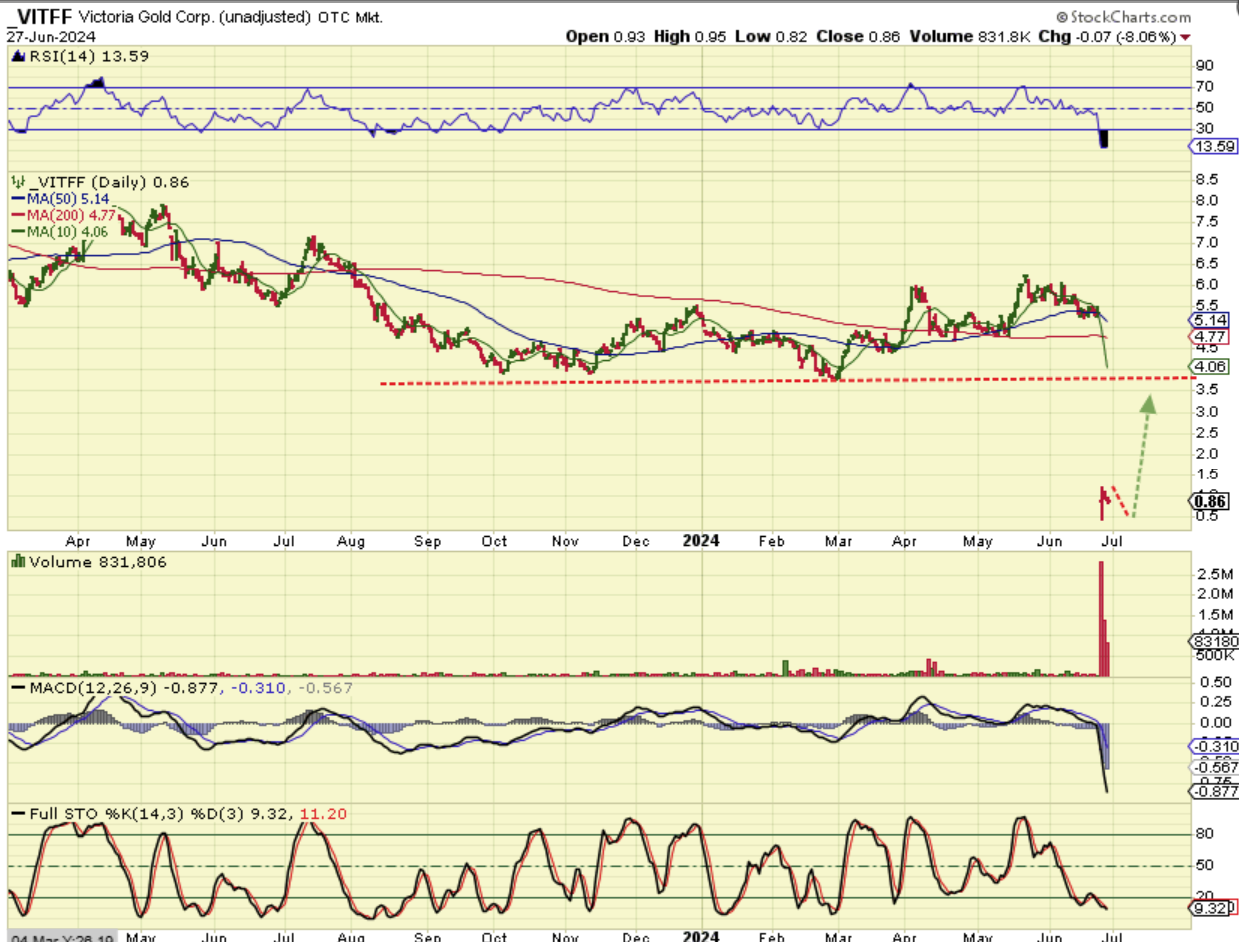
VITFF -Victoria Gold announced the heap leach pad at its Eagle Gold Mine in Yukon experienced a failure. The operation has been temporarily suspended as the situation is being assessed. So with the future in doubt, it dropped from $5.50 area to $1 instantly. I have been asked: Will it recover? Can it return to $5 and give huge gains? My answer, “I don’t know, I haven’t visited the mine lately” -lol. Really, it could recover, but it may also be dead in the water, so it is a gamble until further news comes out.
.
So we have important data out today and the General Markets as well as the Precious Metals Sector could go either way, but we should know by the 8:30 a.m. pre-market time period. Enjoy your Friday trading.
.
~ALEX
.
REVIEW:
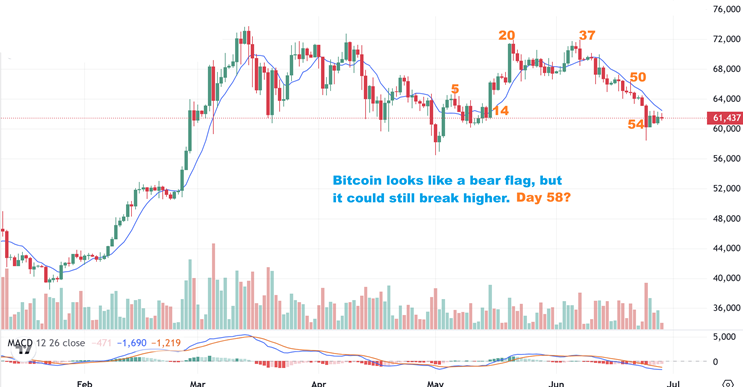
BITCOIN DAILY THURSDAY : Bitcoin has not made any progress yet. Bitcoin can chop at the lows before moving higher, so we’ll just have to wait and see if
1. This is a bear flag and we get 1 final drop into a day 60 or so dcl.
2. This moves higher from here as a day 54 dcl and today is day 3.
3. You can easily see a long drop in Bitcoin, but MANY crypto Miners are doing the exact opposite.
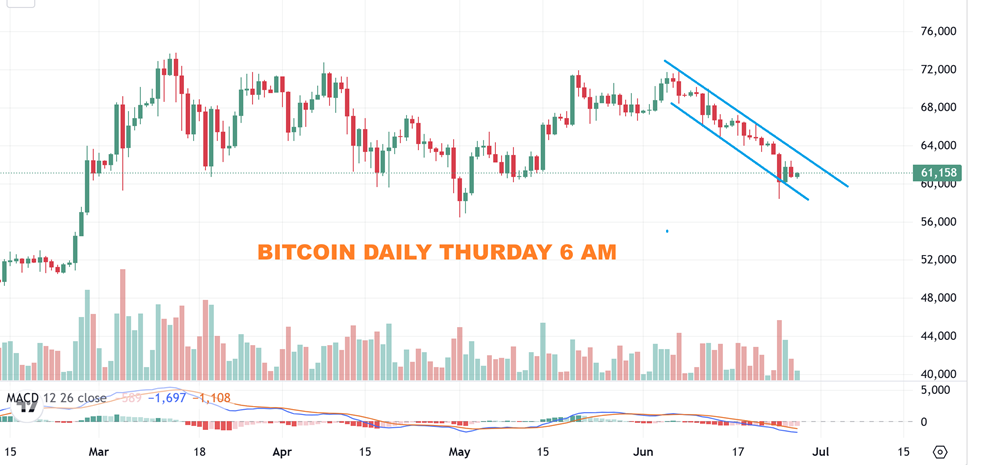
Bitcoin 7 am Friday: So this is either
1. A day 54 low and it breaks higher anytime now or
2. It is day 58 and will drop into a day 60 (Roughly day 60) low.
3. I would say that a break above that 9 sma would be a bullish break higher (the blue line).