Wednesday June 26th – Patience
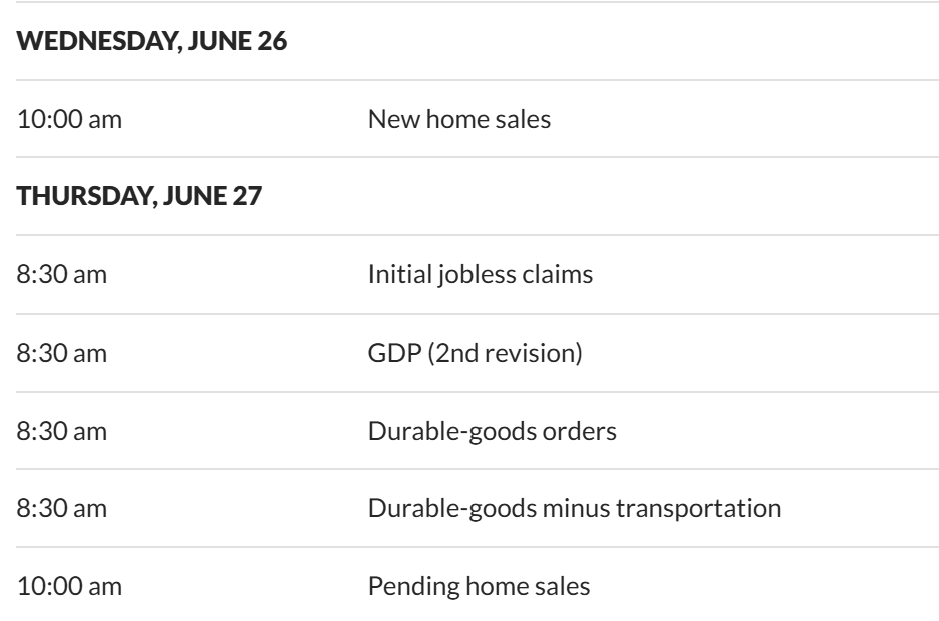
DATA – Todays data is released at 10 a.m., but it should not really affect the various market sectors, as far as I can see.
.
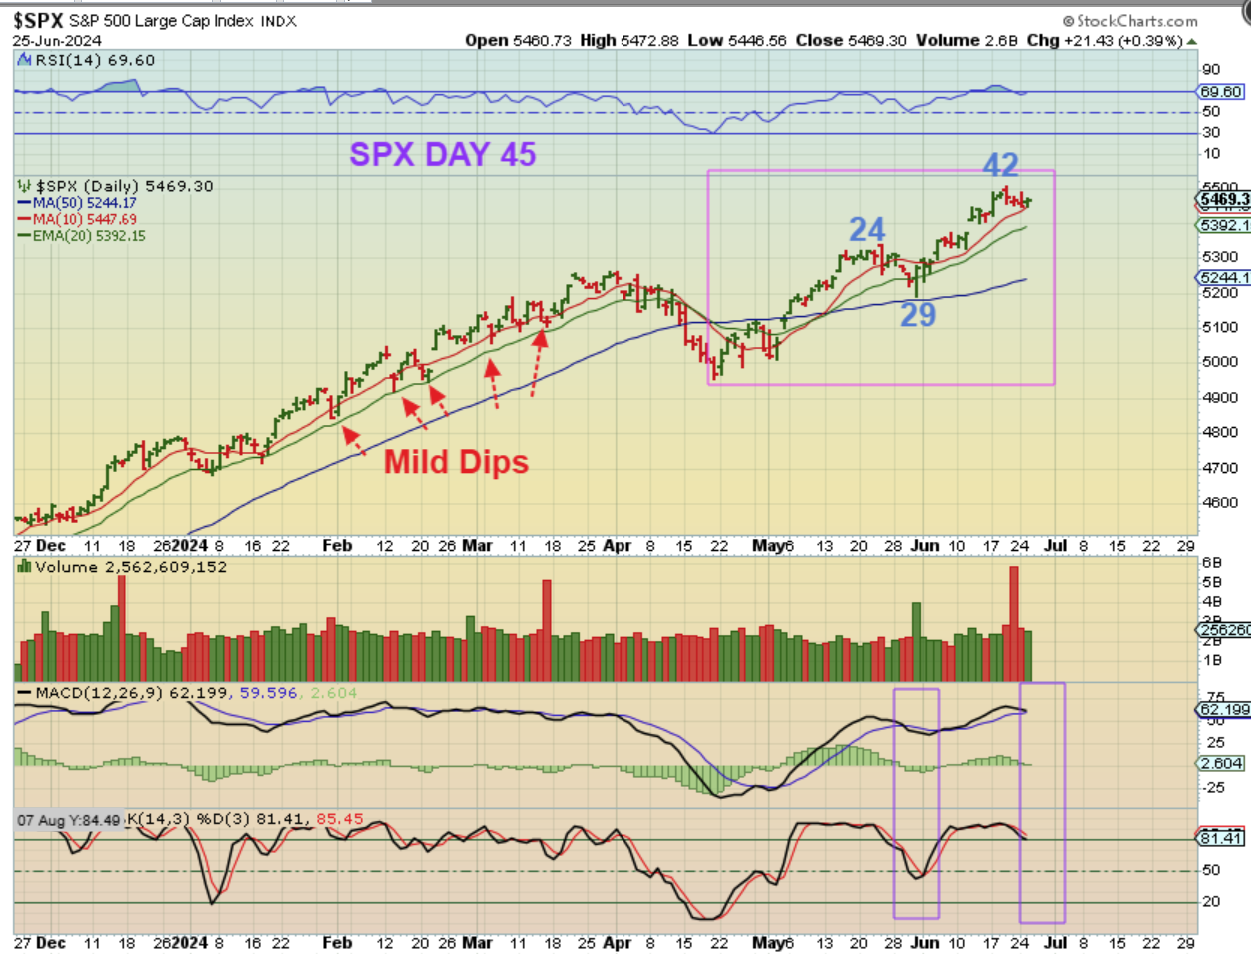
Let’s take a look at THE SPX and discuss the dcl here, an then I will discuss the same chart again in another way. Right now I want to point out this…
1. After that dip in January 2024 (dcl), I do NOT see another clearly visible dip into a dcl until after April, do you? I just see small 1-2 day dips from Jan to April.
2. Those dips were mild and tagged the 10sma and 20ema. They also lasted only a couple of days, similar to what we just had.
3. We are due for a dcl, but is this all we’ll get with a similar pattern to that last run January into April? Or was day 29 an early dcl and this would be day 13? It’s really hard to know, so…
.
Here I just want to simply say that with the SPX:
1. We are looking for a dcl, because we are at what should be day 45.
2. I also called for and do see, 5 waves up out of that ICL. I expected a bigger dip.
3. After looking at the chart ABOVE and seeing that steady run from Jan 2024 to April 2024, I am not shorting this market. I am just going to let it play out, and if you are long, I have mentioned just using a rising stop ( maybe under the green 20 ema). We still might sell off deeper after Thursday jobless claims and Fridays PCE Data.
.
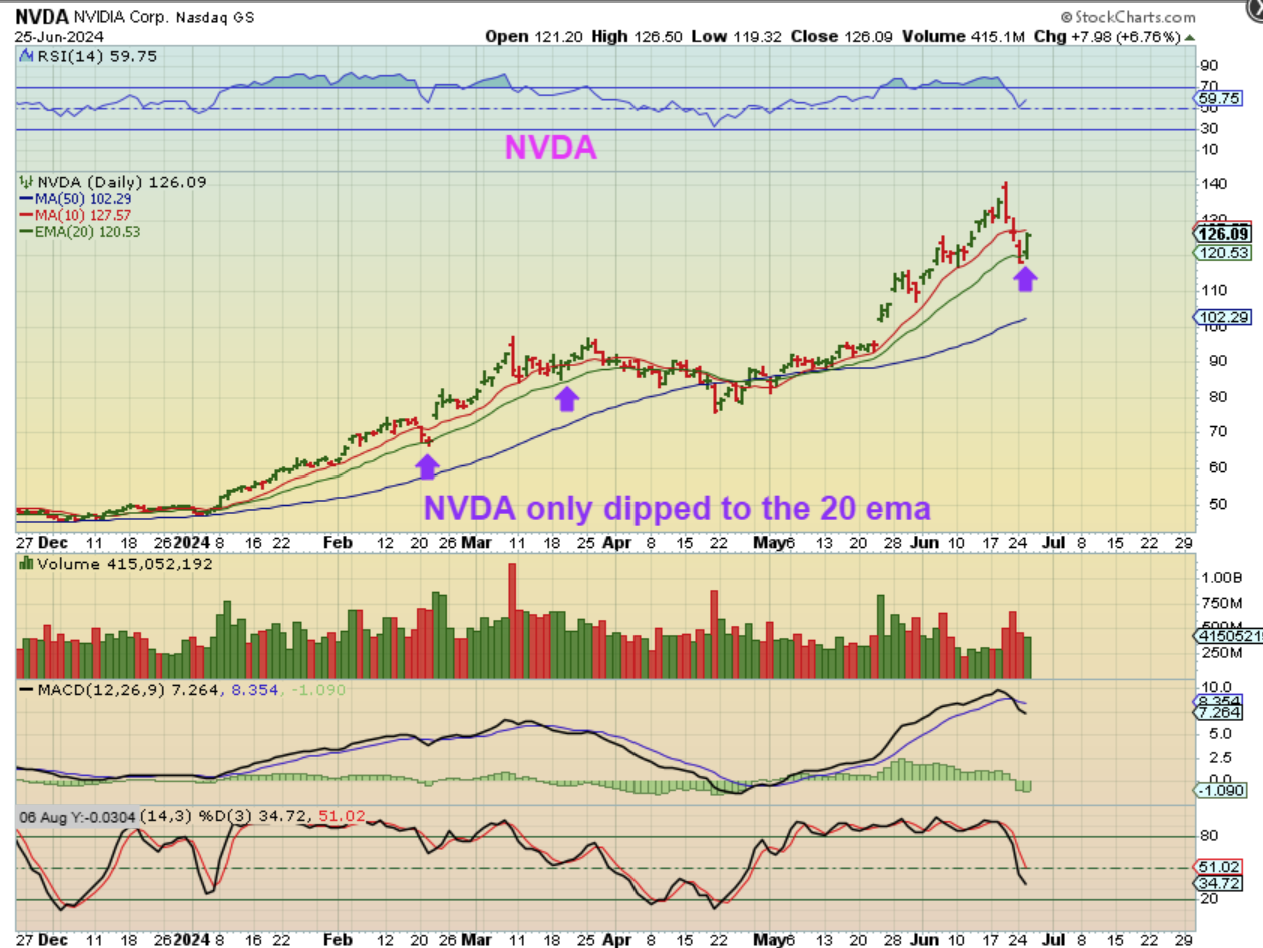
When we got the ICL in April, I did mention buying old faithful stocks like NVDA, GOOG, etc, out of an ICL ( I did not personally buy them, but they have done very well after each ICL). So let’s just look at NVDA.
.
Look at NVDA out of that April ICL. You could have entered at $80 and it is now $140 (GOOG ran from $130 to $180). What I wanted to point to, however, was the dcls. NVDA just dropped to the 20 ema. Notice that it didn’t lose the 20 ema on any of the dips Jan to April, and it just fell there today & reversed too. That was a big 3 day drop recently, so is that all that we get now? All I can say is that you could just continue to raise your stops on the ‘long’ positions with the General Markets and let them ride. If you sold, you could buy this reversal with a tight stop at the lows. We still may sell off after Thursdays Jobs Report and a true dcl should turn the 10sma lower. We haven’t seen that yet.
.
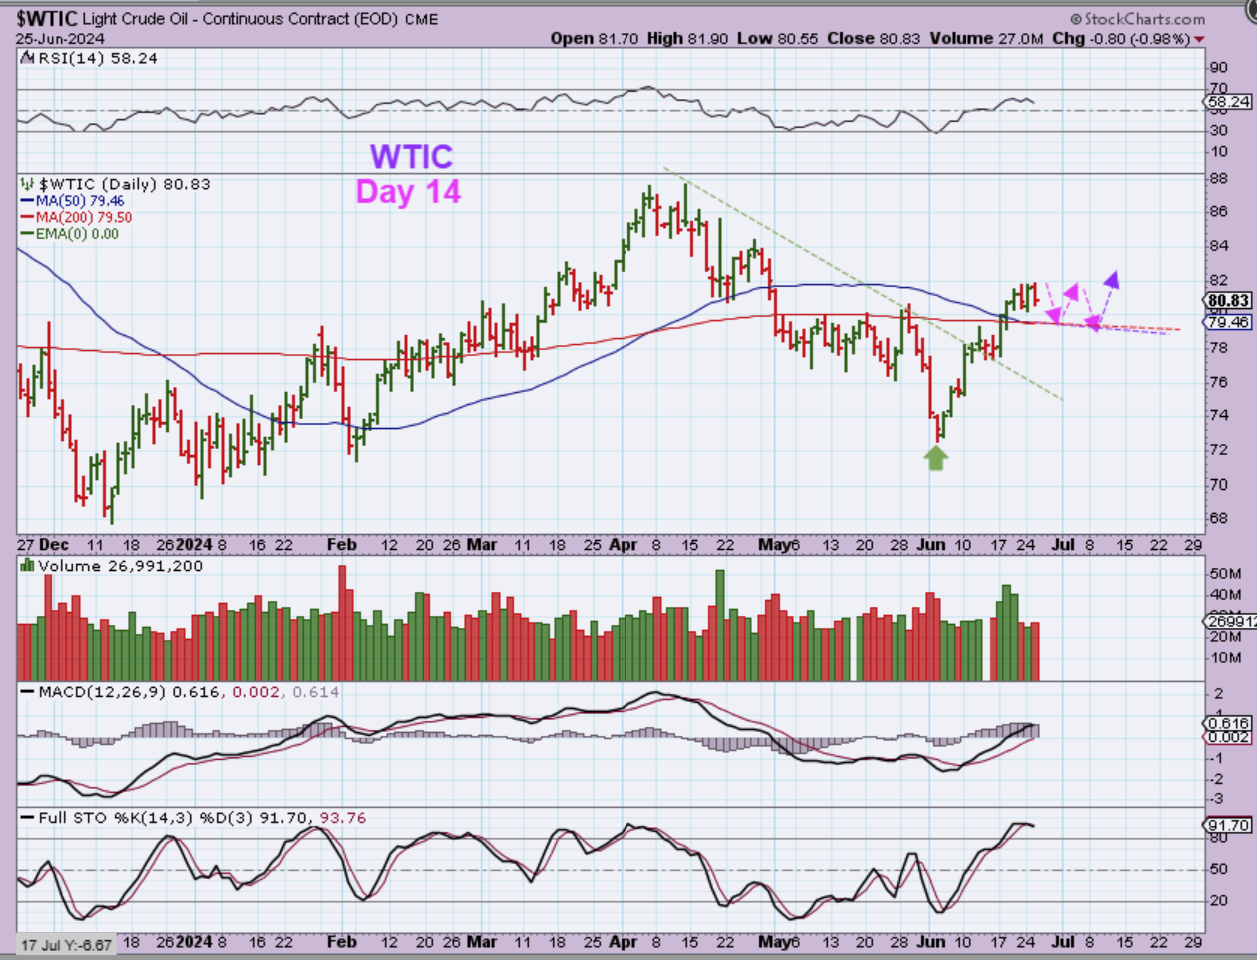
WTIC – Oil dropped, but it did bullishly break the downtrend and 50 & 200sma earlier in this run. We could back test and crawl in that area.
.
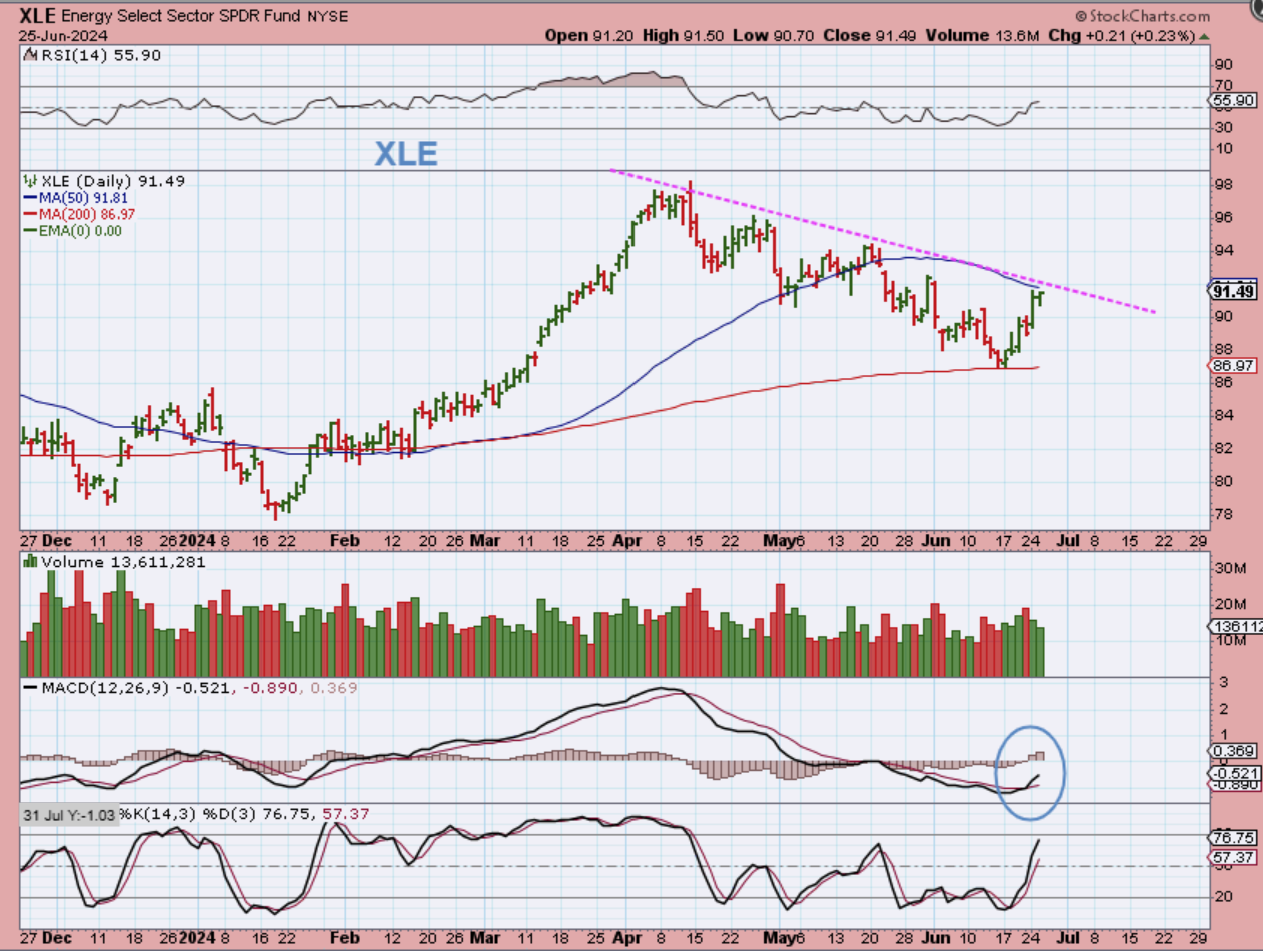
THE XLE was green, but only very slightly green. It was up 21 cents and that wasn’t enough to break above that 50sma & downtrend yet. The MACD & RSI are bullish now though.
.
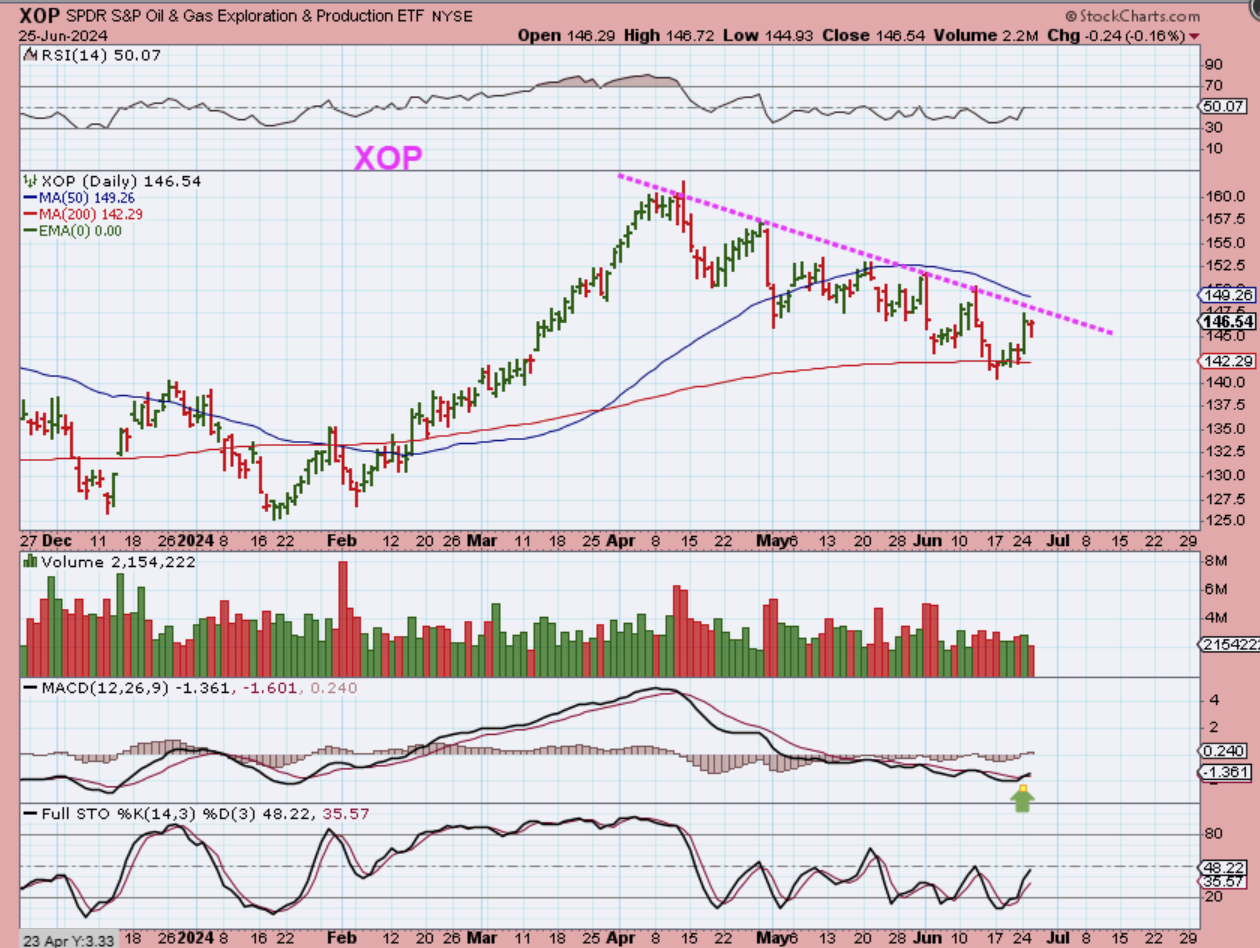
THE XOP dropped and bounced back. It also is under a downtrend line, but the MACD just turned upward & crossed over..
.
YESTERDAY I SAID:
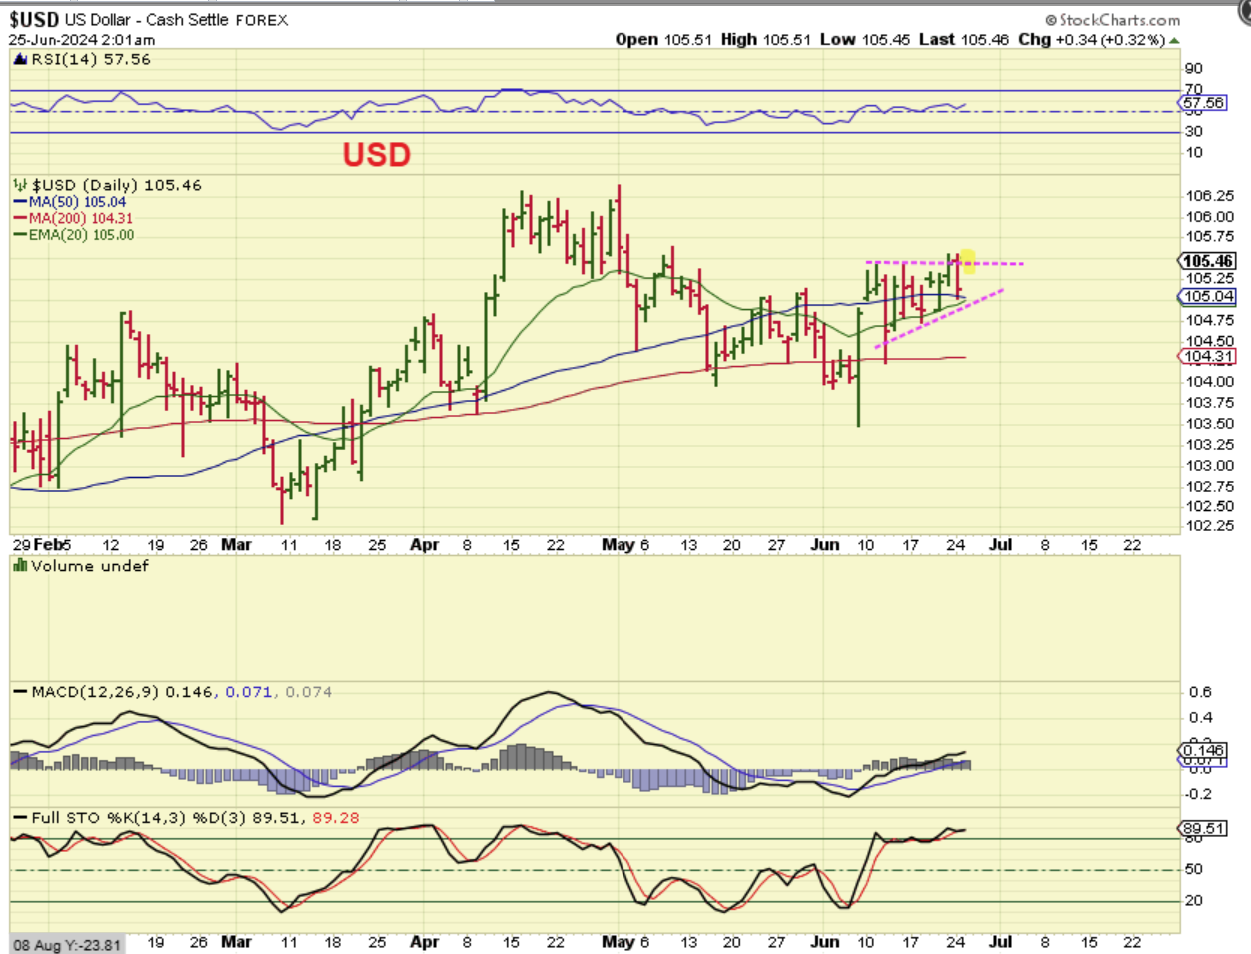
THE USD started to break out of this pattern, but it ended up dropping back down to the 50sma for now.
.
THE USD REALLY DID NOT CHANGE, IT TURNED UP, BUT REMAINS IN THAT PATTERN SO FAR
.
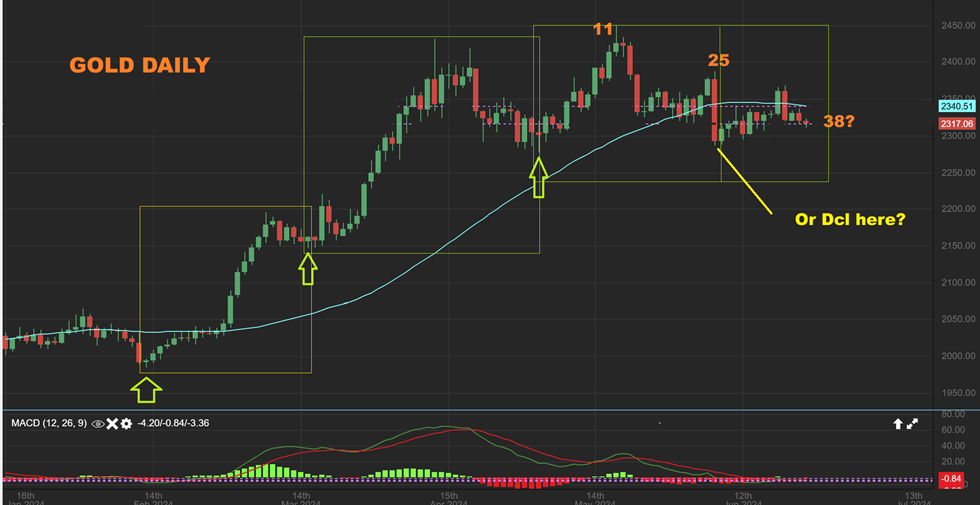
GOLD is chopping and it is just making some very small moves at this time. We had a sharp drop on day 25, and honestly, that could be a dcl, but it will take time to know for sure. What we see with Gold is this…
.
What we see with Gold is this:
1. If day 25 slam down is NOT a dcl, then we are on day 38 (it is getting quite late and should drop lower this week).
2. If we DID get a day 25 dcl, then we are only on day 12. We’d have a day 9 peak as it broke the 50sma & lost it the next day.
3. We just have to let this play out, but that false break out makes me feel that this is going lower sooner than later
.
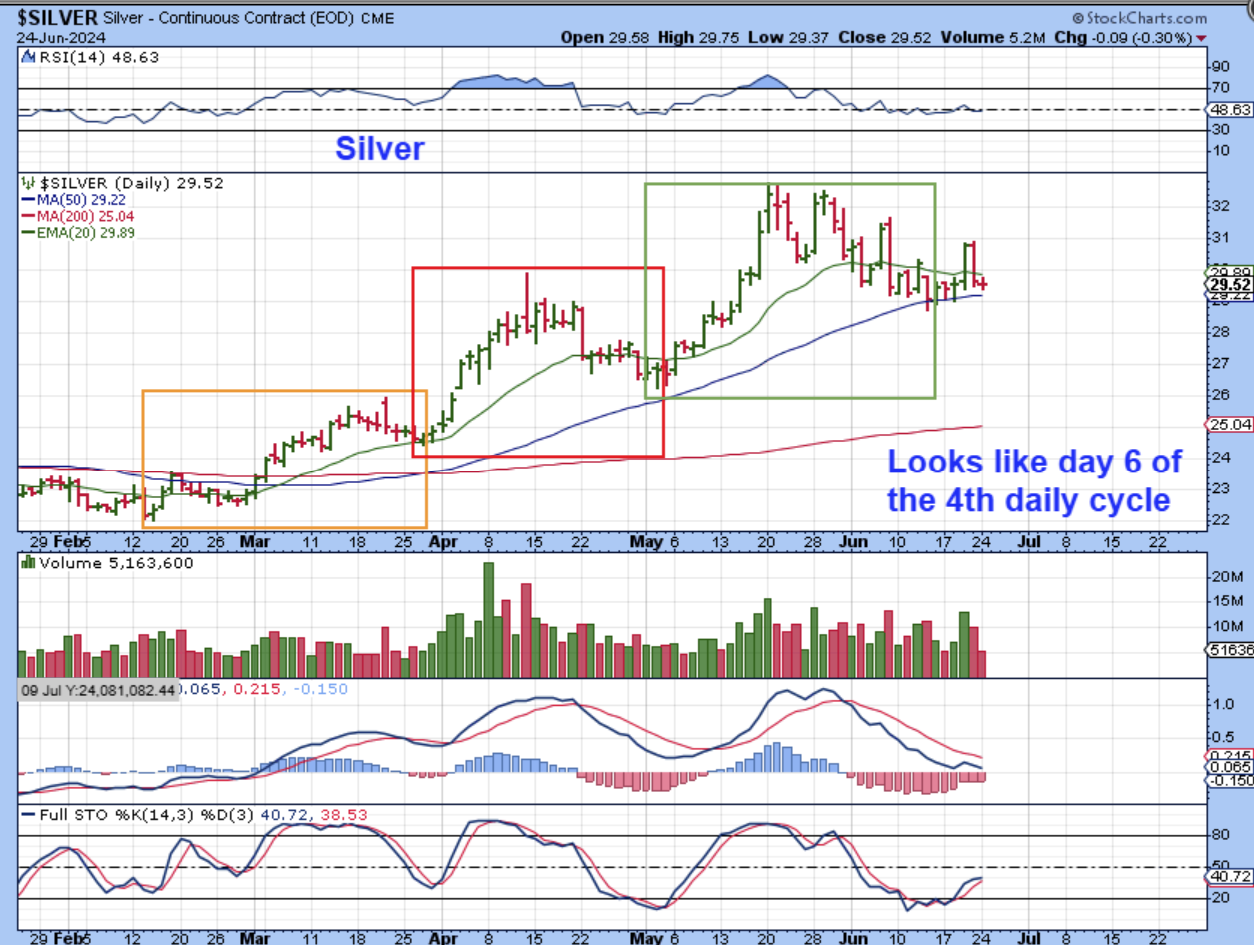
This is what I said about Silver yesterday:
.
SILVER is crawling along the 50sma so far. This looks like day 6 of the 4th daily cycle…
.
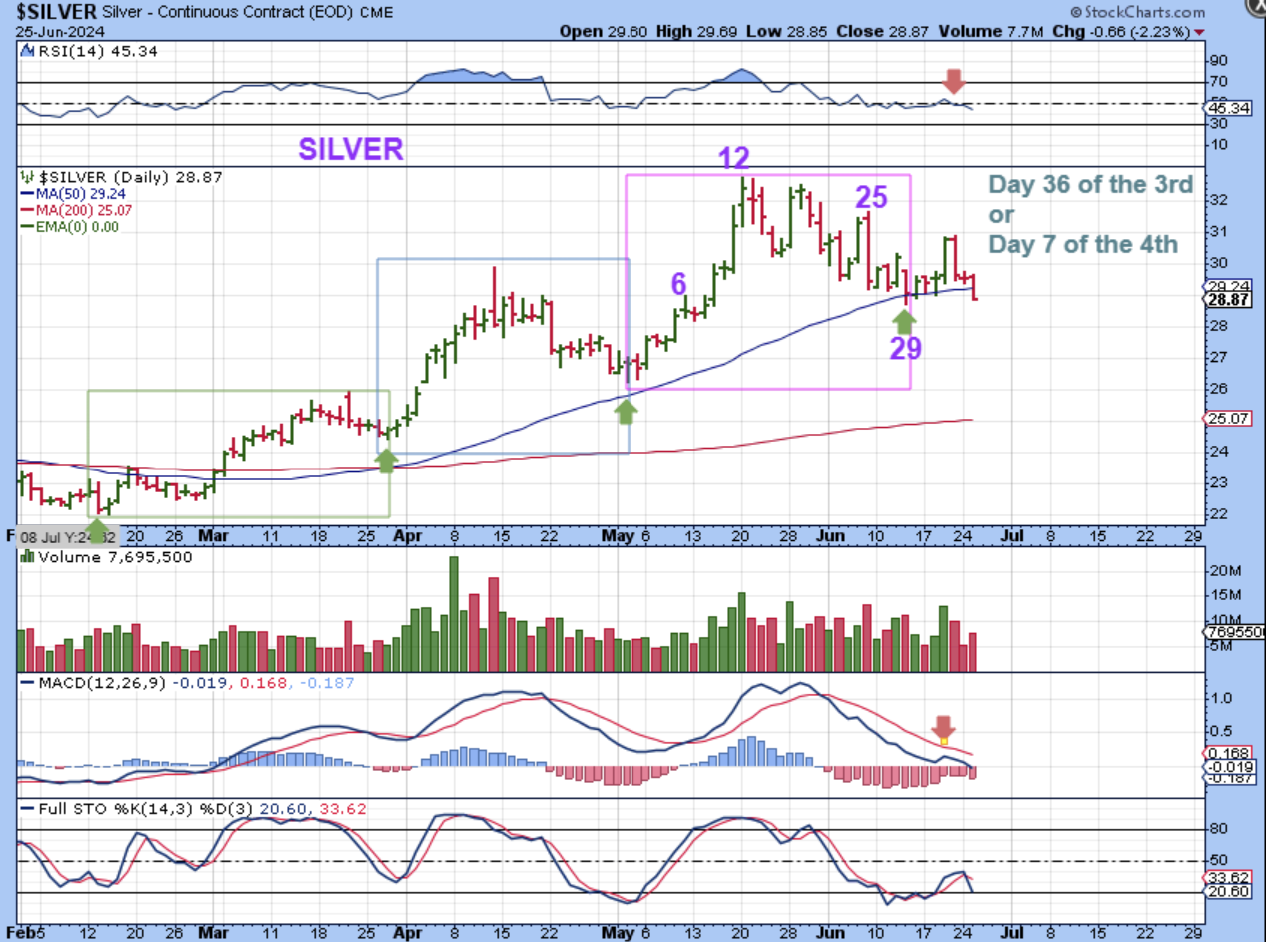
SILVER dropped on what could be day 7, and lost the 50sma. So this would be day 7 of the 4th daily cycle, with a day 5 peak. This would lead to an ICL drop and it could be rather unpleasant if you are long.
.
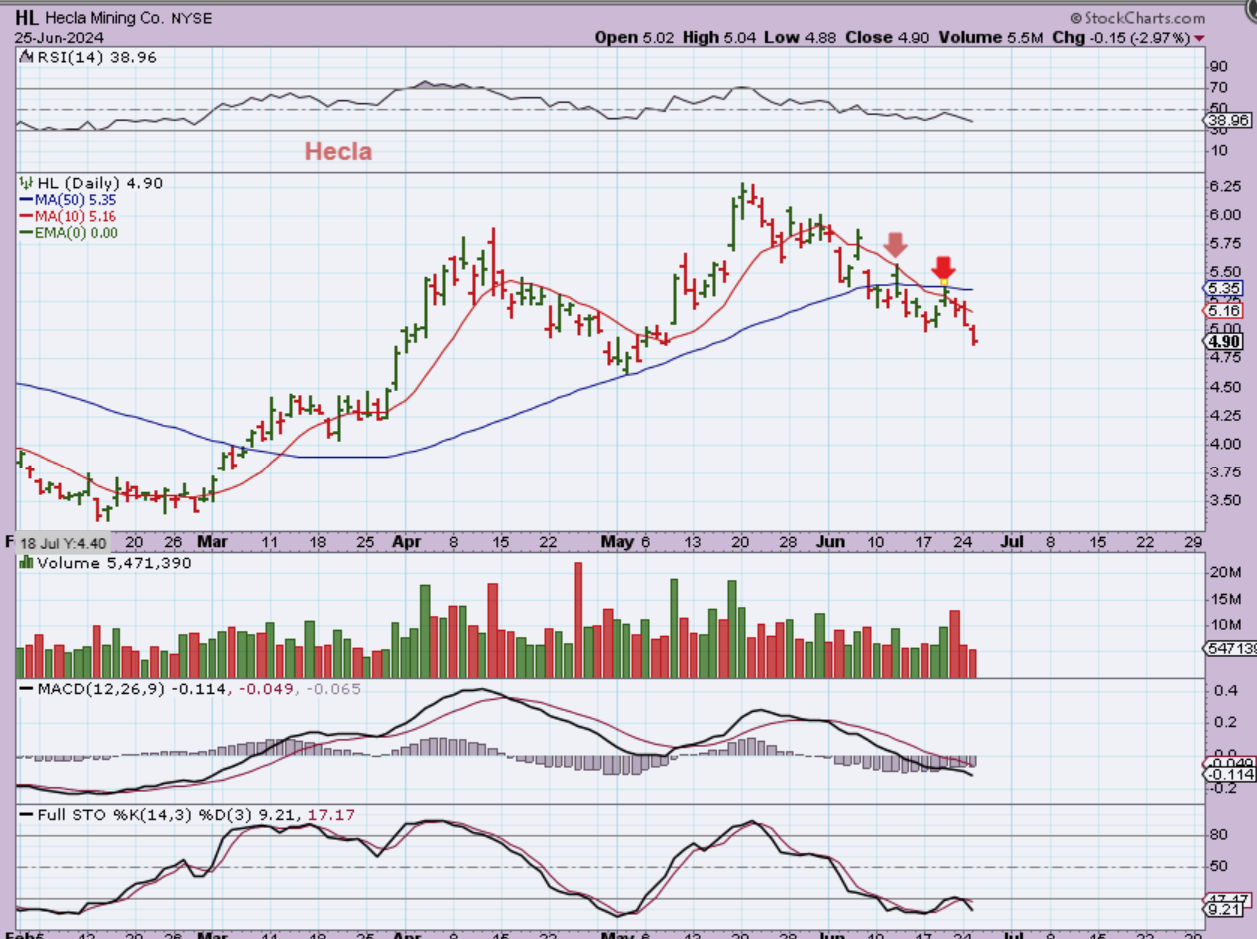
HL: Some Silver Miners seem to already be signaling the coming weakness of an ICL drop into July.
.
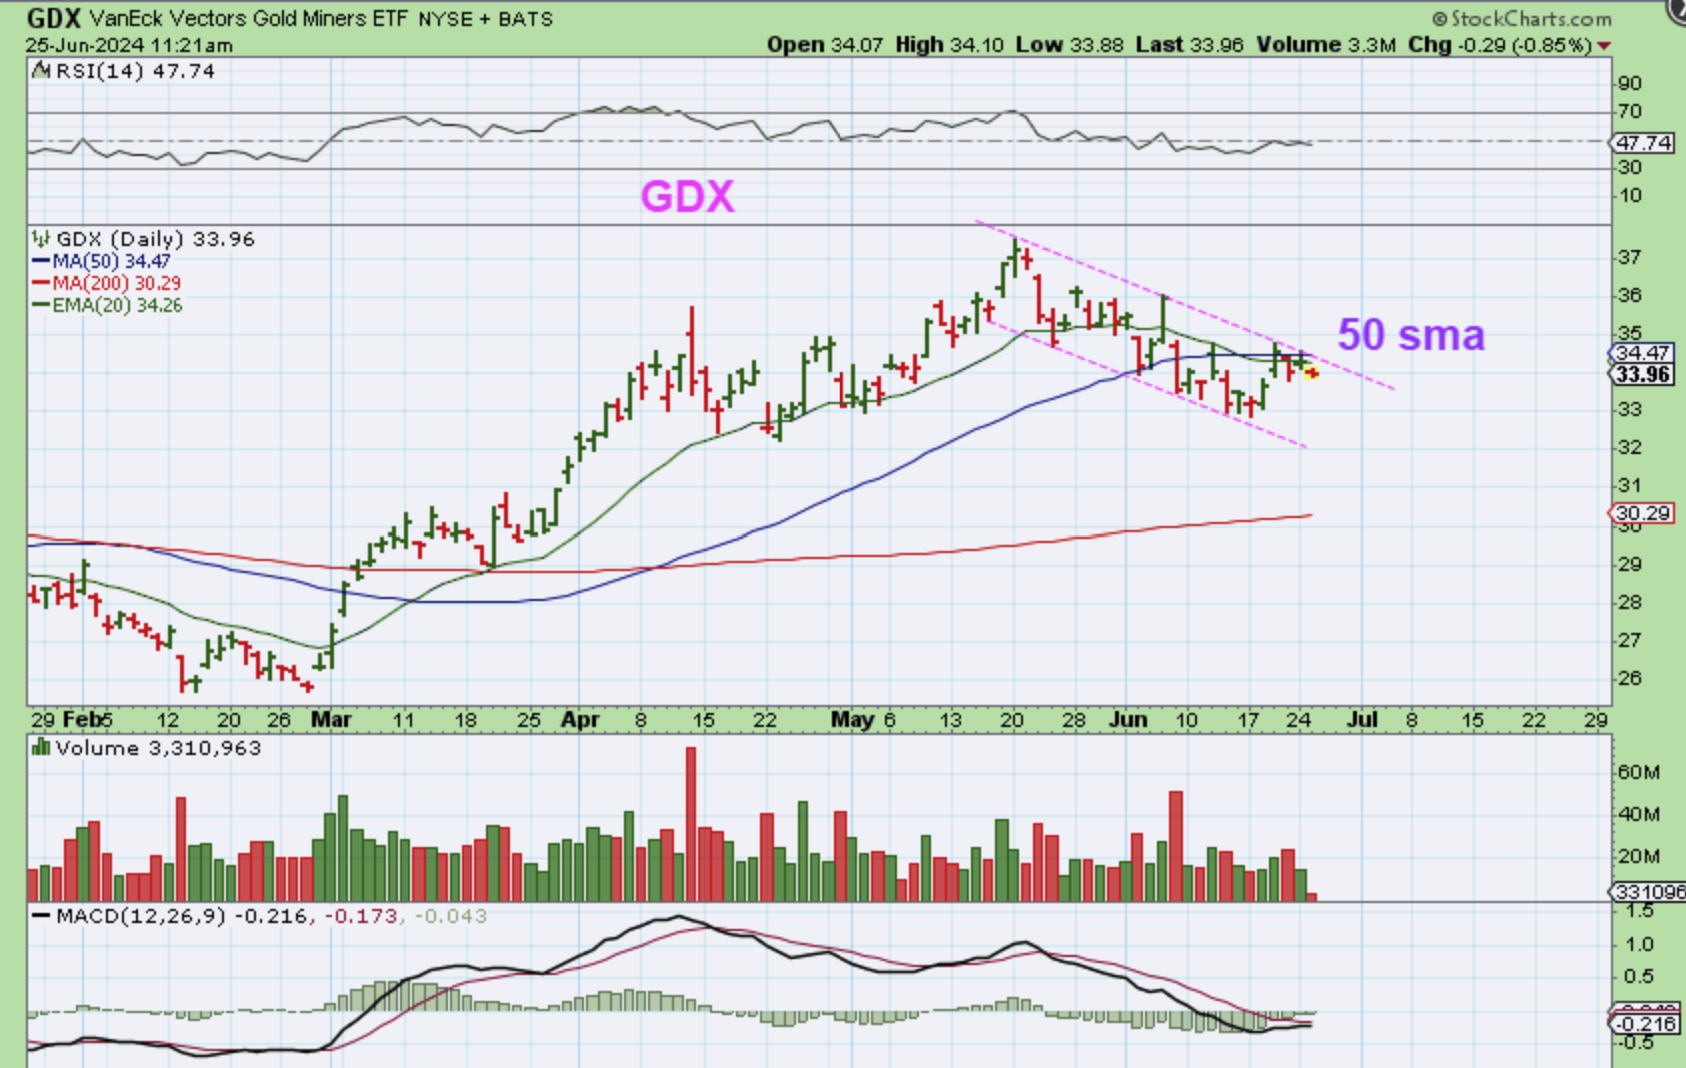
GDX at 11:37 am – I was mentioning in the commenting section that GDX is pushing on the 50sma, but it looks ready to be ‘shorted’ (using JDST or DUST). It is definitely at resistance and you’d use a stop above the 50sma. GDX was at $33.96, so How did the day end?
.
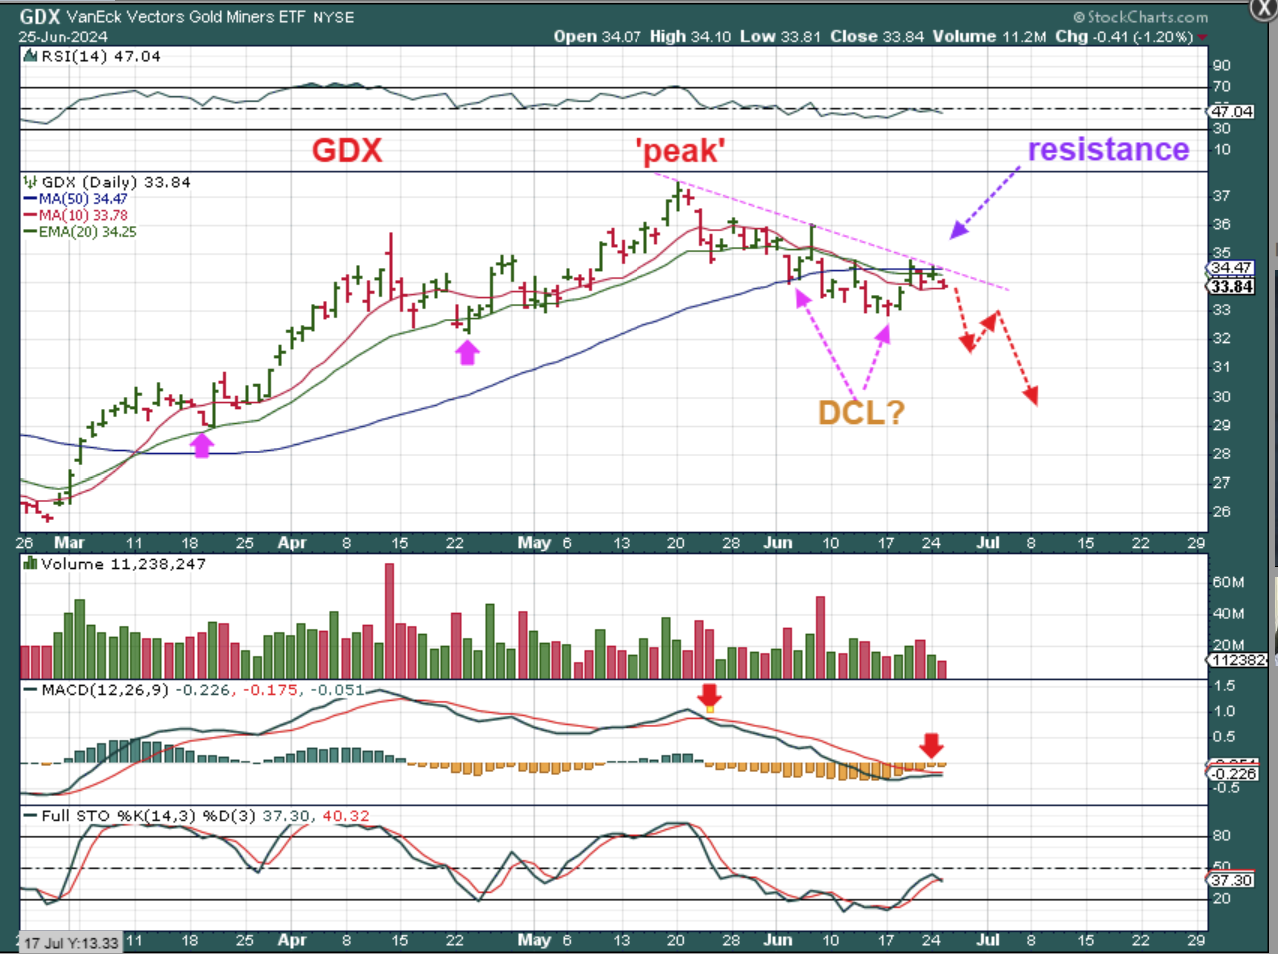
GDX closed down 41 cents at $33.84, and it is struggling at resistance. Did the dcl come in back in early June or recently? It’s hard to say, but this should be weak, not strong, and we should see lower price action over time. We COULD bounce, but I do doubt that GDX can take out the 50sma now.
.
So we are patiently waiting to see if we get more of a dip in the General Markets and in Bitcoin, and we are also definitely waiting for more of a dip in the Precious Metals Sector too. A deeper dip would help to identify a dcl in the General Markets, but todays data really doesn’t seem like it would cause any additional selling. Thursday and Friday’s data may help, since it is more related to the economy and the possibility of the Feds making an interest rate cut or not. So for the Miners, we are starting to see them act heavily, instead of giving us ‘surprises to the upside’, they are chopping along sideways. We will start a faster drop into a dcl, likely an ICL soon, but after we dip down into an ICL with Gold & Silver, the stronger rally will begin again and THAT will be a strong buy that you do not want to miss. I’ll discuss Bitcoin below. Enjoy your Wednesday trading.
.
~ALEX
.
FROM A PRIOR REPORT: I said…
.
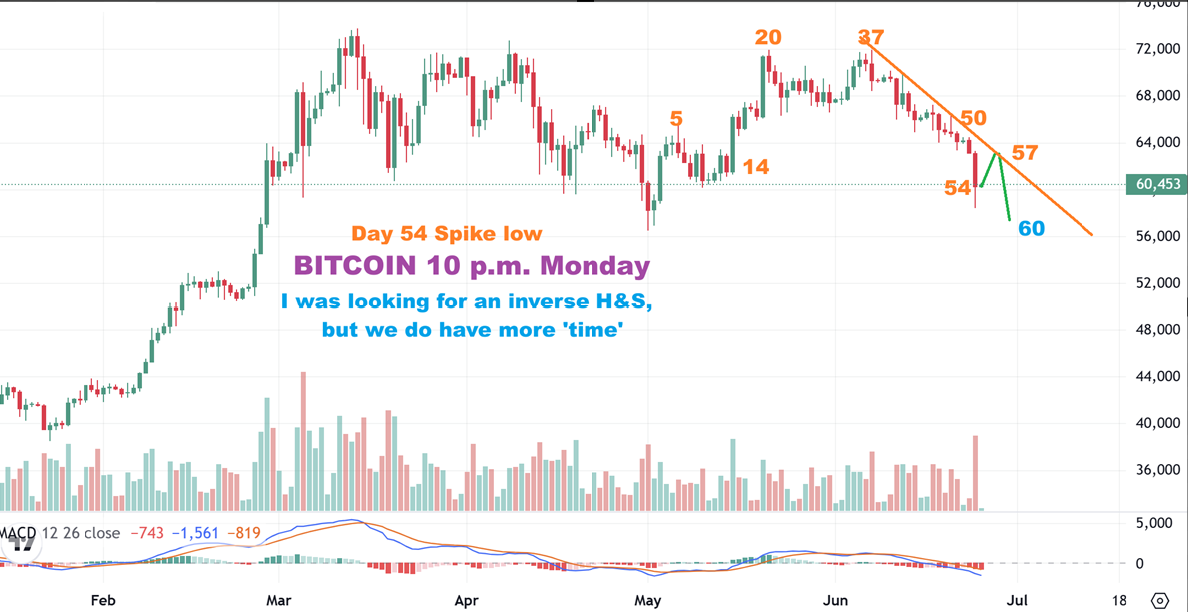
BITCOIN – If we are looking for a day 60 or maybe even let’s say a 63 day daily cycle, then we may have more time to sell off. I am drawing this as a bounce out of this reversal candle, then we may only tag the downtrend, followed by 1 more drop to day 60 or day 60 plus low.
.
I ALSO SAID:
.
BITCOIN: If day 54 with that high volume spike low/reversal candle does satisfy the timing enough, then we’d have a dcl right now. What I would say is this…
1. You can always buy these strong reversal candles with a stop at the lows and see how it goes, but if we drop again it can be frustrating, or
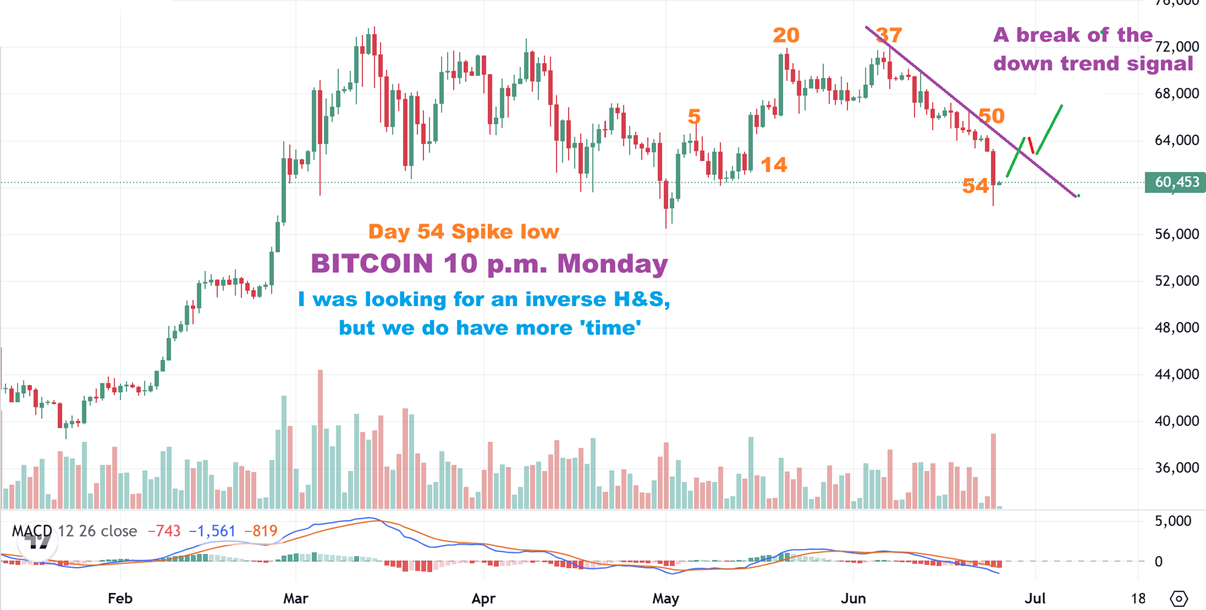
2. Wait for a sign of strength in Bitcoin, and a break of that overhead trendline is a good signal that a dcl is likely in place and a rally can unfold from here. And as I have mentioned, some Crypto stocks (WULF, SDIG, HUT, for example) are resisting the selling a bit. In fact, can you believe that those were even green with Mondays 5% SLAM DOWN? THAT is hard to believe, right?
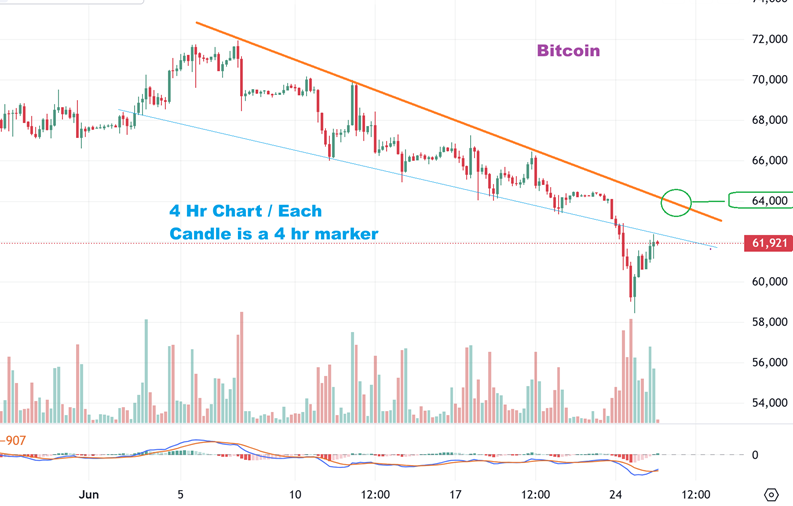
SO THIS IS THE 4 HOUR CHART FOR BITCOIN – That bounce out of the low has begun.
If this is aDCL, then this would be a false break down and recovery, then you’d look for that downtrend break. If you bought this low, you could also sell some at the downtrend (if we get there) and add back in if we then get the breakout. It looks like $64,000 Bitcoin is the point of interest.
.
BITCOIN DAILY : Bitcoin broke down and has recovered and today it is pausing so far. That would be a day 54 low, and that might be the dcl, since it formed as a high volume plunge and the selling has now dried up. Time will tell.
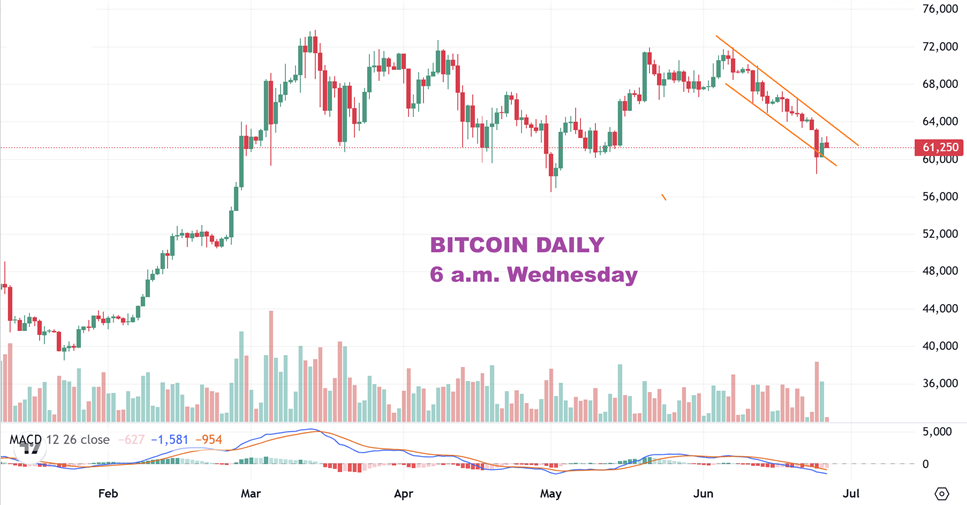
After mentioning that we can buy those reversals and also mentioning in past reports that some cryptos are NOT selling down with Bitcoin at new lows, I continue to see bullish price action in some of the crypto-related stocks…
.
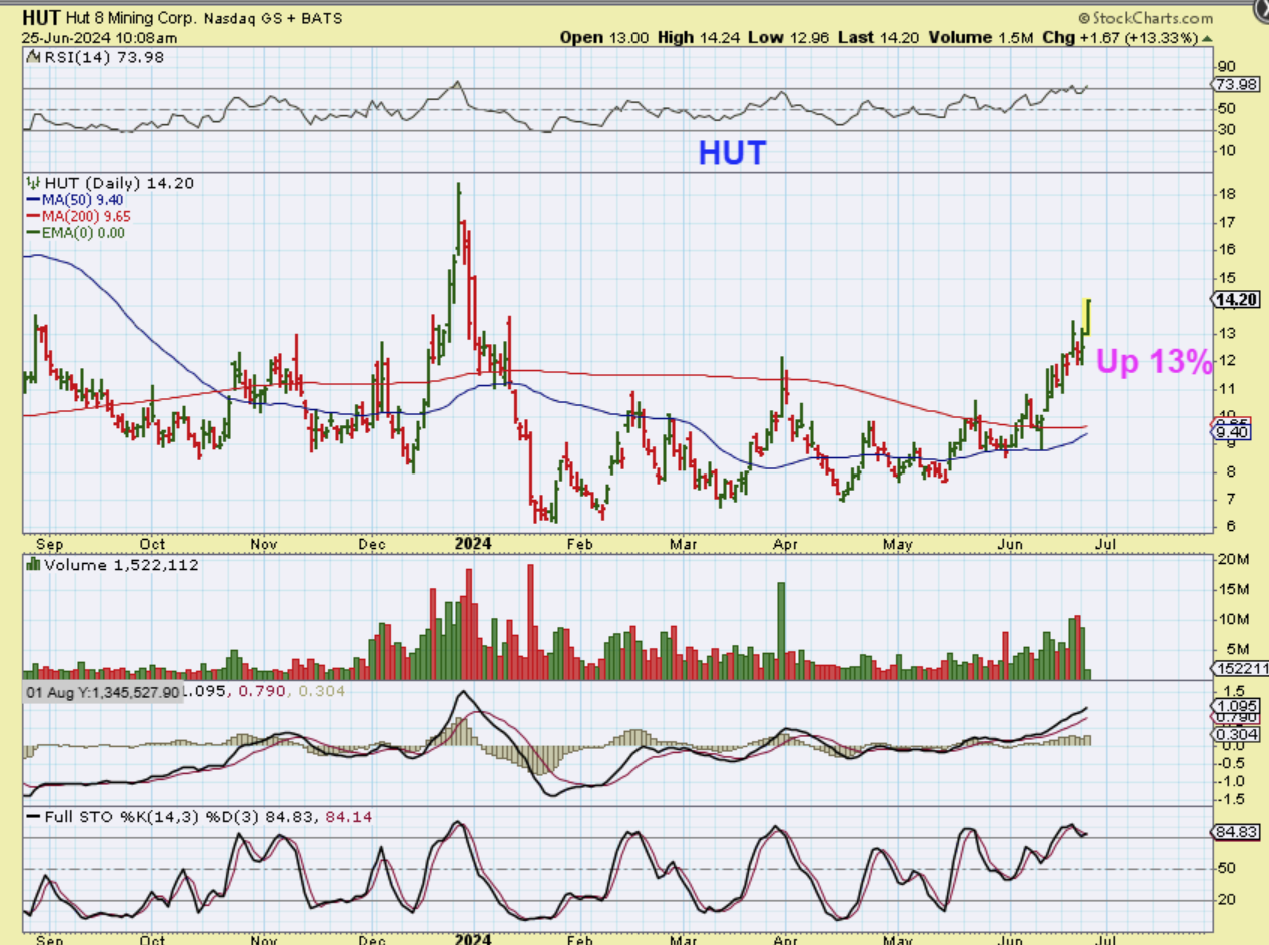
HUT after 1/2 hr of trading, was up 13% yesterday. Remember that it was in the report as being Up on that slam down Monday too. HUT was up almost 20% later in the day, and then closed up 16%. I have had this one in the last few reports as a breakout and as one that is leading the way apparently.
.
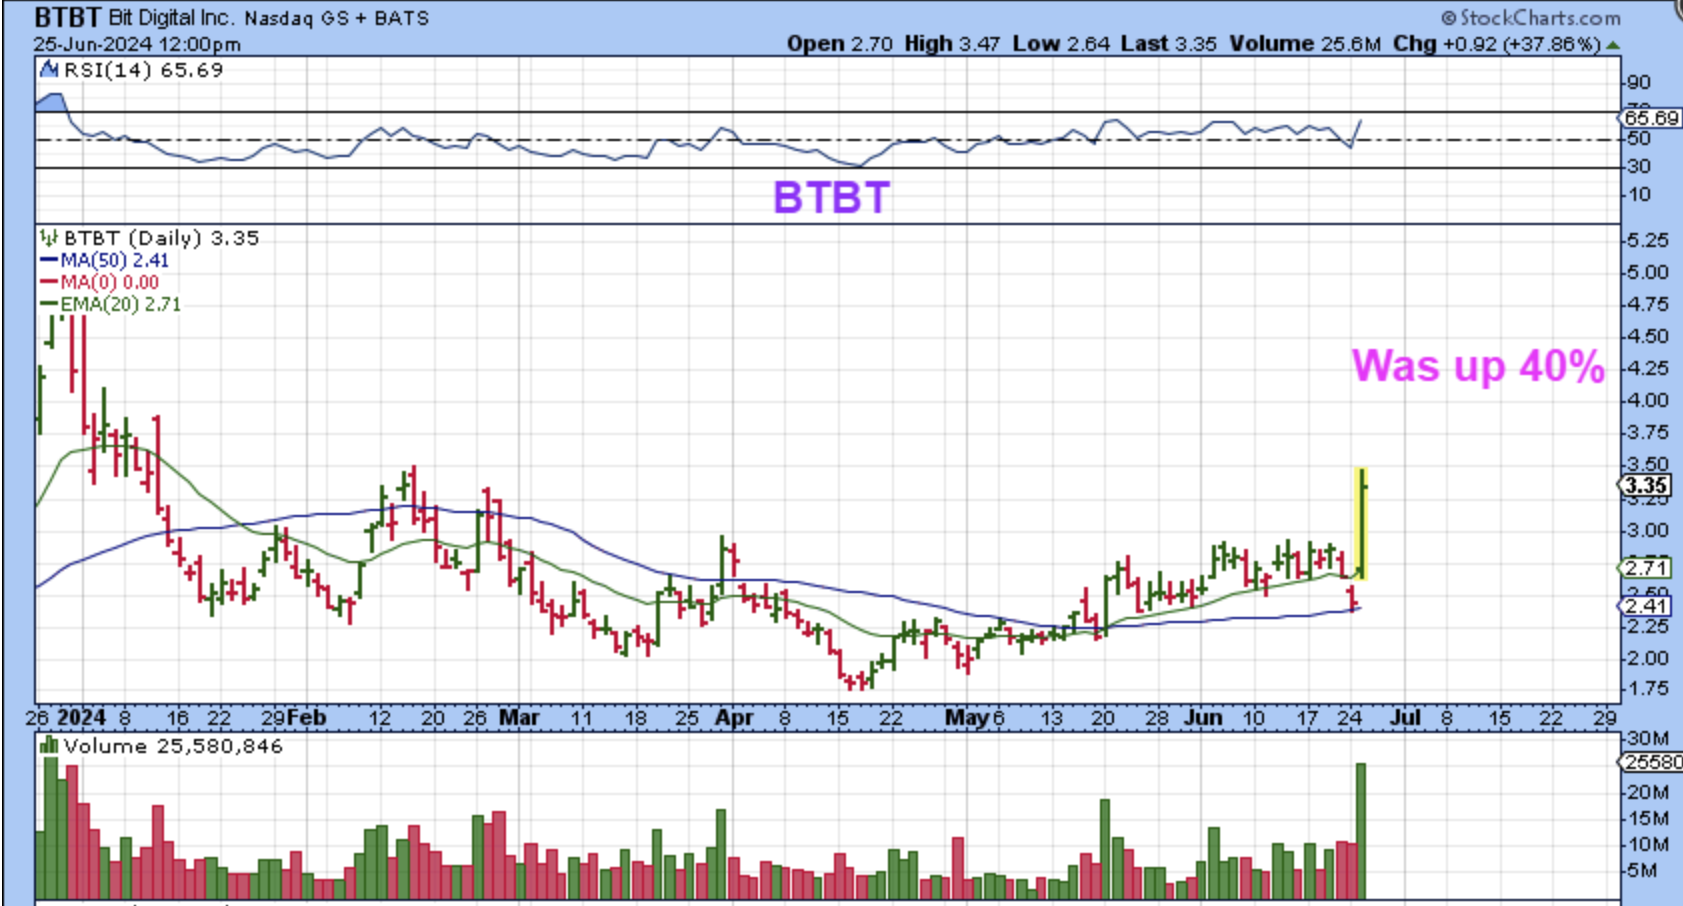
BTBT 10:20 a.m. – I owned BTBT, but sold it when it gapped down below the red 200sma to be safe. Now it gapped up BIG TIME, and BTBT was up 20%, so I couldn’t really buy it back, and…
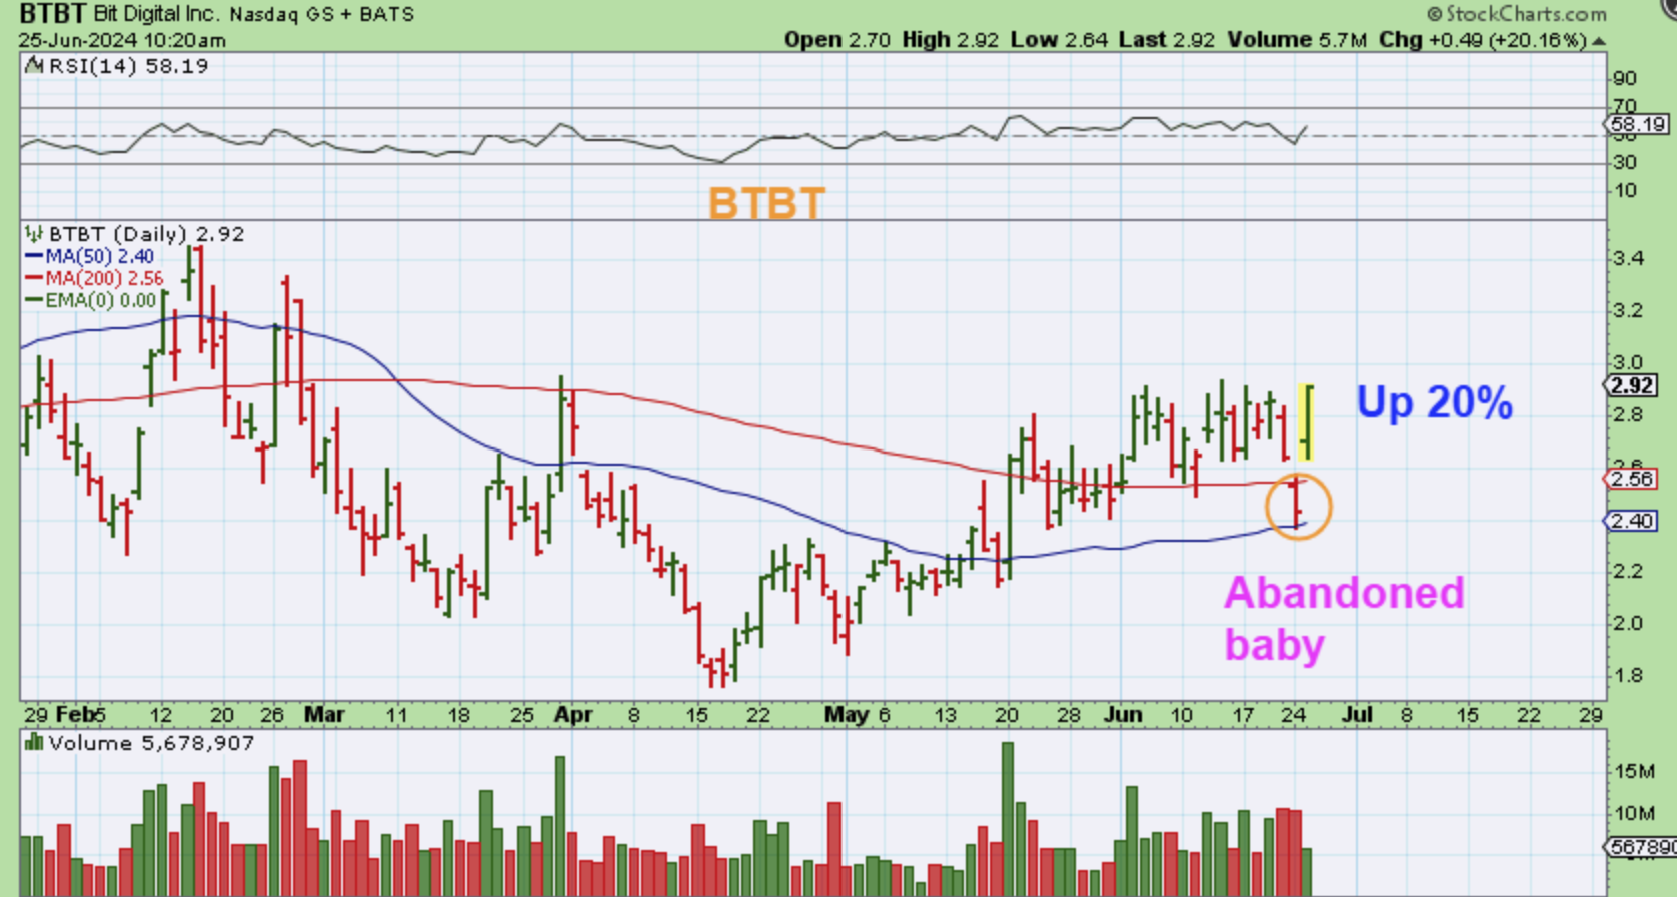
.
Then BTBT was up 40% by midday. This is why I have said repeatedly that these can be the hardest trades I’ve ever done. I sold my BTBT to be safe and it formed an abandoned baby and was up 40%. WOW!
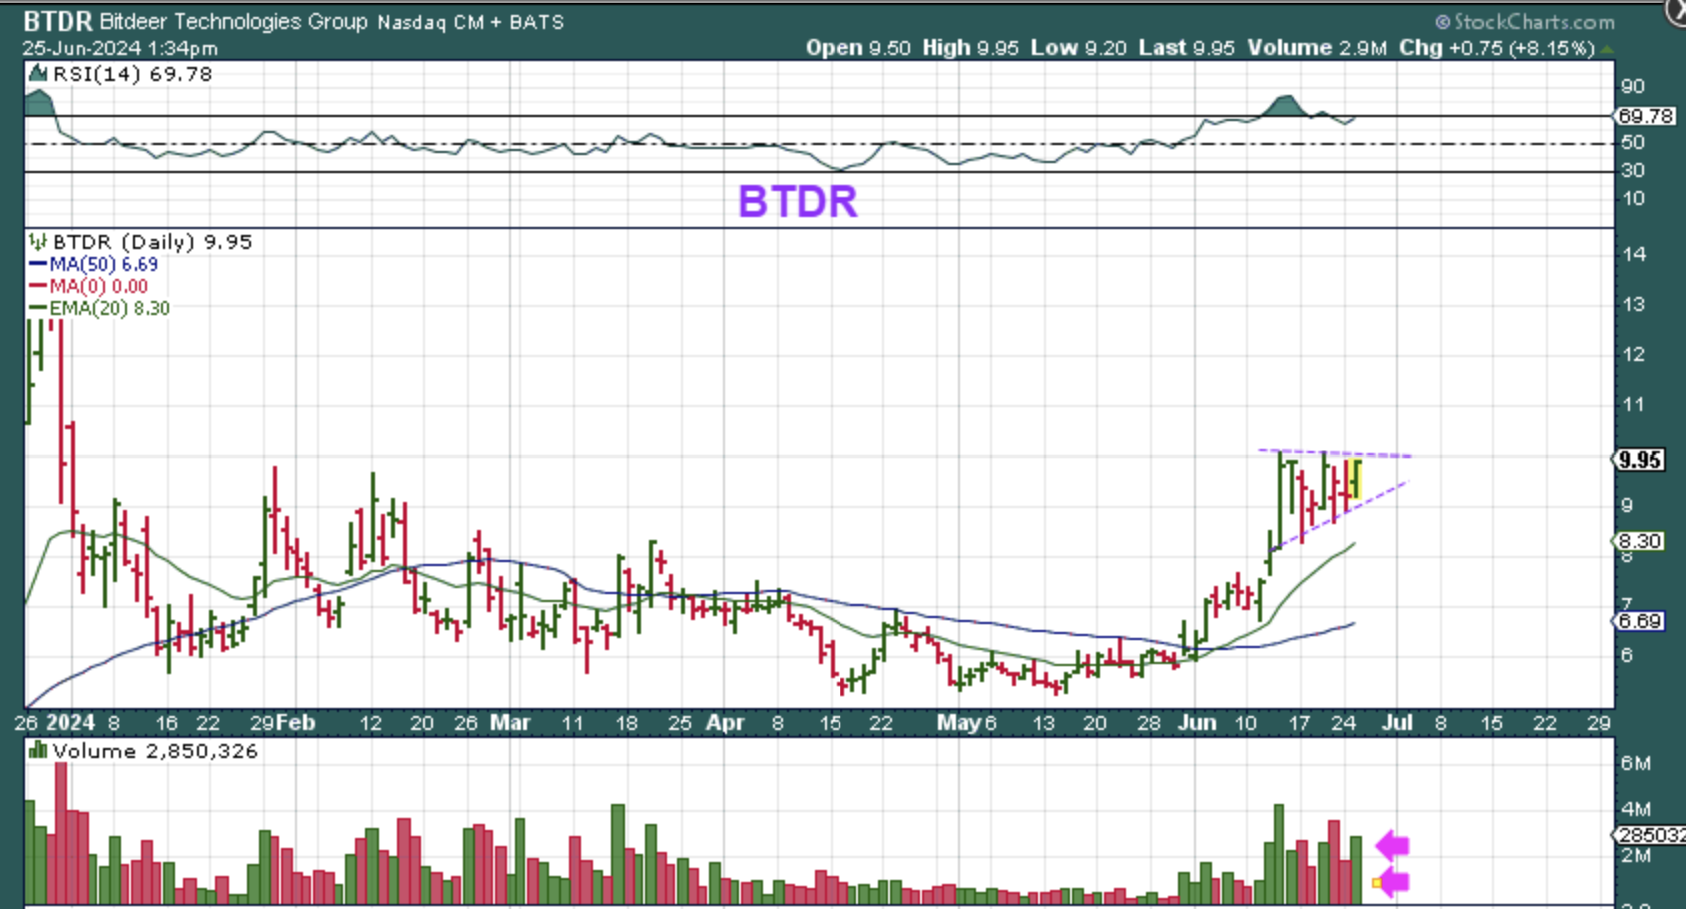
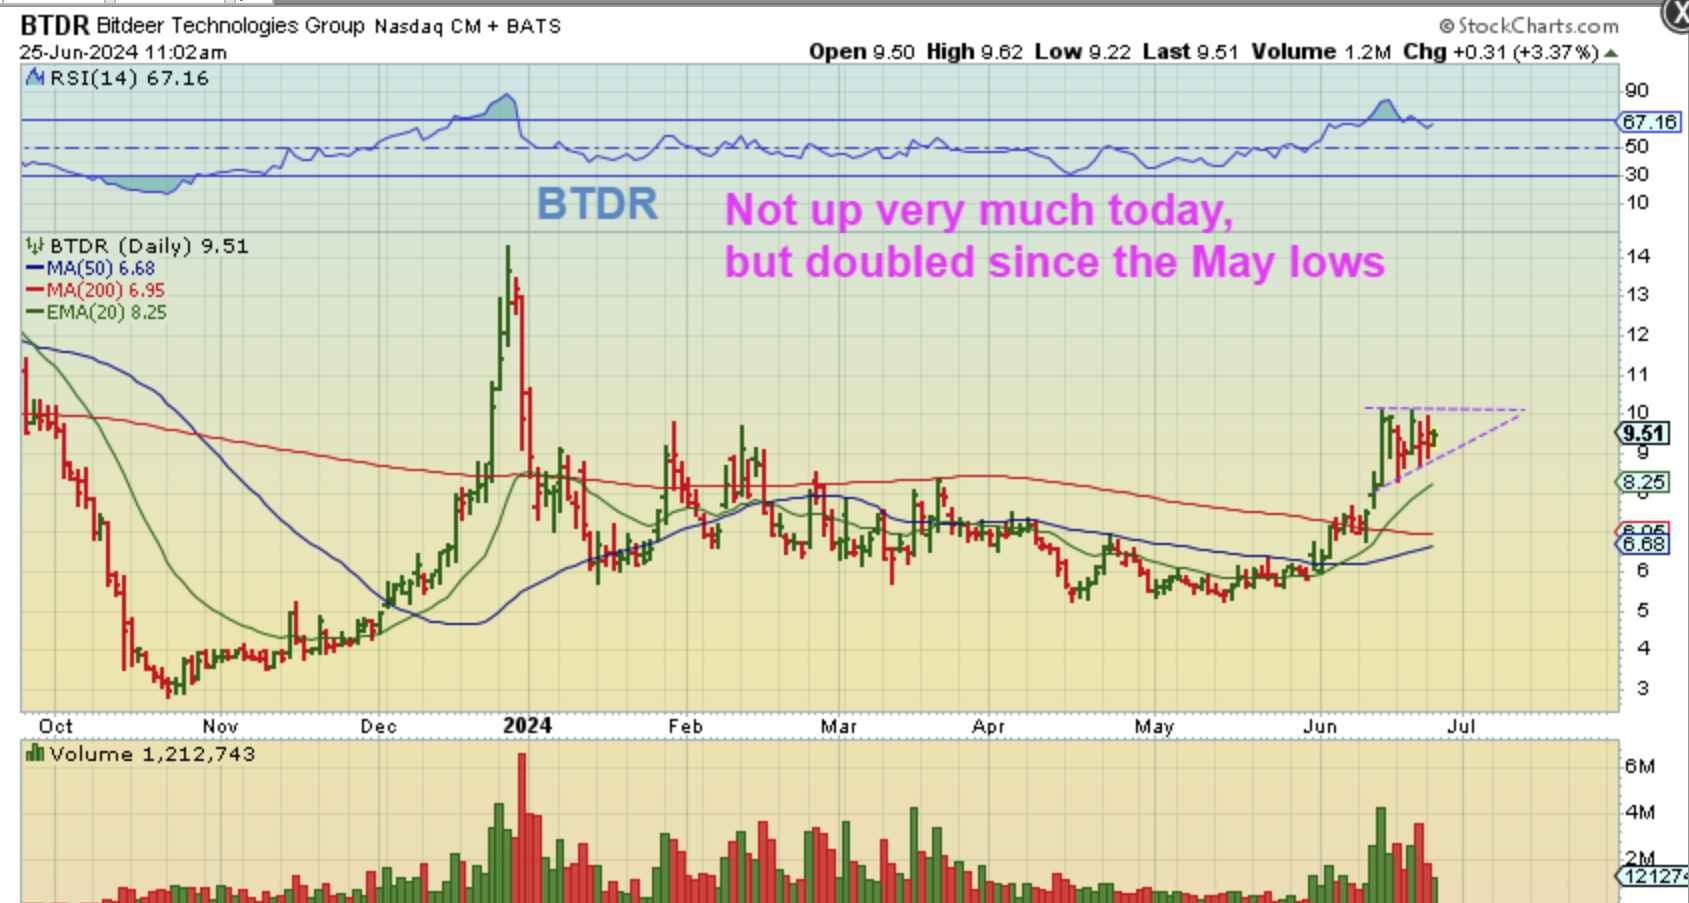
BTDR 11 a.m. – This was in recent reports too, forming a Bull pennant. I posted this in the comments after over an hour of trading and I was lamenting that it wasn’t up much. I did say then that I expected it to continue higher.
.
BTDR – By midday, it was up 8%. It closed up 9% and is back at the highs of that pattern. Again, take a look at this chart. It is well off of the lows and forming a bullish pennant, with Bitcoin at the latest 60 day cycle lows. These stocks are showing bullish price action.