
Thursday May 30th – A Cautionary Reminder
.
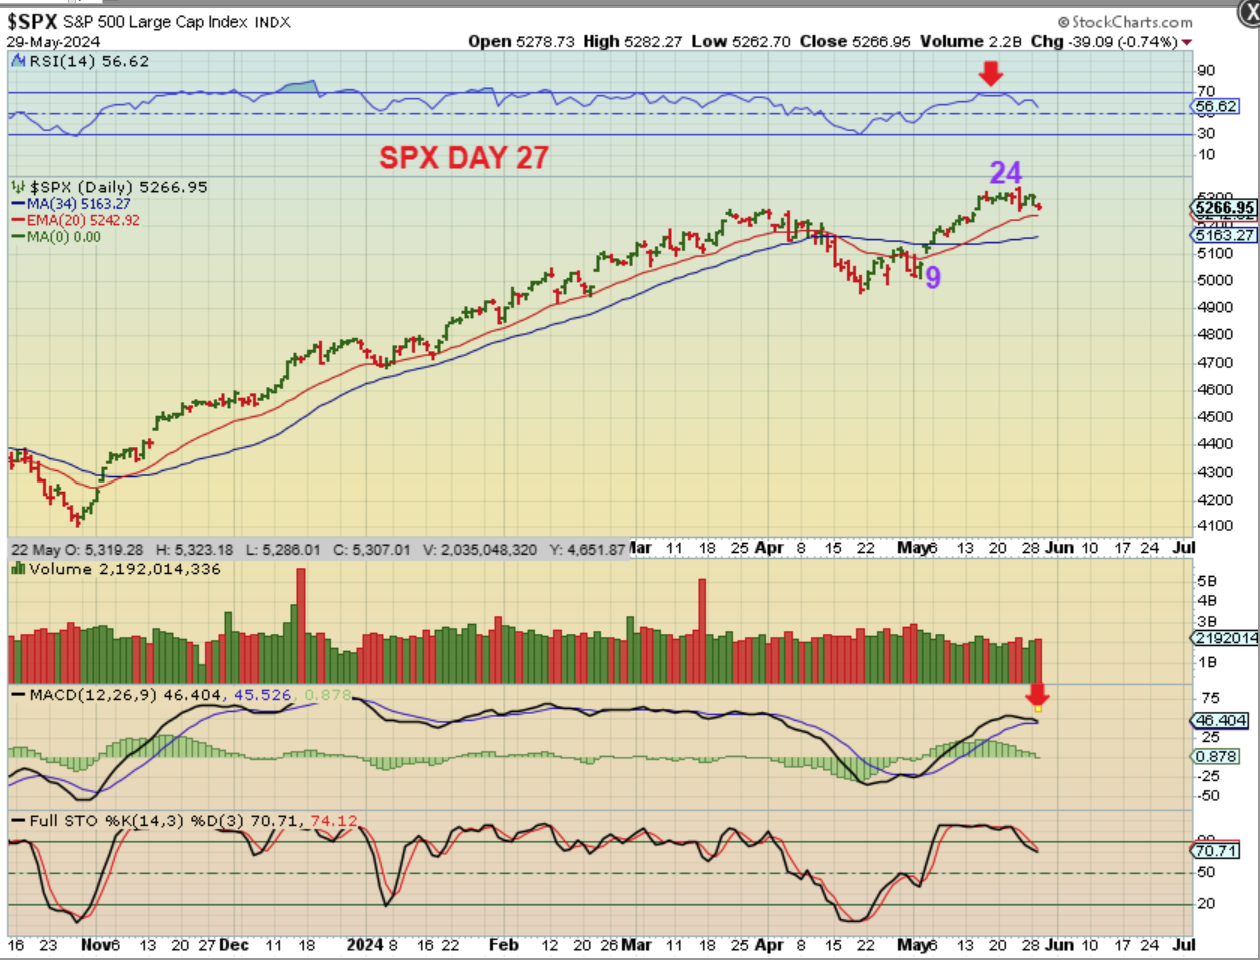
THE SPX is still near the all-time highs and this is day 28 today. I want to discuss something as a reminder as this market churns sideways…
.
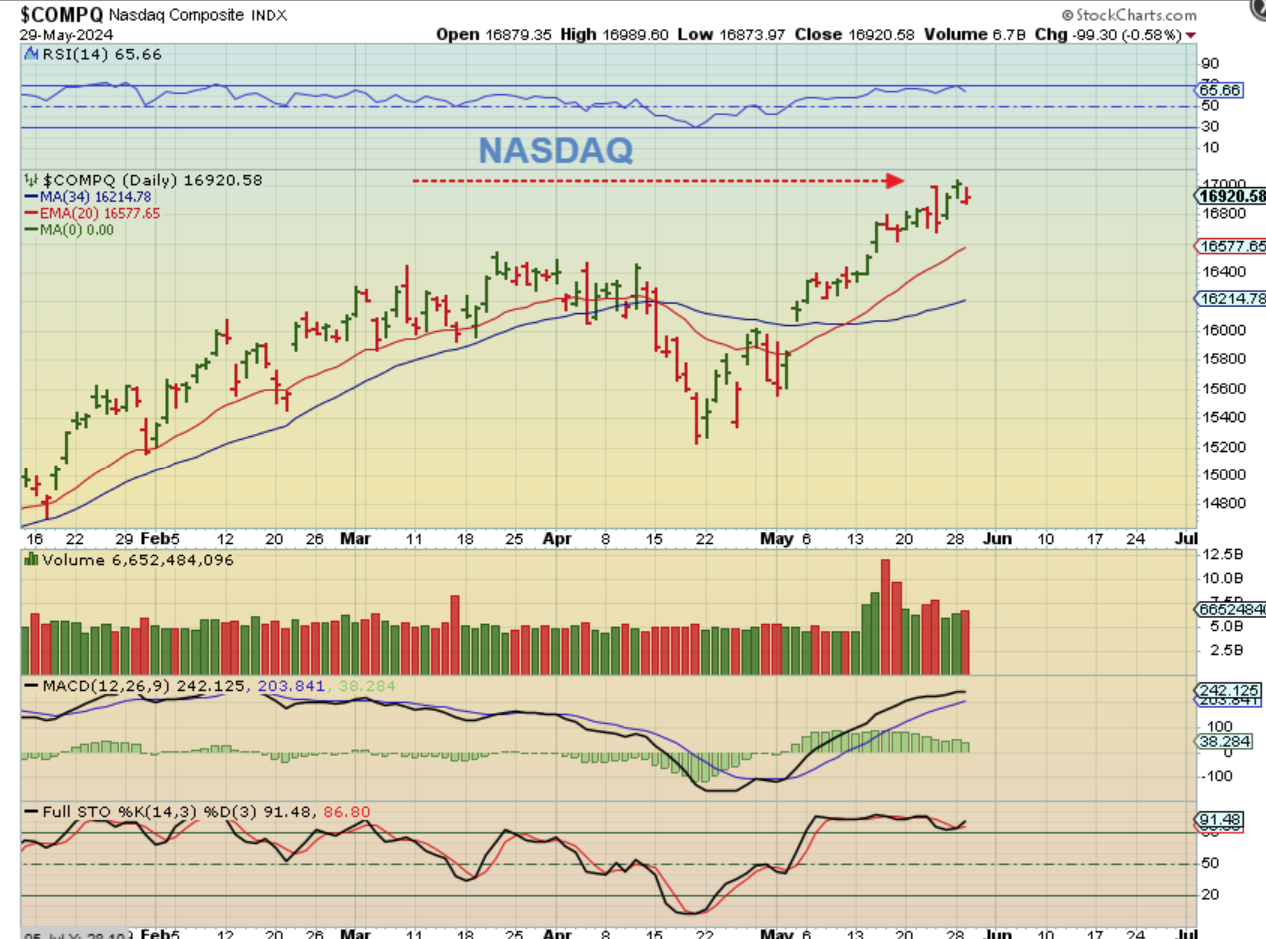
The NASDAQ is also near or at all-time highs, but we do see some heavier volume that could be ‘distribution at the highs’. It seems to early to be discussing a top, after a strong run out of an ICL, but as a reminder- we discussed the ‘DOW THEORY’ recently. Do you remember that discussion?
.
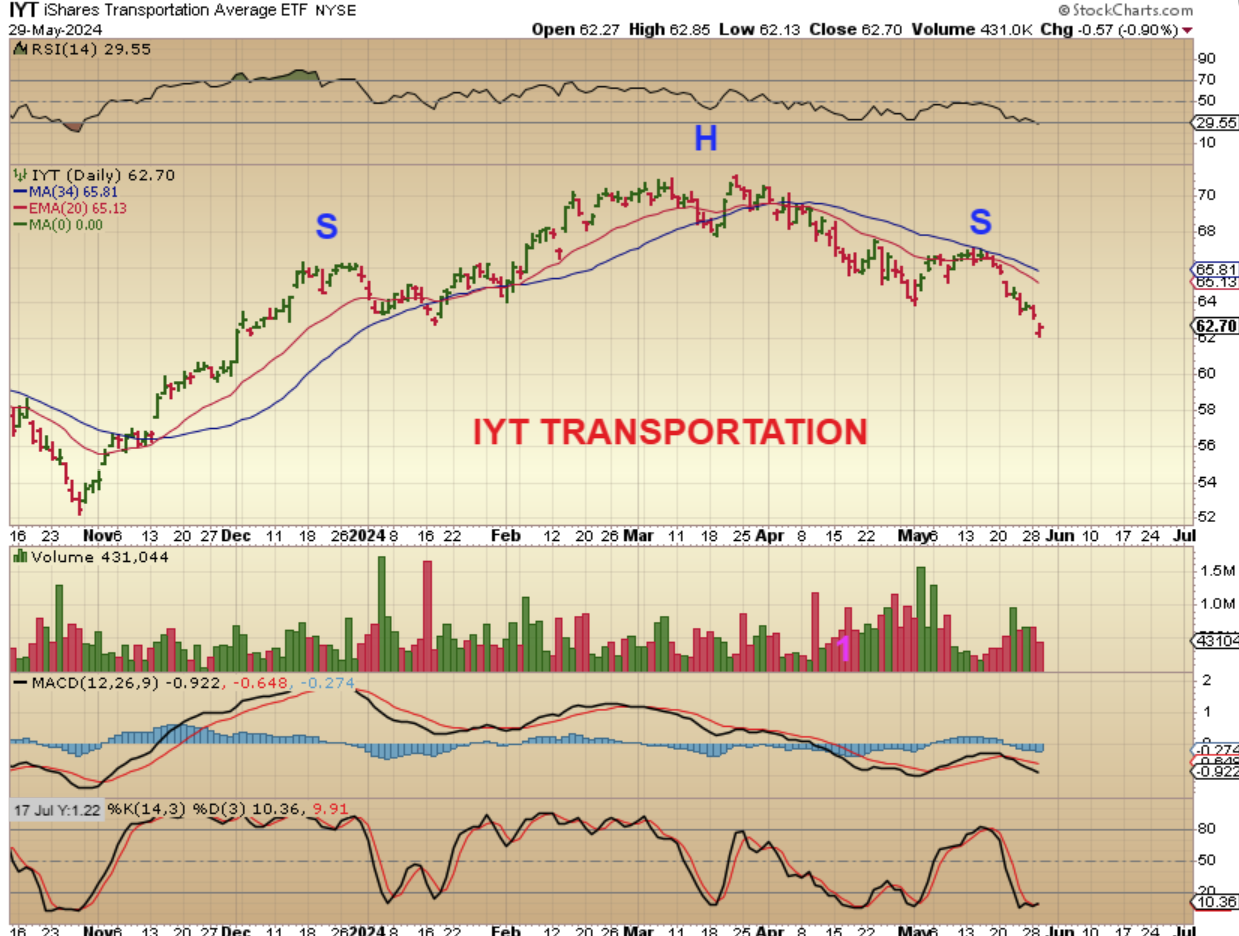
The ‘DOW THEORY‘ was pointed out as a time when the Dow Jones is trending higher and the ‘Transports’ do not follow. It indicates that the ‘trend’ higher for the Dow might be ready to change to ‘lower’ too. It will follow the transports lower.
.
TRANSPORTS – So last week I pointed out that the transports were dropping as the DOW JONES made new highs. That has continued. I think that I also mentioned that it was starting to look like a Head & Shoulder pattern rejected at the 34 sma. Well, as the SPX & NASDAQ hold the highs, this is breaking down further TO NEW LOWS. See the chart.
.
TRANSPORTS – Just 7 days ago, the Dow Jones Transportation Average was above that 34 sma, but notice that yesterday it undercut the May 1st low. So we’d view this as even more of a warning that the SPX & NASDAQ might weaken quickly. And what about The Dow?
![]()
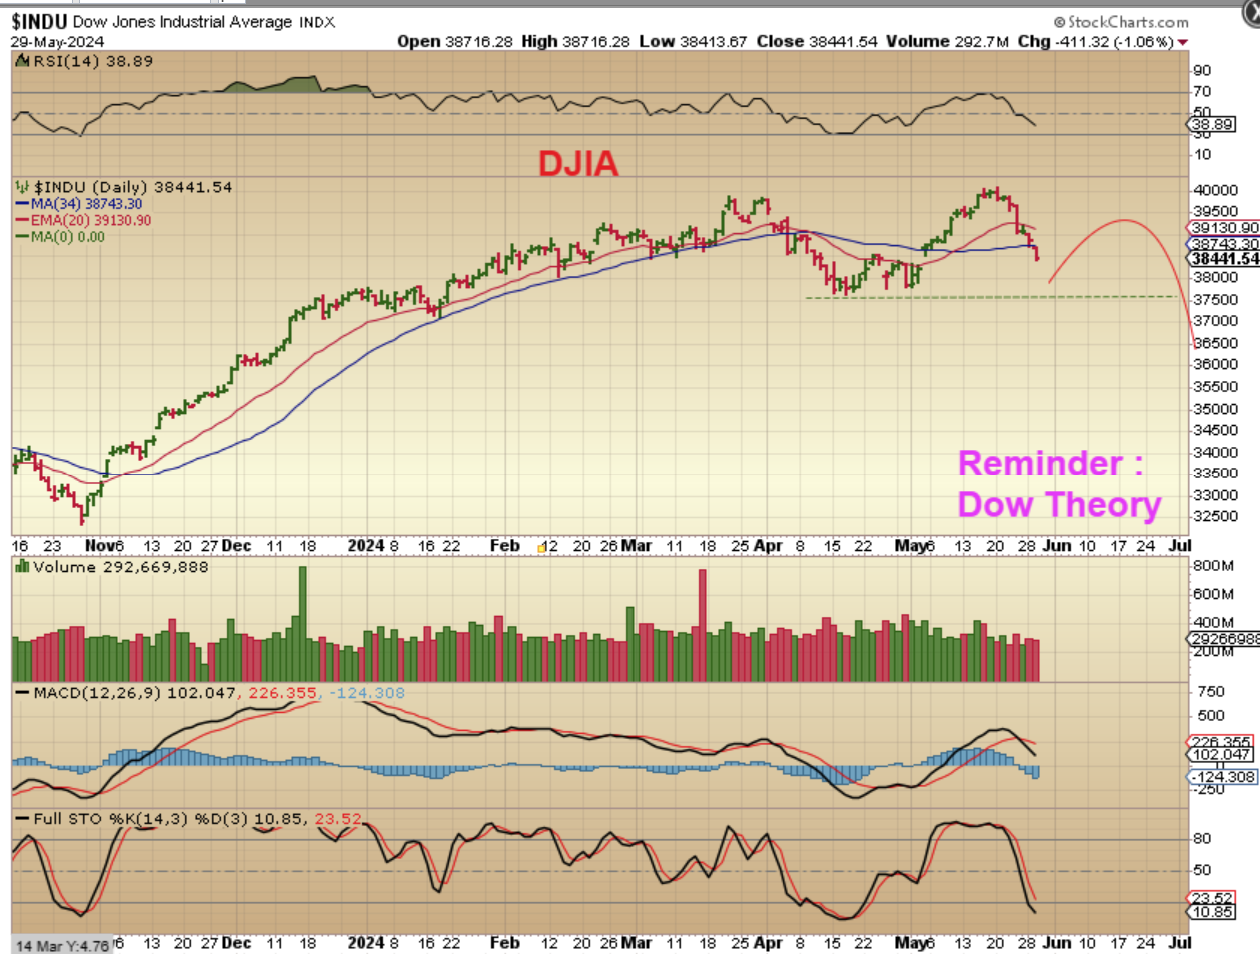
DJIA – The Dow Jones made new highs and now has begun to follow the transports. Remember that I said with the ABOVE Chart that 7 days ago the $TRANS looked ok? Well 7 days ago The DJIA was at The Highs. We want to view that as a warnings for the SPX & NASDAQ…
.
We want to view that as a warnings for the SPX & NASDAQ, that when they start to drop into their next dcl, the drop may accelerate. It could be deeper than expected.
.
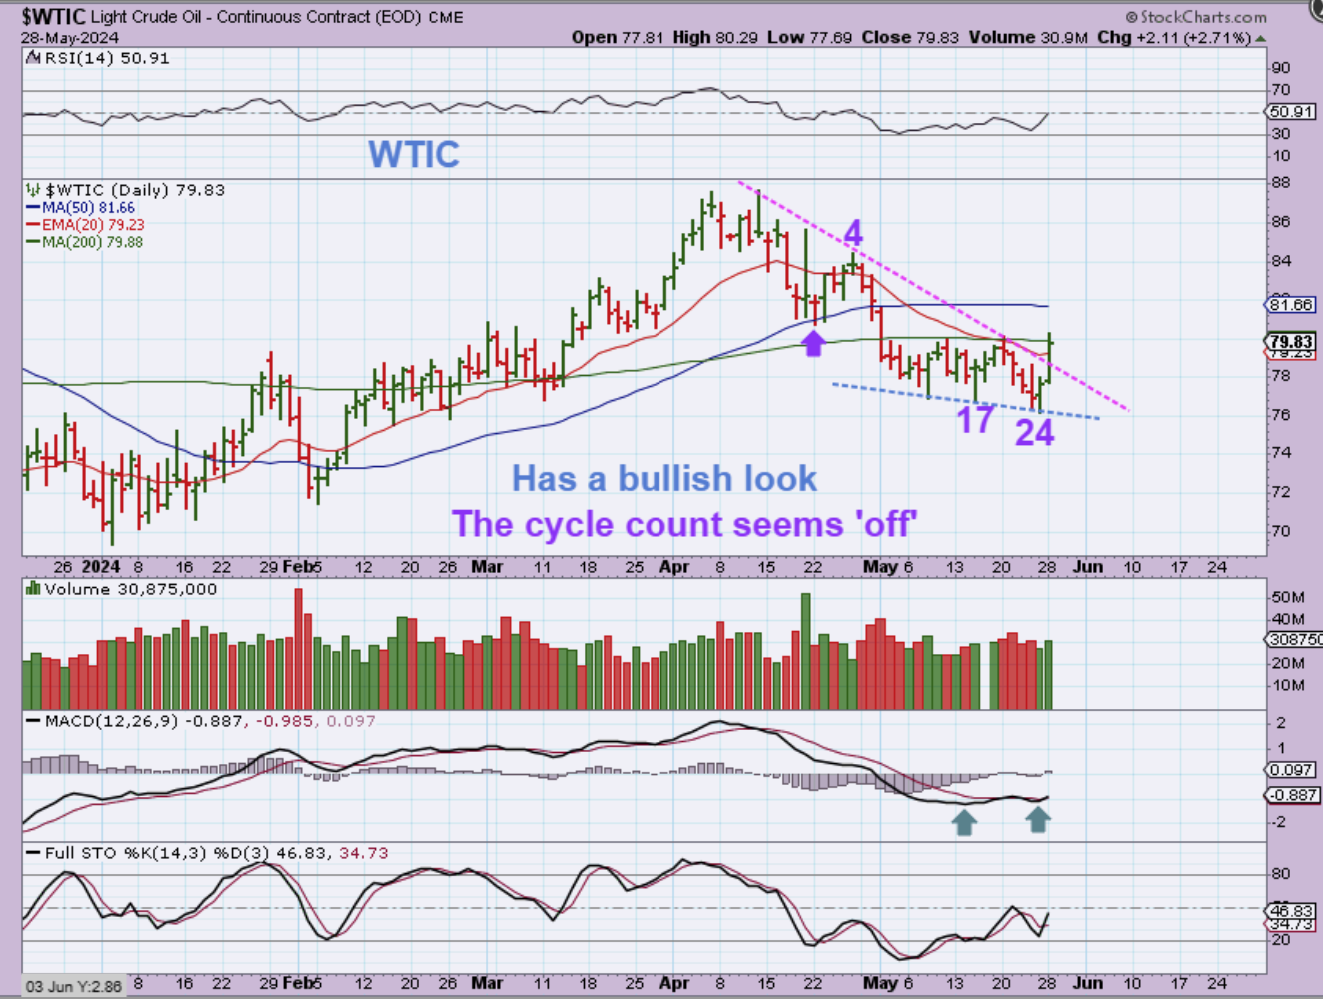
With Oils push higher, I said in part yesterday:
…I have to think that it will stall at the 50sma and roll over later, but the MACD is bullish and it will be interesting to see how this plays out. I am personally not playing it in either direction.
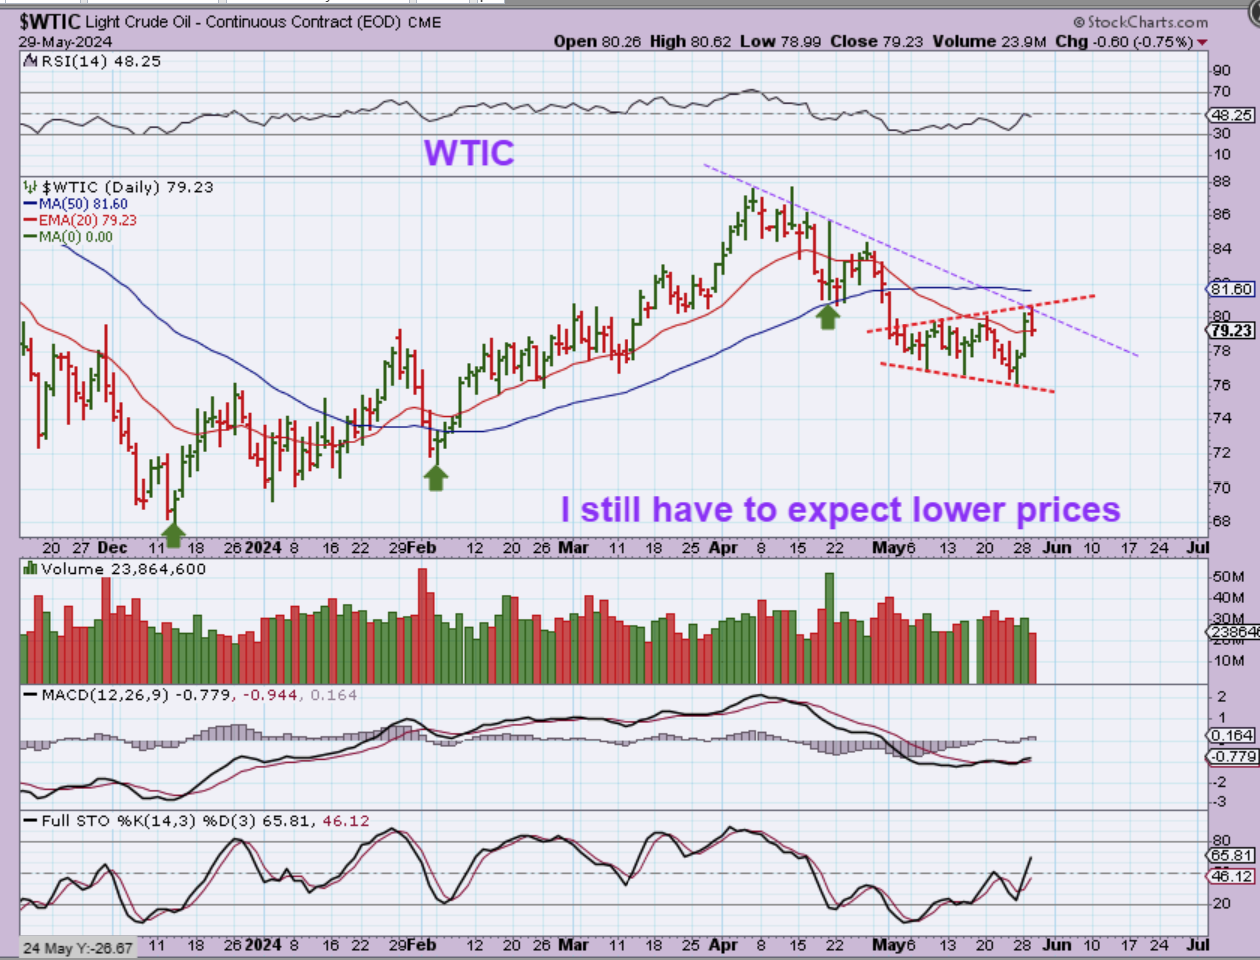
.
Oil actually turned lower at the purple trend line, and I have now drawn a red bull horn pattern that it turned lower at too. The MACD looked to be turning bullish, but this could be a consolidation and continuation lower. This is only day 26 for Oil. It can drop back to the lows over time.
.
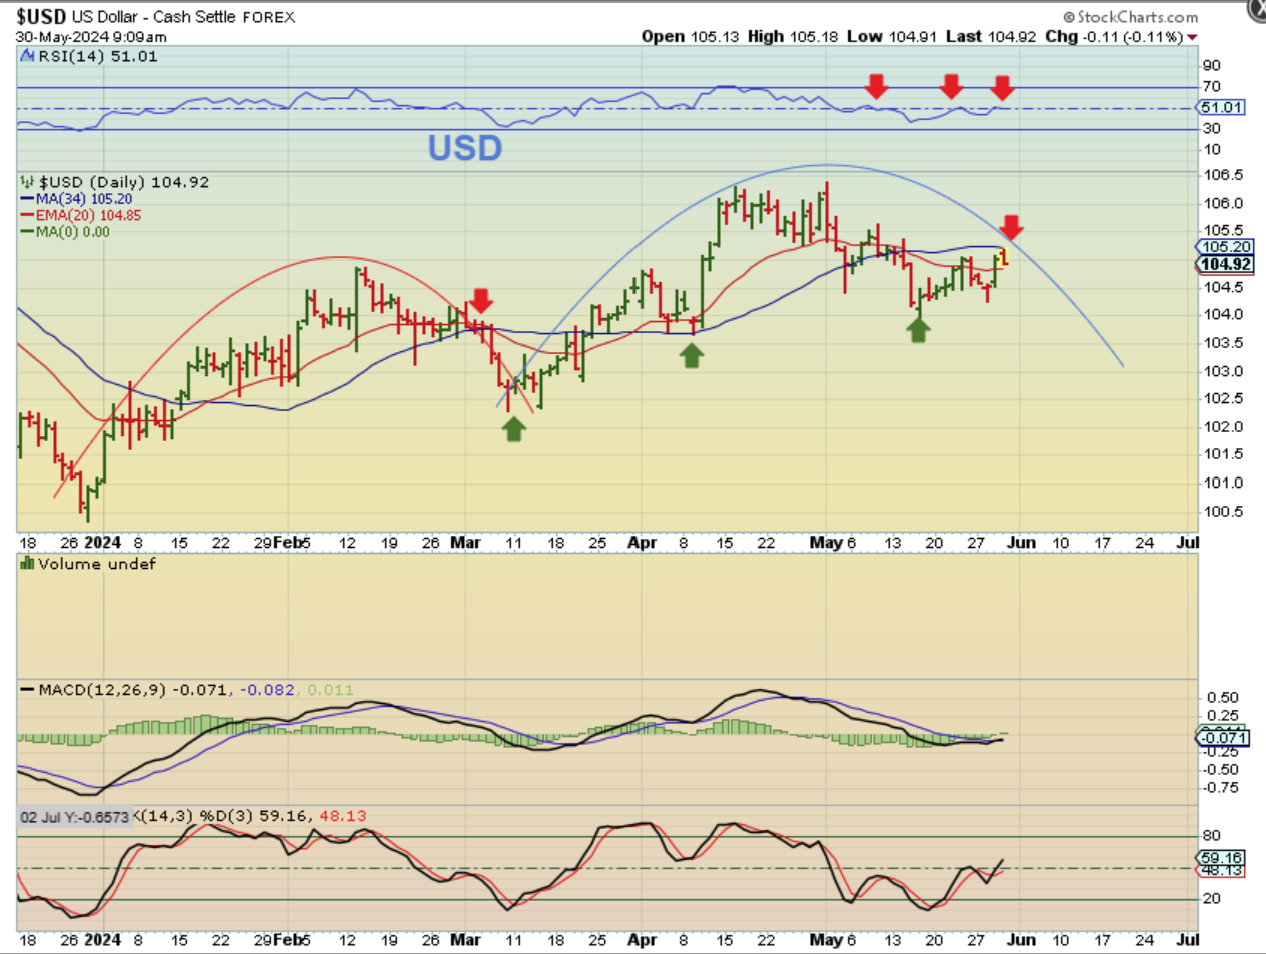
THE USD reversed at the 34 sma too.
.
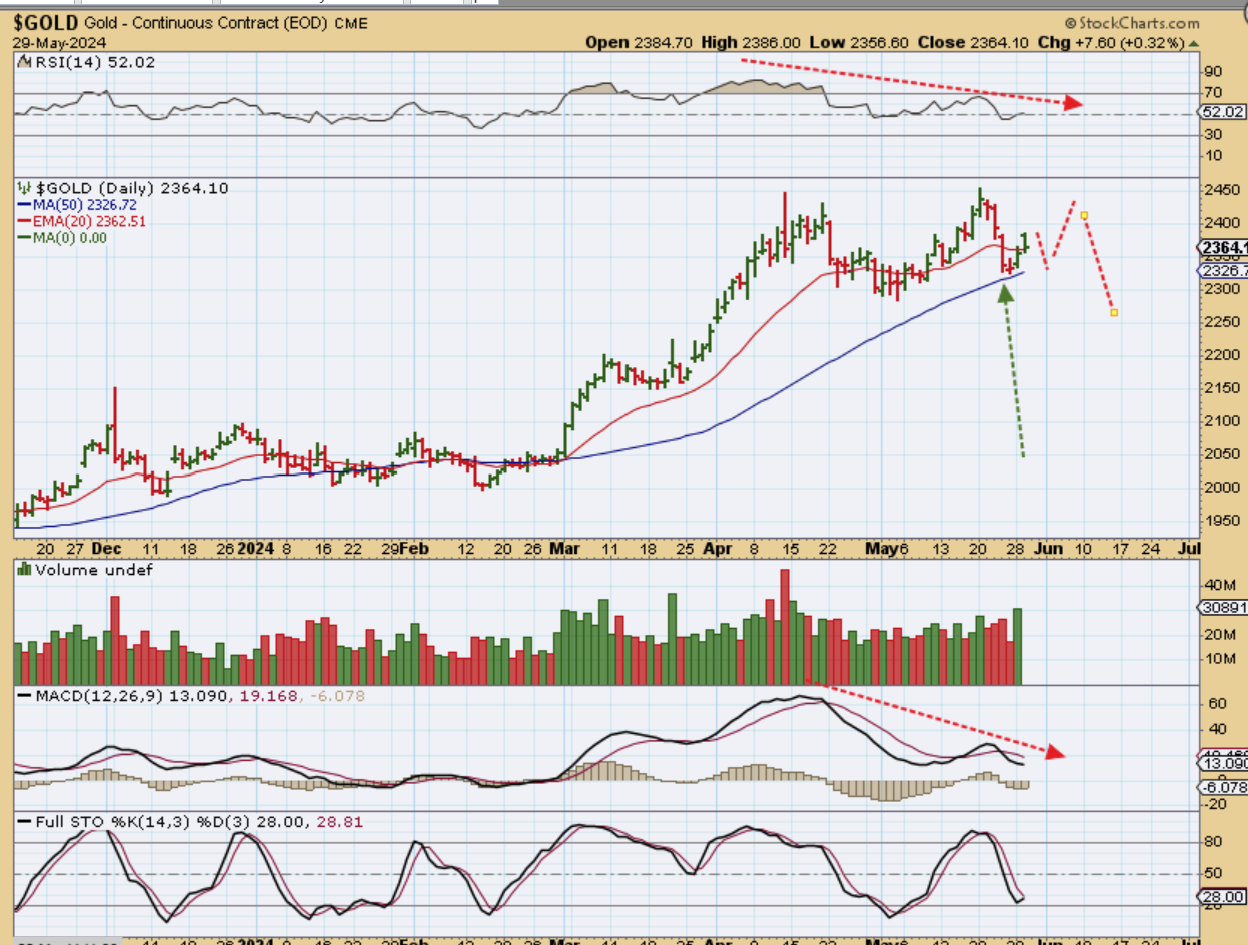
GOLD did a pop and drop on day 17. It has the appearance of a double top, but it could bounce and become a triple top too. So…
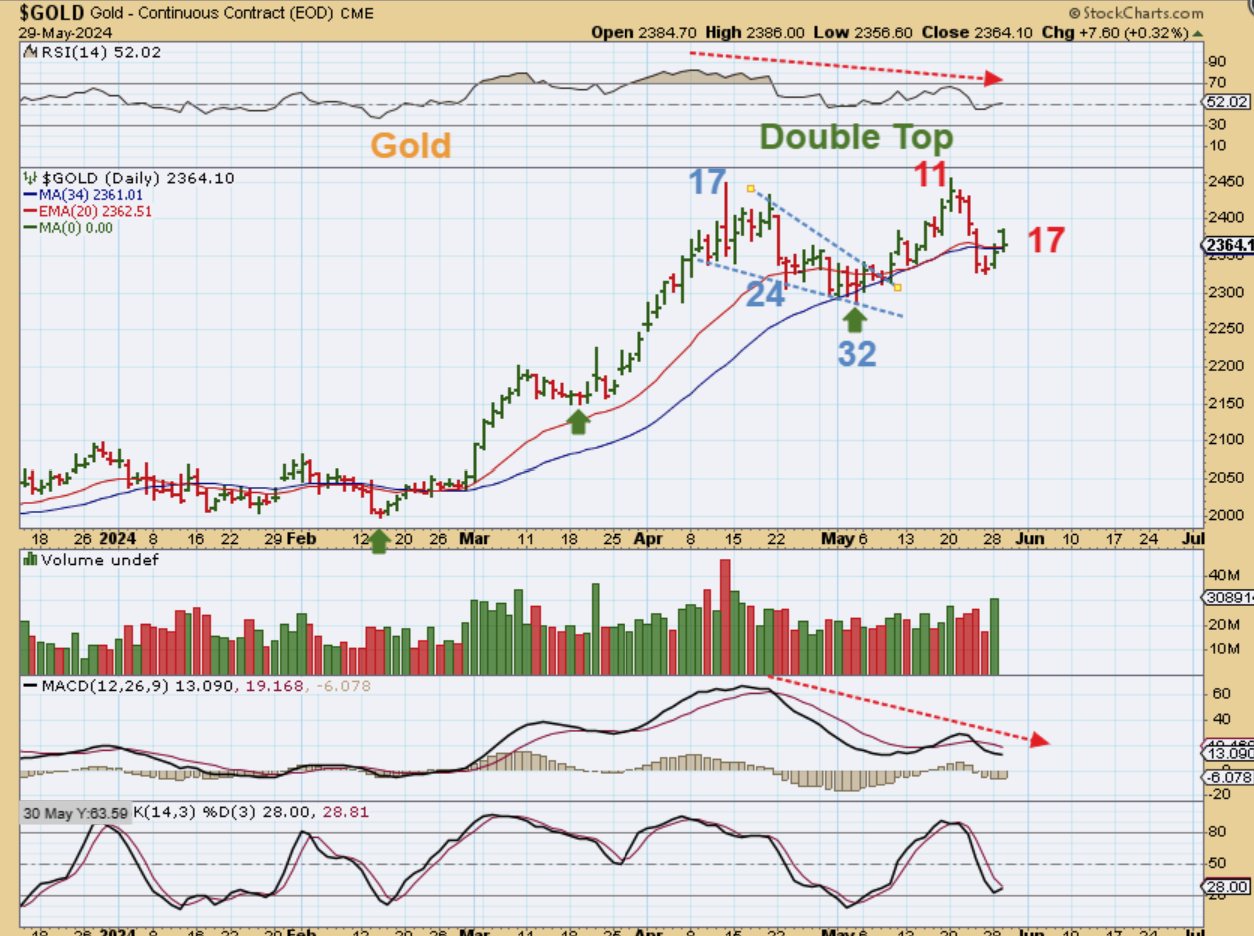
.
GOLD bounced off of the 50sma, so Gold may or may not bounce and give us a triple top. The strong divergence seems to indicate that Golds recent rally is topping, so I think that we will need some patience until we get to the next ICL. We’ll see.
.
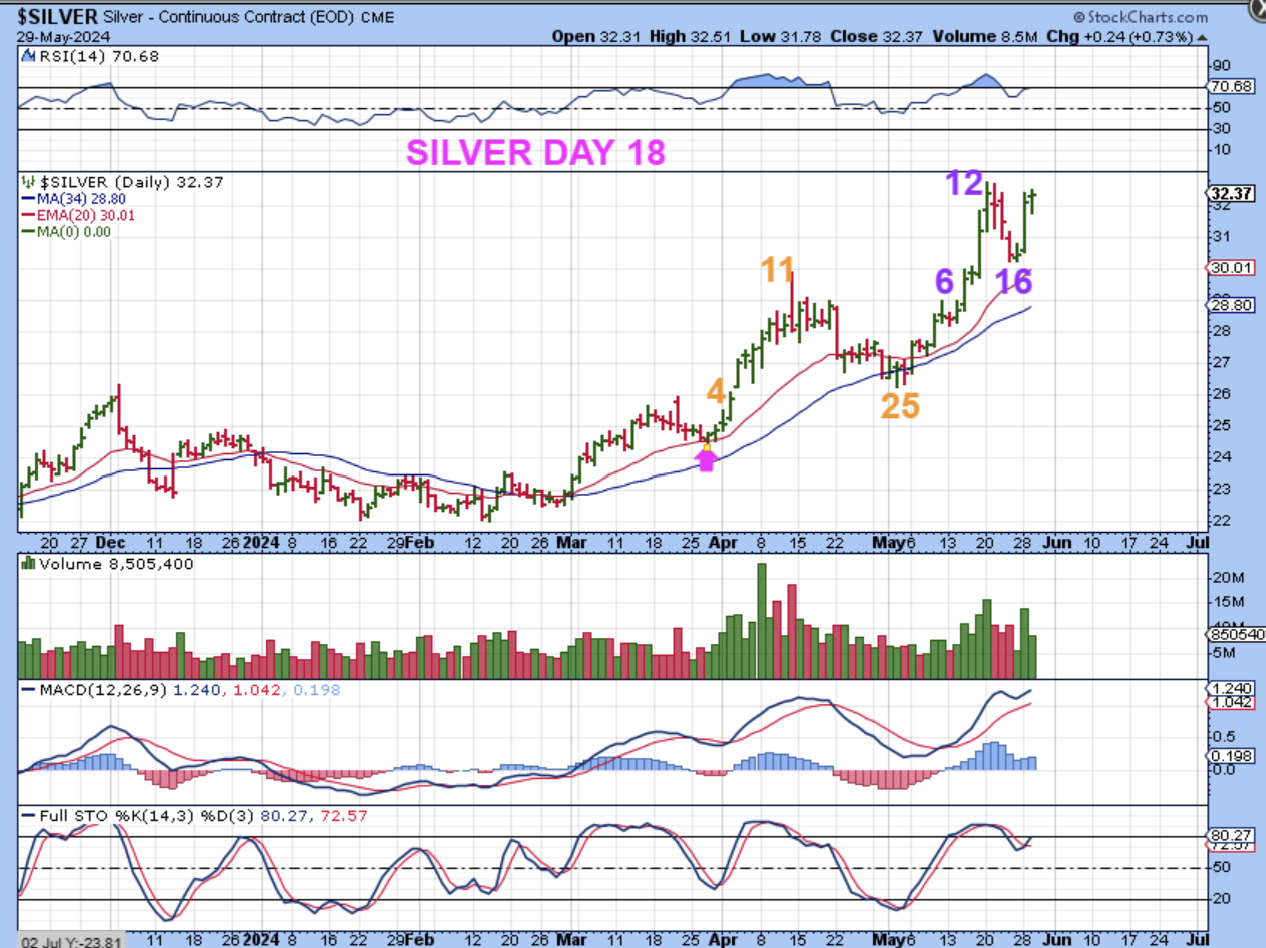
SILVER is still at the highs on day 18, but I do see divergence here with the RSI too. Silvers strength is getting some notice by the public and breaking above that $30 area is very bullish, so I want to personally focus on my Silver stocks after the pull back takes place.
.
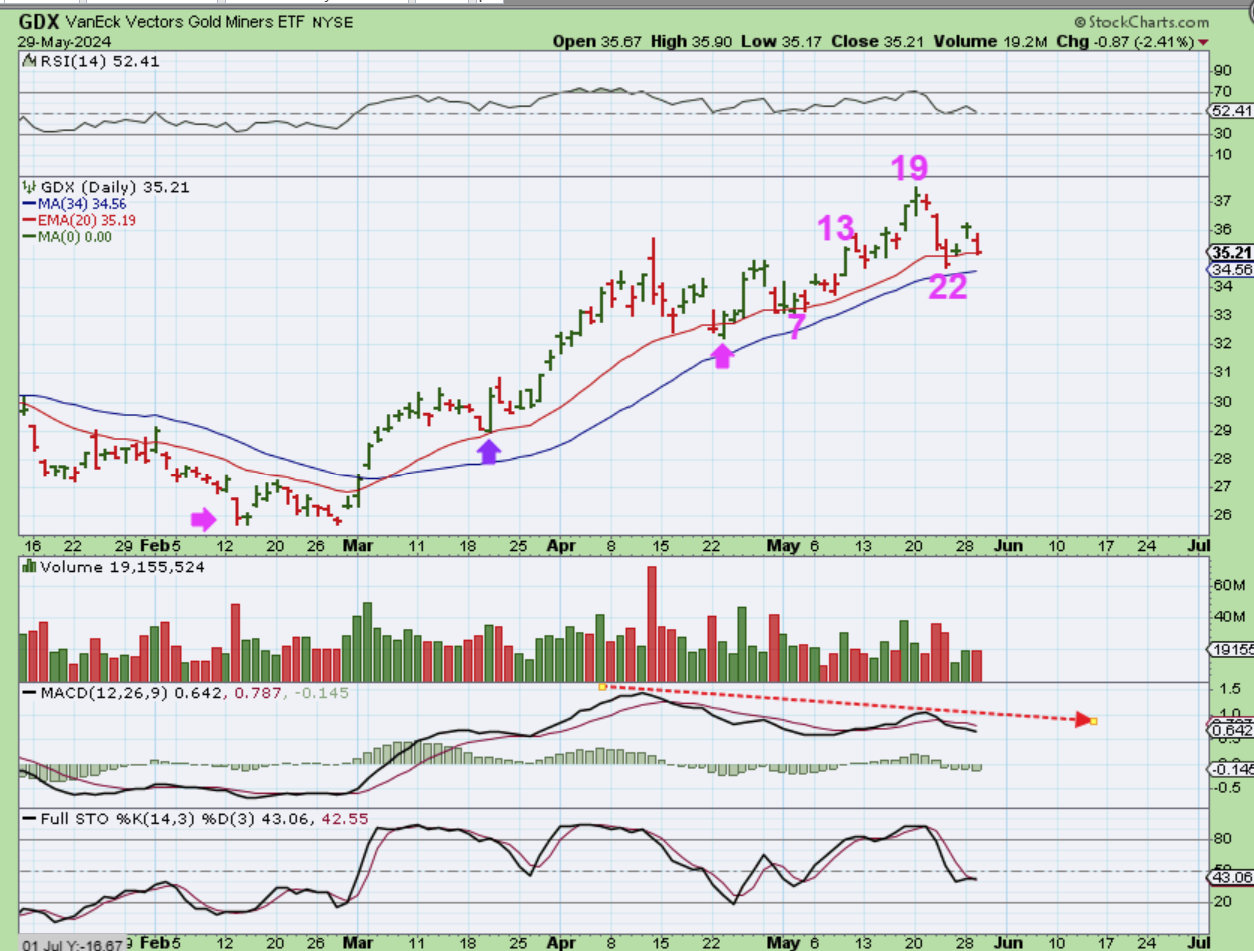
GDX – Miners did not follow Silver to the highs, they followed Gold by bouncing around the recent lows and they also have strong divergence. The cycle count is later for the Miners too, because they bottomed first.
.
So we have enjoyed the strong rally of the General Markets and Precious Metals in much of 2024, but pullbacks do always become a part of the equation. That is the time that we can either lock in gains or use trailing stops to try to capture more upside, if there is further to go. I am mostly cash, but I have been riding a couple of Crypto stocks out of the recent lows and I often do a little day trading too, but since I am currently spending some time taking care of my parents midday or in the afternoons, my trading is minimal. I am, however, thinking that we are near the 30 day low for Bitcoin, and then we could see more upside. I’ll discuss that below, enjoy your Thursday trading!
.
~ALEX
.
THIS IS MY CONUNDRUM:
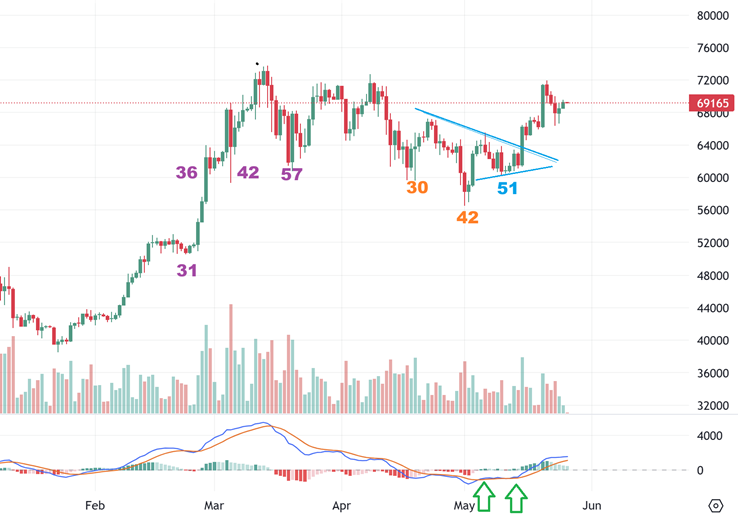
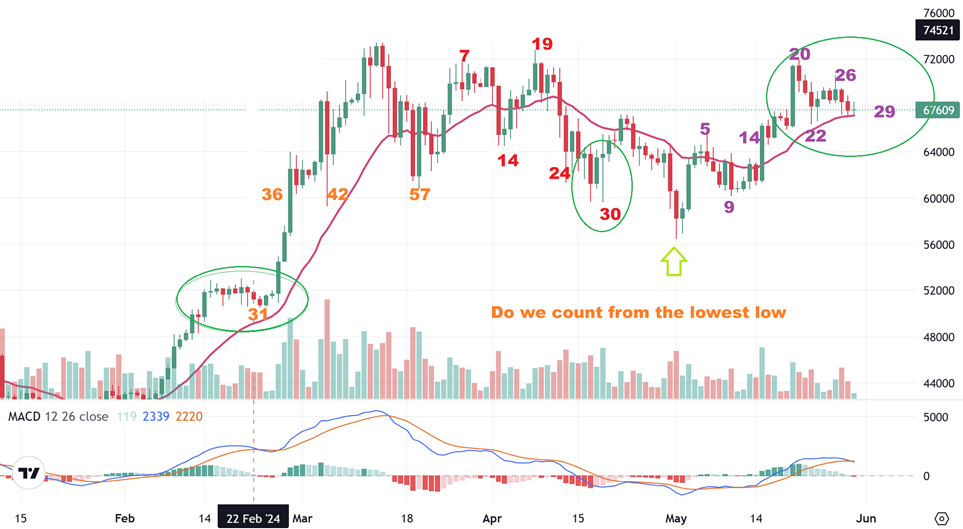
1. I felt that Bitcoins lowest low at 42 was too early for a dcl, they come closer to day 60. I then started to see a triangle form…
2. At that point, even before the breakout, I mentioned that with Gold I have used Triangles to mark the DCL, because they just don’t allow the price to drop to new lows one more time. It is too bullish and too strong.
3. So even before Bitcoin moved higher breaking out on day 56, I pointed out that triangle at day 54 and 55. It then broke out and gave us this chart days later. The DCL would become the low before the breakout
4. So the Conundrum is: Do I now count from that day 54ish area, or…
.
BITCOIN – DO I GO BACK TO THE VISIBLE LOW AND COUNT? IF SO THE SEELING COULD BE ALL DONE.
.
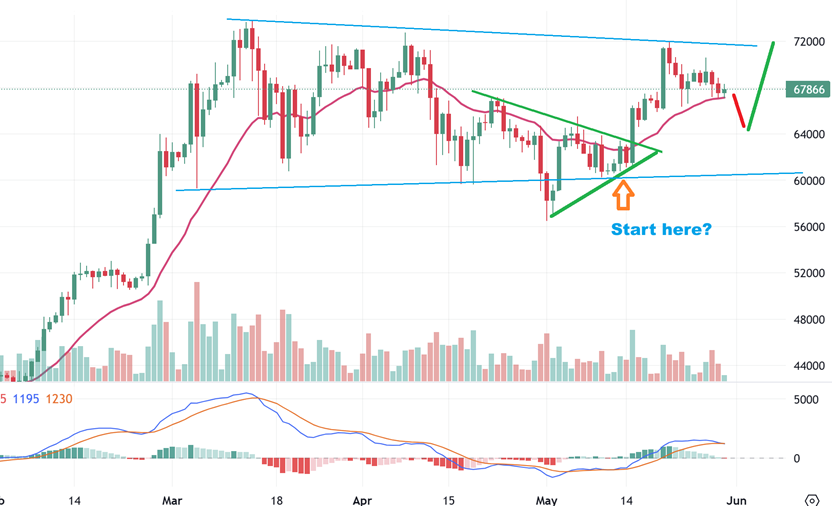
If so, we are on day 29 out of that lowest low, and that is the timing for a half cycle low and then we can move higher off of the 20 ema. IF I have to count from the triangle low though, it adds almost 10 days to the count, we’d ONLY be on day 20ish.
BITCOIN – Do I count from the DCL in the Triangle? If so, we’d have maybe 10 more days to go to a 30 day low, and that would allow for a deeper drop. I hate that this in not as clear as it has been in the past, but all I can do is let it play out and see if we get a move higher off of that 20 ema? Or a drop as shown here. FOR THAT REASON…
.
SAME CHART:
All I can do is let it play out and see if we get a move higher off of that 20 ema?
Or a drop as shown here. FOR THAT REASON – I AM KEEPING MY POSITIONS SMALL UNTIL WE START MOVING HIGHER.

