Wednesday May 29th
.
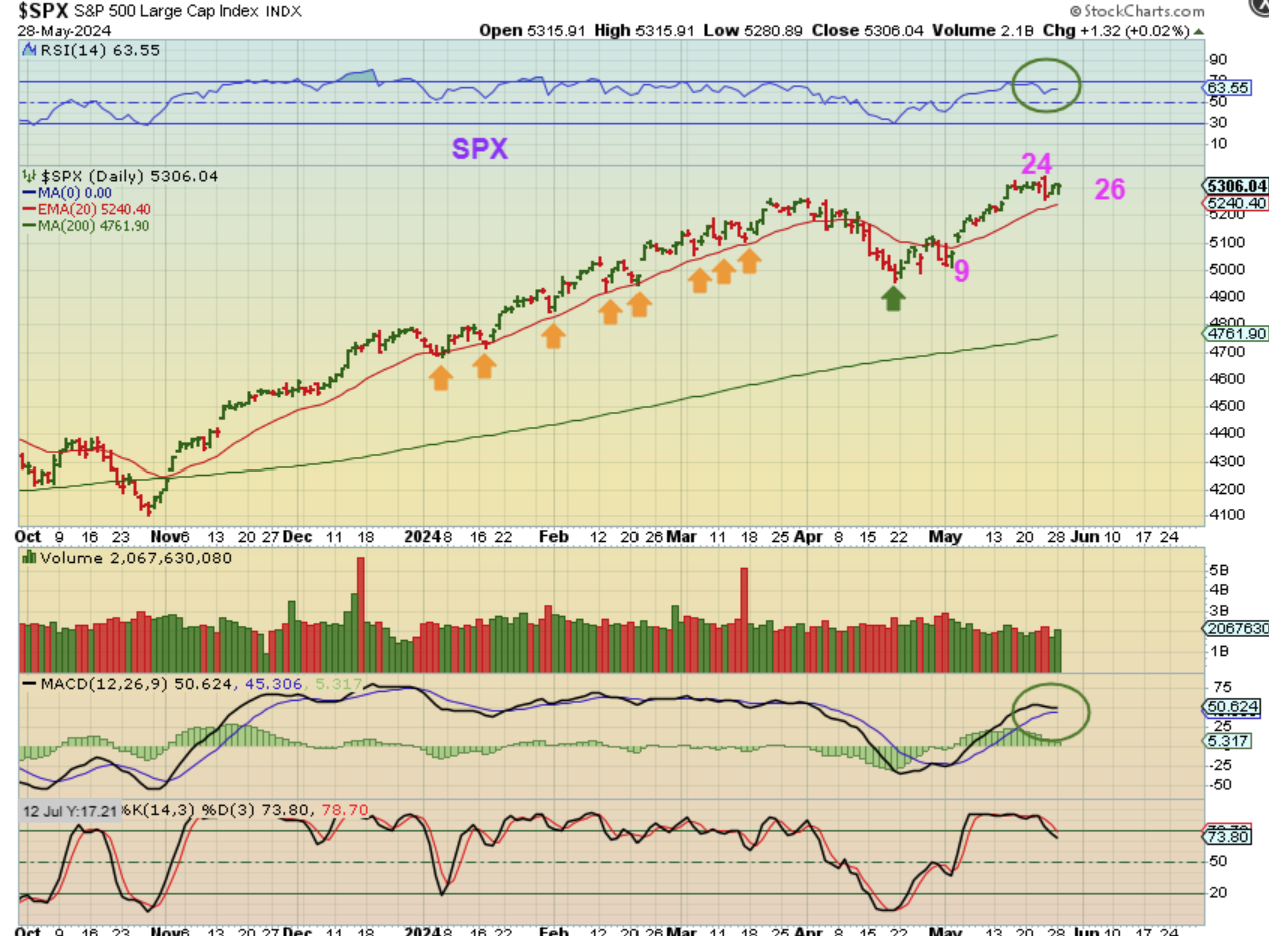
SPX – You can see that the 20 ema has held as support during the recent bull run. Last week we saw a ‘bearish engulfing candle’ that has not had follow through and the 20 ema is still under price. We are on day 26 of daily cycles that can be roughly 40 days long, but they have been known to be short or longer too.
.
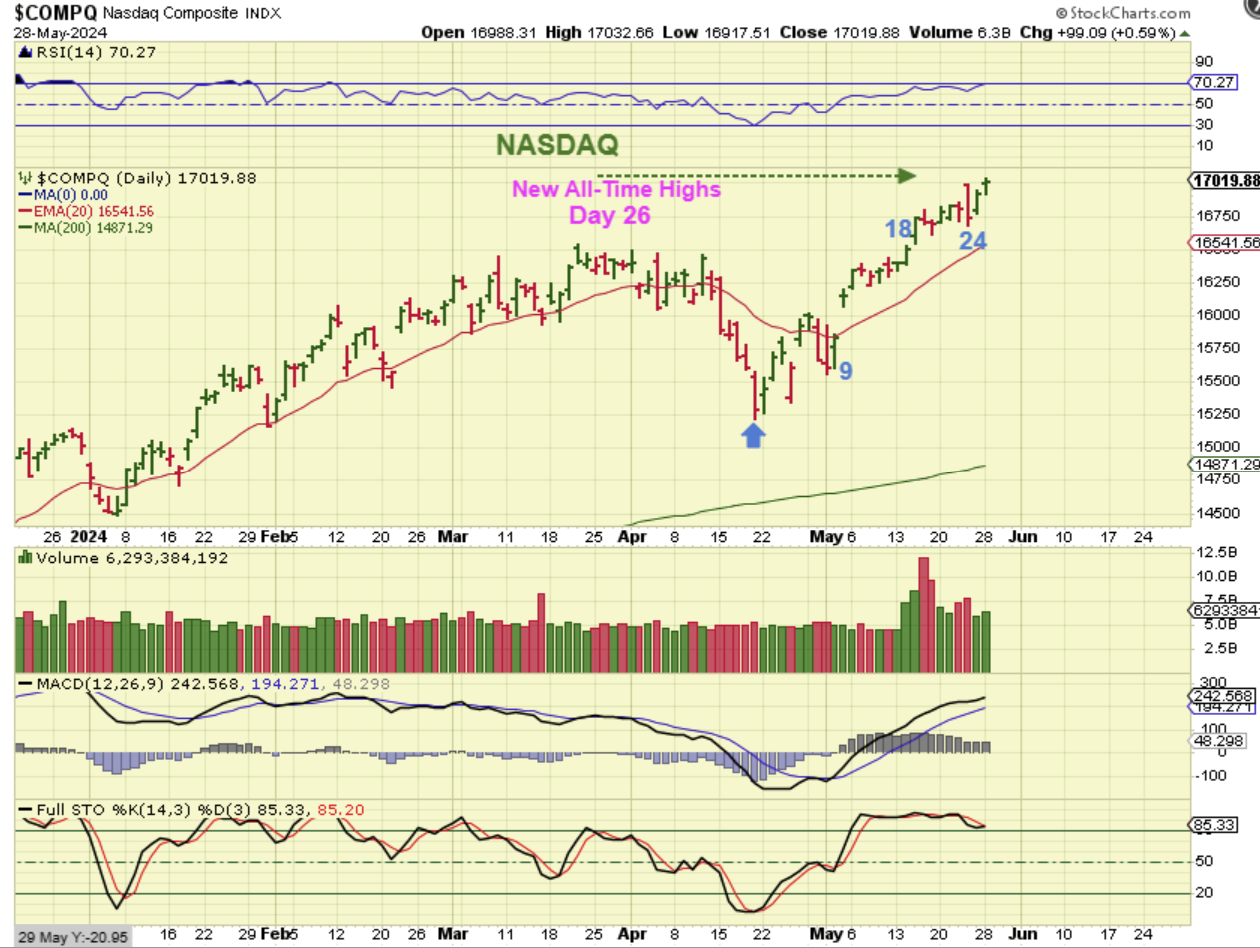
The NASDAQ or the Tech Sector is making new all-time highs on day 26. The move out of this ICL has been bullish and strong so far.
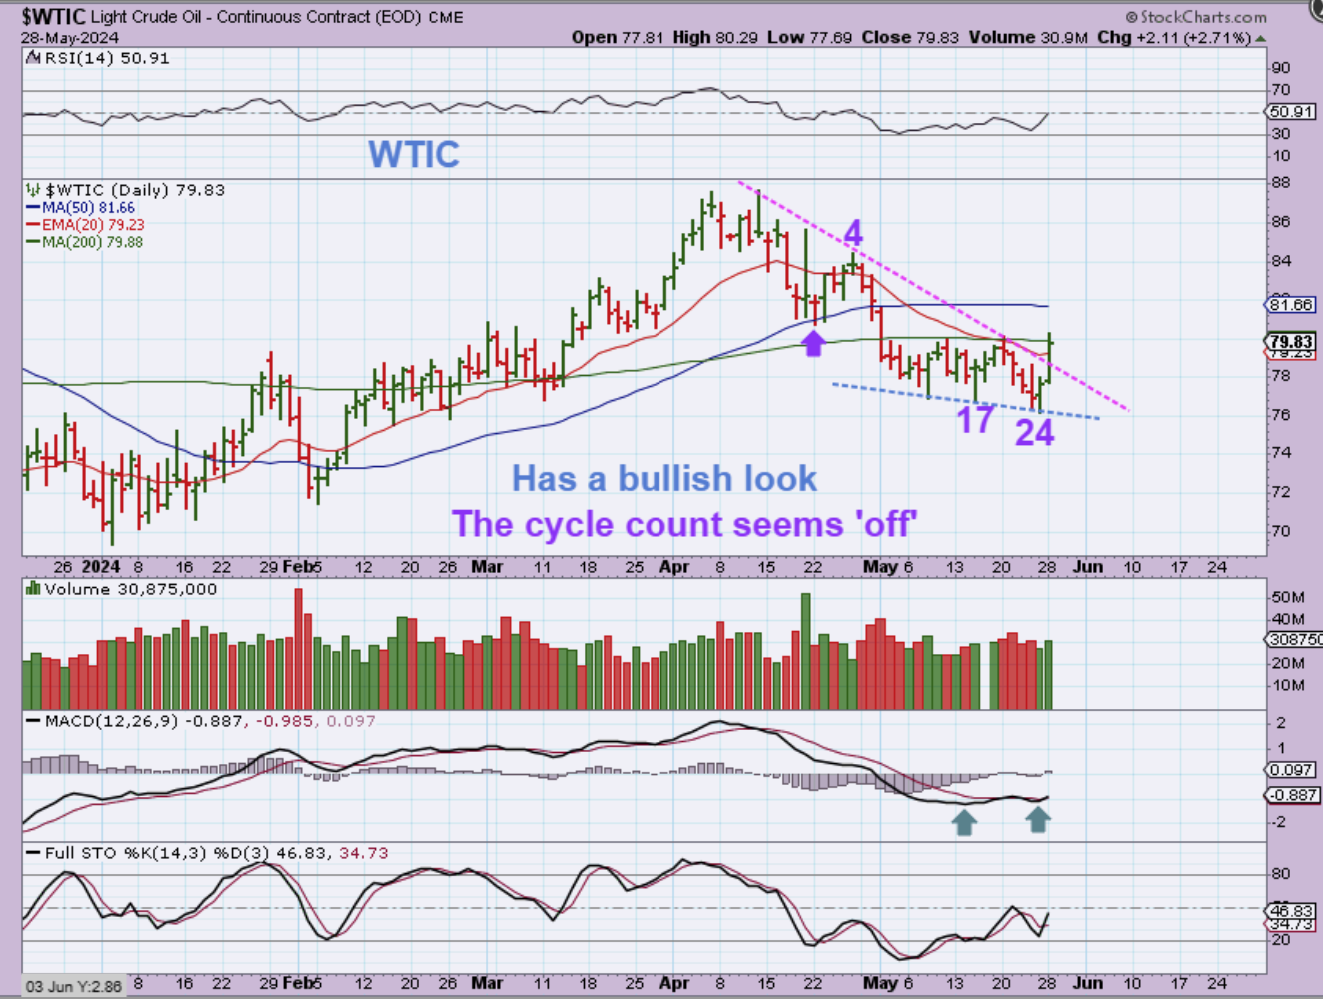
WTIC – This is interesting, because I have been highlighting the choppiness and weakness of Oil after bouncing off of the 50sma and rolling over. That would only put us on day 25, too early for a dcl, but fine for a half cycle low. That said, it is a pretty convincing looking chart as it tries to break above the 200sma (& then the 50?). So I have to think that it will stall at the 50sma and roll over later, but the MACD is bullish and it will be interesting to see how this plays out. I am personally not playing it in either direction.
.
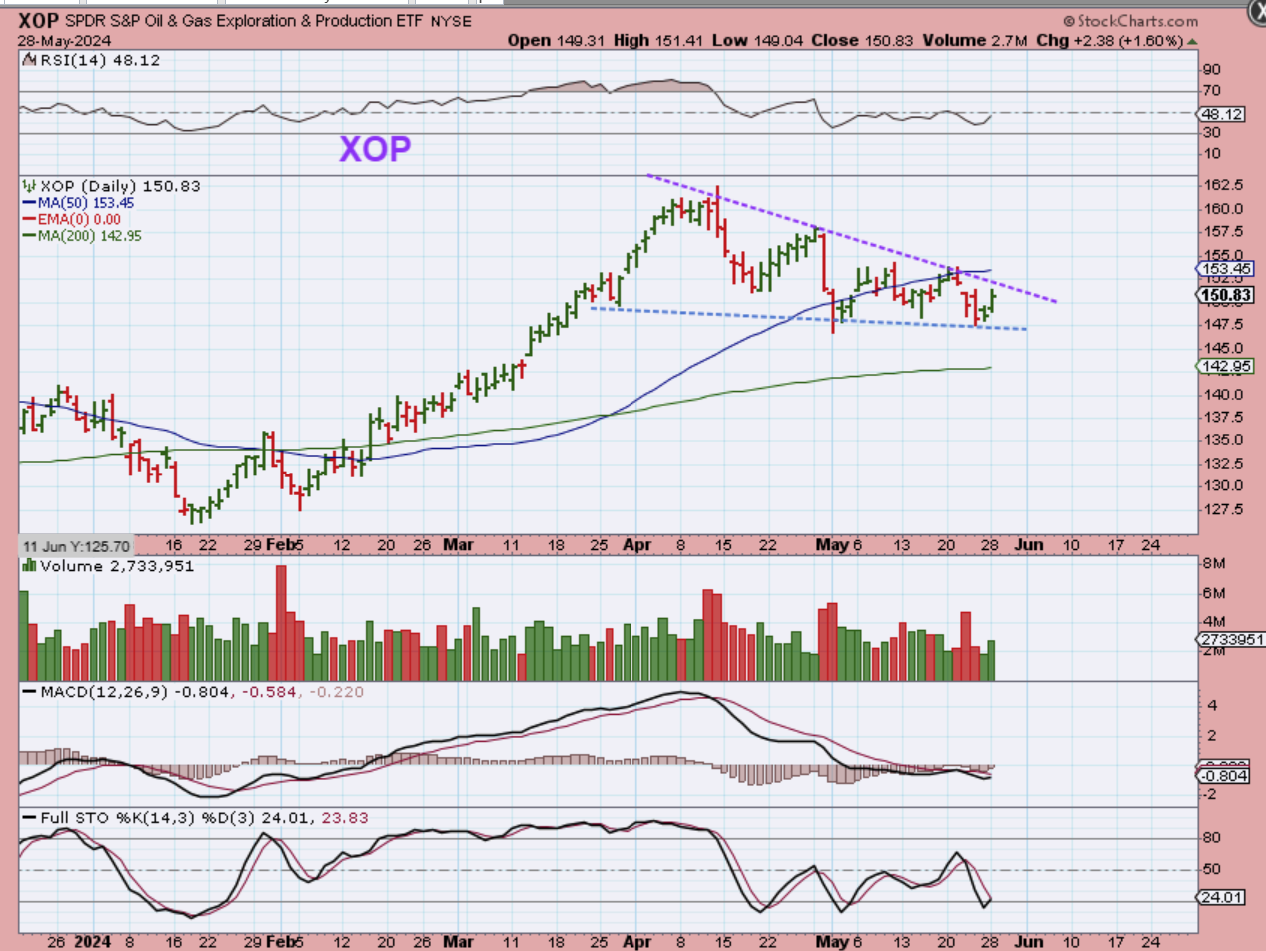
Then when I took a look at The XOP, MRO, ERF, NOG, etc, they also look like they could move higher. I have pointed out, however, that Oil and Energy stocks do not always follow Oil, since Oil is at the lows and these are not.
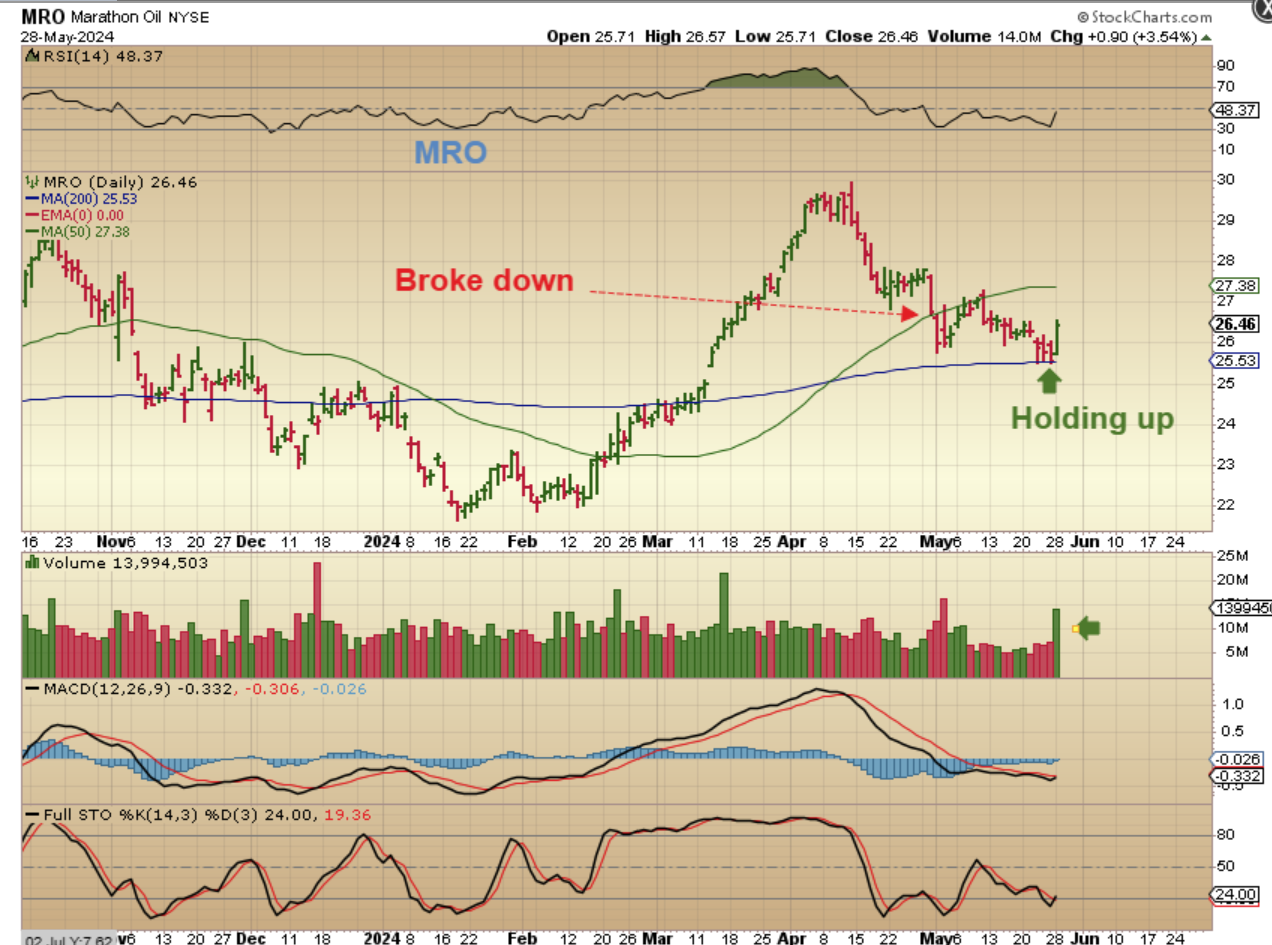
MRO – You can see that some Oil stocks lost the 50sma recently, but MRO is now holding at the 200sma and had a good day with nice volume. I would actually buy this with a stop at the 200sma. ERF even looks better than this.
..
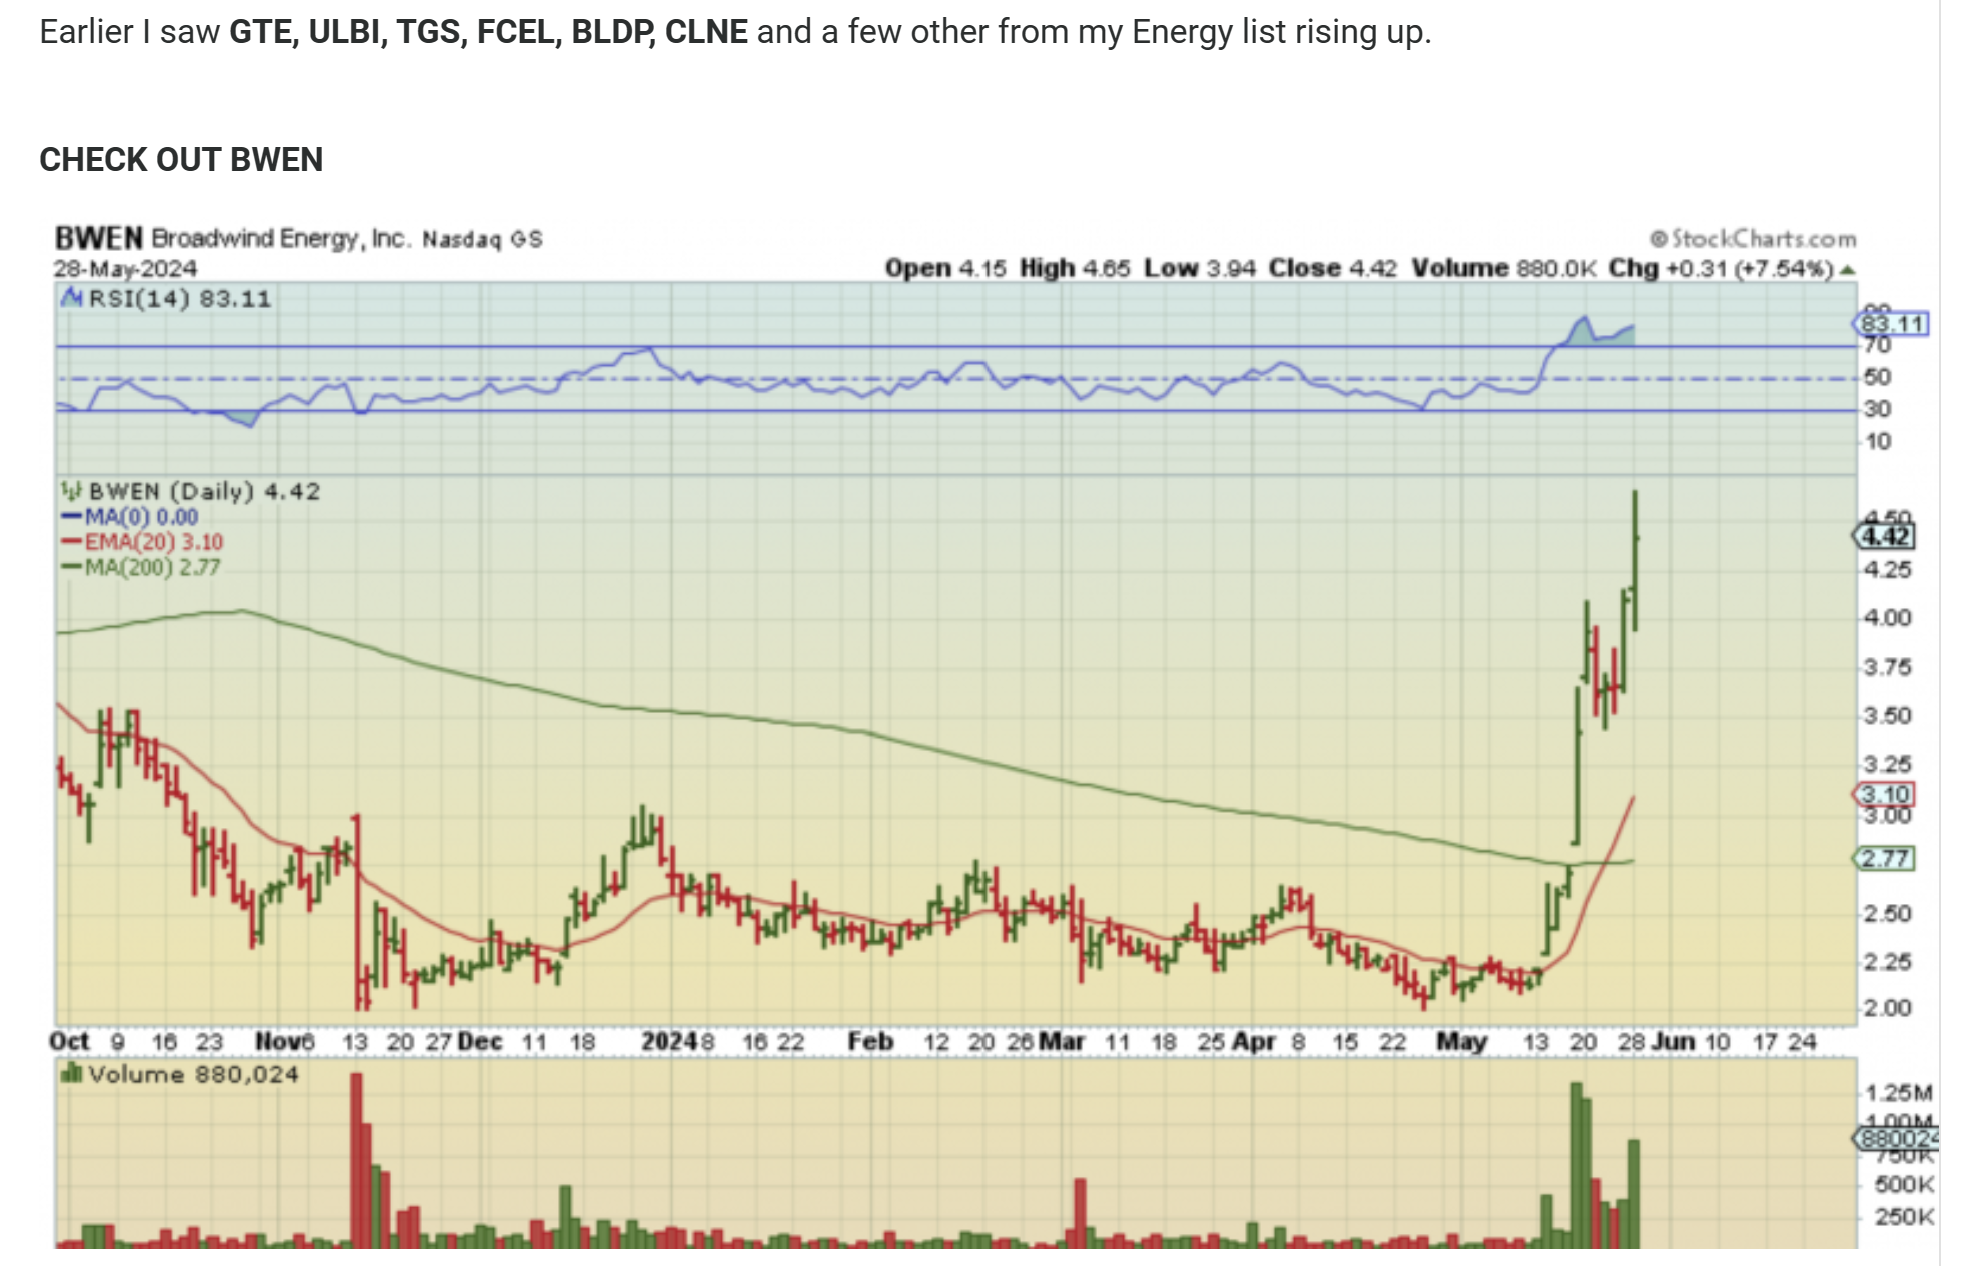
In the commenting area, ED mentioned SMR (Nuclear Energy ) as breaking out. I looked up the chart of that and Uranium Stocks. Those DO Look bullish. I replied with the following comment. You can look up the charts of GTE, ULBI, TGS, etc and see what I mean-they look bullish.
ENERGY –
.
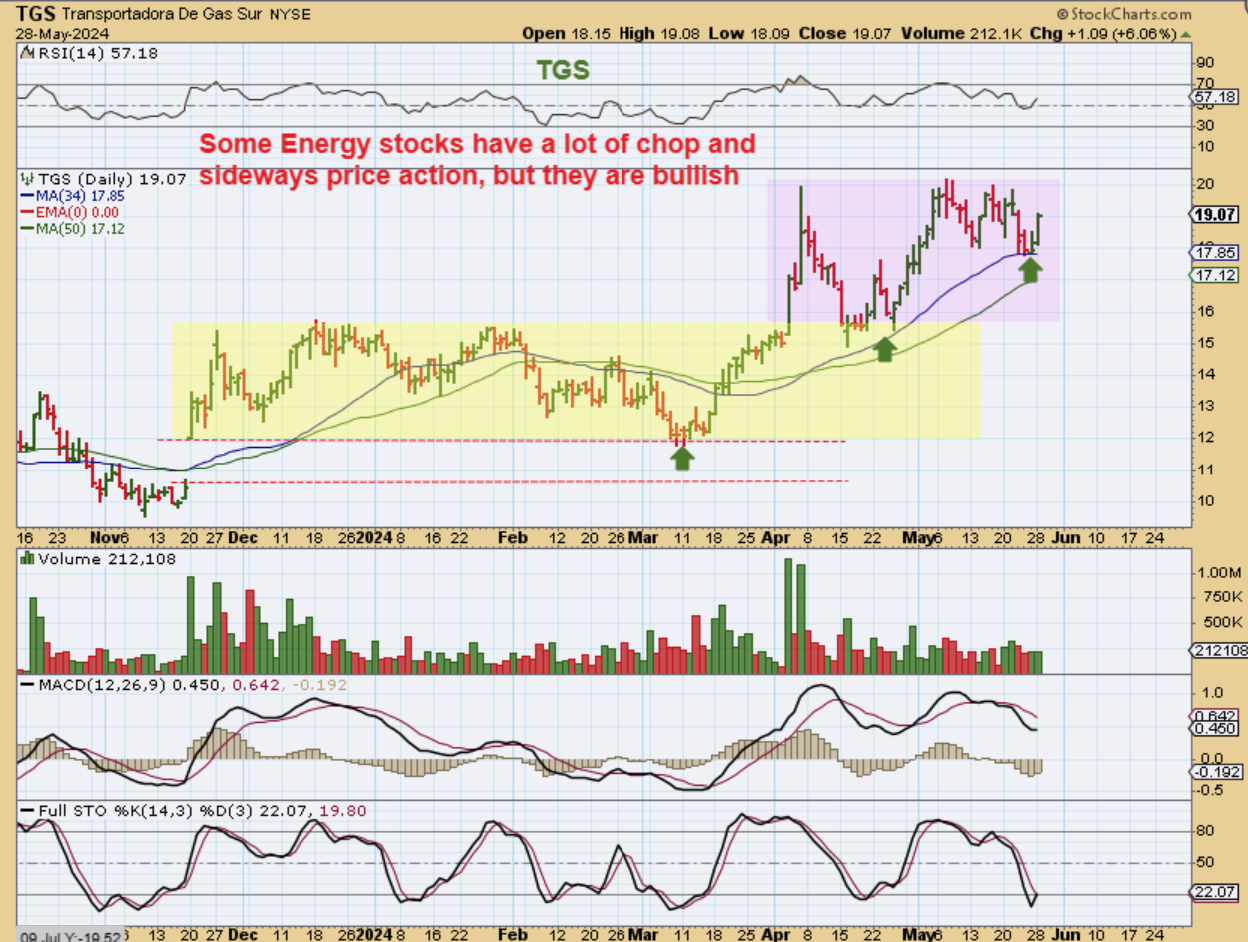
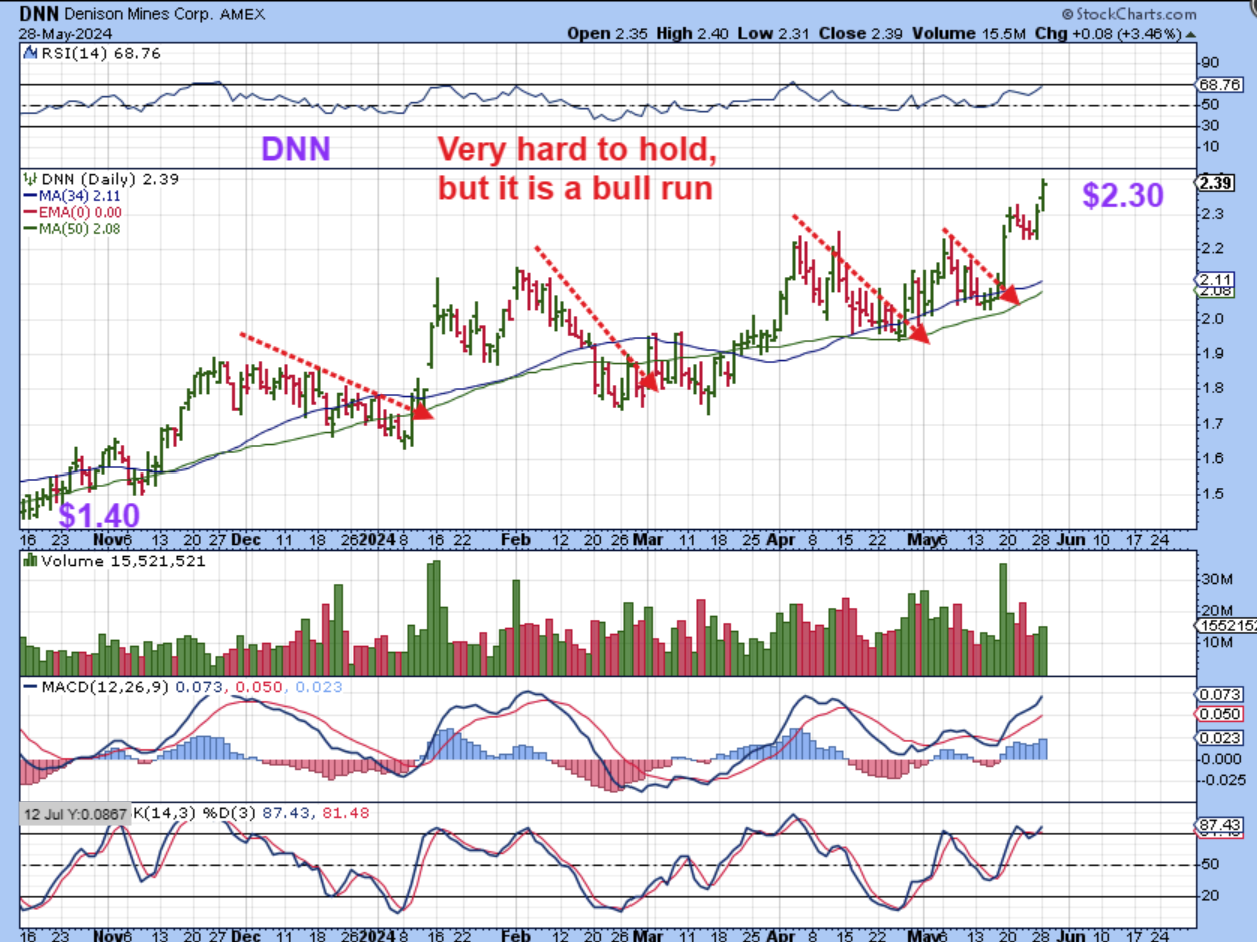
TGS – I find some of these very hard to buy and hold ( I Know, because I bought and held Uranium stocks. They are doing great, but very hard to hold with the chop). That said, TGS has moved from $12 to $19 since March. It held at the 34 sma a few times and it is there now. You could buy it, but it may rally or it may continue to chop. It is a bullish set up though.
.
DNN – I just want to show you what I was saying about the buy and hold on some Uranium / Energy stocks. I bought and held DNN earlier this year for a while but the chop was annoying over time, so I cut it loose before realizing profit. I tend to get impatient.
.
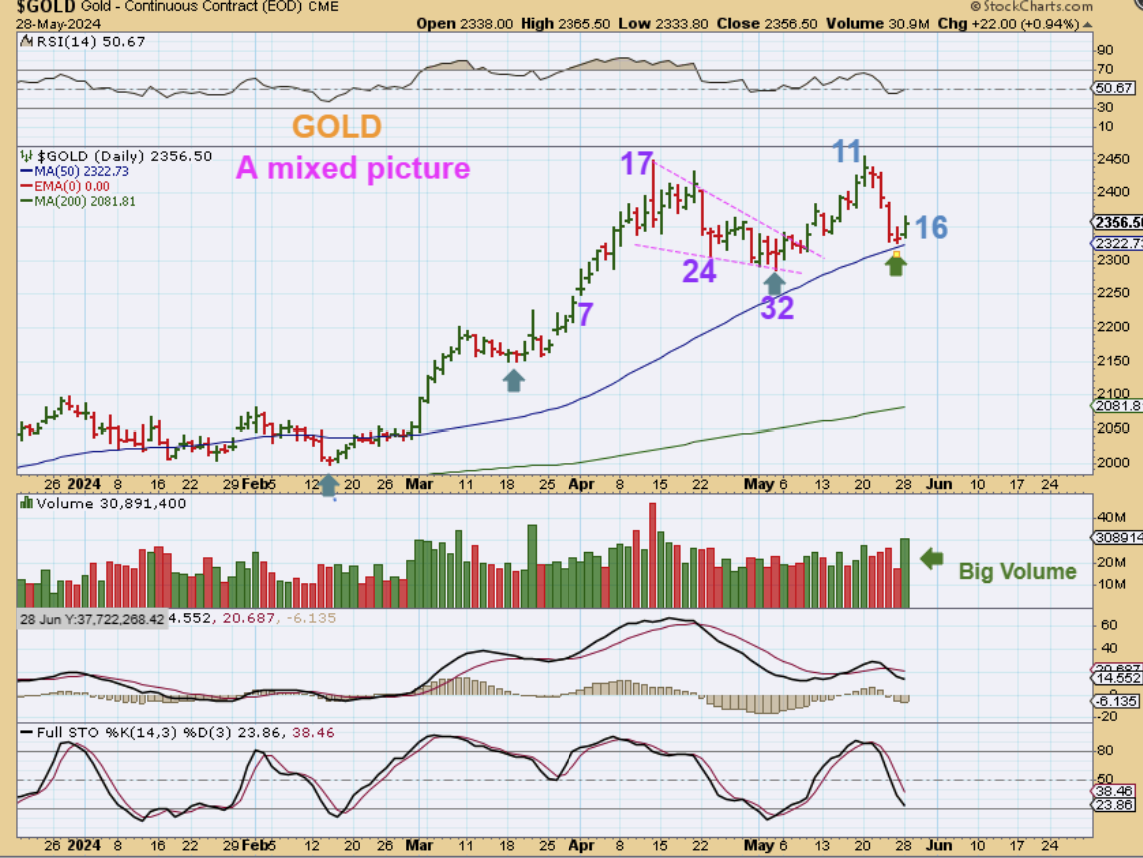
GOLD is giving us a slightly mixed picture. We had a dcl at day 32 and then a peak on day 11 for the 3rd daily cycle. THAT could make this L.T. if it holds, and Gold could chop around from here and then roll over into a dcl that is lower than day 32. Golds MACD was indicating that this might be the case, but it has reversed at the 50sma and volume increased. Was that just a half cycle dip? Maybe. It could be a ‘buy’ with a stop under the 50sma, but it may just chop around as a 3rd daily cycle.
.
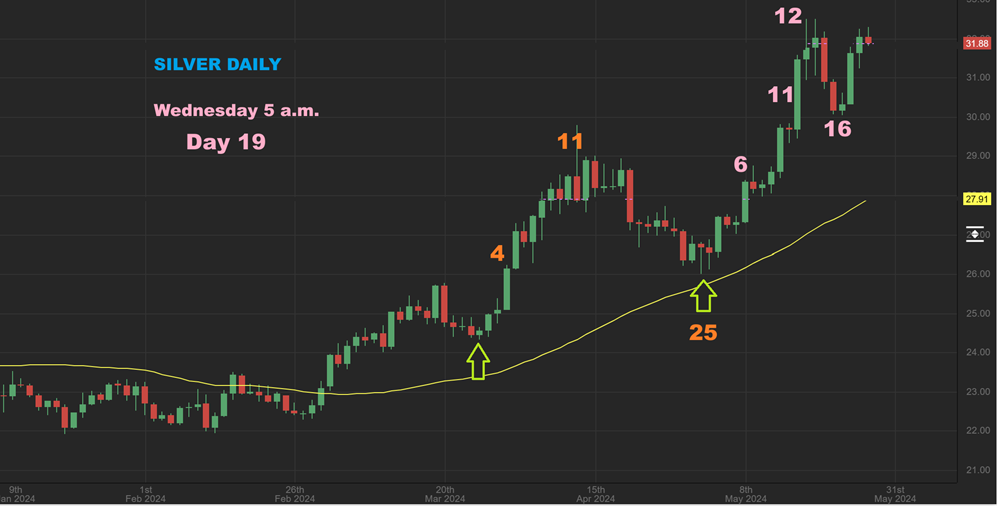
SILVER is much stronger than Gold currently. After a sharp 2 day drop from a day 12 peak, it surged on Sunday to Monday and had some follow through on Tuesday. This is a live chart Wednesday with a small red candle.
.
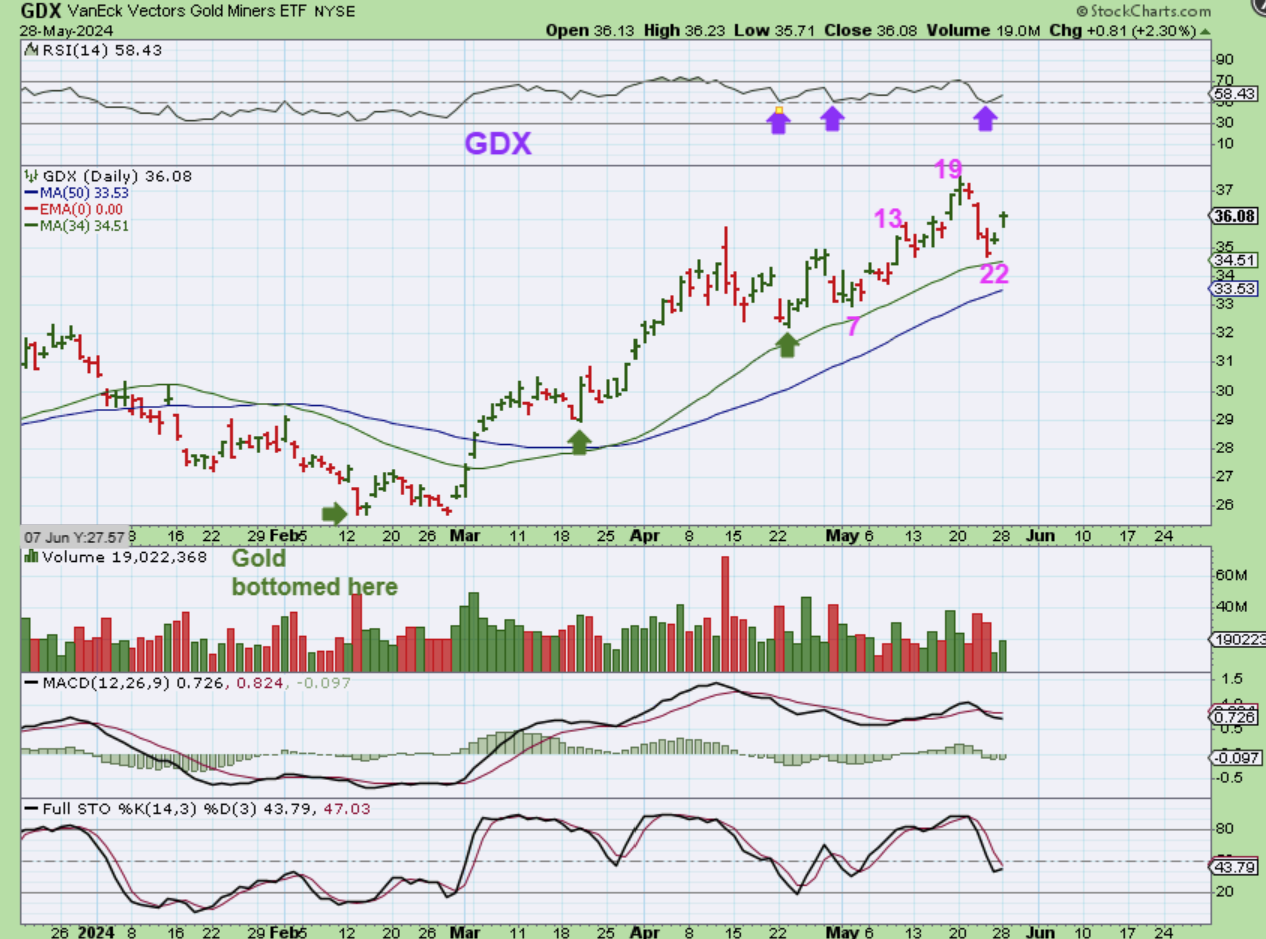
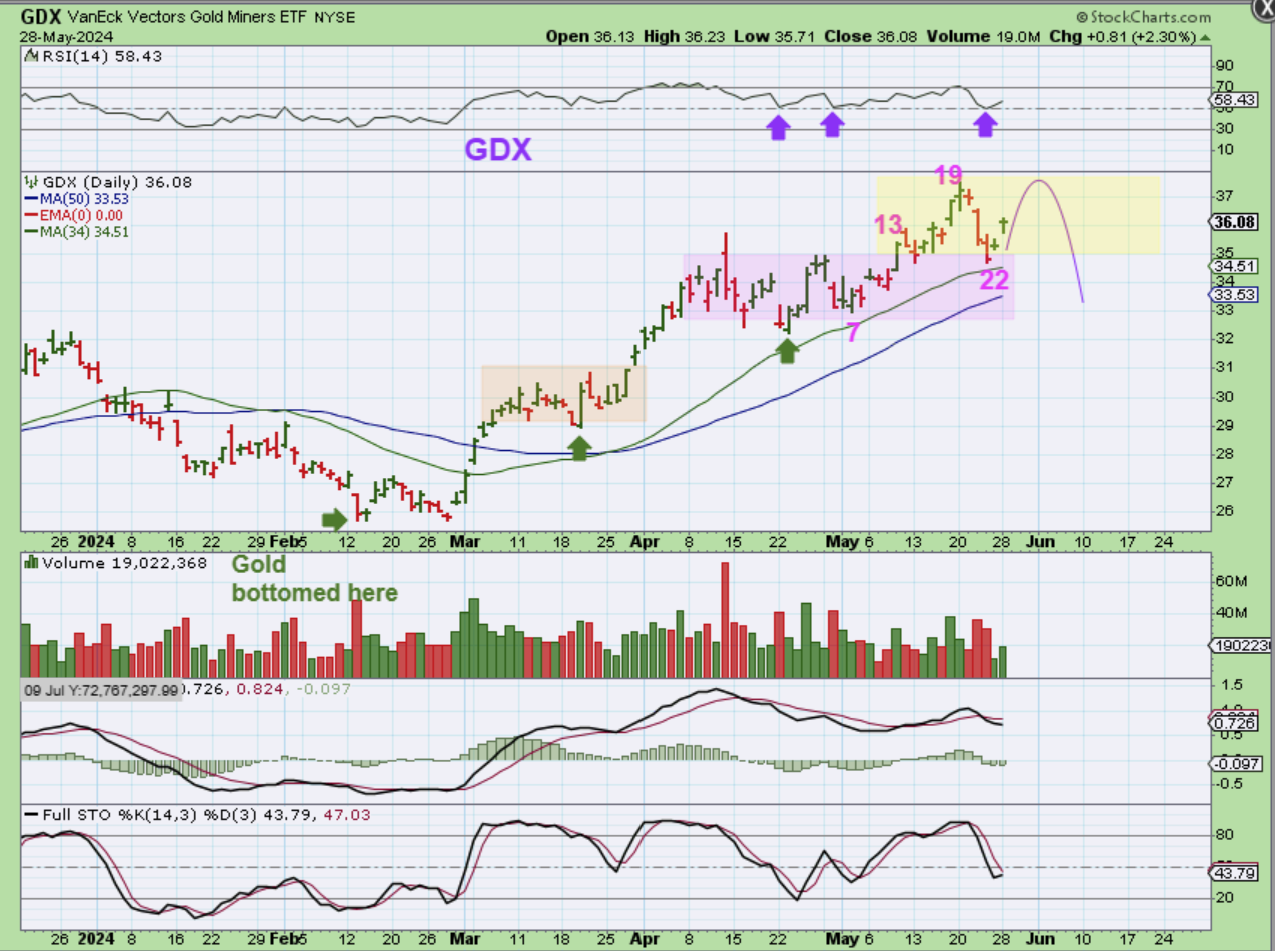
GDX bottomed before Gold & Silver and peaked on day 19. It also dropped sharply and has reversed at day 22 above the 34 sma. So…
.
GDX could rally to a double top and then roll over into a dcl, and that would follow what Gold & Silver look like they want to do, but let me show you something interesting…
.
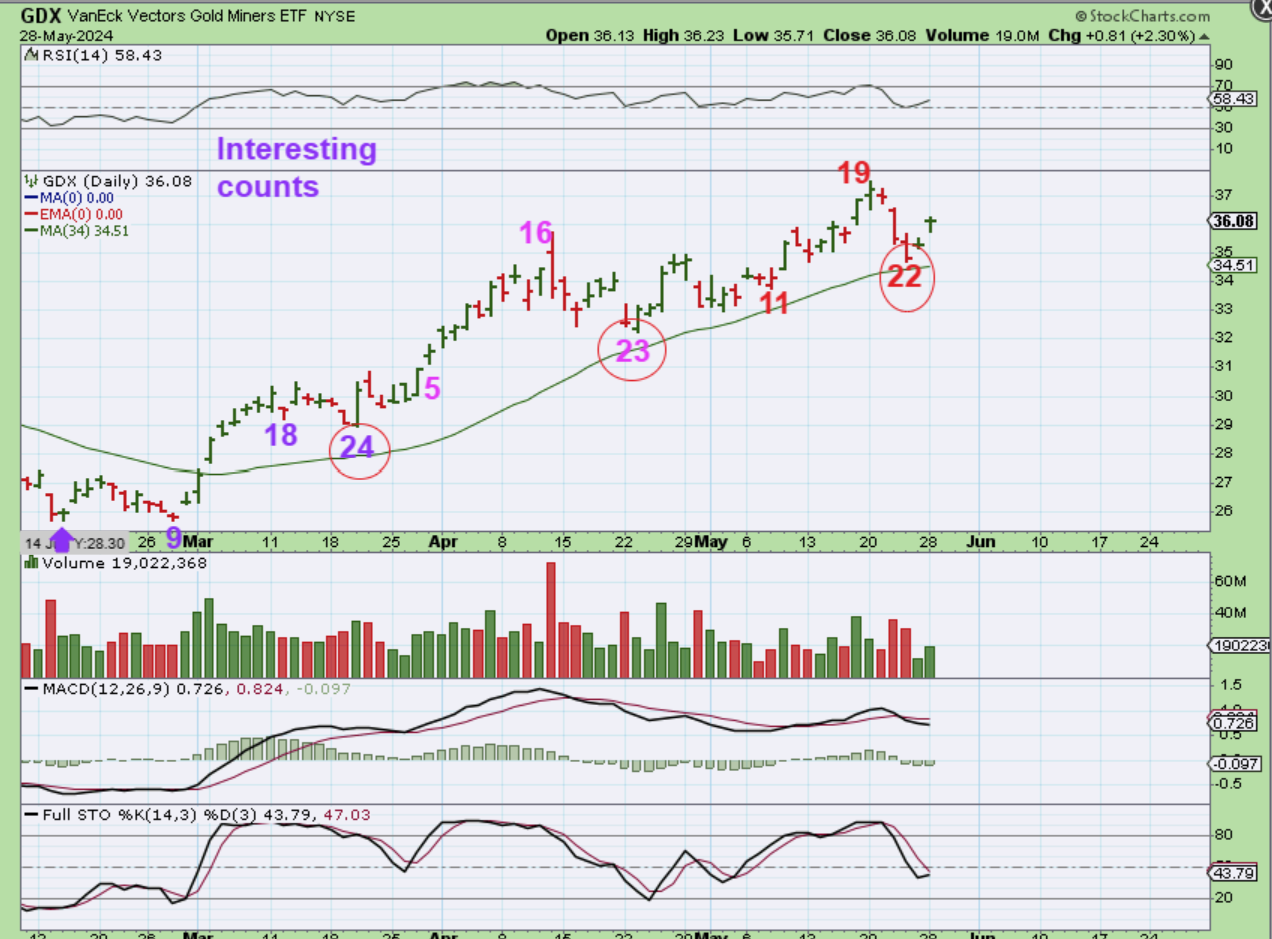
GDX
1. GDX had a day 24 dcl with the first daily cycle.
2. It had a day 23 dcl for the second daily cycle.
3. We are in the 3rd daily cycle and we had a reversal at the day 22 low. That is very interesting, but I still feel that this will gradually roll over with Gold. If you own Miners, you can ride it out and see if any more gains can be made ( I cashed mine in).
.
MORE OF THAT MIXED PICTURE:
.
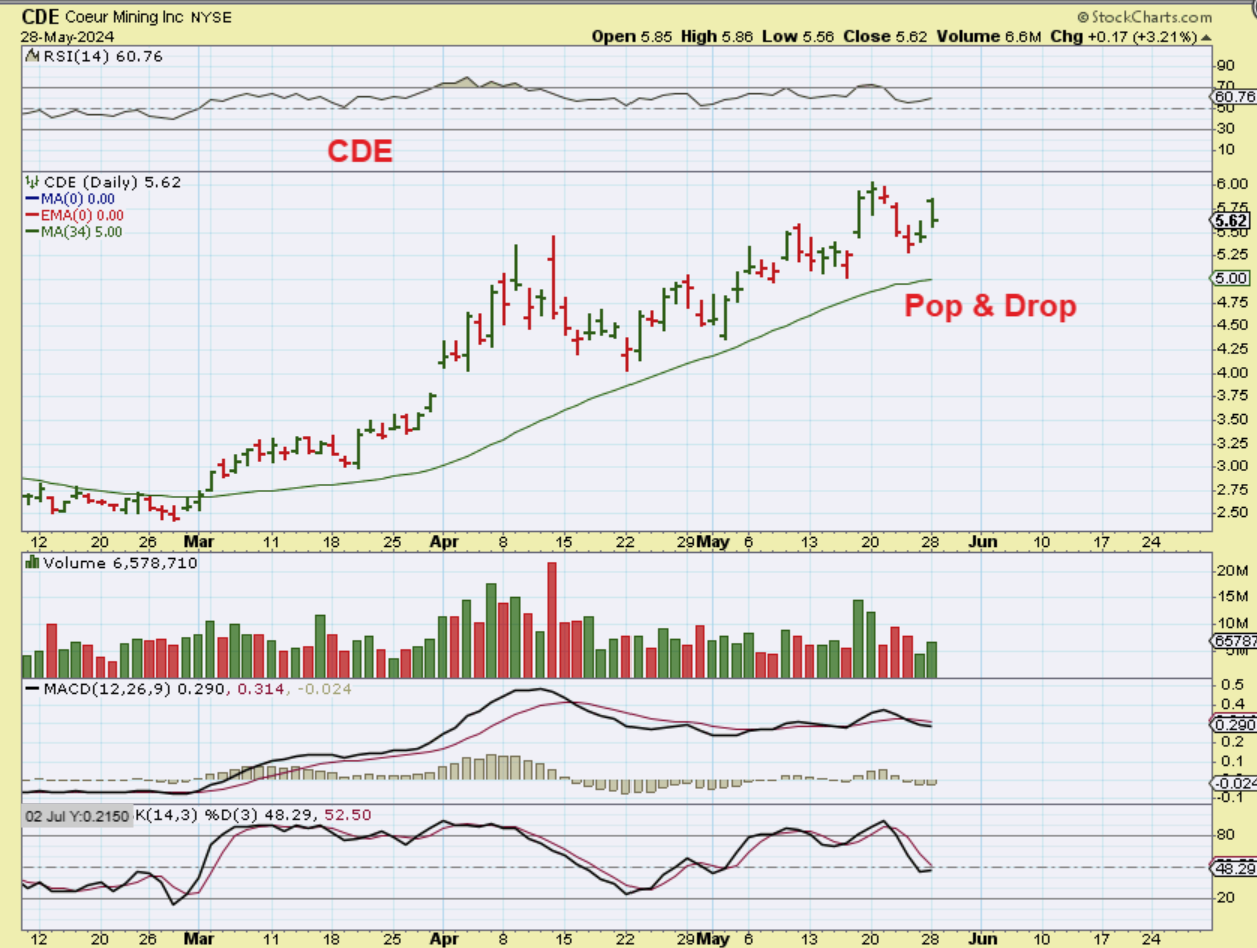
CDE did a pop and drop with Silvers surge, but…
.
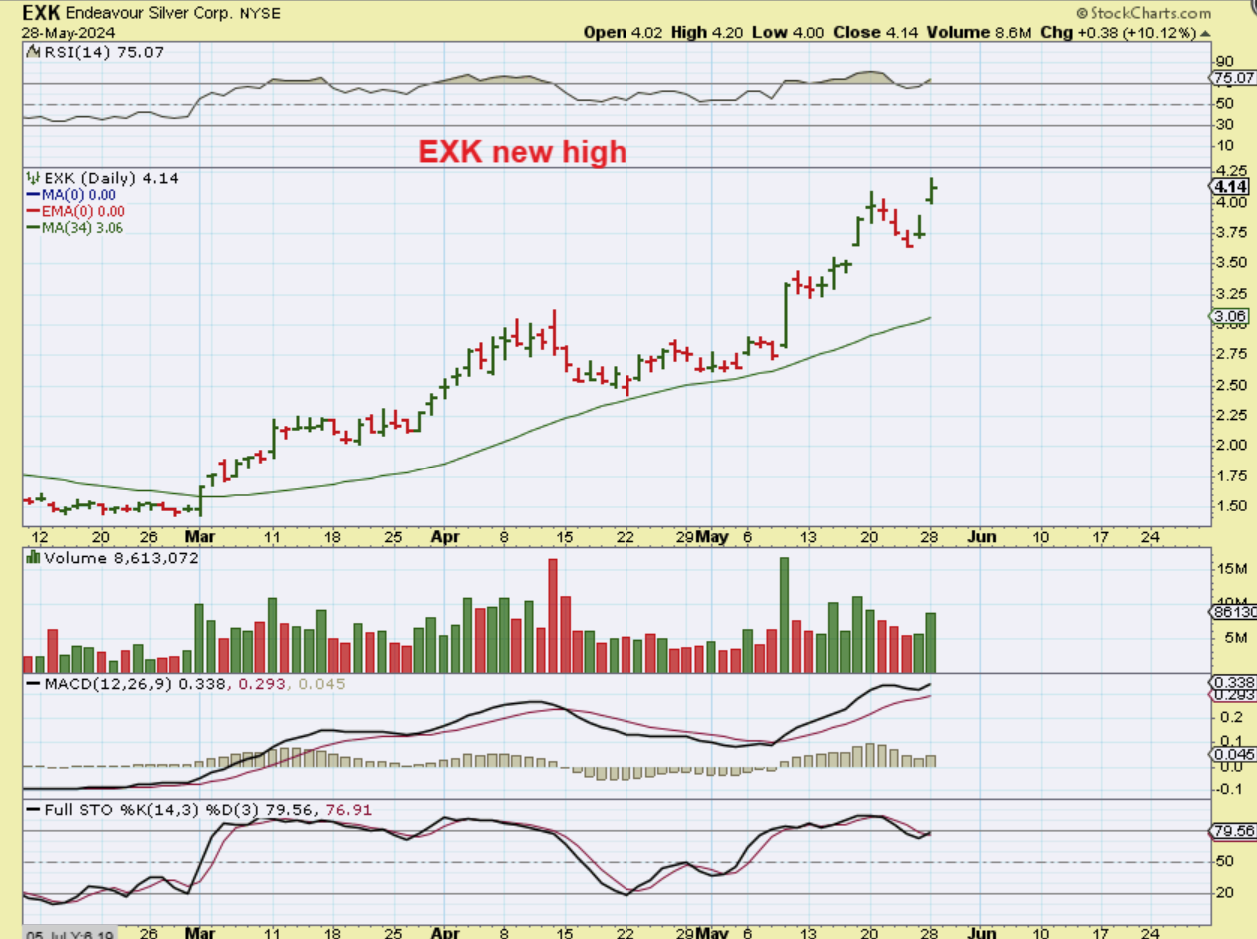
EXK made new highs. FSM made new highs too, HL did a pop and drop.
.
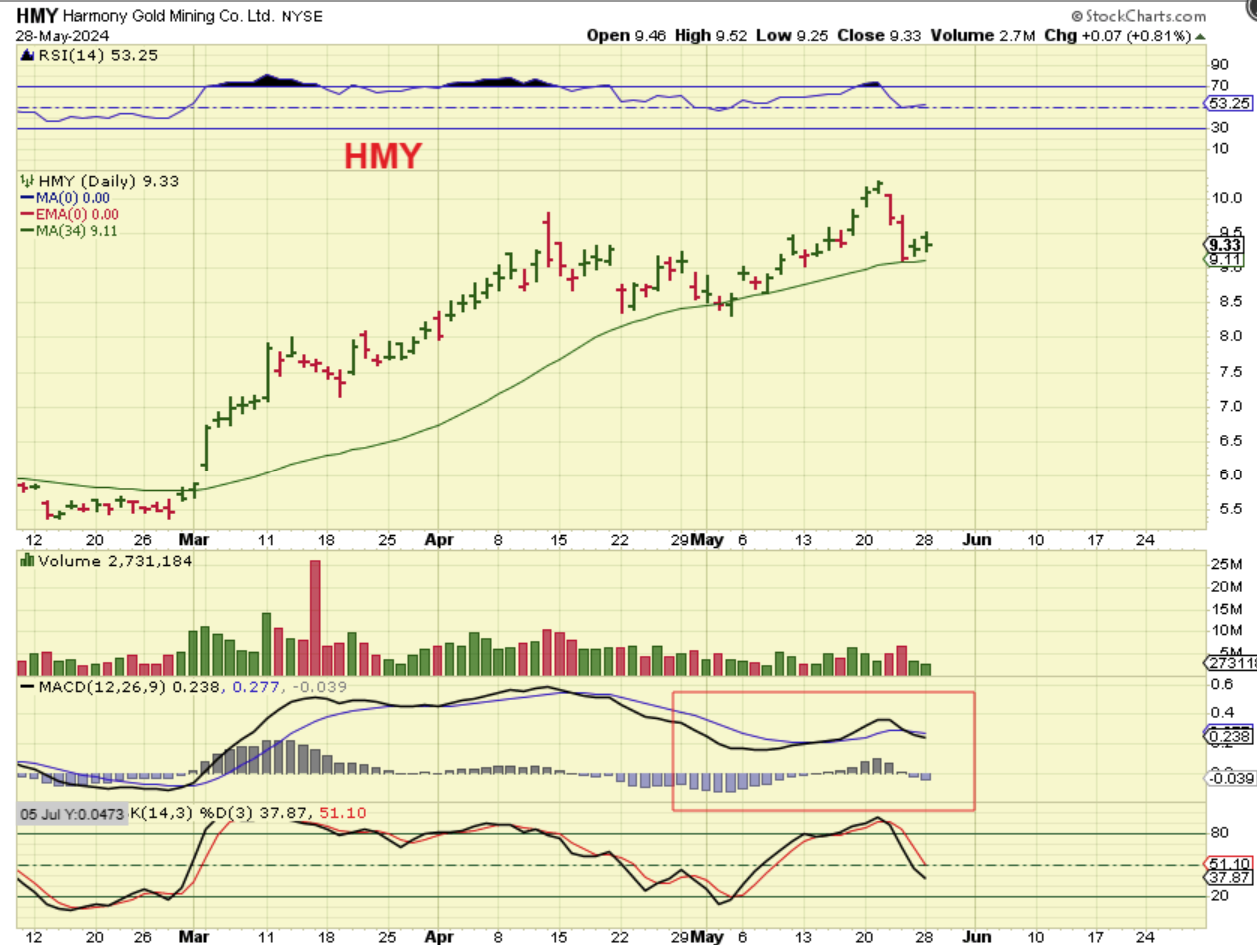
HMY was not running higher with Gold & Silver yesterday, and the MACD seems weak. However…
.
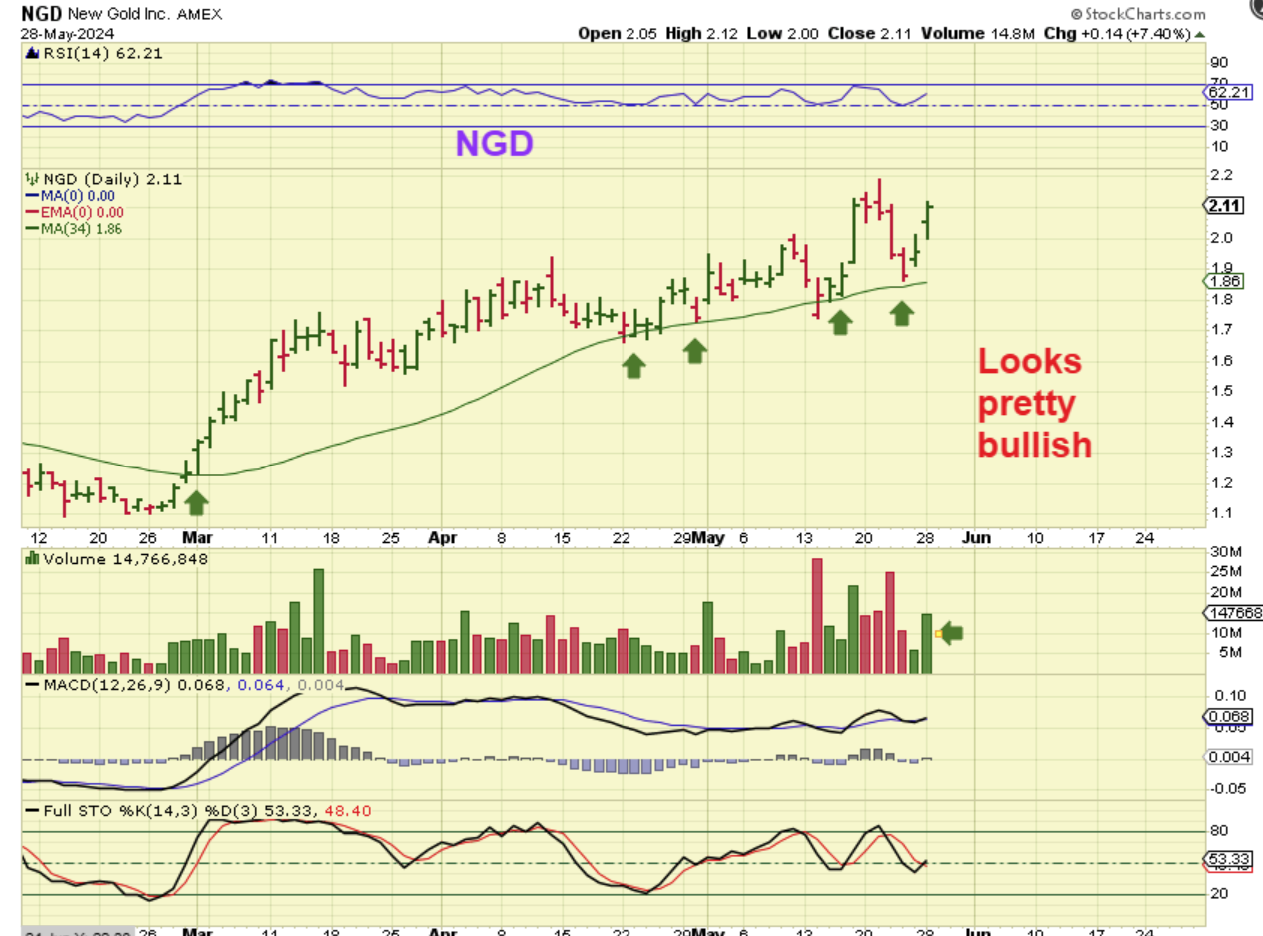
NGD looked strong.
.
So in conclusion: We have a mixed picture with both Gold & Silver Miners. If you are invested in that sector, you can ride it out with stops and see how it plays out. I was stopped out of my positions to lock in profits. Things do remain bullish at this point in the General Markets too, with the NASDAQ actually making new all-time highs on Tuesday, but we are getting later with time for cycles in the General Markets and Precious Metals. I like to trail stops or keep mental stops and step aside if they are violated. Enjoy your Wednesday trading!
.
~ALEX
.
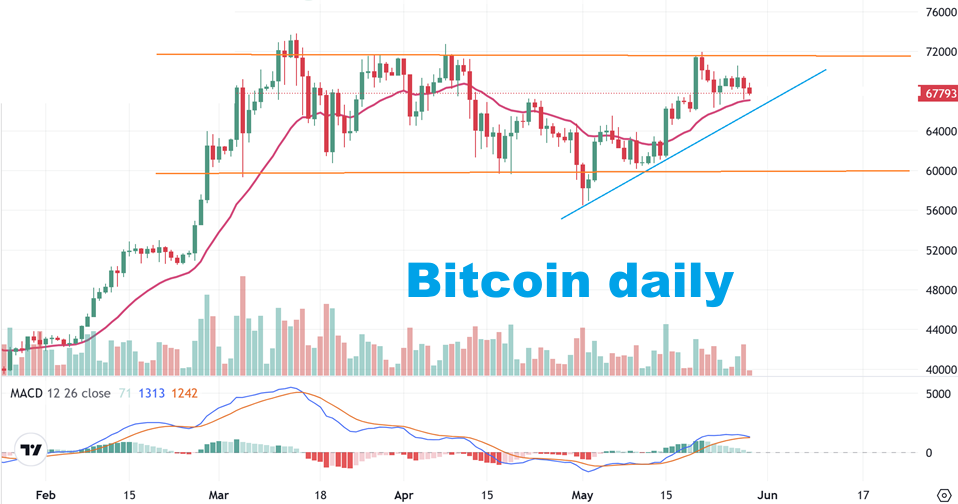
BITCOIN is simply chopping sideways after an initial run out of the recent lows. I have mentioned that with 60 day cycles, we could continue to see chop and consolidation or this could break out and rally. We are still waiting for Bitcoin to reveal its intentions.
.
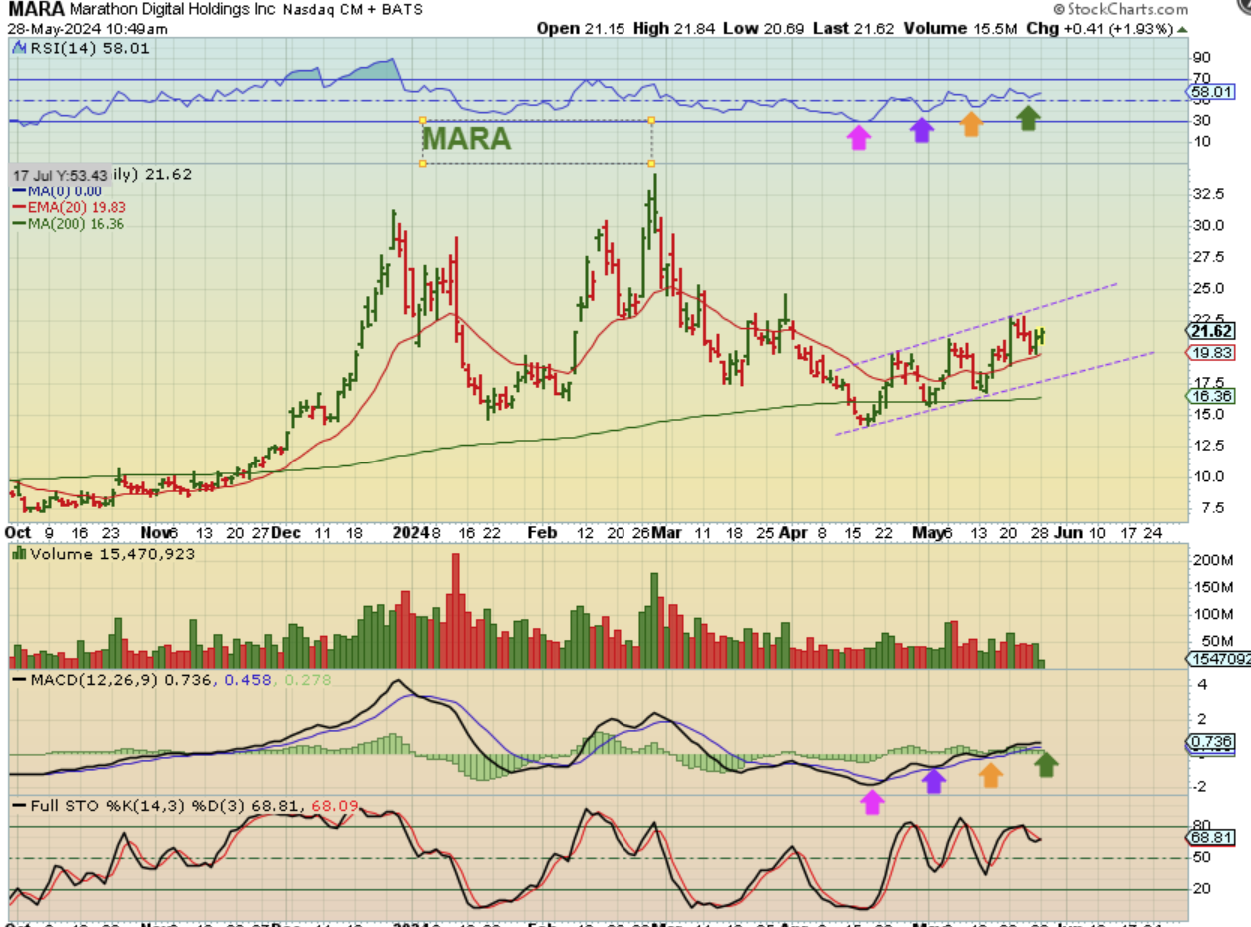
MARA has also climbed out of the recent lows, so I pointed that out yesterday. It has moved from $15 to $23, but it is choppy and could pull back if Bitcoin does.
.
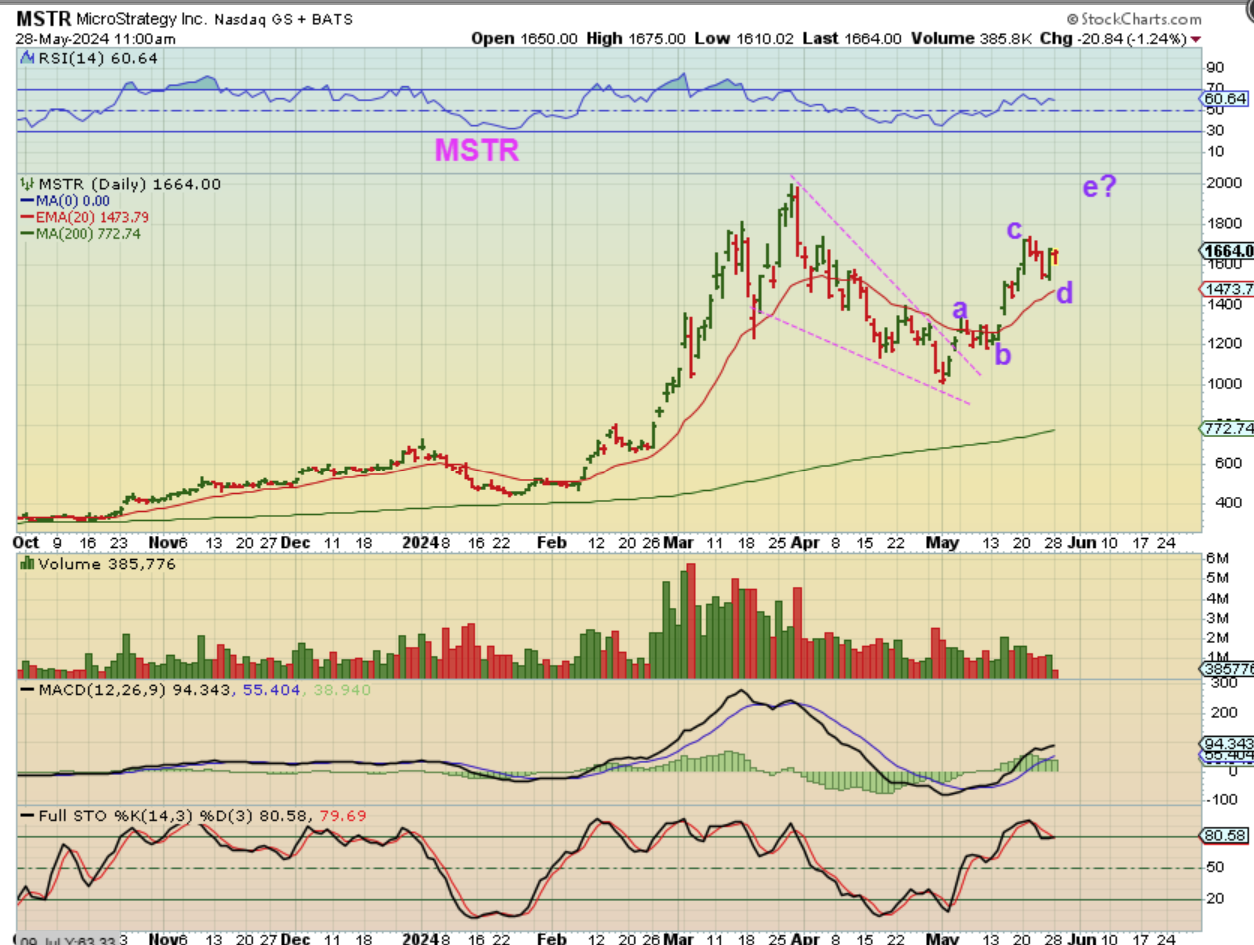
MSTR – I like the set up for MSTR, because it does rally nicely when Bitcoin does run. I was looking for a 5 wave move higher. Could this drop to the 20 ema if Bitcoin puts in a day 30 dip, and then move higher from there.
.
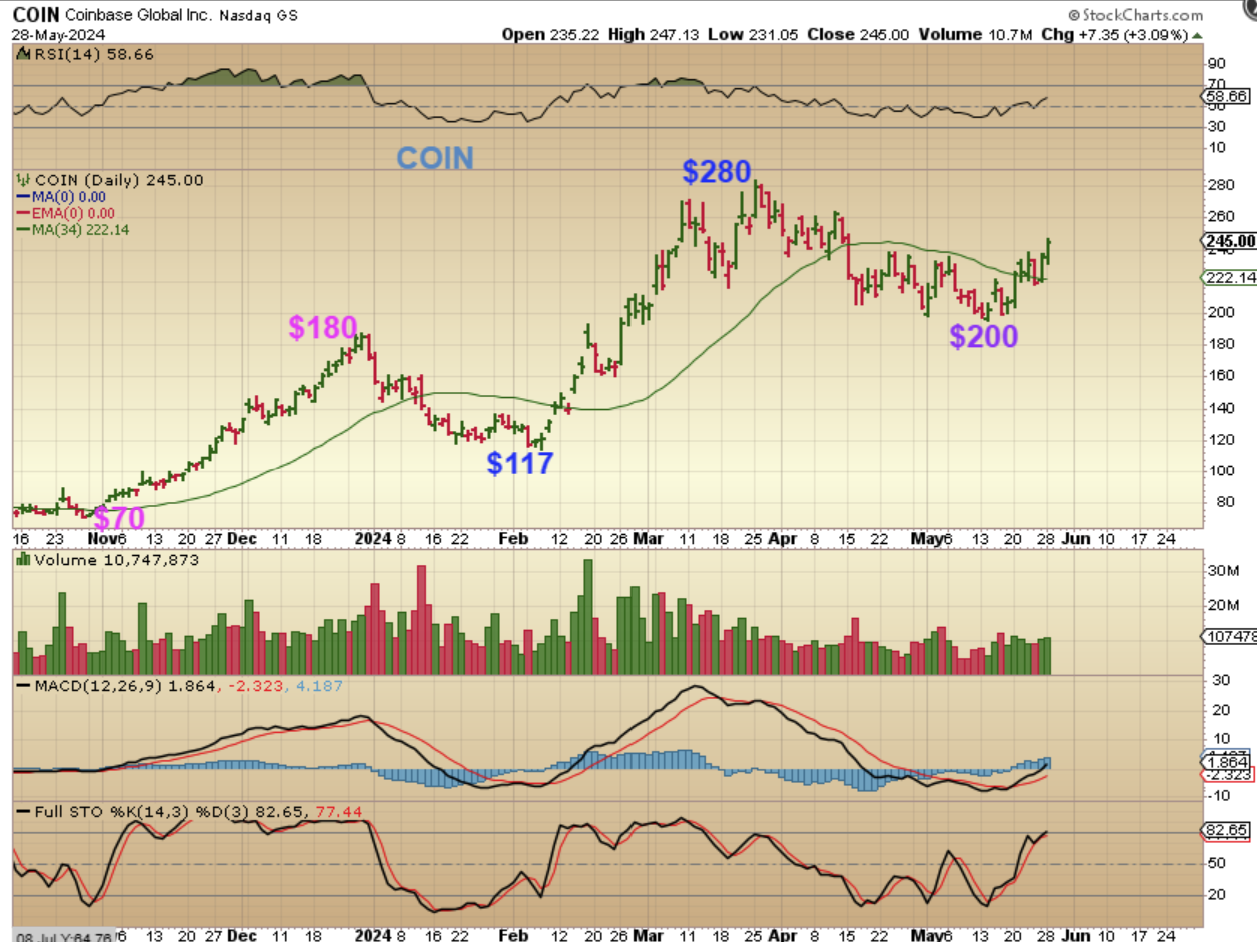
COIN is a strong runner too. Take a look at the last moves higher for Coin.