Friday May 24th – What About The Dips?
.
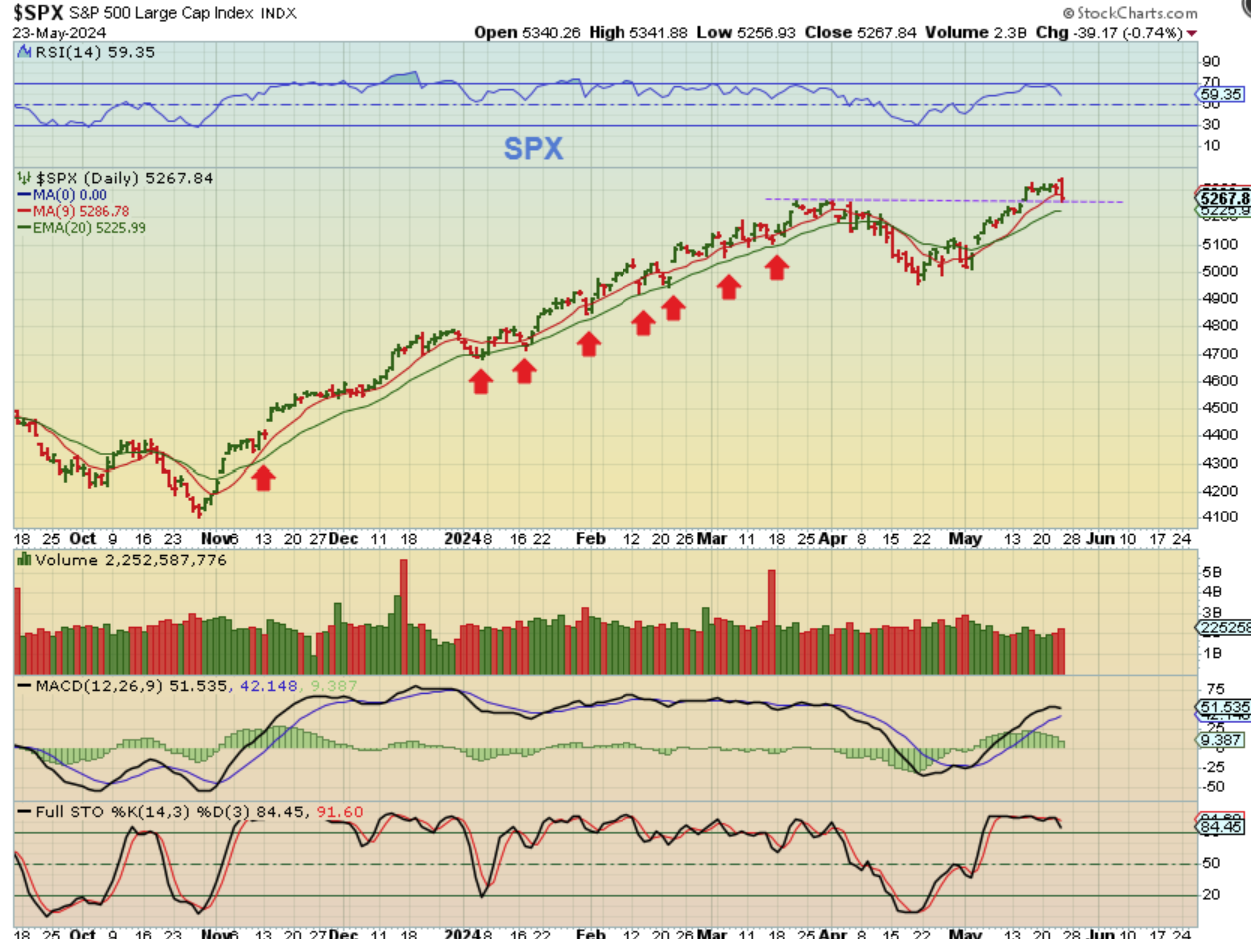
THE SPX hit all-time highs again, but then sold off as the day went on. It was more than a gap fill. When price gaps open higher and then closes lower, completely engulfing the prior days candle, it is a warning and is called a ‘Bearish engulfing ‘. We do have that here, so I mentioned yesterday that we want to be aware of the idea that if the markets are going to top (Dow Theory in play), we could see the big boys selling into the buying or selling the top. ‘Topping out can be a process.
.
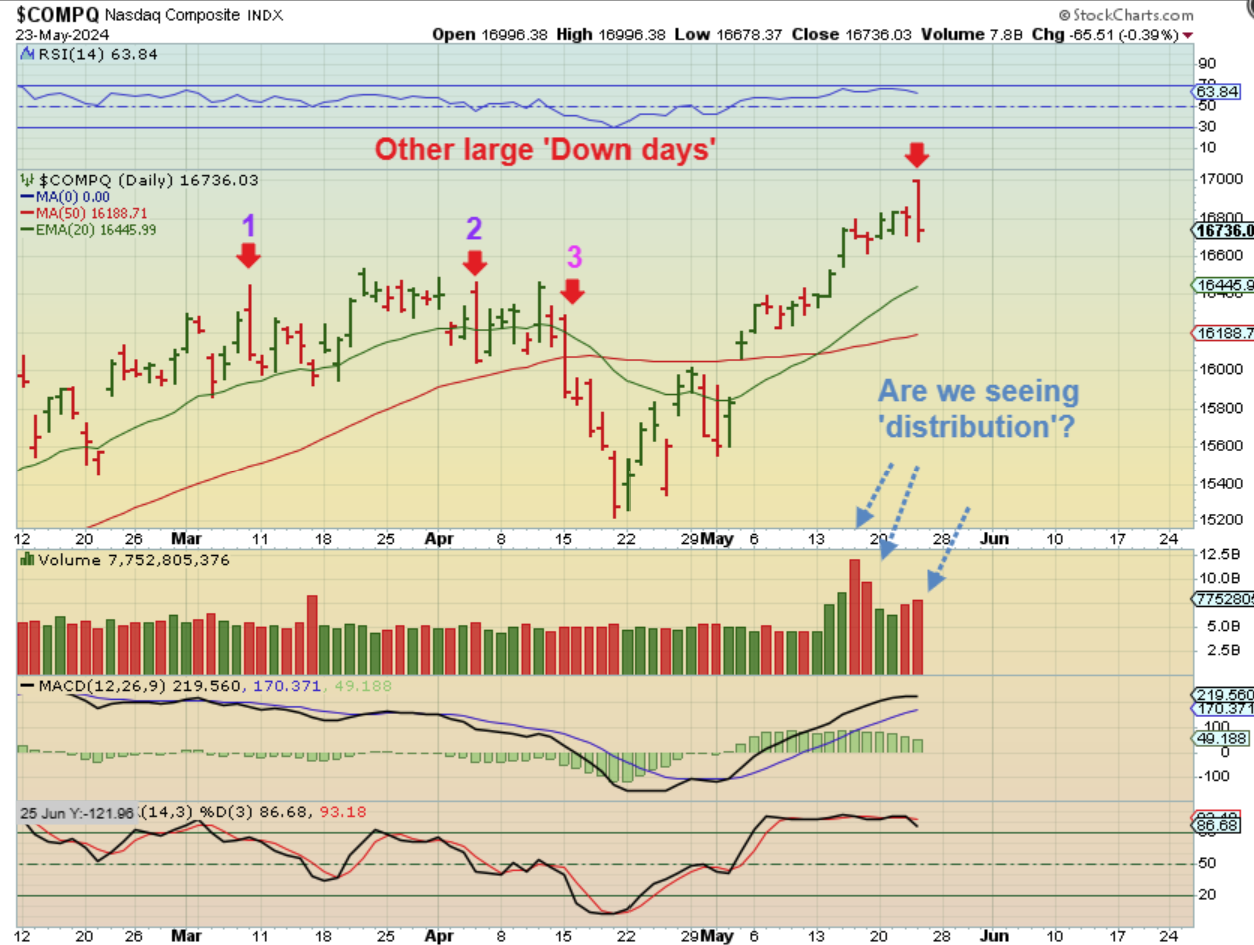
The volume on the NASDAQ selling seems high at times, so are we seeing distribution? As you can see here, a large day of selling has not always turned into a waterfall sell off.
We have seen Big reversal days with minimal follow through, so at this point what do we have? NVDA released earnings and Jobless Claims was released and the futures for the Nasdaq were up over 200 pts. The markets gapped open much higher, to new all-time highs, but then selling overtook the markets and gave us a big reversal day on day 24. We could start to chop into the next dcl, or put in a quick half cycle low, we just have to wait and see.
.
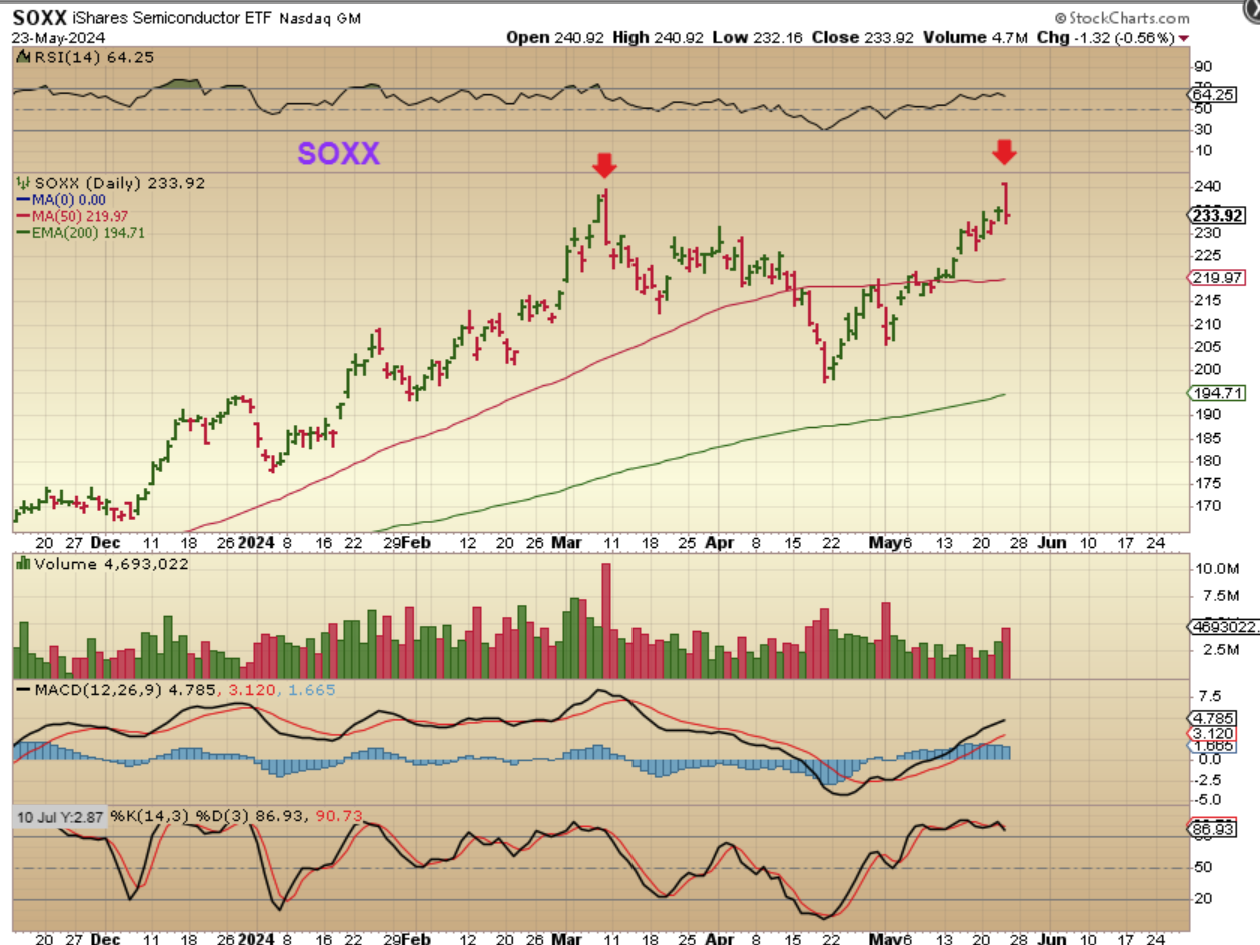
I mentioned a SOXL trade based on SOXX too. I would probably start to think about closing that trade out and simply go into ‘wait and see’ mode from here. The markets can bounce around and SOXX can test the highs again, etc, but that was a good trade, it is leveraged and can decay in choppy markets, so why risk giving more of it back.
You can go back and re-read the ‘summary’ that I put right under the General Markets Section in yesterdays report, to understand better what I am looking at and looking for.
.
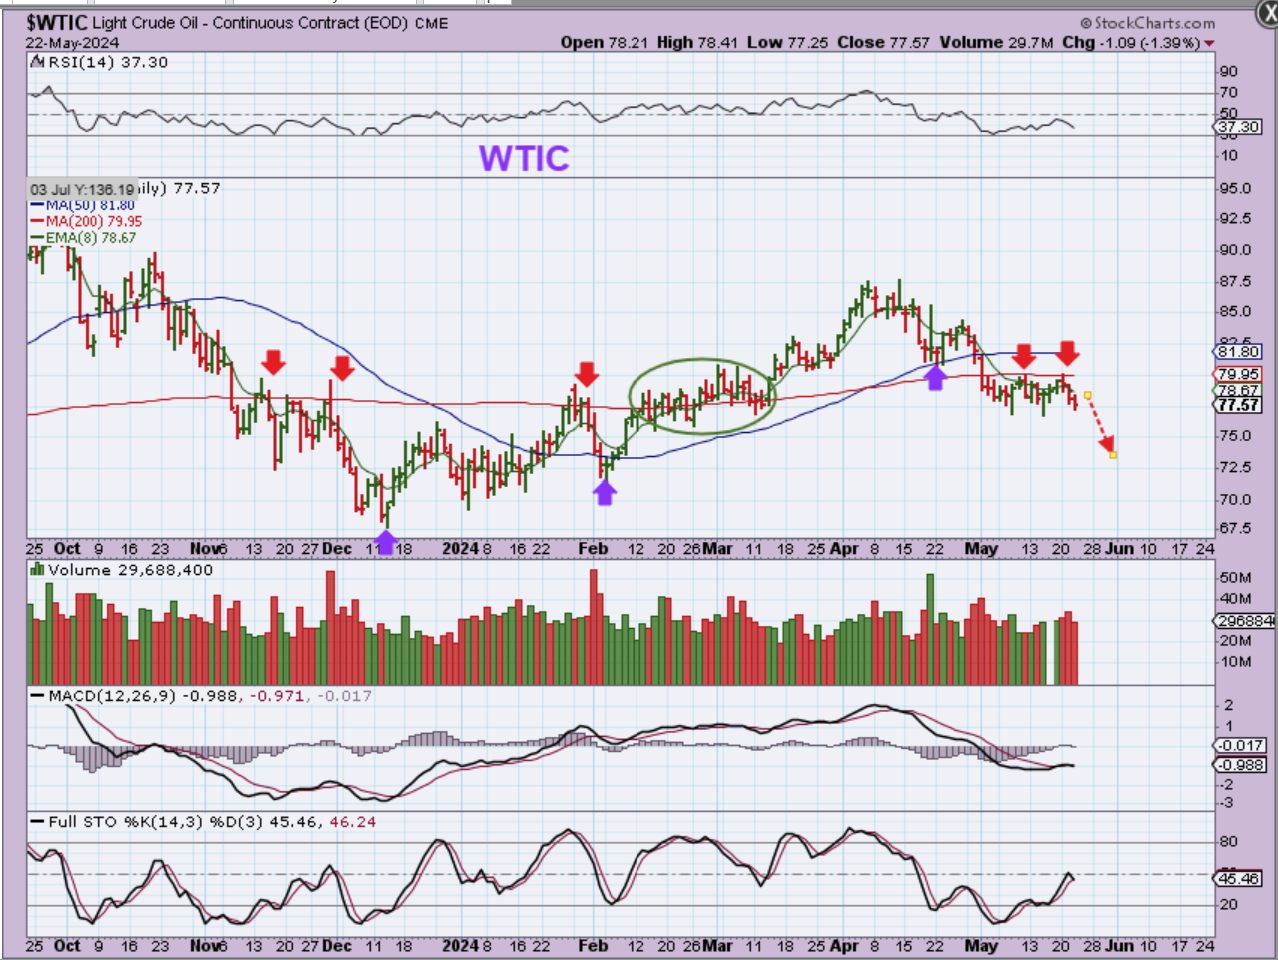
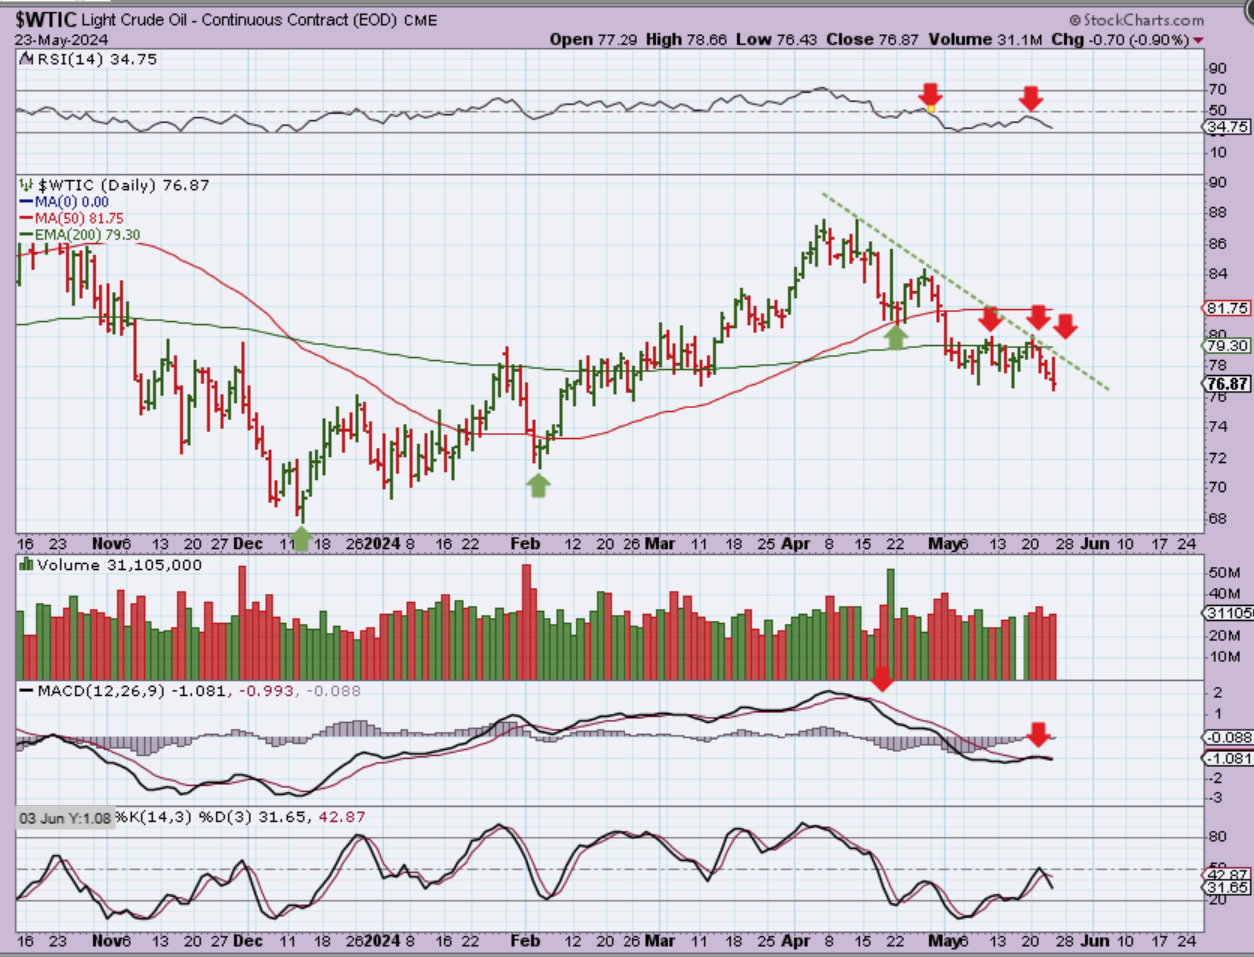
Yesterday I mentioned …’This weaker 3rd daily cycle now gives it a H&S look too, so we expect weakness and a drop into the ICL later in time. That is where I think we are with Oil. ‘
.
WTIC – Oil tried to run up to that 200 ema or sma again, but it then sold off. I believe that we are in a weak 3rd daily cycle and Oil will drop even lower over time.
.
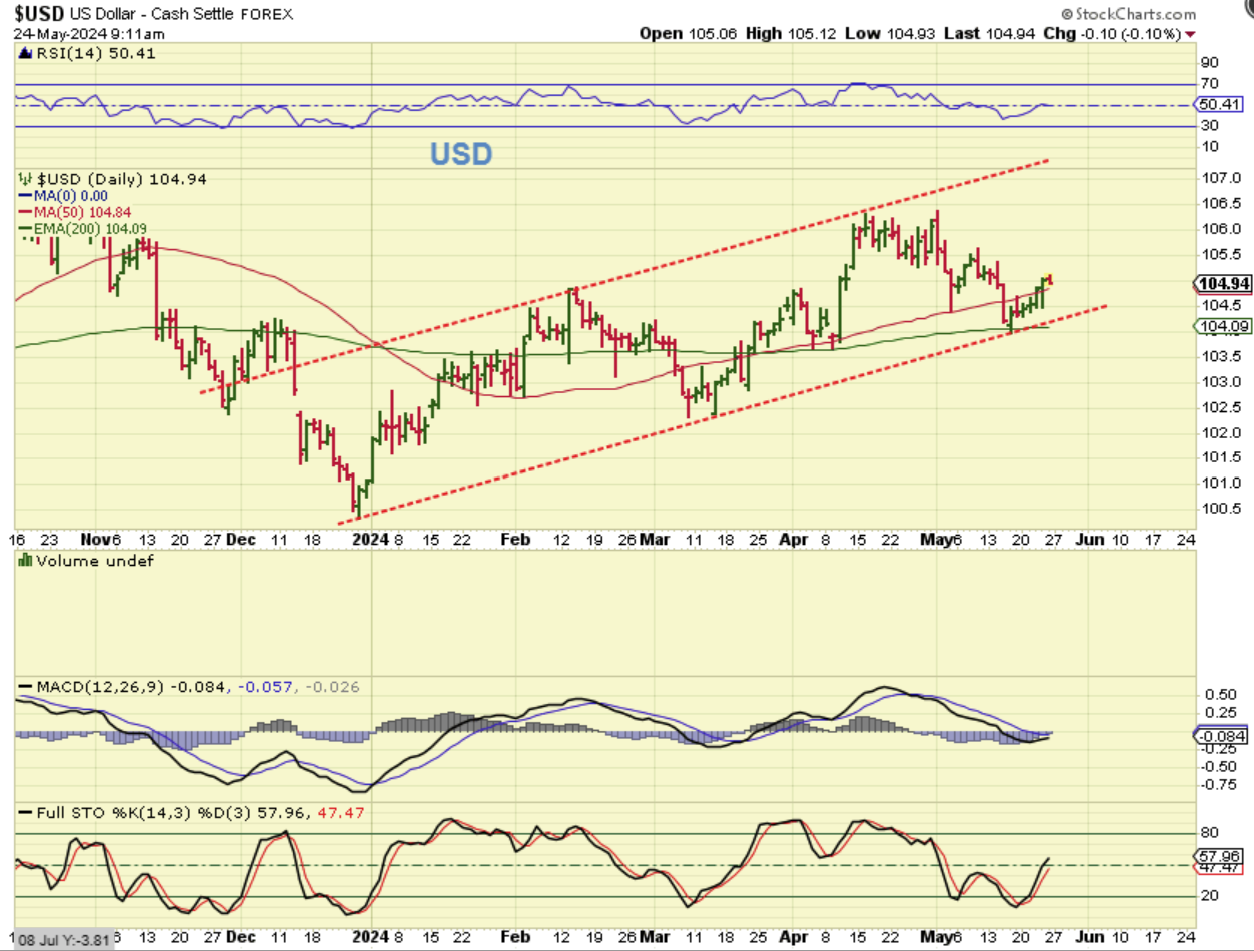
THE USD has a dcl, but the upside progress has been a struggle so far.
.
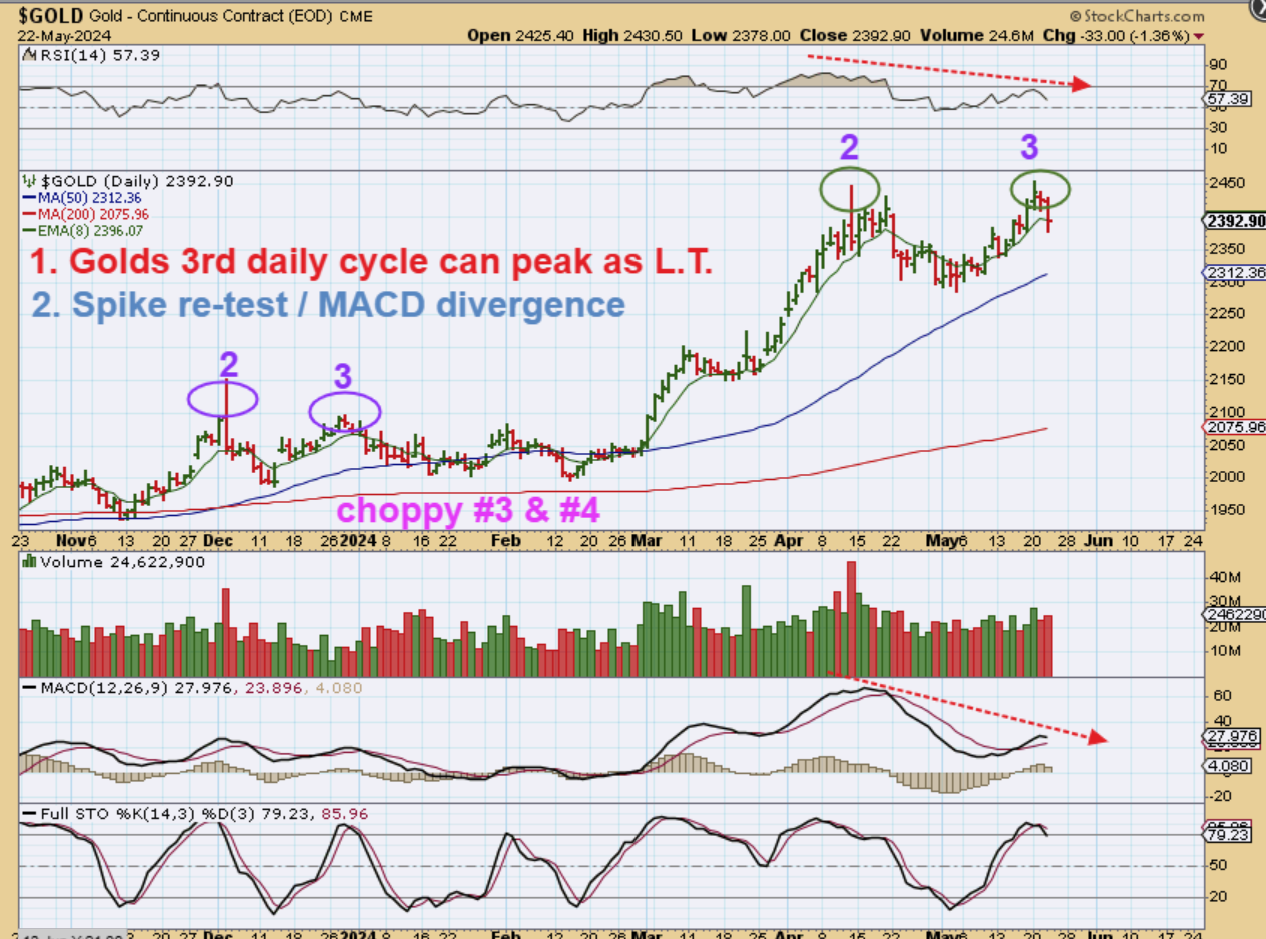
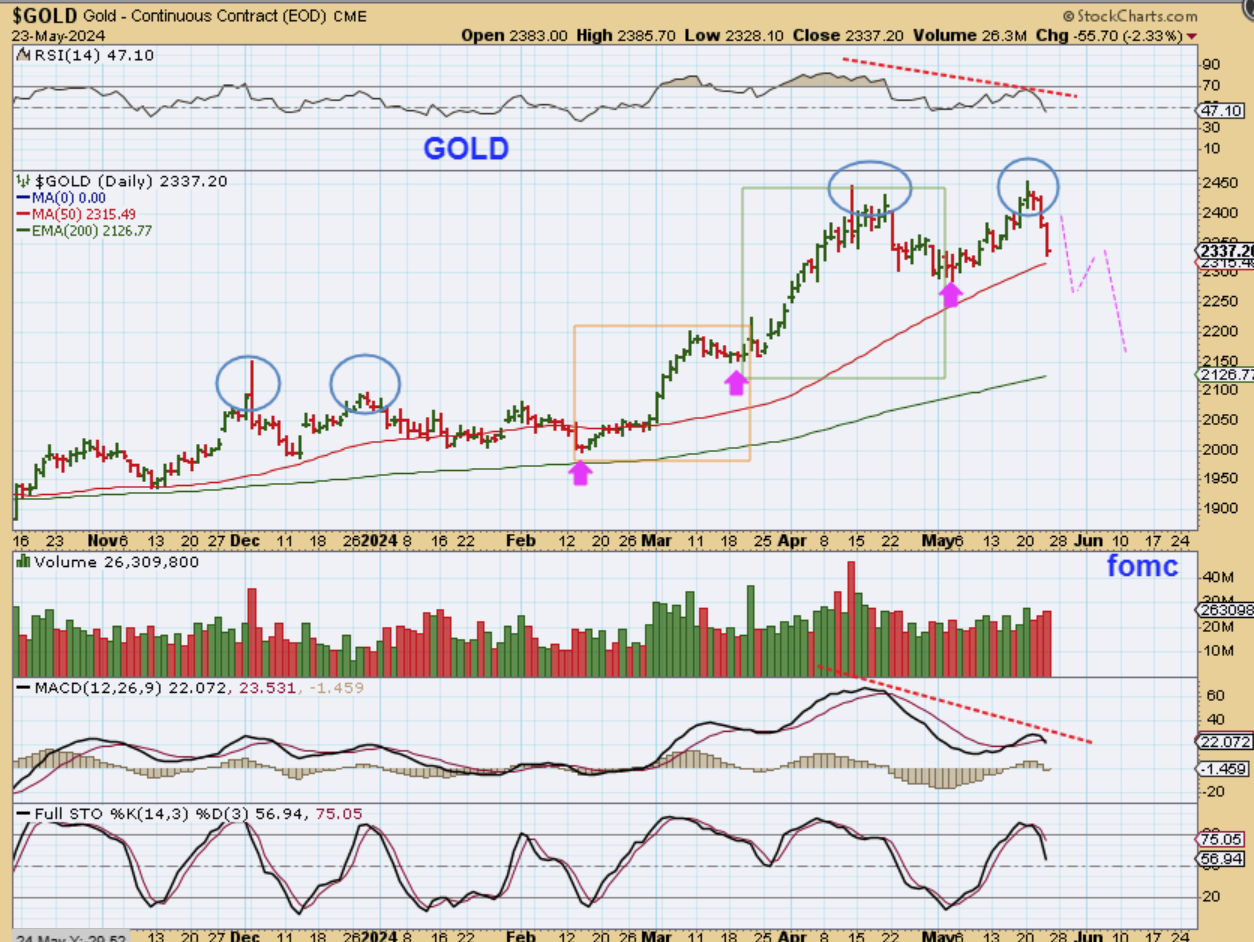
This is part of what I said about Gold yesterday:
“There is a chance that this test of the spike in the 2nd daily cycle becomes the peak for this Intermediate Cycle, just like the last Intermediate Cycle did. Take a look at how that DID play out with the last Intermediate cycle in December of this chart. Notice that the sell off into the ICL wasn’t a massive drop like Gold used to have, but it was a long boring choppy period of time. Please read this chart.”
.
GOLD dropped on Thursday too. Gold has taken back quite a bit of the cup with the last 2 day drop, and that is a bummer. There is the possibility that Gold now becomes choppy and drops into the FOMC Mtg on June 12th, and it MIGHT be an ICL drop to the 200 ma. Gold peaked on day 11 so far, and that is most likely going to become a L.T. daily cycle.
.
I WANT TO REPEAT WHAT I WROTE YESTERDAY WITH THE FIRST 2 CHARTS, AND THEN I HAVE 2 NEW CHARTS, BUT NOTHING HAS CHANGED FROM YESTERDAYS THOUGHTS:
.
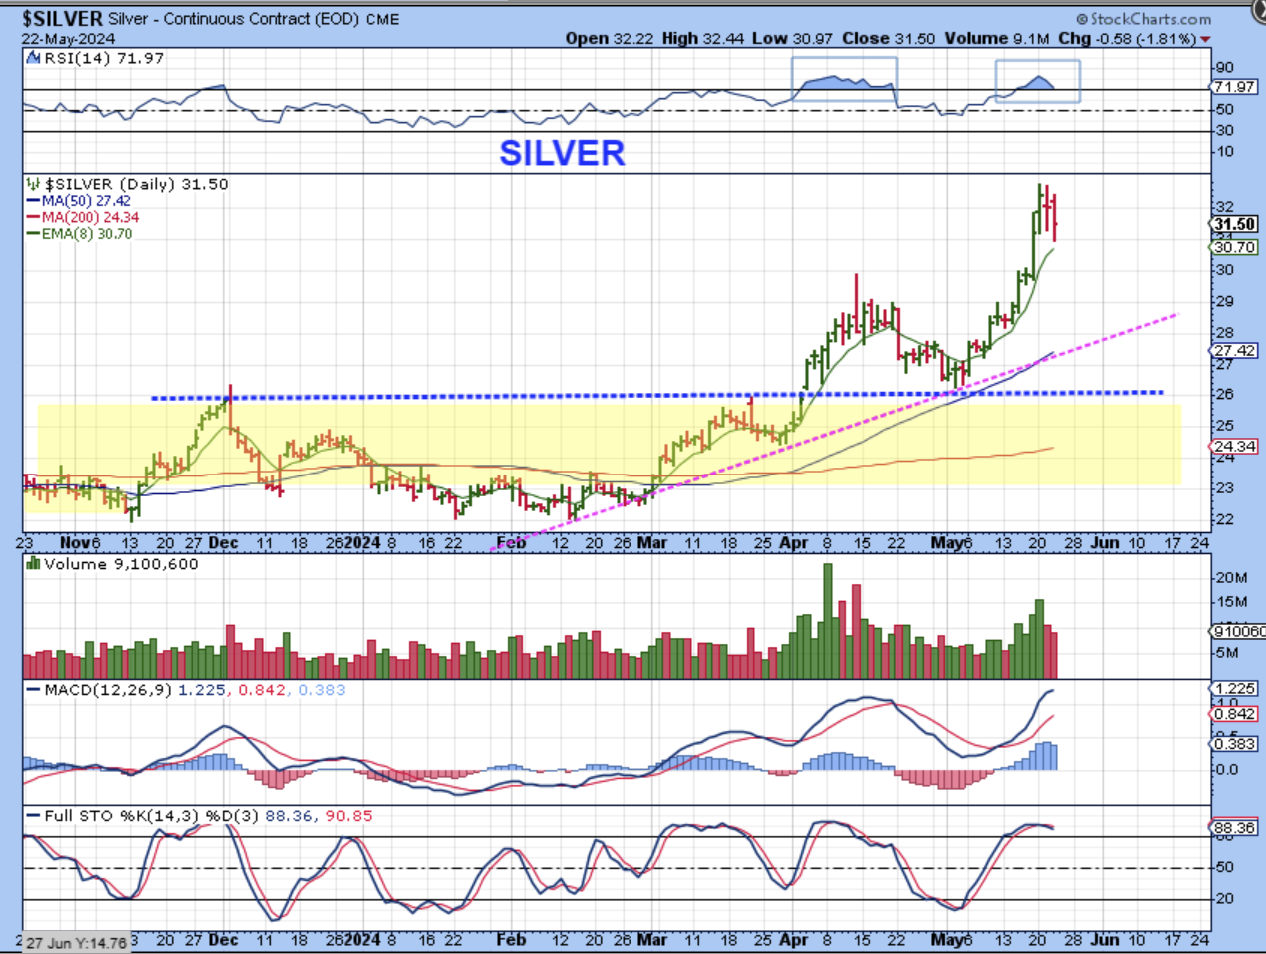
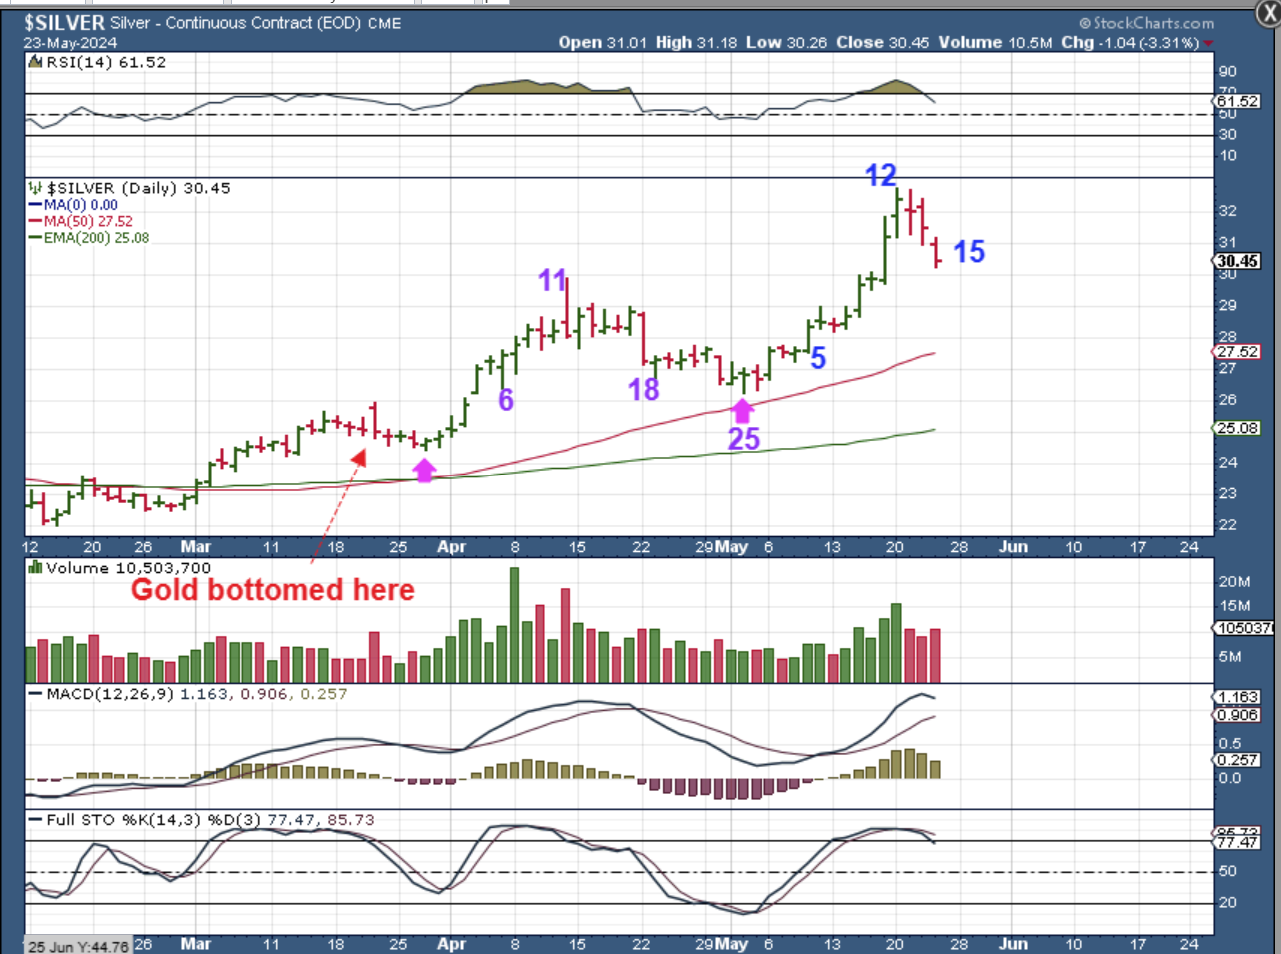
SILVER surged recently as it broke through that key $30 area. We hardly saw a red down day on that rally, but now we see 2 somewhat large red candles. This is day 14 and we have to wonder if Silver peaked and will now chop around and find a dcl over time? Notice that…
.
Notice that when SILVER sold off into the last low, it had a LARGE drop and then the selling was really just choppiness and drops with bounces. We may see something similar unless we only get a half cycle dip and then one more rally to new highs.
.
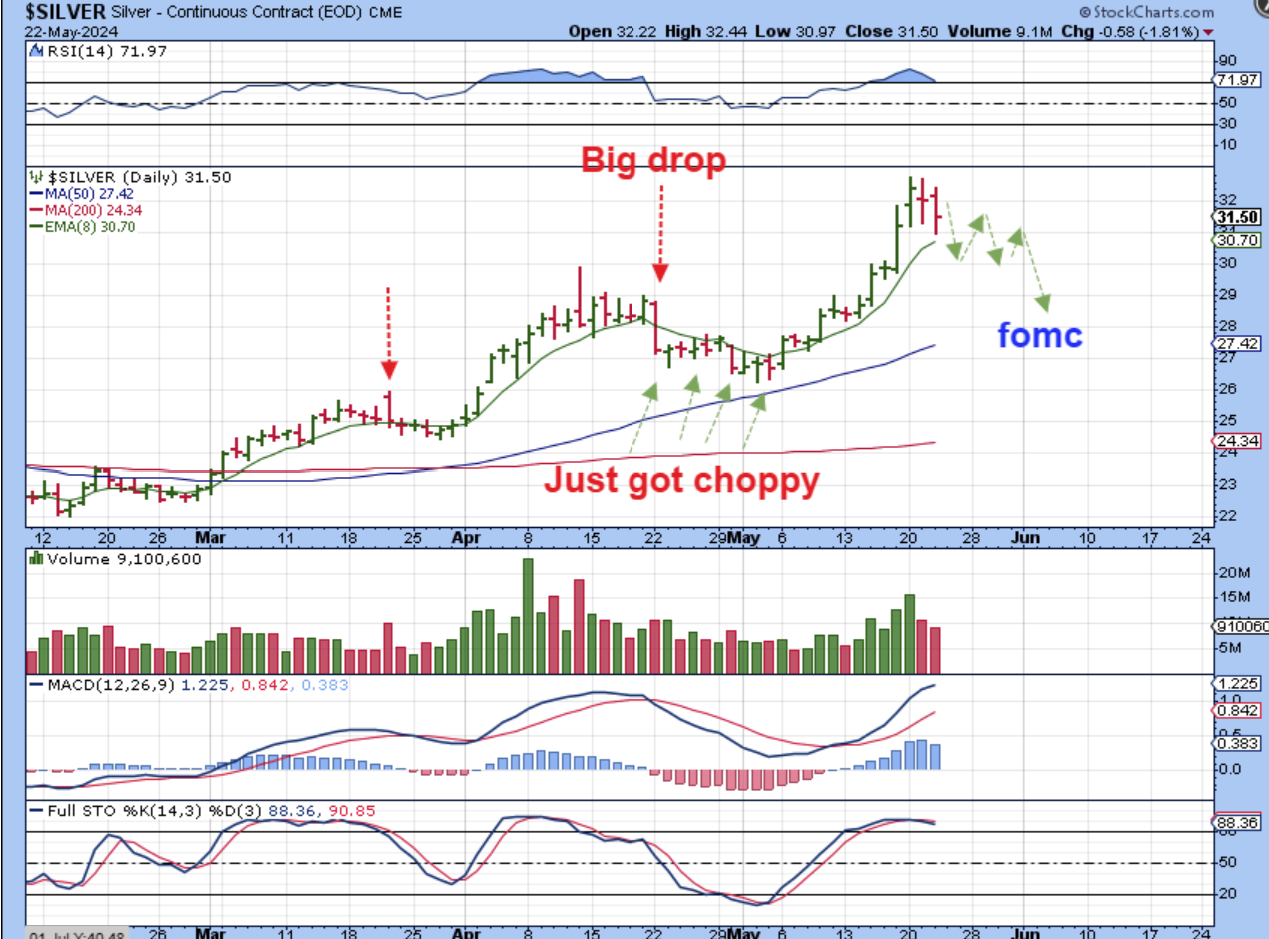
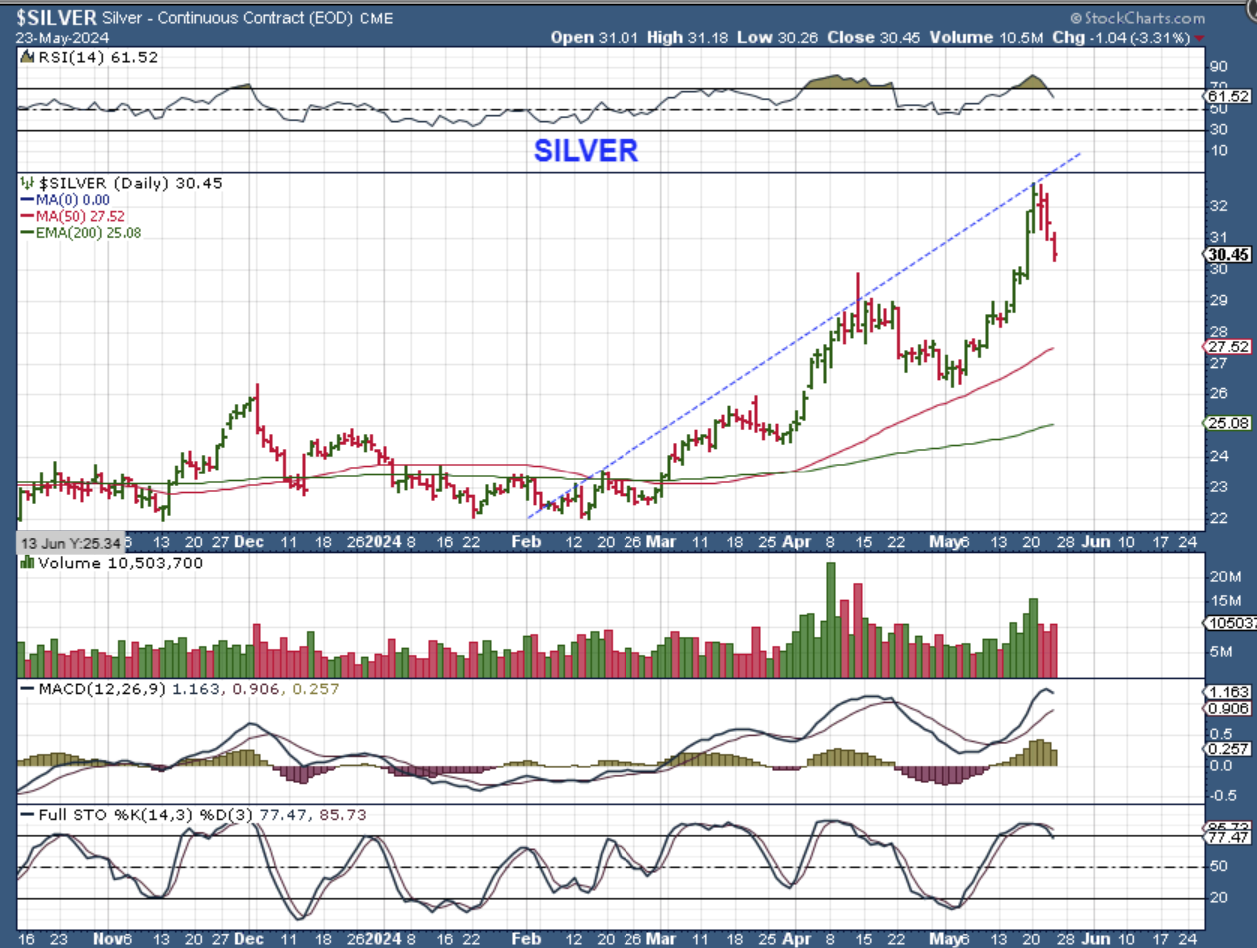
SILVER dropped on Thursday too. It looked stronger than Gold on this last run and didn’t really have MACD divergence like Gold did. It made strong new highs well above the cup formation, but it also is stretched out and is now pulling back with Gold. As a 3rd daily cycle, this could be when we see the Intermediate Cycle peak.
.
SILVER peaked on day 12 and this is day 15. When I look back at the last daily cycle drop, I see that it had a very sharp drop and then chopped around with 1 green day, 1 red, 1 green day, 1 red for 2 weeks. That was quite choppy and that could repeat. We also may just do an a-b-c down over time.
.
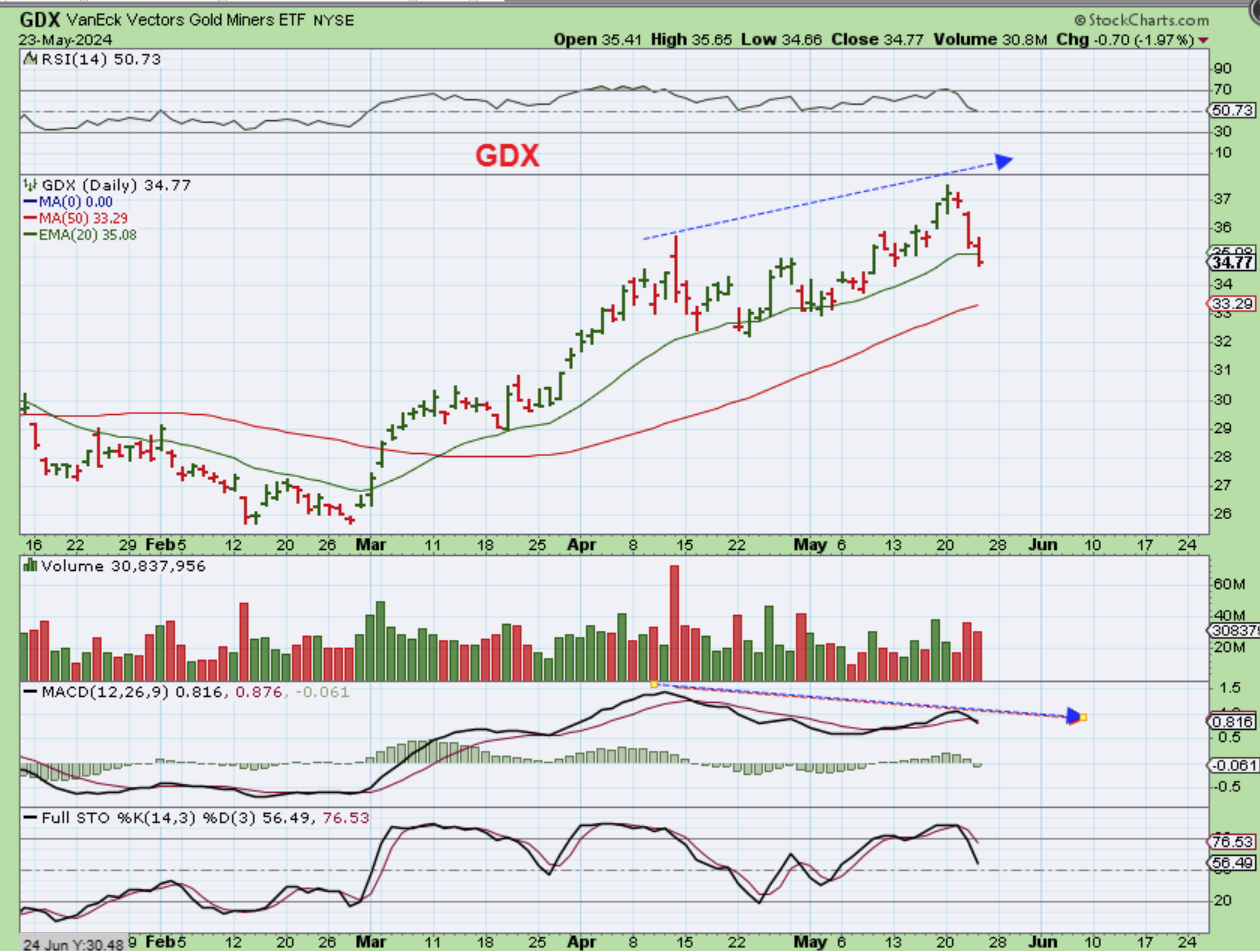
THE GDX sold off further too and as mentioned yesterday, this could be the peak of the cycle. It may chop around and find the next low around the fed day on June 12th…
.
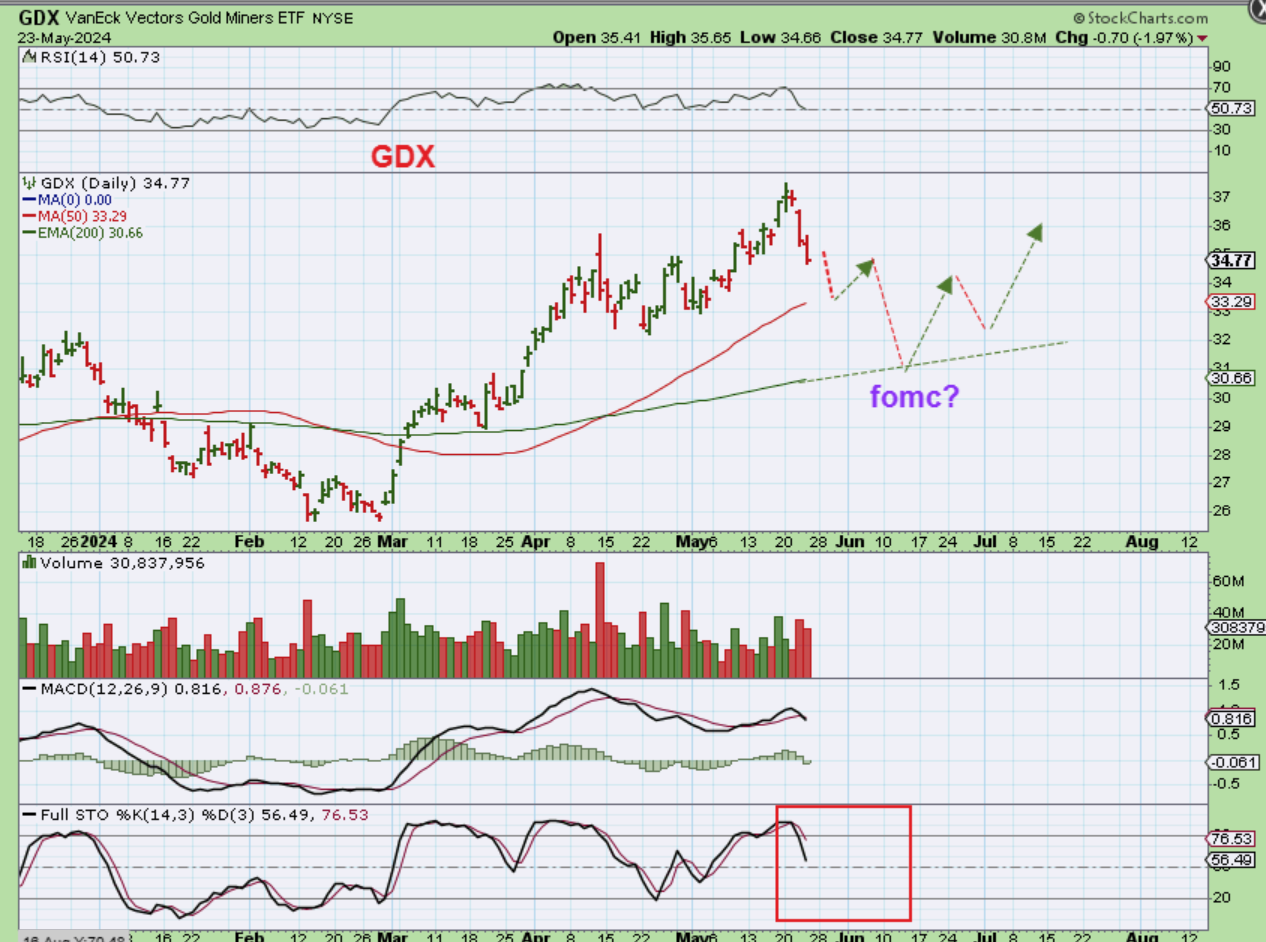
GDX- I drew an a-b-c style dip, but the last drop into a dcl was really just a choppy consolidation period. This was just drawn as an idea of how the 50sma could act as support, and then we drop into the fed mtg. It is not a prediction, but it is a possibility.
.
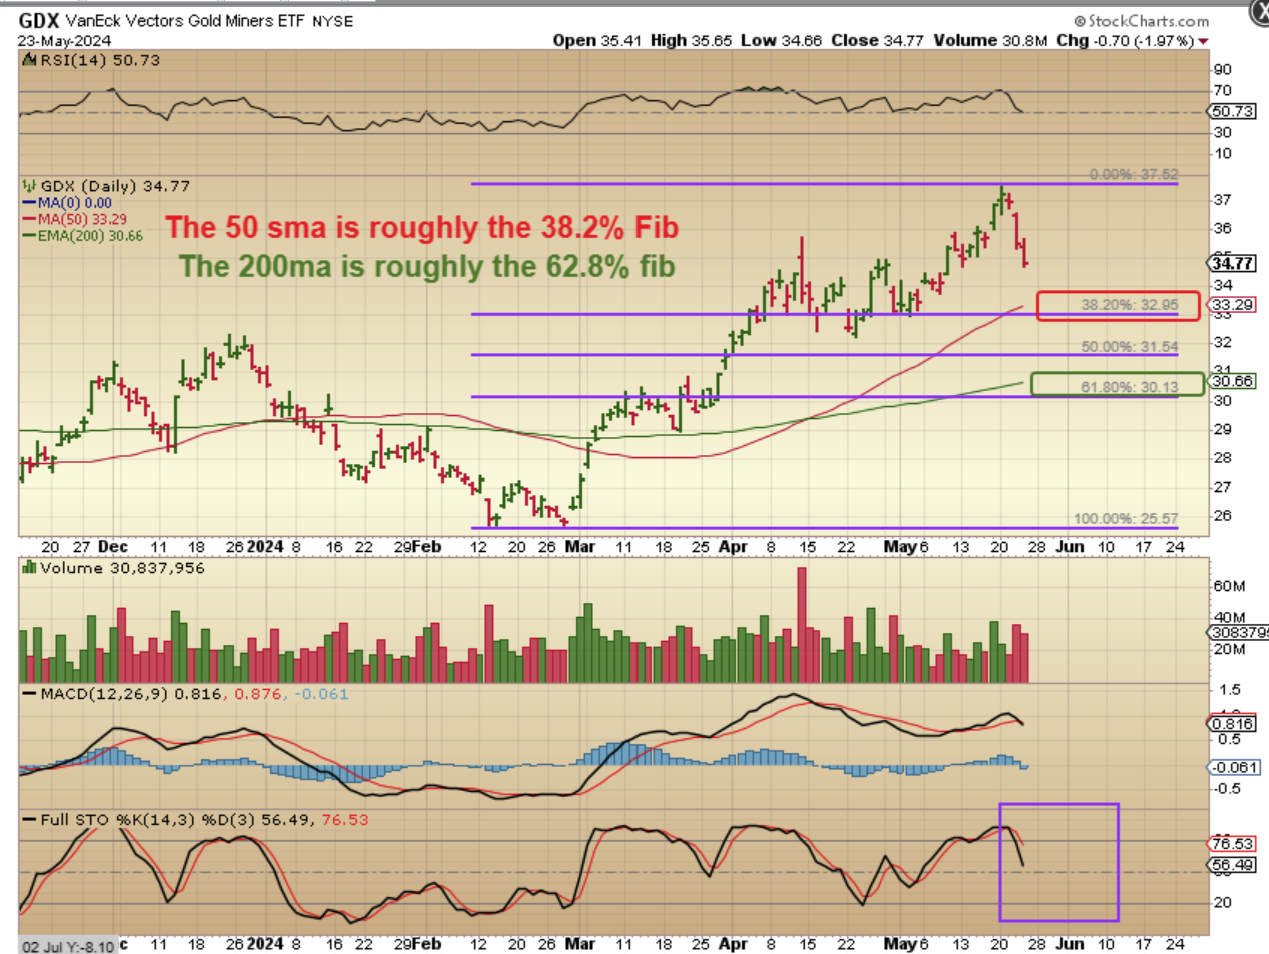
GDX- I want to look at fib levels and a few other ideas as time goes forward too, and this is where the GDX fib levels are, based on the last rally out of the February lows.
.
We have been enjoying some nice rallies in the bullish environment, but now some selling has started to develop and the timing could be right for a pullback. This is Friday before a 3 day weekend in the U.S., so you might want to adjust your portfolio if you haven’t already. For example, if we see a bounce with the precious metals and you are still heavily invested there, this might be a good time to lock in some gains, not knowing what Gold will do Sunday night through Tuesday. I sold my miners already, but I’m still holding a basket of Crypto stocks ( a smaller basket that I want to add to). I have a busy weekend planned, but I’ll still try to get the weekend report out by Sunday evening for those that have the markets open on Monday.
.
Enjoy your Friday trading!
.
~ALEX
.
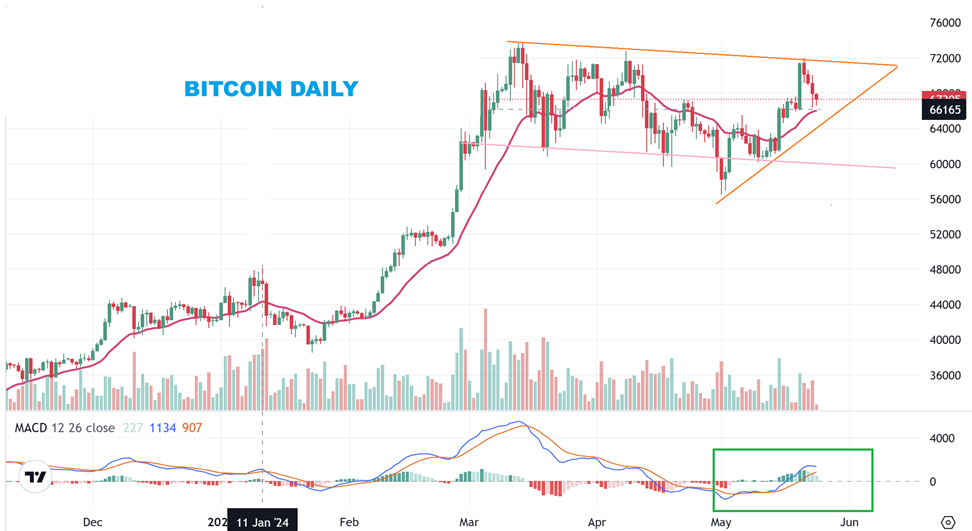
EARLIER IN THE WEEK WE LOOKED AT BITCOIN LIKE THIS: It could break out or pull back and then break out.
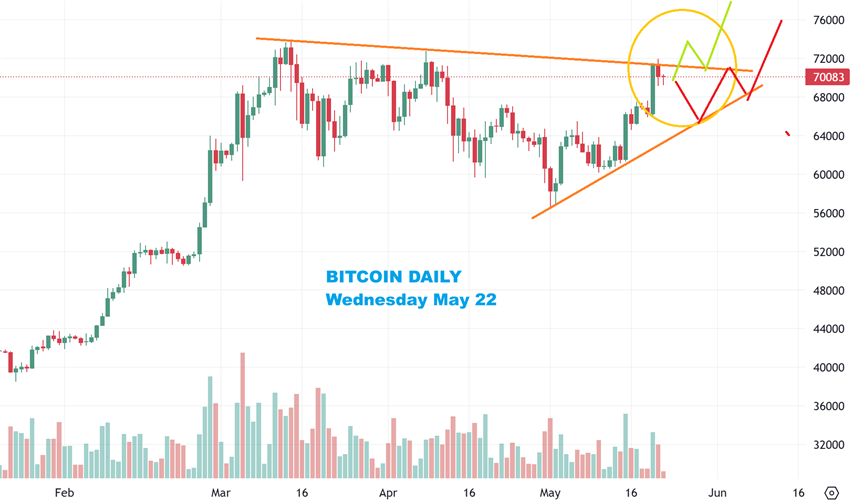
BITCOIN – So far Bitcoin has sold off lower over the last few days. We are still above the 20 ema, which looks to have supported price often in the past, and the MACD is still in a bullish position, so we are just passing time at this point.