Thursday May 23rd – Where Are We?
This report is designed as a review of “Where we are‘ in our various sectors.
.
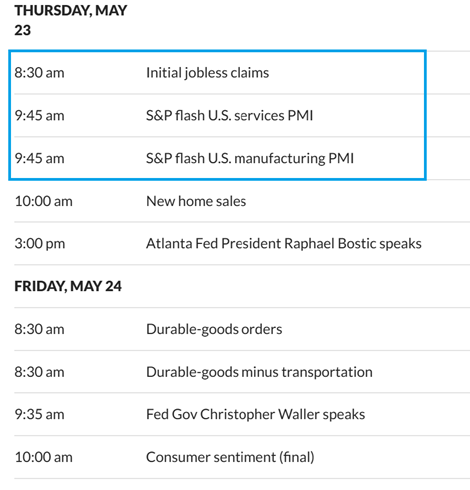
DATA – Todays Jobless Claims Report does usually move the markets, but the direction that it send it is often based on ‘where we are’ in Cycles, so let’s review WHERE WE ARE IN OUR VARIOUS SECTORS.
.
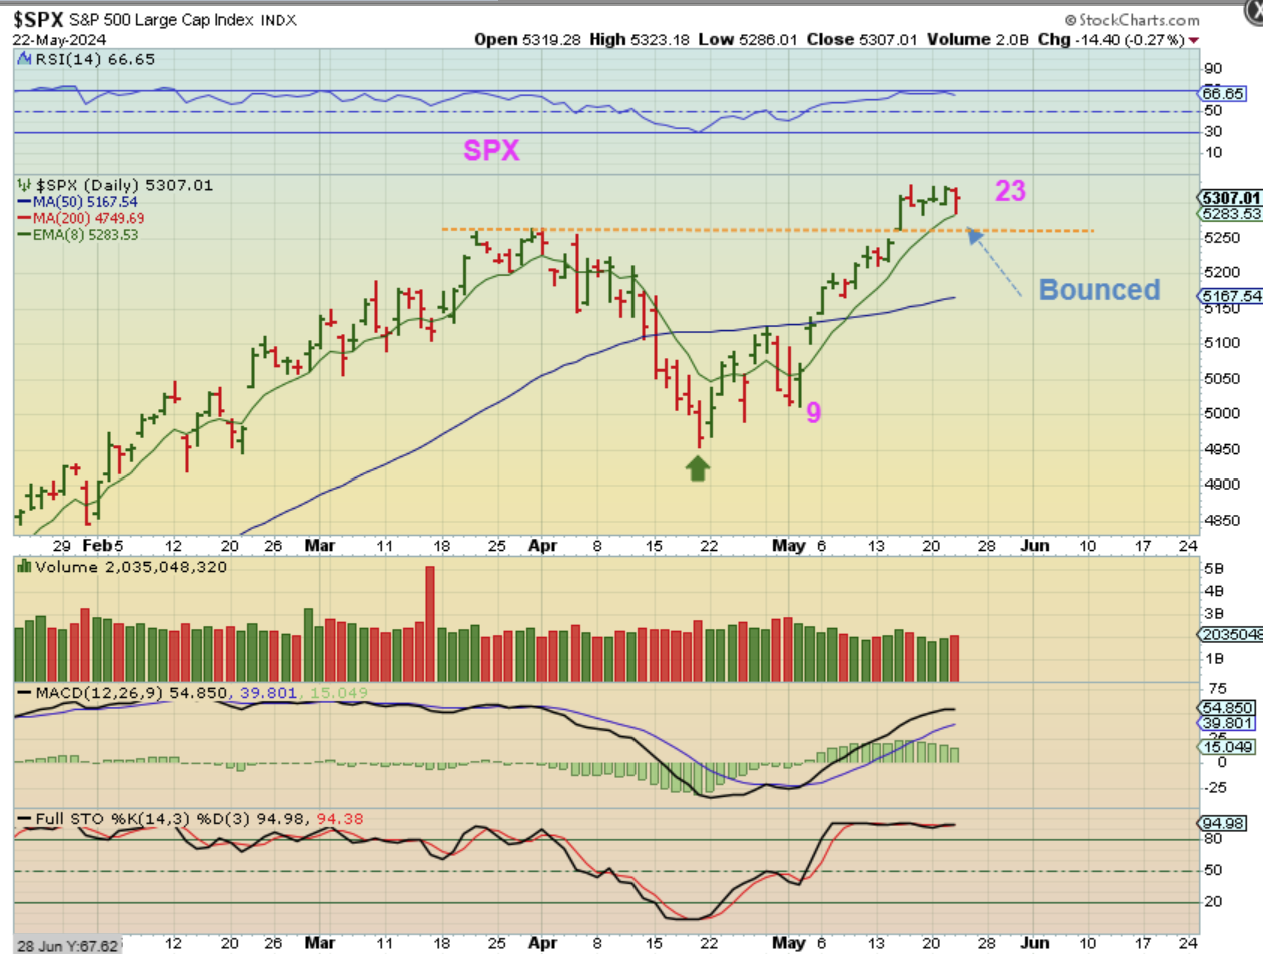
The SPX is in the first daily cycle coming out of an ICL, and we have made it to new all-time highs. Day 23 could see a dip into a half cycle low, but yesterdays dip bounced off of the 8 ema and the selling was short lived. So far we still have buyers.
.
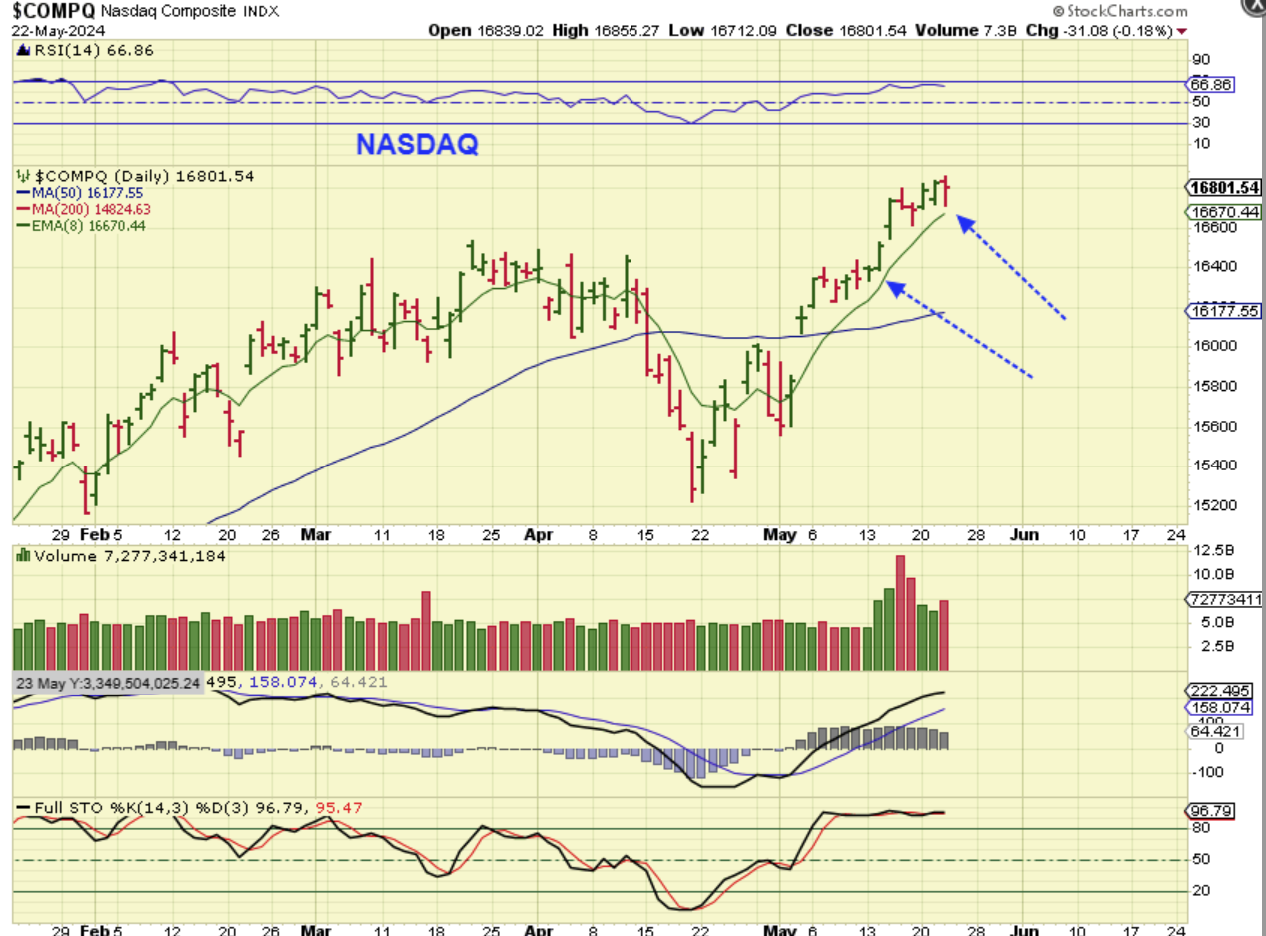
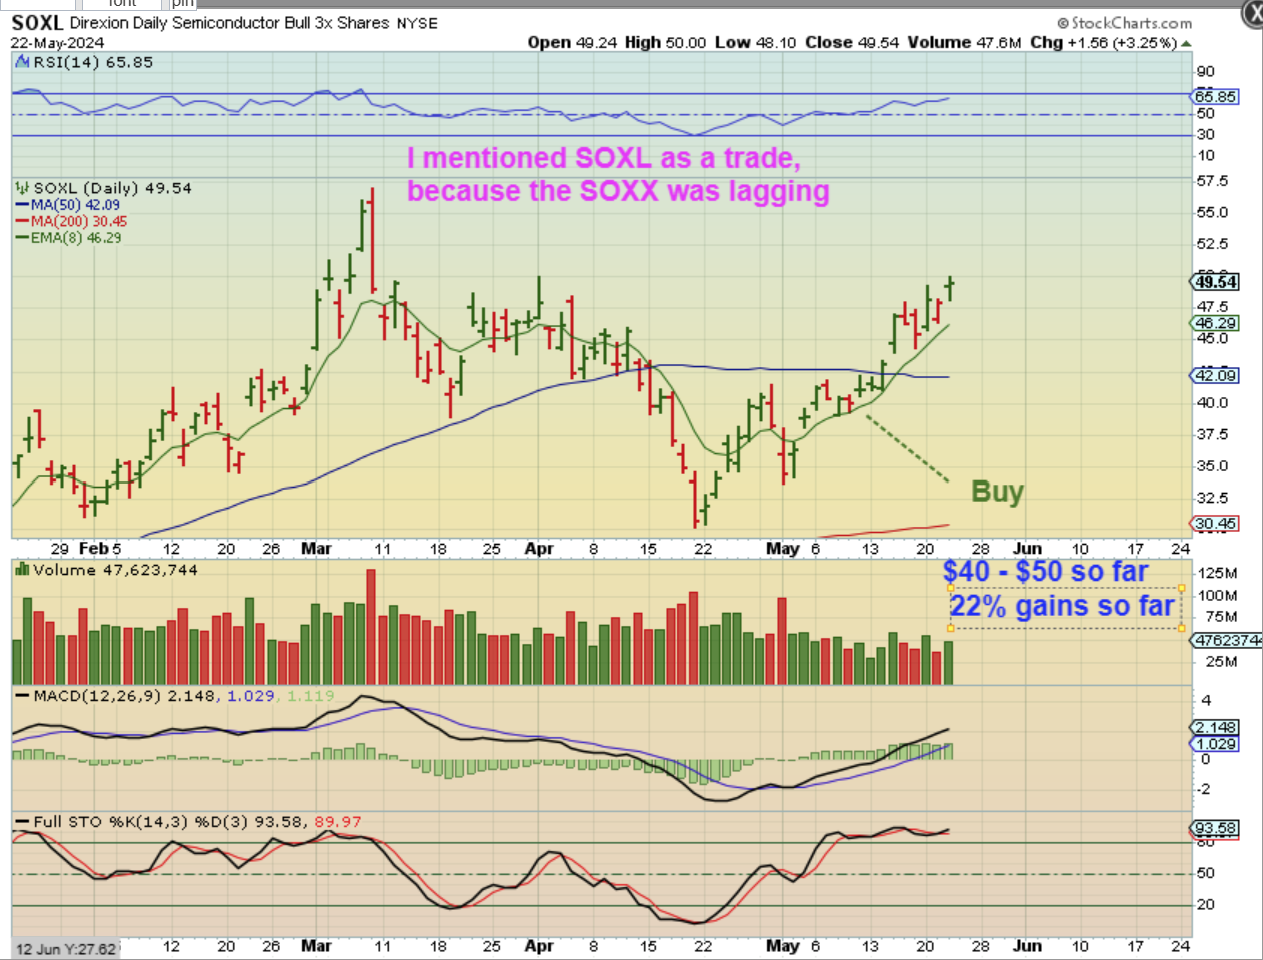
The NASDAQ is also in the First daily cycle out of an ICL, so when it sold off, it also found buyers to push it back up to the highs. Recently I discussed how the SOXX was lagging, but I thought that it would play catch up, so I suggested SOXL as a trade…
.
SOXL – The SOXX actually had a decent day yesterday when it gapped open, dropped to close the gap, but recovered near the highs of the day. Buying the SOXL at the ICL was fine, but it was choppy at the lows. It has now moved up over 22% from the 2nd buy opportunity mentioned about 2 weeks ago. Congrats if you took that trade and raise stops.
.
Now let’s discuss these General Markets and ‘Where we are’.
.
Even in a bear market (& you may recall this from Golds Intermediate Cycles during bear market sell offs), you get 2 good daily cycles out of an ICL, but then it rolls over. Then we look for signs or clues as to the strength of this Bull Run. So we currently have this strong first daily cycle as expected. We will eventually dip into a dcl and then we should have a 2nd daily cycle where we look for signs of strength or weakness. It is noteworthy at this point that…
1. USUALLY, we see the semiconductors lead the move higher, but they are lagging on this run, so I want to keep an eye on that going forward.
2. Next, One of my readers is adamant & concerned that we currently have the ‘Dow Theory’ playing out, and a drop is the result. Yes, I see the Dow Theory pattern too, but the first daily cycle is NOT the time where I would recommend going short. It often takes time for the drop that follows to develop with a Dow Theory sell off and often you’ll see ‘Smart Money’ causing distribution at the top first. They have BIG Accounts and need to sell into the buying, so we often see that as a topping pattern of distribution in the 2nd or 3rd daily cycle (or both). I have explained to our fellow reader that with an ICL, I have to expect at least the first and second daily cycle to be a move higher and not a good time to go short. So far, I have been correct in keeping us long with trailing stops. We raise stops and then by the time the 2nd daily cycle plays out (into the summer) we may start to see a market roll over ( No rate cuts in 2024 may be mentioned again? Who knows). SO THAT IS WHERE I THINK WE ARE IN THE BIGGER PICTURE OF THE GENERAL MARKETS. Yes, they could top with the Dow Theory playing out, but I think we have more time with the 2nd daily cycle.
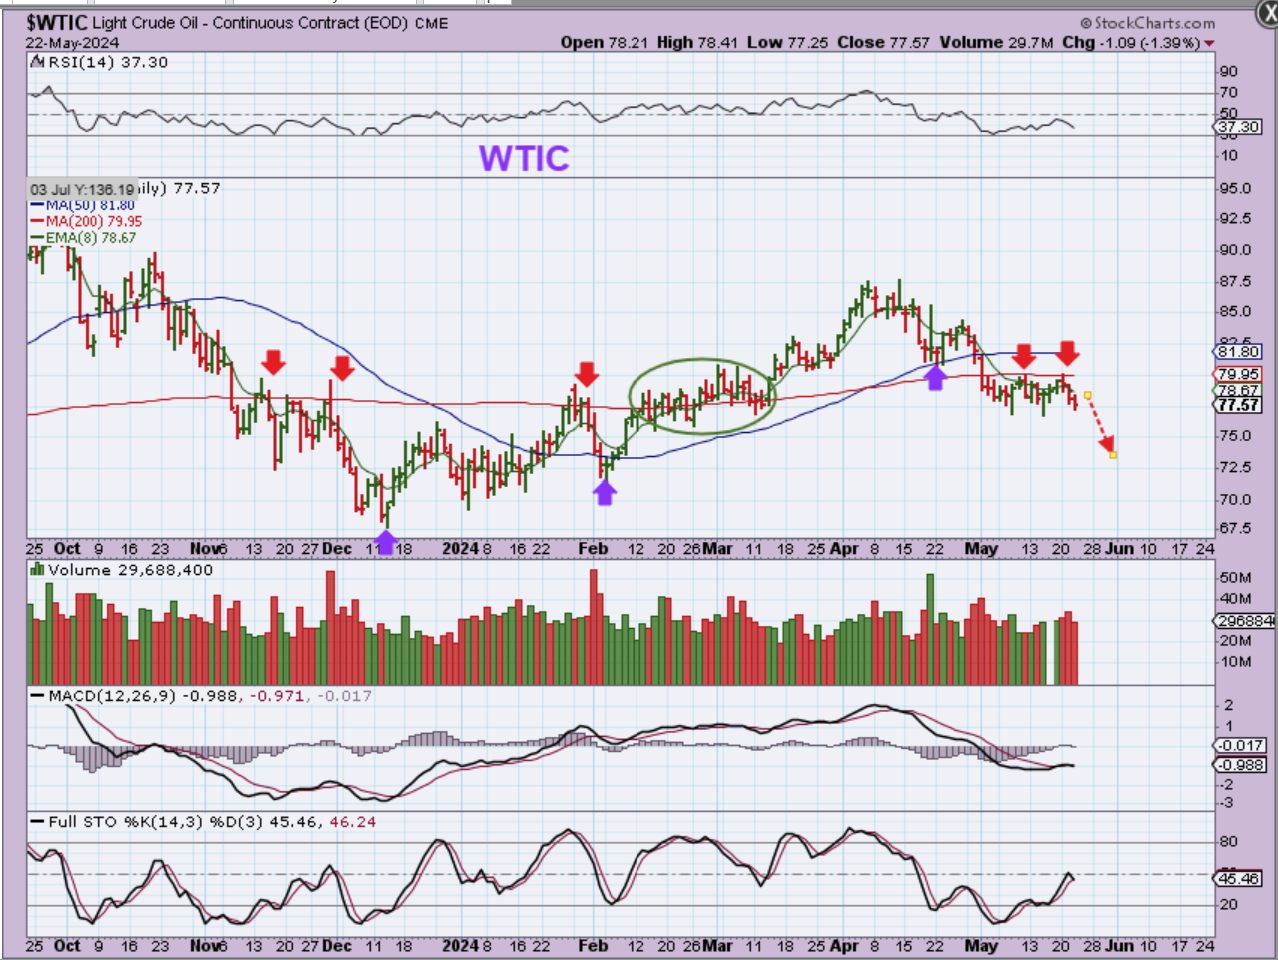
WTIC – Oil had a 1st and a 2nd daily cycle higher out of an ICL, and that 2nd daily cycle looked very strong. It was very right Translated, but when it dropped to the 50sma as a dcl, that 3rd daily cycle peaked very early and rolled over and I’m not sure why that happened so quickly. I see Oil as now being in a weaker 3rd daily cycle and so far it lost the 50 & 200sma and has been stuck under the 200sma. This weaker 3rd daily cycle now gives it a H&S look too, so we expect weakness and a drop into the ICL later in time. That is where I think we are with Oil.
.
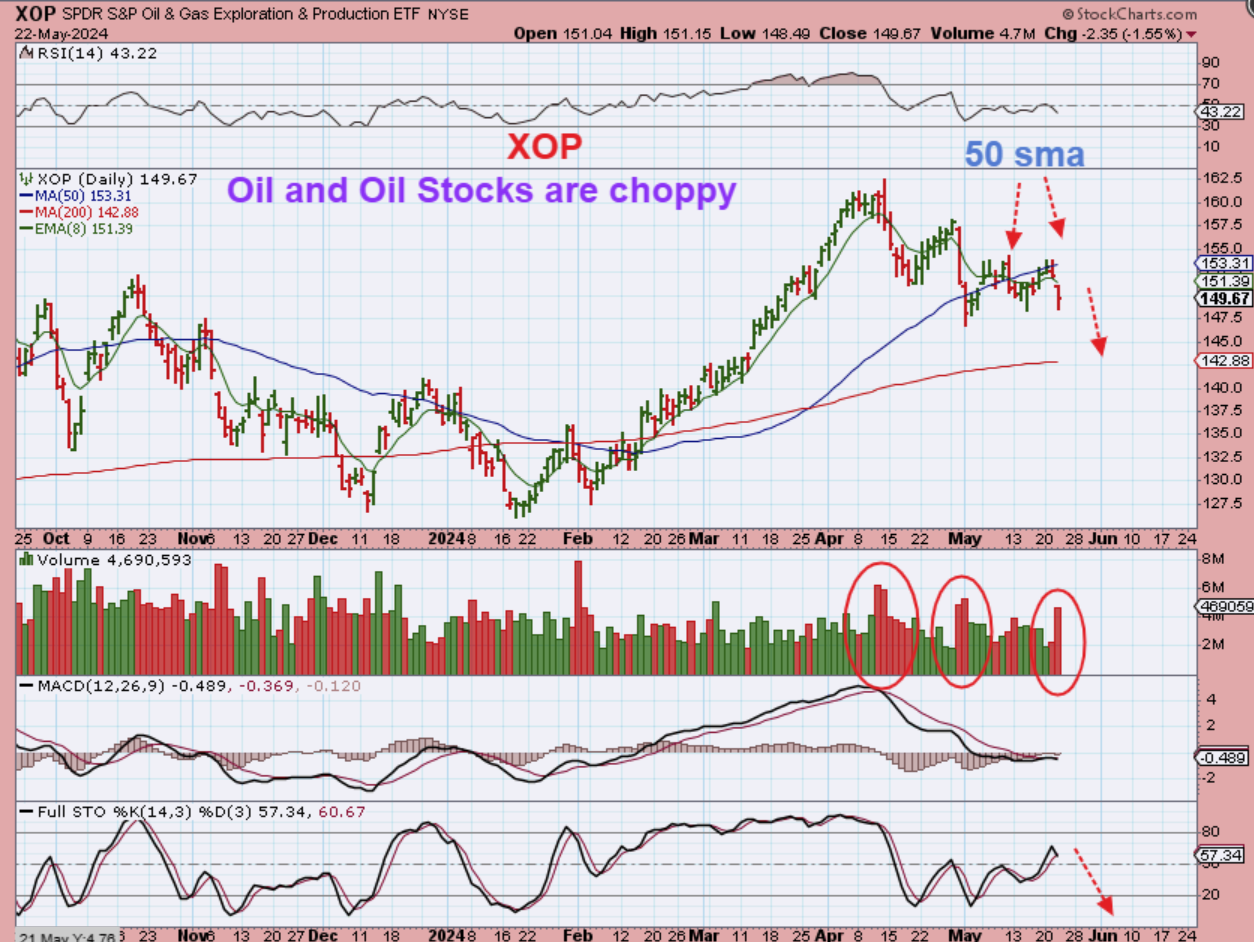
XOP – Oil stocks have been stronger than Oil, but they became choppy and sold off as Oil did too. This gave us a back test of a recent breakout in the big picture charts, but this now looks like it may want to drop to the 200sma, with Oil in a weaker 3rd daily cycle.
.
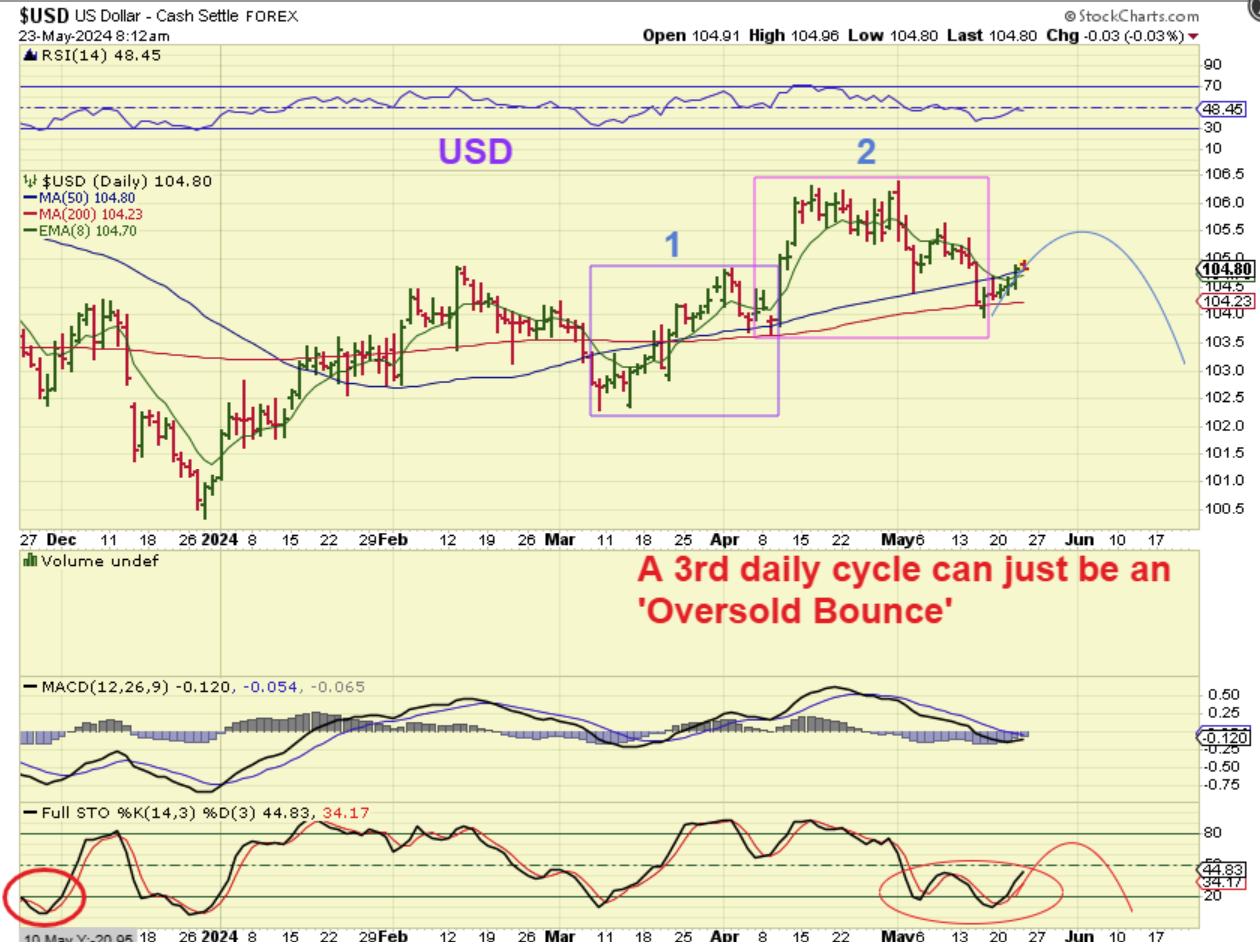
The USD should be in a 3rd daily cycle and again, the first 2 were strong from the ICL, but now we see signs of weakness & the USD appears to be rolling over. The May 1st Fed Mtg Popped the USD for a couple of days, but so far the release of the Fed Minutes yesterday didn’t help it. It is crawling at the 50sma and did manage to close above it though.
.
WHERE IS GOLD?
.
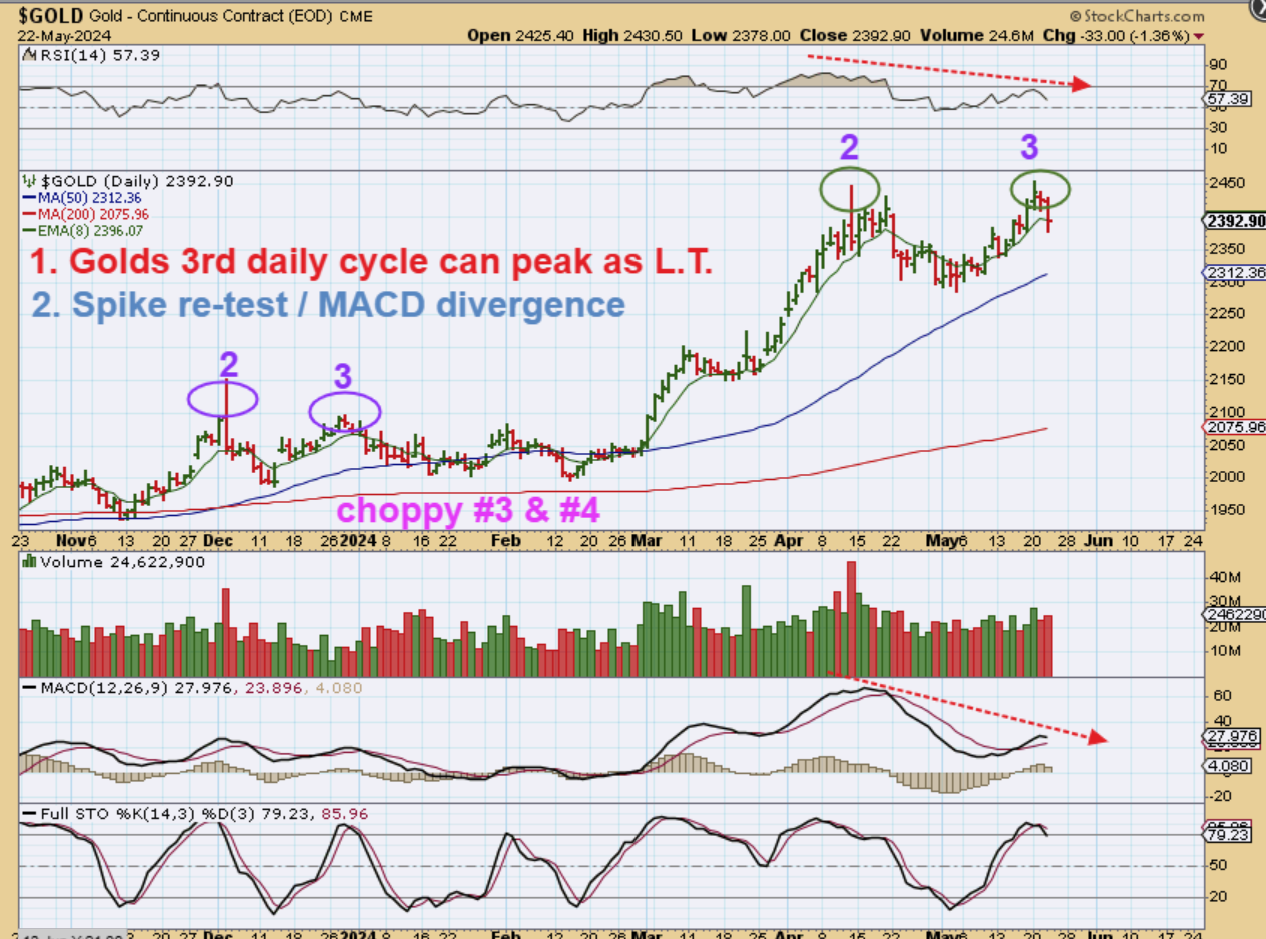
GOLD has so far double topped with divergence at the MACD & RSI. This is the 3rd daily cycle, so while the 1st and 2nd daily cycle were strong, the 3rd is the one that COULD/MAYBE become Left Translated & top by day 13 or so, or it could do a half cycle dip and then peak on day 20+ as right translated. We just don’t know for sure yet…
.
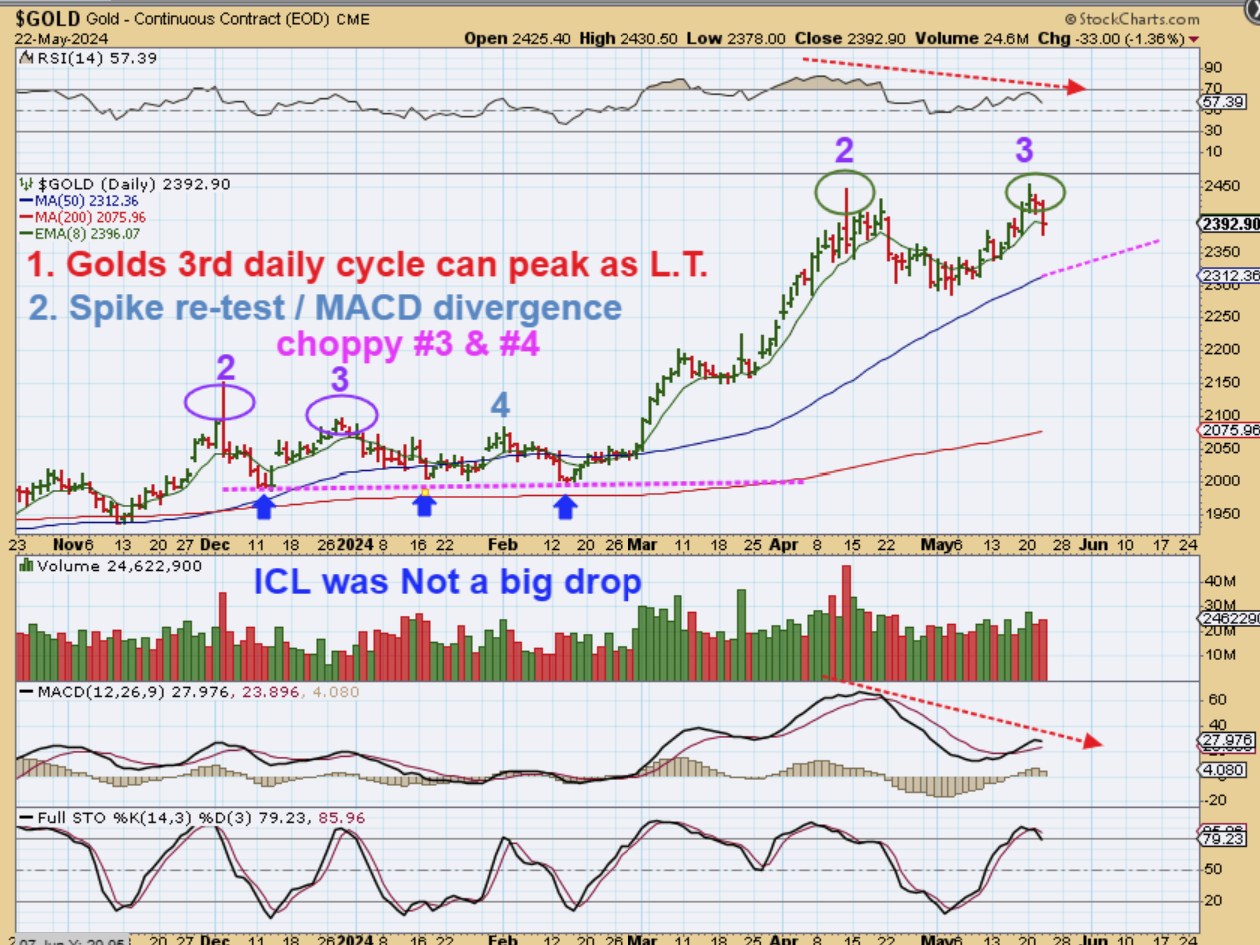
In other words, there is a chance that this test of the spike in the 2nd daily cycle becomes the peak for this Intermediate Cycle, just like the last Intermediate Cycle did. Take a look at how that DID play out with the last Intermediate cycle in December of this chart. Notice that the sell off into the ICL wasn’t a massive drop like Gold used to have, but it was a long boring choppy period of time. Please read this chart.
In fact, GOLDs choppy drop in the 3rd and 4th daily cycles basically tested the 2nd daily cycle low, so it was really just a long period of time of choppiness that frustrated many Gold Bugs. Once the ICL was in place though? Gold surged to new all-time highs.
.
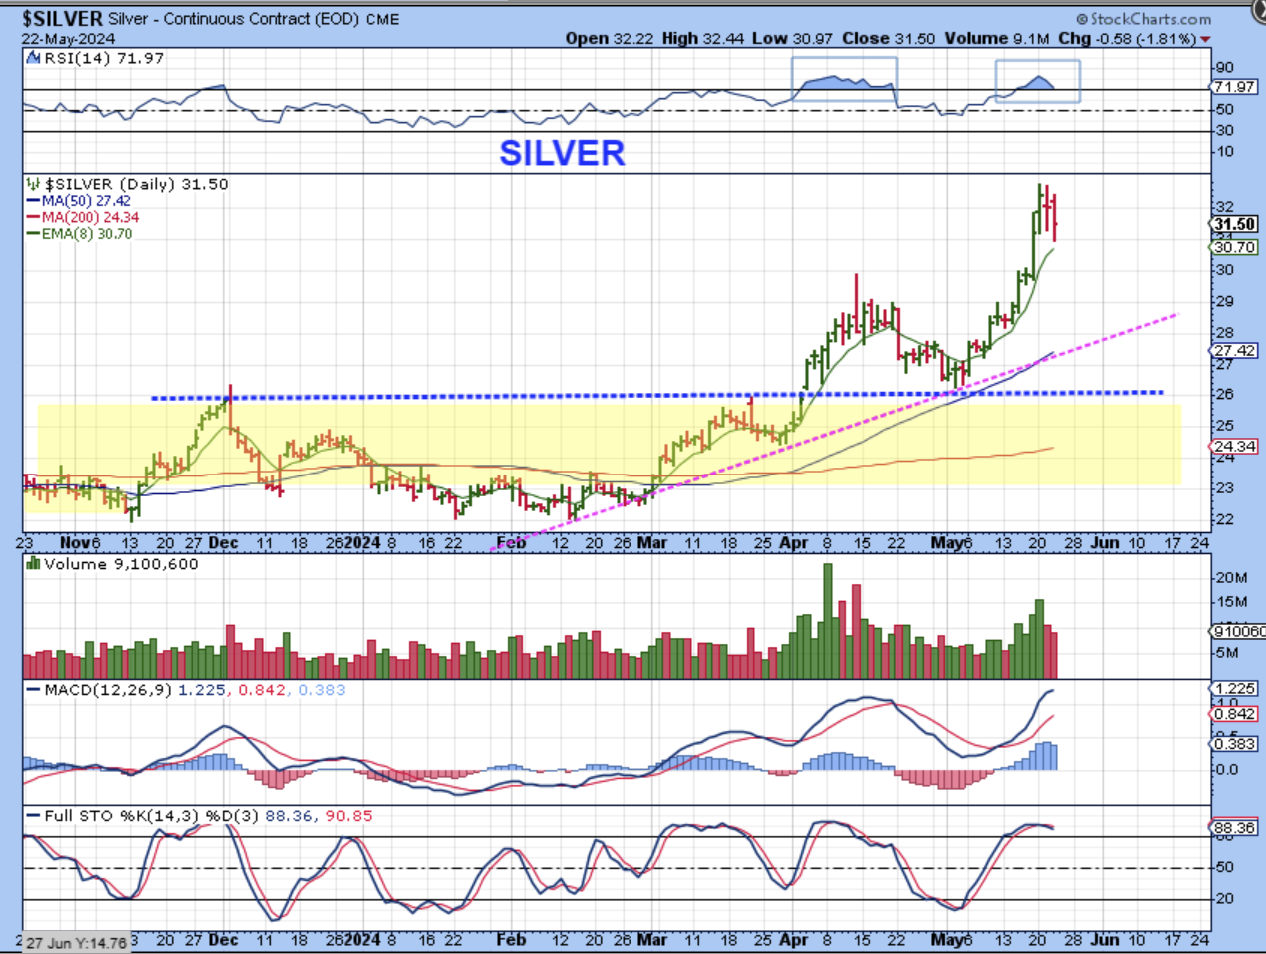
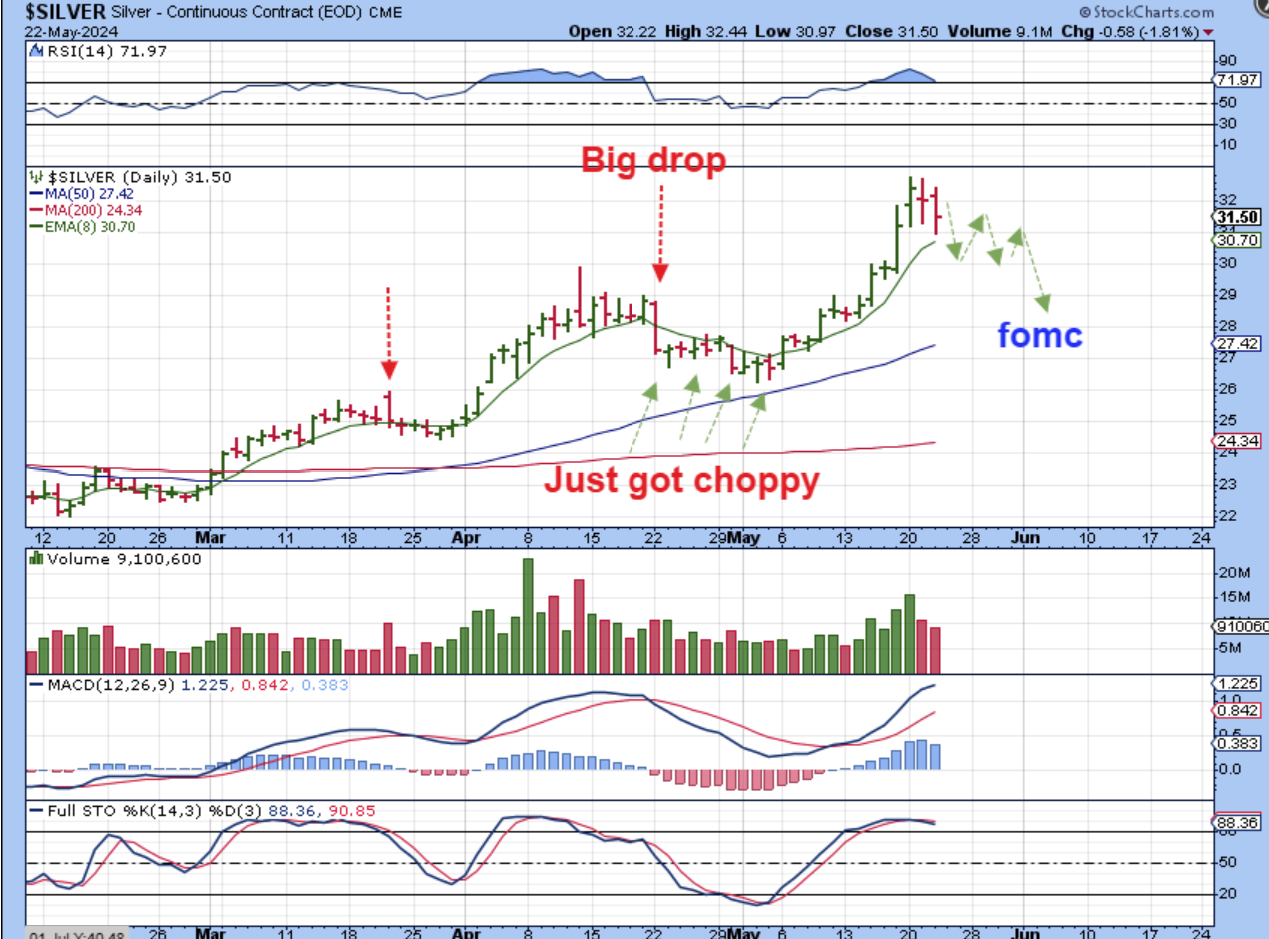
SILVER surged recently as it broke through that key $30 area. We hardly saw a red down day on that rally, but now we see 2 somewhat large red candles. This is day 14 and we have to wonder if Silver peaked and will now chop around and find a dcl over time? Notice that…
.
Notice that when SILVER sold off into the last low, it had a LARGE drop and then the selling was really just choppiness and drops with bounces. We may see something similar unless we only get a half cycle dip and then one more rally to new highs.
.
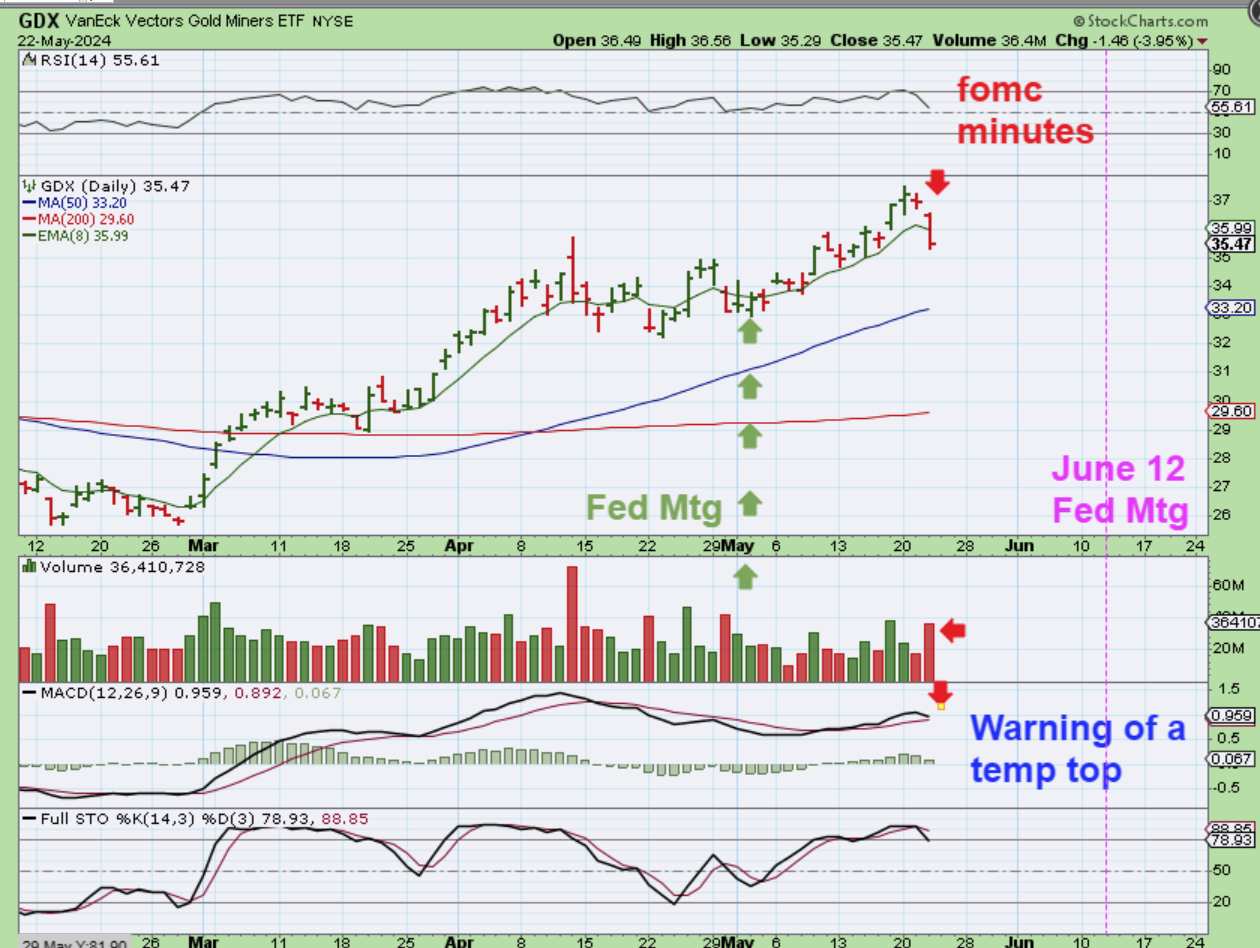
The Miners had a rather large drop yesterday, with the GDX down almost 4%. I have mentioned before that the Miners bottomed before Gold & Silver, so it is very possible that this is a peak for the GDX. It may not sell off steadily, it could just get choppy and dip lower, but my thought is that this MIGHT be the peak for GDX on day 19 from its’ low. This would be day 21.
.
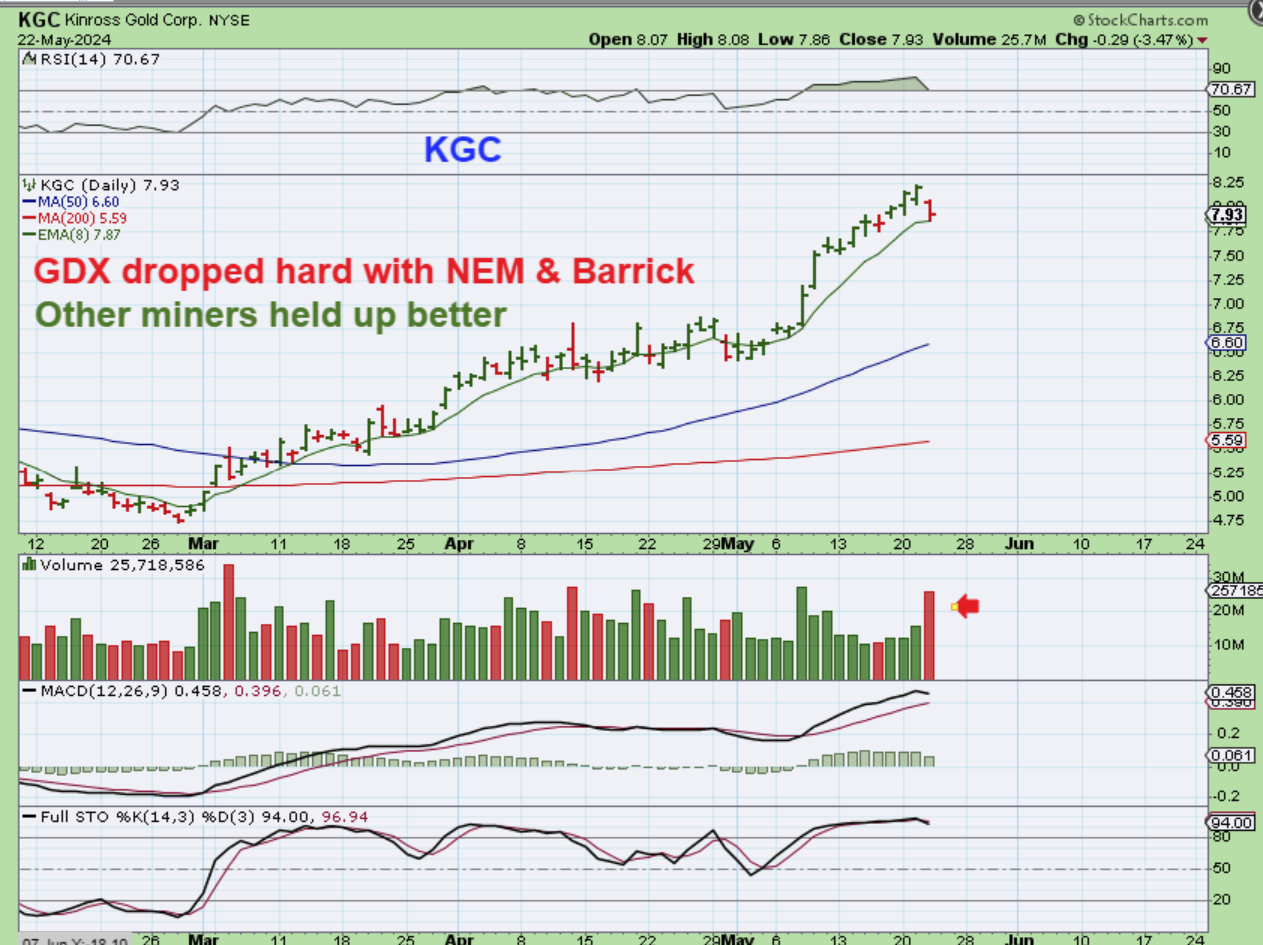
I just wanted to point out that as I scrolled through some charts, NEM & Barrick sold off, so we see that in the GDX, but some other miners like KGC for example, are still up near the highs. These could just chop around at the highs, or they may sell down over time. I say this just in case some wanted to lighten up (sell a portion / ride a portion) or just lock in gains and wait for the next low.
.
What kind of reaction will the markets have to the jobless Claims? So far, it is often a bullish rection for the General Markets, and we did see the SPX , NASDAQ, and SOXX bounce back after the Fed Minutes yesterday. We are now also at the day after the release of those Fed Minutes, and our Precious Metals Sector did not really bounce back after the release at 2 p.m. yesterday, instead some of the Miners continued to drop into the close. That seems odd, because if you’ll remember, the Fed Mtg in early May is where Gold & Silver bottomed. Will we see follow through selling or just a half cycle dip? We just have to wait and see what Thursday brings. 8:30 a.m. ET is the release of the Jobless Claims Numbers. Enjoy your Wednesday trading.
.
~ALEX
.
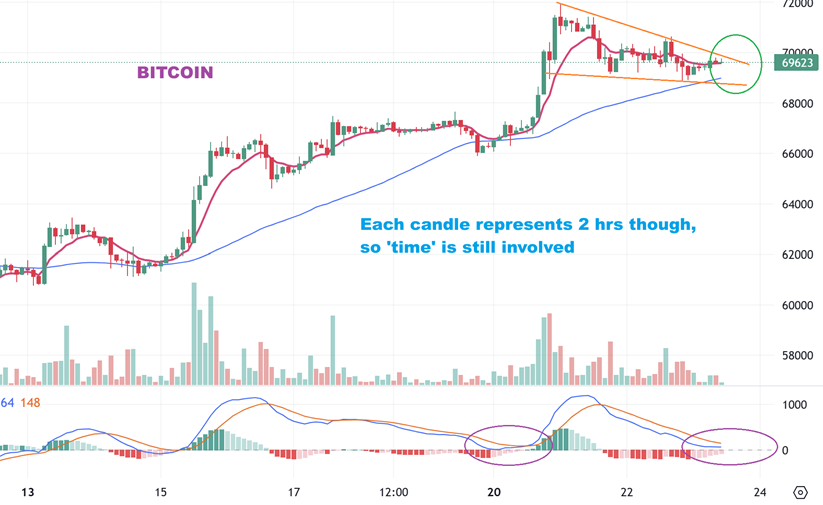
YESTERDAY WE LOOKED AT BITCOIN LIKE THIS: It could break out or pull back and then break out. I said…
.
Bitcoin has reached what could be an overhead trendline. It stalled there, so now price could realistically move anywhere inside of the circle that I have drawn. That means that
1. Bitcoin could drop and then breakout, or
2. Bitcoin could just surge higher from here too.
3. Both ideas are drawn below.
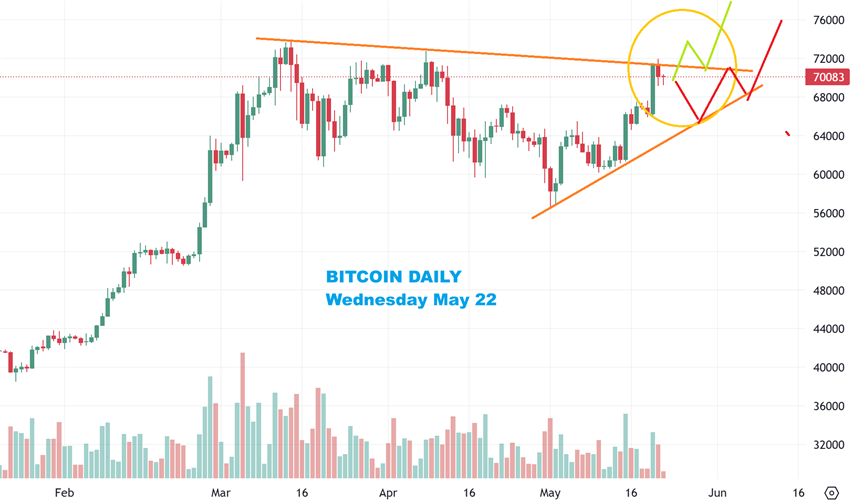
Today I’ll show you the 2 hr chart.
.
I don’t know if this will play out or not, but this is a bullish set up as a descending wedge. Since it is found on the 2 hr chart and we still have ‘time’ available in the Apex, it could take several more hours to play out. In other words, this could drop for a couple of hours to the lower moving average, or it could crawl and break out, but it does look bullish over time.